Cities with the Highest Percentage of Households Heated by Electricity in Massachusetts
RELATED REPORTS & OPTIONS
Electrical Heating
Massachusetts
Compare Cities
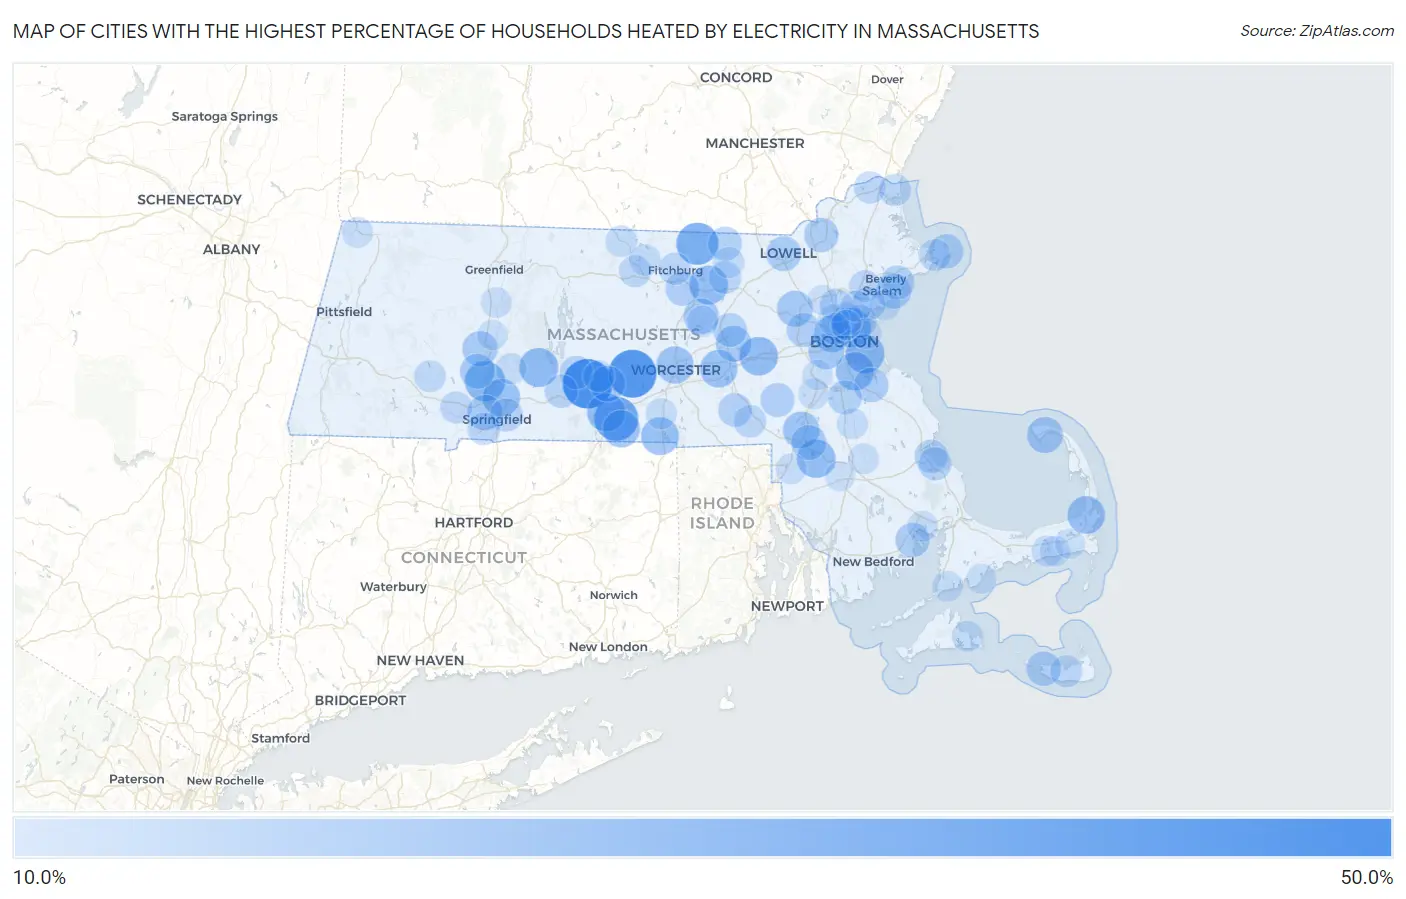
Map of Cities with the Highest Percentage of Households Heated by Electricity in Massachusetts
0.0%
50.0%
Cities with the Highest Percentage of Households Heated by Electricity in Massachusetts
| City | Electrical Heating | vs State | vs National | |
| 1. | Warren | 48.1% | 17.2%(+30.9)#1 | 40.2%(+7.90)#9,625 |
| 2. | Spencer | 45.2% | 17.2%(+28.0)#2 | 40.2%(+5.00)#10,396 |
| 3. | Sturbridge | 38.6% | 17.2%(+21.4)#3 | 40.2%(-1.60)#12,219 |
| 4. | Townsend | 35.3% | 17.2%(+18.1)#4 | 40.2%(-4.90)#13,180 |
| 5. | Amherst | 32.9% | 17.2%(+15.7)#5 | 40.2%(-7.30)#13,975 |
| 6. | Holyoke | 32.0% | 17.2%(+14.8)#6 | 40.2%(-8.20)#14,278 |
| 7. | Chelsea | 30.4% | 17.2%(+13.2)#7 | 40.2%(-9.80)#14,835 |
| 8. | Belchertown | 30.0% | 17.2%(+12.8)#8 | 40.2%(-10.2)#14,988 |
| 9. | Boston | 29.8% | 17.2%(+12.6)#9 | 40.2%(-10.4)#15,059 |
| 10. | Framingham | 29.1% | 17.2%(+11.9)#10 | 40.2%(-11.1)#15,340 |
| 11. | Shirley | 29.1% | 17.2%(+11.9)#11 | 40.2%(-11.1)#15,358 |
| 12. | Norton Center | 29.0% | 17.2%(+11.8)#12 | 40.2%(-11.2)#15,392 |
| 13. | Fiskdale | 28.8% | 17.2%(+11.6)#13 | 40.2%(-11.4)#15,464 |
| 14. | Quincy | 28.5% | 17.2%(+11.3)#14 | 40.2%(-11.7)#15,574 |
| 15. | Webster | 27.9% | 17.2%(+10.7)#15 | 40.2%(-12.3)#15,774 |
| 16. | Orleans | 27.7% | 17.2%(+10.5)#16 | 40.2%(-12.5)#15,848 |
| 17. | Chicopee | 27.4% | 17.2%(+10.2)#17 | 40.2%(-12.8)#15,942 |
| 18. | Westborough | 27.2% | 17.2%(+10.0)#18 | 40.2%(-13.0)#16,035 |
| 19. | Worcester | 26.8% | 17.2%(+9.60)#19 | 40.2%(-13.4)#16,165 |
| 20. | Southbridge Town | 26.7% | 17.2%(+9.50)#20 | 40.2%(-13.5)#16,217 |
| 21. | Cambridge | 26.3% | 17.2%(+9.10)#21 | 40.2%(-13.9)#16,370 |
| 22. | Foxborough | 25.9% | 17.2%(+8.70)#22 | 40.2%(-14.3)#16,535 |
| 23. | North Attleborough | 25.3% | 17.2%(+8.10)#23 | 40.2%(-14.9)#16,781 |
| 24. | Provincetown | 24.9% | 17.2%(+7.70)#24 | 40.2%(-15.3)#17,012 |
| 25. | Hanscom Afb | 24.6% | 17.2%(+7.40)#25 | 40.2%(-15.6)#17,128 |
| 26. | Brookline | 24.5% | 17.2%(+7.30)#26 | 40.2%(-15.7)#17,161 |
| 27. | Brookfield | 24.3% | 17.2%(+7.10)#27 | 40.2%(-15.9)#17,273 |
| 28. | Marlborough | 24.2% | 17.2%(+7.00)#28 | 40.2%(-16.0)#17,294 |
| 29. | South Lancaster | 24.0% | 17.2%(+6.80)#29 | 40.2%(-16.2)#17,378 |
| 30. | West Springfield Town | 23.9% | 17.2%(+6.70)#30 | 40.2%(-16.3)#17,404 |
| 31. | Northampton | 23.5% | 17.2%(+6.30)#31 | 40.2%(-16.7)#17,579 |
| 32. | Mansfield Center | 23.4% | 17.2%(+6.20)#32 | 40.2%(-16.8)#17,641 |
| 33. | Easthampton Town | 23.0% | 17.2%(+5.80)#33 | 40.2%(-17.2)#17,841 |
| 34. | Lowell | 22.9% | 17.2%(+5.70)#34 | 40.2%(-17.3)#17,873 |
| 35. | Salem | 22.8% | 17.2%(+5.60)#35 | 40.2%(-17.4)#17,929 |
| 36. | Rockport | 22.4% | 17.2%(+5.20)#36 | 40.2%(-17.8)#18,124 |
| 37. | Weymouth Town | 22.3% | 17.2%(+5.10)#37 | 40.2%(-17.9)#18,156 |
| 38. | Madaket | 22.3% | 17.2%(+5.10)#38 | 40.2%(-17.9)#18,195 |
| 39. | Lawrence | 22.1% | 17.2%(+4.90)#39 | 40.2%(-18.1)#18,260 |
| 40. | Marion Center | 22.0% | 17.2%(+4.80)#40 | 40.2%(-18.2)#18,342 |
| 41. | Waltham | 21.7% | 17.2%(+4.50)#41 | 40.2%(-18.5)#18,469 |
| 42. | Leominster | 21.5% | 17.2%(+4.30)#42 | 40.2%(-18.7)#18,599 |
| 43. | Millis Clicquot | 21.4% | 17.2%(+4.20)#43 | 40.2%(-18.8)#18,669 |
| 44. | Beverly | 21.3% | 17.2%(+4.10)#44 | 40.2%(-18.9)#18,715 |
| 45. | Pepperell | 21.3% | 17.2%(+4.10)#45 | 40.2%(-18.9)#18,732 |
| 46. | Randolph Town | 21.2% | 17.2%(+4.00)#46 | 40.2%(-19.0)#18,764 |
| 47. | Hudson | 21.1% | 17.2%(+3.90)#47 | 40.2%(-19.1)#18,824 |
| 48. | Hopedale | 20.6% | 17.2%(+3.40)#48 | 40.2%(-19.6)#19,106 |
| 49. | Ware | 20.5% | 17.2%(+3.30)#49 | 40.2%(-19.7)#19,158 |
| 50. | North Plymouth | 20.3% | 17.2%(+3.10)#50 | 40.2%(-19.9)#19,278 |
| 51. | Palmer Town | 20.1% | 17.2%(+2.90)#51 | 40.2%(-20.1)#19,386 |
| 52. | Plymouth | 20.1% | 17.2%(+2.90)#52 | 40.2%(-20.1)#19,388 |
| 53. | Lynn | 20.0% | 17.2%(+2.80)#53 | 40.2%(-20.2)#19,421 |
| 54. | Springfield | 19.9% | 17.2%(+2.70)#54 | 40.2%(-20.3)#19,507 |
| 55. | Revere | 19.9% | 17.2%(+2.70)#55 | 40.2%(-20.3)#19,509 |
| 56. | Malden | 19.6% | 17.2%(+2.40)#56 | 40.2%(-20.6)#19,641 |
| 57. | Stoneham | 19.5% | 17.2%(+2.30)#57 | 40.2%(-20.7)#19,696 |
| 58. | Ayer | 19.1% | 17.2%(+1.90)#58 | 40.2%(-21.1)#19,915 |
| 59. | Agawam Town | 18.8% | 17.2%(+1.60)#59 | 40.2%(-21.4)#20,050 |
| 60. | Bellingham | 18.8% | 17.2%(+1.60)#60 | 40.2%(-21.4)#20,056 |
| 61. | Fitchburg | 18.5% | 17.2%(+1.30)#61 | 40.2%(-21.7)#20,236 |
| 62. | Nantucket | 18.5% | 17.2%(+1.30)#62 | 40.2%(-21.7)#20,245 |
| 63. | Salisbury | 18.5% | 17.2%(+1.30)#63 | 40.2%(-21.7)#20,253 |
| 64. | Amesbury Town | 18.3% | 17.2%(+1.10)#64 | 40.2%(-21.9)#20,370 |
| 65. | Gloucester | 18.2% | 17.2%(+1.00)#65 | 40.2%(-22.0)#20,417 |
| 66. | Gardner | 18.2% | 17.2%(+1.00)#66 | 40.2%(-22.0)#20,418 |
| 67. | Peabody | 18.1% | 17.2%(+0.900)#67 | 40.2%(-22.1)#20,499 |
| 68. | Westfield | 18.1% | 17.2%(+0.900)#68 | 40.2%(-22.1)#20,500 |
| 69. | Somerville | 18.0% | 17.2%(+0.800)#69 | 40.2%(-22.2)#20,549 |
| 70. | Huntington | 17.5% | 17.2%(+0.300)#70 | 40.2%(-22.7)#20,851 |
| 71. | Greenfield | 17.4% | 17.2%(+0.200)#71 | 40.2%(-22.8)#20,881 |
| 72. | Medford | 17.3% | 17.2%(+0.100)#72 | 40.2%(-22.9)#20,934 |
| 73. | Winchendon | 17.3% | 17.2%(+0.100)#73 | 40.2%(-22.9)#20,948 |
| 74. | West Brookfield | 17.2% | 17.2%(=0.000)#74 | 40.2%(-23.0)#21,012 |
| 75. | South Ashburnham | 17.2% | 17.2%(=0.000)#75 | 40.2%(-23.0)#21,020 |
| 76. | Clinton | 16.9% | 17.2%(-0.300)#76 | 40.2%(-23.3)#21,171 |
| 77. | West Dennis | 16.9% | 17.2%(-0.300)#77 | 40.2%(-23.3)#21,182 |
| 78. | Saugus | 16.8% | 17.2%(-0.400)#78 | 40.2%(-23.4)#21,212 |
| 79. | Oxford | 16.8% | 17.2%(-0.400)#79 | 40.2%(-23.4)#21,220 |
| 80. | Groton | 16.5% | 17.2%(-0.700)#80 | 40.2%(-23.7)#21,415 |
| 81. | Brockton | 16.4% | 17.2%(-0.800)#81 | 40.2%(-23.8)#21,448 |
| 82. | Edgartown | 16.4% | 17.2%(-0.800)#82 | 40.2%(-23.8)#21,494 |
| 83. | Bridgewater Town | 16.2% | 17.2%(-1.000)#83 | 40.2%(-24.0)#21,567 |
| 84. | Granby | 16.2% | 17.2%(-1.000)#84 | 40.2%(-24.0)#21,599 |
| 85. | Attleboro | 16.1% | 17.2%(-1.10)#85 | 40.2%(-24.1)#21,625 |
| 86. | Norwood | 16.1% | 17.2%(-1.10)#86 | 40.2%(-24.1)#21,626 |
| 87. | Williamstown | 16.1% | 17.2%(-1.10)#87 | 40.2%(-24.1)#21,637 |
| 88. | Falmouth | 16.1% | 17.2%(-1.10)#88 | 40.2%(-24.1)#21,638 |
| 89. | Wareham Center | 16.1% | 17.2%(-1.10)#89 | 40.2%(-24.1)#21,641 |
| 90. | South Deerfield | 16.1% | 17.2%(-1.10)#90 | 40.2%(-24.1)#21,645 |
| 91. | Winthrop Town | 16.0% | 17.2%(-1.20)#91 | 40.2%(-24.2)#21,674 |
| 92. | Swampscott | 16.0% | 17.2%(-1.20)#92 | 40.2%(-24.2)#21,676 |
| 93. | Dennis Port | 15.8% | 17.2%(-1.40)#93 | 40.2%(-24.4)#21,802 |
| 94. | Hatfield | 15.5% | 17.2%(-1.70)#94 | 40.2%(-24.7)#21,965 |
| 95. | Dedham | 15.3% | 17.2%(-1.90)#95 | 40.2%(-24.9)#22,070 |
| 96. | Popponesset | 15.3% | 17.2%(-1.90)#96 | 40.2%(-24.9)#22,125 |
| 97. | Taunton | 15.1% | 17.2%(-2.10)#97 | 40.2%(-25.1)#22,217 |
| 98. | Everett | 15.1% | 17.2%(-2.10)#98 | 40.2%(-25.1)#22,219 |
| 99. | Harwich Center | 15.1% | 17.2%(-2.10)#99 | 40.2%(-25.1)#22,251 |
| 100. | Woburn | 15.0% | 17.2%(-2.20)#100 | 40.2%(-25.2)#22,272 |
Common Questions
What are the Top 10 Cities with the Highest Percentage of Households Heated by Electricity in Massachusetts?
Top 10 Cities with the Highest Percentage of Households Heated by Electricity in Massachusetts are:
#1
48.1%
#2
45.2%
#3
38.6%
#4
35.3%
#5
32.0%
#6
30.4%
#7
30.0%
#8
29.8%
#9
29.1%
#10
29.1%
What city has the Highest Percentage of Households Heated by Electricity in Massachusetts?
Warren has the Highest Percentage of Households Heated by Electricity in Massachusetts with 48.1%.
What is the Percentage of Households Heated by Electricity in the State of Massachusetts?
Percentage of Households Heated by Electricity in Massachusetts is 17.2%.
What is the Percentage of Households Heated by Electricity in the United States?
Percentage of Households Heated by Electricity in the United States is 40.2%.