Pittsfield, MA Map & Demographics
Pittsfield Map
Pittsfield Overview
$42,303
PER CAPITA INCOME
$85,314
AVG FAMILY INCOME
$66,859
AVG HOUSEHOLD INCOME
22.7%
WAGE / INCOME GAP [ % ]
77.3¢/ $1
WAGE / INCOME GAP [ $ ]
$9,719
FAMILY INCOME DEFICIT
0.48
INEQUALITY / GINI INDEX
43,730
TOTAL POPULATION
21,720
MALE POPULATION
22,010
FEMALE POPULATION
98.68
MALES / 100 FEMALES
101.34
FEMALES / 100 MALES
43.4
MEDIAN AGE
2.9
AVG FAMILY SIZE
2.2
AVG HOUSEHOLD SIZE
23,639
LABOR FORCE [ PEOPLE ]
64.6%
PERCENT IN LABOR FORCE
7.1%
UNEMPLOYMENT RATE
Pittsfield Zip Codes
Pittsfield Area Codes
Income in Pittsfield
Income Overview in Pittsfield
Per Capita Income in Pittsfield is $42,303, while median incomes of families and households are $85,314 and $66,859 respectively.
| Characteristic | Number | Measure |
| Per Capita Income | 43,730 | $42,303 |
| Median Family Income | 11,007 | $85,314 |
| Mean Family Income | 11,007 | $117,377 |
| Median Household Income | 19,237 | $66,859 |
| Mean Household Income | 19,237 | $91,402 |
| Income Deficit | 11,007 | $9,719 |
| Wage / Income Gap (%) | 43,730 | 22.66% |
| Wage / Income Gap ($) | 43,730 | 77.34¢ per $1 |
| Gini / Inequality Index | 43,730 | 0.48 |
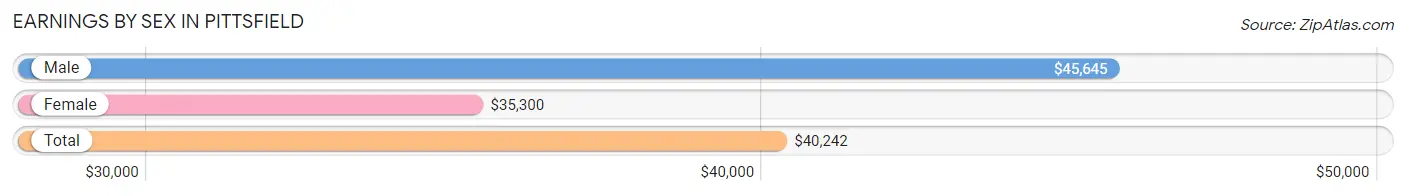
Earnings by Sex in Pittsfield
Average Earnings in Pittsfield are $40,242, $45,645 for men and $35,300 for women, a difference of 22.7%.
| Sex | Number | Average Earnings |
| Male | 12,321 (50.4%) | $45,645 |
| Female | 12,139 (49.6%) | $35,300 |
| Total | 24,460 (100.0%) | $40,242 |
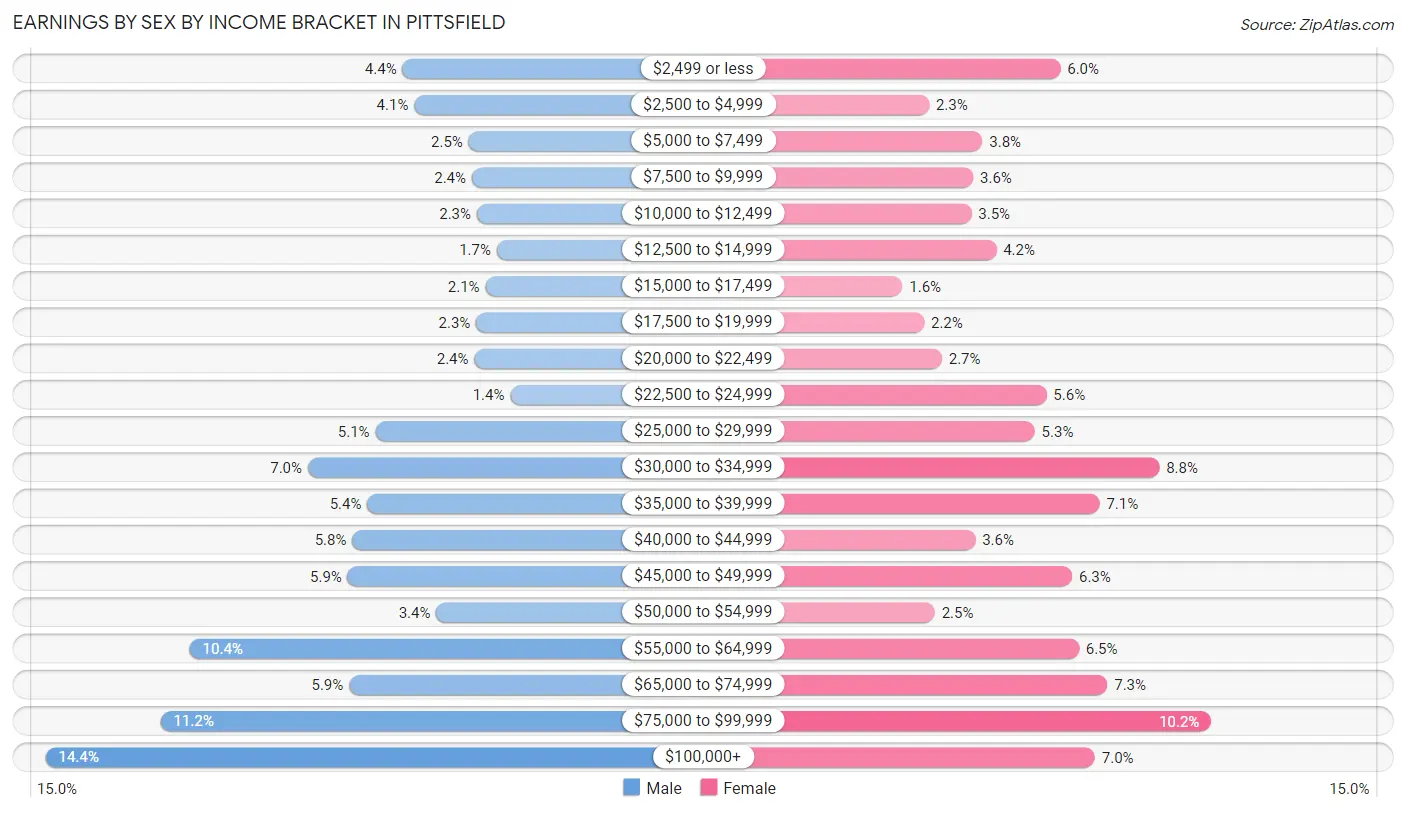
Earnings by Sex by Income Bracket in Pittsfield
The most common earnings brackets in Pittsfield are $100,000+ for men (1,775 | 14.4%) and $75,000 to $99,999 for women (1,243 | 10.2%).
| Income | Male | Female |
| $2,499 or less | 540 (4.4%) | 728 (6.0%) |
| $2,500 to $4,999 | 499 (4.1%) | 280 (2.3%) |
| $5,000 to $7,499 | 310 (2.5%) | 462 (3.8%) |
| $7,500 to $9,999 | 300 (2.4%) | 431 (3.5%) |
| $10,000 to $12,499 | 282 (2.3%) | 425 (3.5%) |
| $12,500 to $14,999 | 213 (1.7%) | 510 (4.2%) |
| $15,000 to $17,499 | 253 (2.1%) | 189 (1.6%) |
| $17,500 to $19,999 | 285 (2.3%) | 264 (2.2%) |
| $20,000 to $22,499 | 291 (2.4%) | 324 (2.7%) |
| $22,500 to $24,999 | 166 (1.3%) | 681 (5.6%) |
| $25,000 to $29,999 | 633 (5.1%) | 641 (5.3%) |
| $30,000 to $34,999 | 867 (7.0%) | 1,066 (8.8%) |
| $35,000 to $39,999 | 662 (5.4%) | 862 (7.1%) |
| $40,000 to $44,999 | 714 (5.8%) | 438 (3.6%) |
| $45,000 to $49,999 | 729 (5.9%) | 768 (6.3%) |
| $50,000 to $54,999 | 423 (3.4%) | 300 (2.5%) |
| $55,000 to $64,999 | 1,277 (10.4%) | 792 (6.5%) |
| $65,000 to $74,999 | 725 (5.9%) | 889 (7.3%) |
| $75,000 to $99,999 | 1,377 (11.2%) | 1,243 (10.2%) |
| $100,000+ | 1,775 (14.4%) | 846 (7.0%) |
| Total | 12,321 (100.0%) | 12,139 (100.0%) |
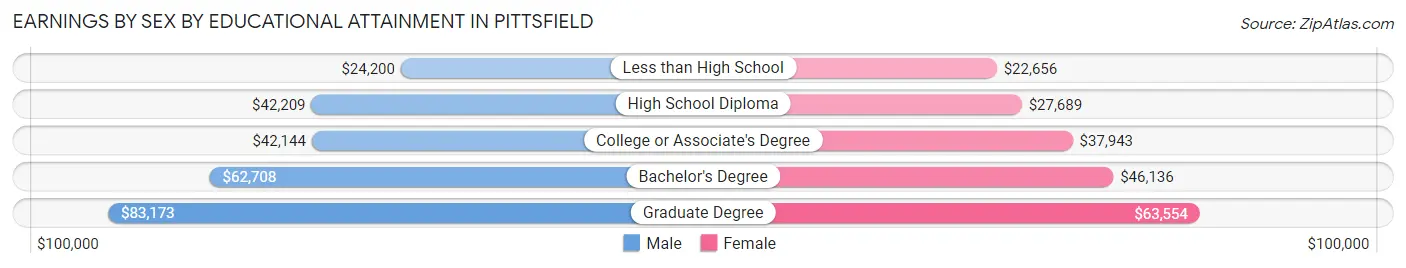
Earnings by Sex by Educational Attainment in Pittsfield
Average earnings in Pittsfield are $49,455 for men and $38,493 for women, a difference of 22.2%. Men with an educational attainment of graduate degree enjoy the highest average annual earnings of $83,173, while those with less than high school education earn the least with $24,200. Women with an educational attainment of graduate degree earn the most with the average annual earnings of $63,554, while those with less than high school education have the smallest earnings of $22,656.
| Educational Attainment | Male Income | Female Income |
| Less than High School | $24,200 | $22,656 |
| High School Diploma | $42,209 | $27,689 |
| College or Associate's Degree | $42,144 | $37,943 |
| Bachelor's Degree | $62,708 | $46,136 |
| Graduate Degree | $83,173 | $63,554 |
| Total | $49,455 | $38,493 |
Family Income in Pittsfield
Family Income Brackets in Pittsfield
According to the Pittsfield family income data, there are 2,135 families falling into the $100,000 to $149,999 income range, which is the most common income bracket and makes up 19.4% of all families. Conversely, the $10,000 to $14,999 income bracket is the least frequent group with only 198 families (1.8%) belonging to this category.
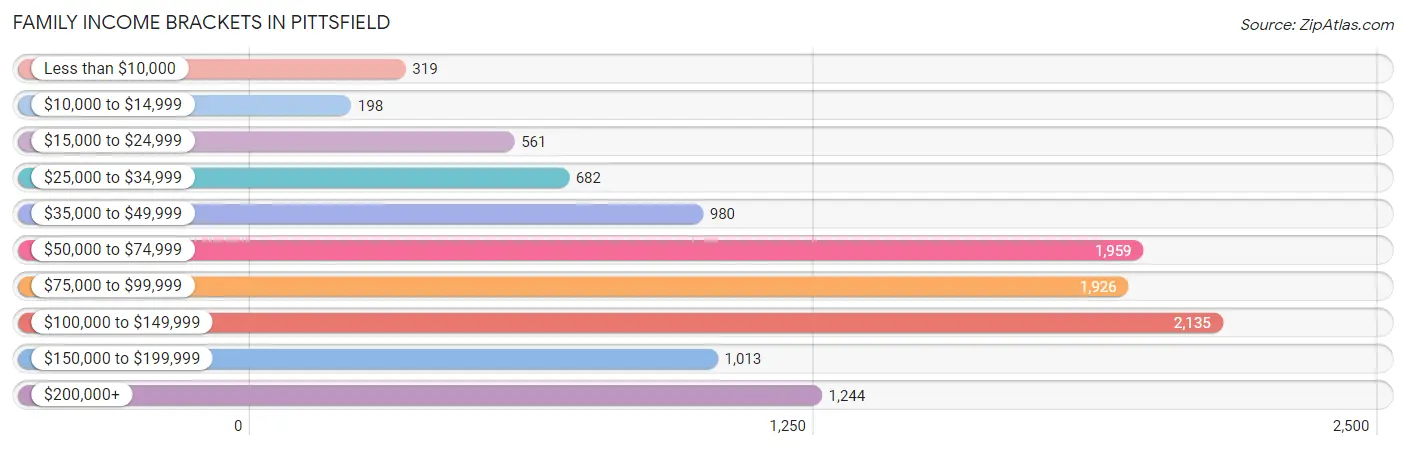
| Income Bracket | # Families | % Families |
| Less than $10,000 | 319 | 2.9% |
| $10,000 to $14,999 | 198 | 1.8% |
| $15,000 to $24,999 | 561 | 5.1% |
| $25,000 to $34,999 | 682 | 6.2% |
| $35,000 to $49,999 | 980 | 8.9% |
| $50,000 to $74,999 | 1,959 | 17.8% |
| $75,000 to $99,999 | 1,926 | 17.5% |
| $100,000 to $149,999 | 2,135 | 19.4% |
| $150,000 to $199,999 | 1,013 | 9.2% |
| $200,000+ | 1,244 | 11.3% |
Family Income by Famaliy Size in Pittsfield
7+ person families (54 | 0.5%) account for the highest median family income in Pittsfield with $172,672 per family, while 2-person families (6,005 | 54.6%) have the highest median income of $42,390 per family member.
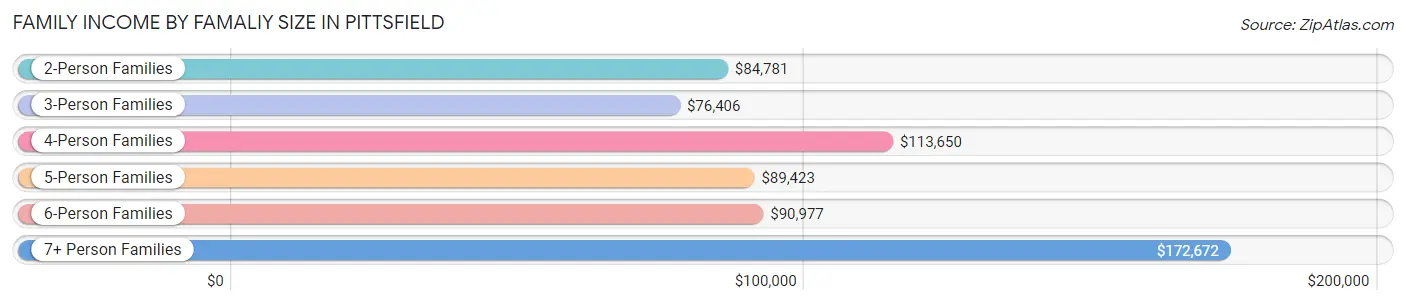
| Income Bracket | # Families | Median Income |
| 2-Person Families | 6,005 (54.6%) | $84,781 |
| 3-Person Families | 2,746 (24.9%) | $76,406 |
| 4-Person Families | 1,503 (13.7%) | $113,650 |
| 5-Person Families | 560 (5.1%) | $89,423 |
| 6-Person Families | 139 (1.3%) | $90,977 |
| 7+ Person Families | 54 (0.5%) | $172,672 |
| Total | 11,007 (100.0%) | $85,314 |
Family Income by Number of Earners in Pittsfield
The median family income in Pittsfield is $85,314, with families comprising 3+ earners (1,176) having the highest median family income of $165,643, while families with no earners (1,875) have the lowest median family income of $46,469, accounting for 10.7% and 17.0% of families, respectively.
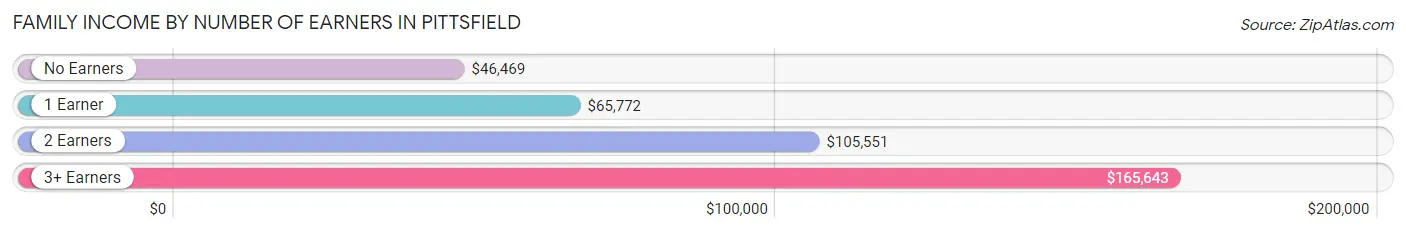
| Number of Earners | # Families | Median Income |
| No Earners | 1,875 (17.0%) | $46,469 |
| 1 Earner | 3,614 (32.8%) | $65,772 |
| 2 Earners | 4,342 (39.5%) | $105,551 |
| 3+ Earners | 1,176 (10.7%) | $165,643 |
| Total | 11,007 (100.0%) | $85,314 |
Household Income in Pittsfield
Household Income Brackets in Pittsfield
With 3,039 households falling in the category, the $75,000 to $99,999 income range is the most frequent in Pittsfield, accounting for 15.8% of all households. In contrast, only 750 households (3.9%) fall into the less than $10,000 income bracket, making it the least populous group.
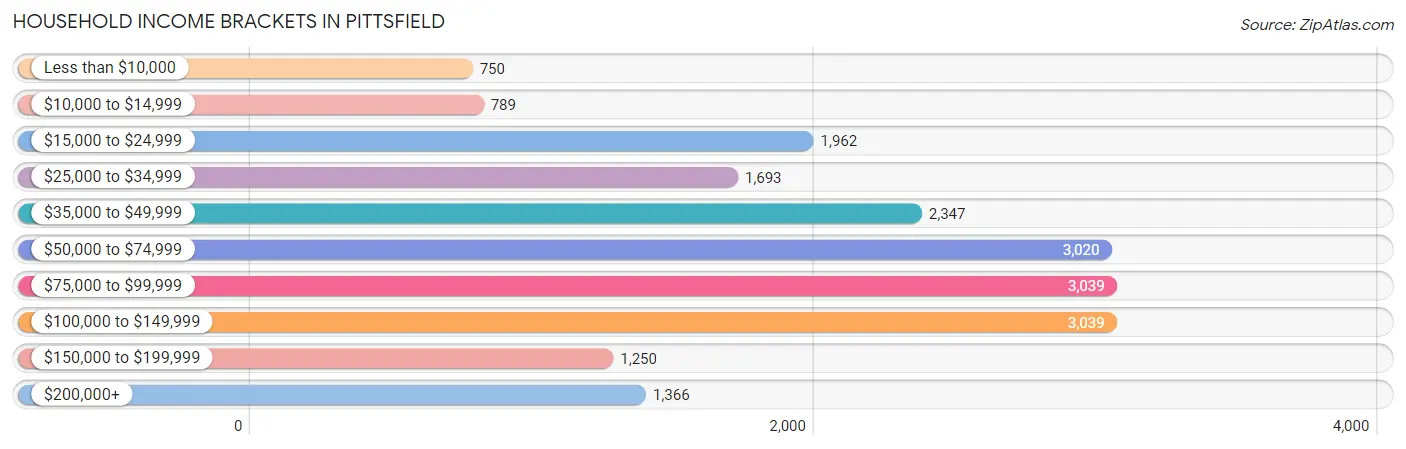
| Income Bracket | # Households | % Households |
| Less than $10,000 | 750 | 3.9% |
| $10,000 to $14,999 | 789 | 4.1% |
| $15,000 to $24,999 | 1,962 | 10.2% |
| $25,000 to $34,999 | 1,693 | 8.8% |
| $35,000 to $49,999 | 2,347 | 12.2% |
| $50,000 to $74,999 | 3,020 | 15.7% |
| $75,000 to $99,999 | 3,039 | 15.8% |
| $100,000 to $149,999 | 3,039 | 15.8% |
| $150,000 to $199,999 | 1,250 | 6.5% |
| $200,000+ | 1,366 | 7.1% |
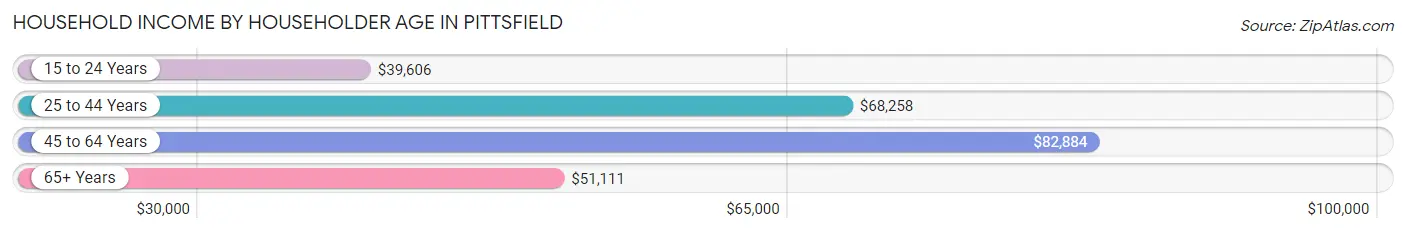
Household Income by Householder Age in Pittsfield
The median household income in Pittsfield is $66,859, with the highest median household income of $82,884 found in the 45 to 64 years age bracket for the primary householder. A total of 7,312 households (38.0%) fall into this category. Meanwhile, the 15 to 24 years age bracket for the primary householder has the lowest median household income of $39,606, with 495 households (2.6%) in this group.
| Income Bracket | # Households | Median Income |
| 15 to 24 Years | 495 (2.6%) | $39,606 |
| 25 to 44 Years | 5,724 (29.8%) | $68,258 |
| 45 to 64 Years | 7,312 (38.0%) | $82,884 |
| 65+ Years | 5,706 (29.7%) | $51,111 |
| Total | 19,237 (100.0%) | $66,859 |
Poverty in Pittsfield
Income Below Poverty by Sex and Age in Pittsfield
With 14.8% poverty level for males and 12.8% for females among the residents of Pittsfield, 12 to 14 year old males and 6 to 11 year old females are the most vulnerable to poverty, with 287 males (42.0%) and 281 females (23.4%) in their respective age groups living below the poverty level.
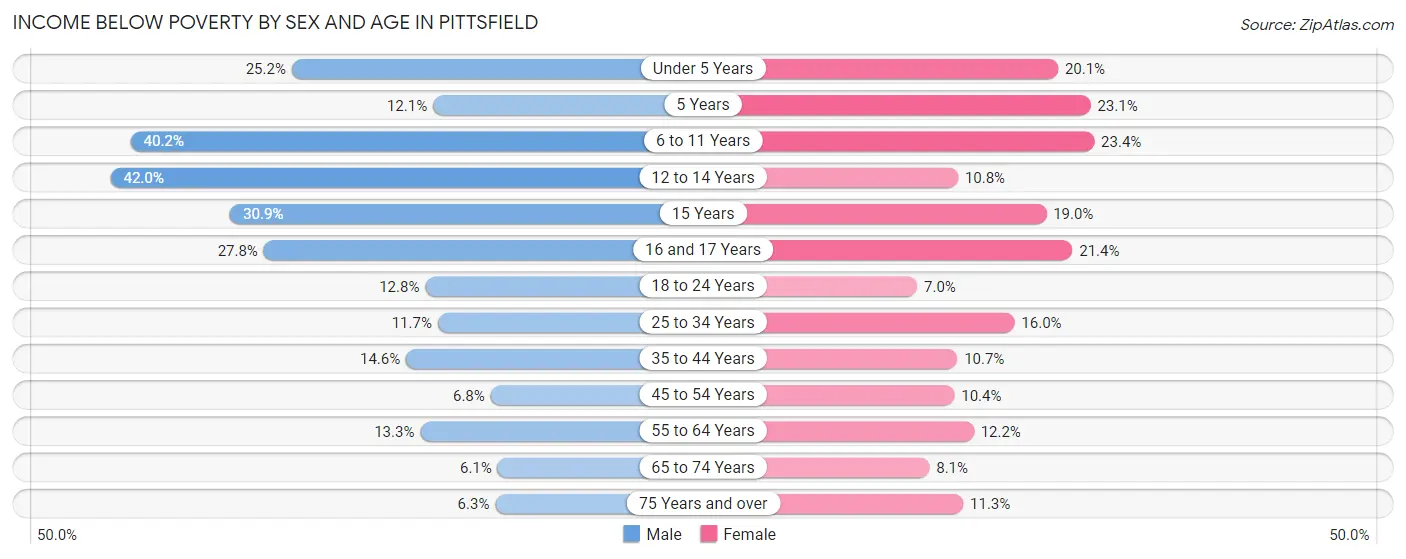
| Age Bracket | Male | Female |
| Under 5 Years | 331 (25.2%) | 191 (20.1%) |
| 5 Years | 19 (12.1%) | 51 (23.1%) |
| 6 to 11 Years | 500 (40.2%) | 281 (23.4%) |
| 12 to 14 Years | 287 (42.0%) | 66 (10.8%) |
| 15 Years | 94 (30.9%) | 70 (19.0%) |
| 16 and 17 Years | 94 (27.8%) | 74 (21.4%) |
| 18 to 24 Years | 221 (12.8%) | 101 (7.0%) |
| 25 to 34 Years | 371 (11.7%) | 484 (16.0%) |
| 35 to 44 Years | 394 (14.6%) | 281 (10.7%) |
| 45 to 54 Years | 182 (6.8%) | 277 (10.4%) |
| 55 to 64 Years | 419 (13.3%) | 452 (12.2%) |
| 65 to 74 Years | 146 (6.1%) | 195 (8.1%) |
| 75 Years and over | 90 (6.3%) | 243 (11.3%) |
| Total | 3,148 (14.8%) | 2,766 (12.8%) |
Income Above Poverty by Sex and Age in Pittsfield
According to the poverty statistics in Pittsfield, males aged 65 to 74 years and females aged 18 to 24 years are the age groups that are most secure financially, with 93.9% of males and 93.0% of females in these age groups living above the poverty line.
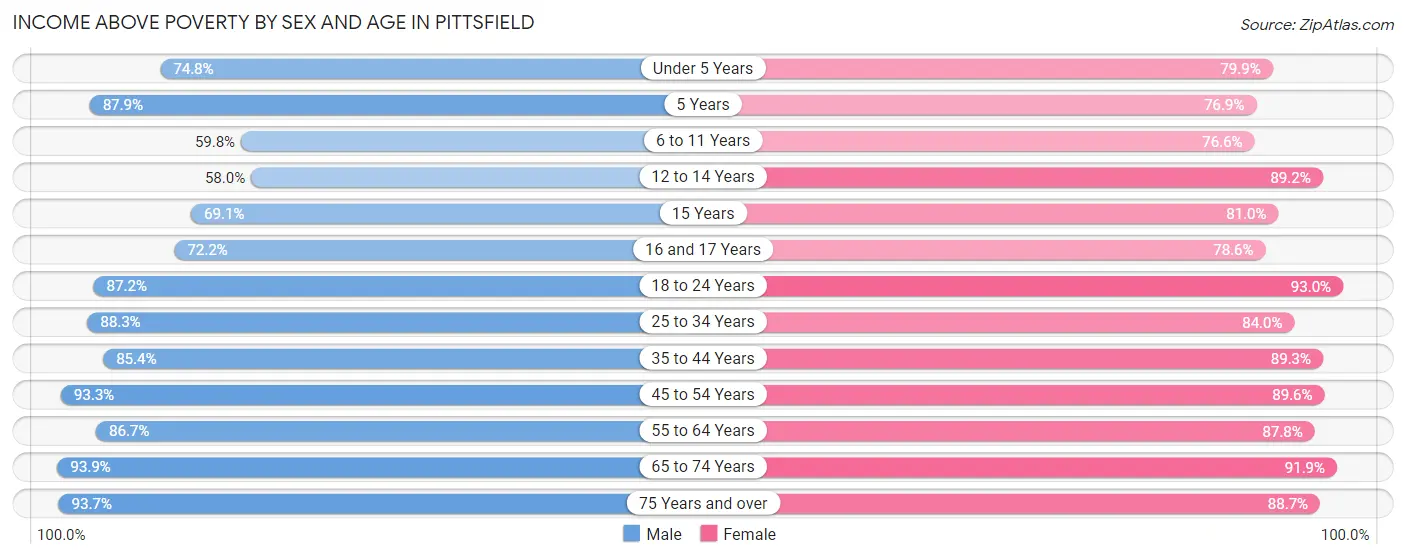
| Age Bracket | Male | Female |
| Under 5 Years | 982 (74.8%) | 761 (79.9%) |
| 5 Years | 138 (87.9%) | 170 (76.9%) |
| 6 to 11 Years | 745 (59.8%) | 919 (76.6%) |
| 12 to 14 Years | 396 (58.0%) | 546 (89.2%) |
| 15 Years | 210 (69.1%) | 299 (81.0%) |
| 16 and 17 Years | 244 (72.2%) | 272 (78.6%) |
| 18 to 24 Years | 1,503 (87.2%) | 1,343 (93.0%) |
| 25 to 34 Years | 2,810 (88.3%) | 2,538 (84.0%) |
| 35 to 44 Years | 2,305 (85.4%) | 2,342 (89.3%) |
| 45 to 54 Years | 2,514 (93.2%) | 2,376 (89.6%) |
| 55 to 64 Years | 2,737 (86.7%) | 3,240 (87.8%) |
| 65 to 74 Years | 2,249 (93.9%) | 2,206 (91.9%) |
| 75 Years and over | 1,335 (93.7%) | 1,915 (88.7%) |
| Total | 18,168 (85.2%) | 18,927 (87.3%) |
Income Below Poverty Among Married-Couple Families in Pittsfield
The poverty statistics for married-couple families in Pittsfield show that 2.7% or 202 of the total 7,542 families live below the poverty line. Families with 3 or 4 children have the highest poverty rate of 7.1%, comprising of 22 families. On the other hand, families with 5 or more children have the lowest poverty rate of 0.0%, which includes 0 families.
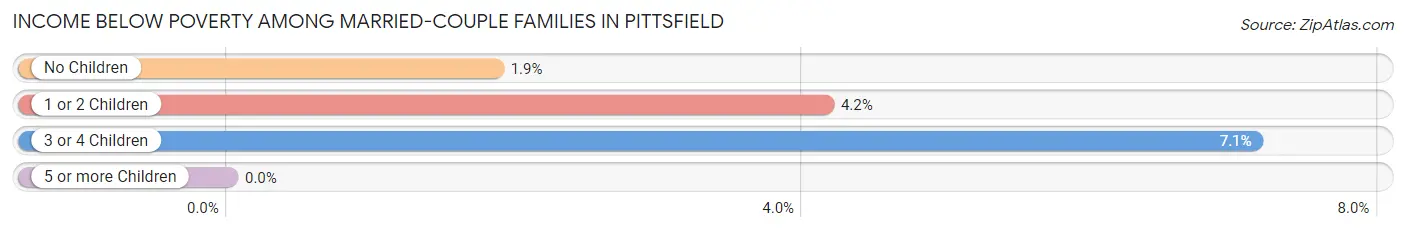
| Children | Above Poverty | Below Poverty |
| No Children | 5,105 (98.2%) | 96 (1.8%) |
| 1 or 2 Children | 1,942 (95.9%) | 84 (4.2%) |
| 3 or 4 Children | 286 (92.9%) | 22 (7.1%) |
| 5 or more Children | 7 (100.0%) | 0 (0.0%) |
| Total | 7,340 (97.3%) | 202 (2.7%) |
Income Below Poverty Among Single-Parent Households in Pittsfield
According to the poverty data in Pittsfield, 16.3% or 169 single-father households and 25.8% or 626 single-mother households are living below the poverty line. Among single-father households, those with 1 or 2 children have the highest poverty rate, with 144 households (24.0%) experiencing poverty. Likewise, among single-mother households, those with 3 or 4 children have the highest poverty rate, with 221 households (81.6%) falling below the poverty line.
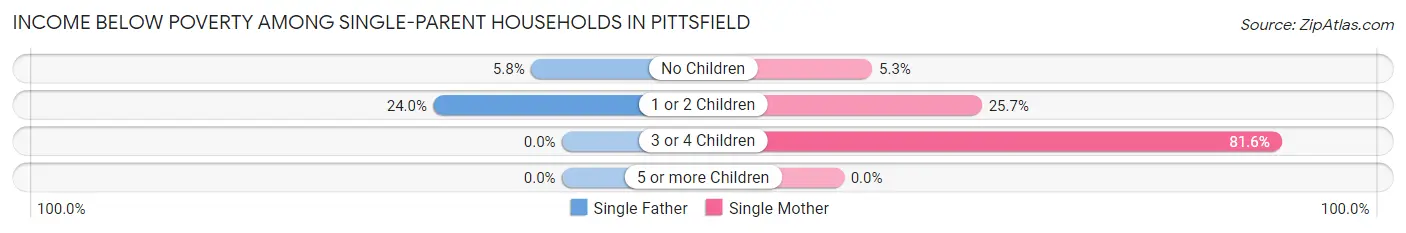
| Children | Single Father | Single Mother |
| No Children | 25 (5.8%) | 39 (5.3%) |
| 1 or 2 Children | 144 (24.0%) | 366 (25.7%) |
| 3 or 4 Children | 0 (0.0%) | 221 (81.6%) |
| 5 or more Children | 0 (0.0%) | 0 (0.0%) |
| Total | 169 (16.3%) | 626 (25.8%) |
Income Below Poverty Among Married-Couple vs Single-Parent Households in Pittsfield
The poverty data for Pittsfield shows that 202 of the married-couple family households (2.7%) and 795 of the single-parent households (22.9%) are living below the poverty level. Within the married-couple family households, those with 3 or 4 children have the highest poverty rate, with 22 households (7.1%) falling below the poverty line. Among the single-parent households, those with 3 or 4 children have the highest poverty rate, with 221 household (81.6%) living below poverty.
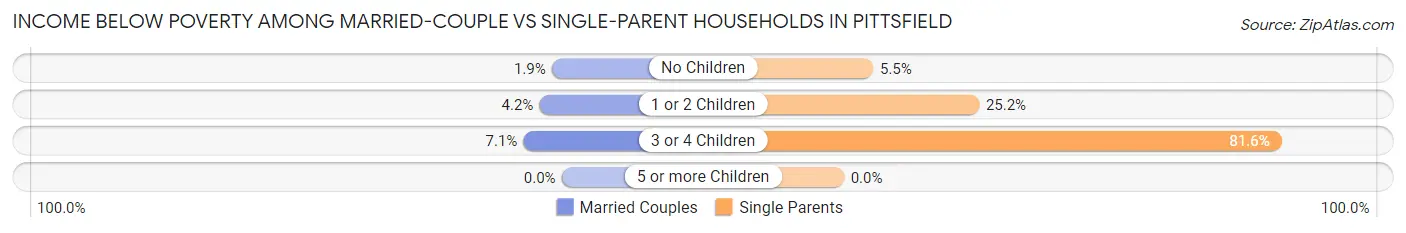
| Children | Married-Couple Families | Single-Parent Households |
| No Children | 96 (1.8%) | 64 (5.5%) |
| 1 or 2 Children | 84 (4.2%) | 510 (25.2%) |
| 3 or 4 Children | 22 (7.1%) | 221 (81.6%) |
| 5 or more Children | 0 (0.0%) | 0 (0.0%) |
| Total | 202 (2.7%) | 795 (22.9%) |
Race in Pittsfield
The most populous races in Pittsfield are White / Caucasian (35,861 | 82.0%), Hispanic or Latino (3,690 | 8.4%), and Two or more Races (3,336 | 7.6%).
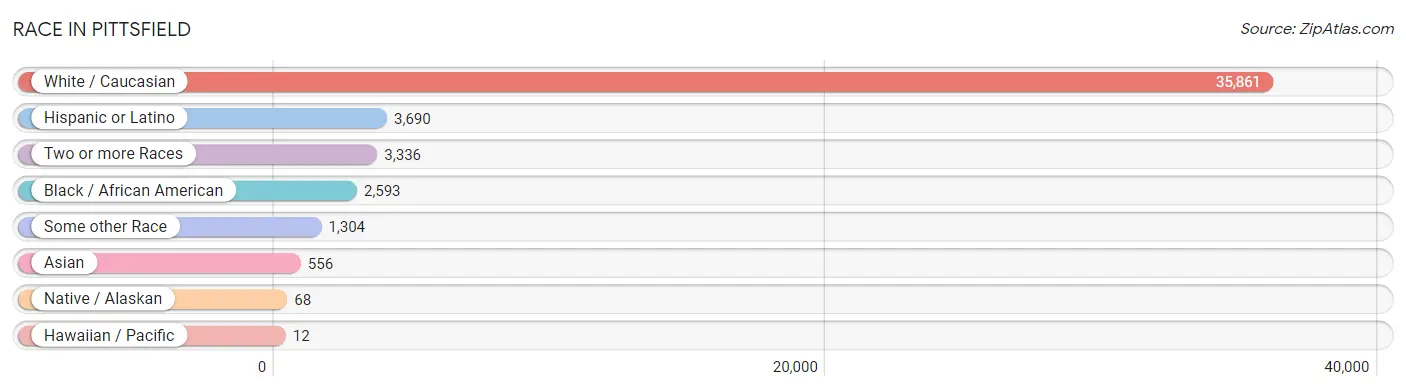
| Race | # Population | % Population |
| Asian | 556 | 1.3% |
| Black / African American | 2,593 | 5.9% |
| Hawaiian / Pacific | 12 | 0.0% |
| Hispanic or Latino | 3,690 | 8.4% |
| Native / Alaskan | 68 | 0.2% |
| White / Caucasian | 35,861 | 82.0% |
| Two or more Races | 3,336 | 7.6% |
| Some other Race | 1,304 | 3.0% |
| Total | 43,730 | 100.0% |
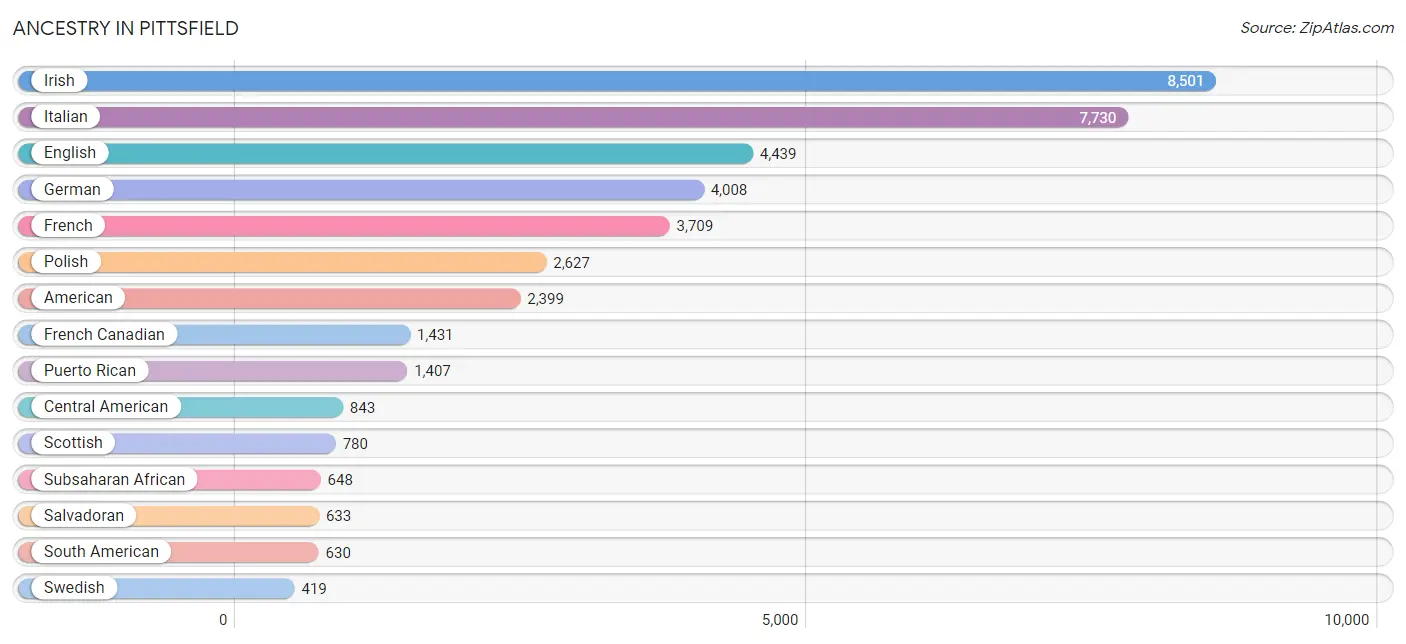
Ancestry in Pittsfield
The most populous ancestries reported in Pittsfield are Irish (8,501 | 19.4%), Italian (7,730 | 17.7%), English (4,439 | 10.2%), German (4,008 | 9.2%), and French (3,709 | 8.5%), together accounting for 64.9% of all Pittsfield residents.
| Ancestry | # Population | % Population |
| African | 302 | 0.7% |
| American | 2,399 | 5.5% |
| Apache | 7 | 0.0% |
| Arab | 174 | 0.4% |
| Armenian | 22 | 0.1% |
| Austrian | 168 | 0.4% |
| Bhutanese | 171 | 0.4% |
| Blackfeet | 7 | 0.0% |
| British | 139 | 0.3% |
| Burmese | 42 | 0.1% |
| Cajun | 15 | 0.0% |
| Canadian | 231 | 0.5% |
| Cape Verdean | 39 | 0.1% |
| Central American | 843 | 1.9% |
| Central American Indian | 61 | 0.1% |
| Cherokee | 333 | 0.8% |
| Choctaw | 94 | 0.2% |
| Colombian | 225 | 0.5% |
| Cuban | 104 | 0.2% |
| Czech | 103 | 0.2% |
| Czechoslovakian | 39 | 0.1% |
| Danish | 195 | 0.4% |
| Dominican | 91 | 0.2% |
| Dutch | 390 | 0.9% |
| Eastern European | 286 | 0.6% |
| Ecuadorian | 174 | 0.4% |
| English | 4,439 | 10.2% |
| European | 363 | 0.8% |
| Filipino | 18 | 0.0% |
| Finnish | 100 | 0.2% |
| French | 3,709 | 8.5% |
| French Canadian | 1,431 | 3.3% |
| German | 4,008 | 9.2% |
| Ghanaian | 157 | 0.4% |
| Greek | 255 | 0.6% |
| Haitian | 128 | 0.3% |
| Honduran | 51 | 0.1% |
| Hungarian | 92 | 0.2% |
| Indian (Asian) | 168 | 0.4% |
| Irish | 8,501 | 19.4% |
| Iroquois | 17 | 0.0% |
| Italian | 7,730 | 17.7% |
| Korean | 116 | 0.3% |
| Latvian | 9 | 0.0% |
| Lebanese | 146 | 0.3% |
| Lithuanian | 32 | 0.1% |
| Mexican | 346 | 0.8% |
| Moroccan | 12 | 0.0% |
| Navajo | 2 | 0.0% |
| Nicaraguan | 40 | 0.1% |
| Northern European | 68 | 0.2% |
| Norwegian | 72 | 0.2% |
| Pakistani | 52 | 0.1% |
| Panamanian | 119 | 0.3% |
| Pennsylvania German | 9 | 0.0% |
| Peruvian | 231 | 0.5% |
| Polish | 2,627 | 6.0% |
| Portuguese | 395 | 0.9% |
| Puerto Rican | 1,407 | 3.2% |
| Romanian | 87 | 0.2% |
| Russian | 378 | 0.9% |
| Salvadoran | 633 | 1.5% |
| Scandinavian | 61 | 0.1% |
| Scotch-Irish | 224 | 0.5% |
| Scottish | 780 | 1.8% |
| Serbian | 26 | 0.1% |
| Sioux | 34 | 0.1% |
| Slovak | 79 | 0.2% |
| Slovene | 9 | 0.0% |
| South African | 16 | 0.0% |
| South American | 630 | 1.4% |
| Spaniard | 79 | 0.2% |
| Sri Lankan | 30 | 0.1% |
| Subsaharan African | 648 | 1.5% |
| Swedish | 419 | 1.0% |
| Swiss | 106 | 0.2% |
| Thai | 177 | 0.4% |
| Trinidadian and Tobagonian | 22 | 0.1% |
| Turkish | 11 | 0.0% |
| Ukrainian | 143 | 0.3% |
| Welsh | 136 | 0.3% |
| West Indian | 51 | 0.1% |
| Yugoslavian | 5 | 0.0% | View All 83 Rows |
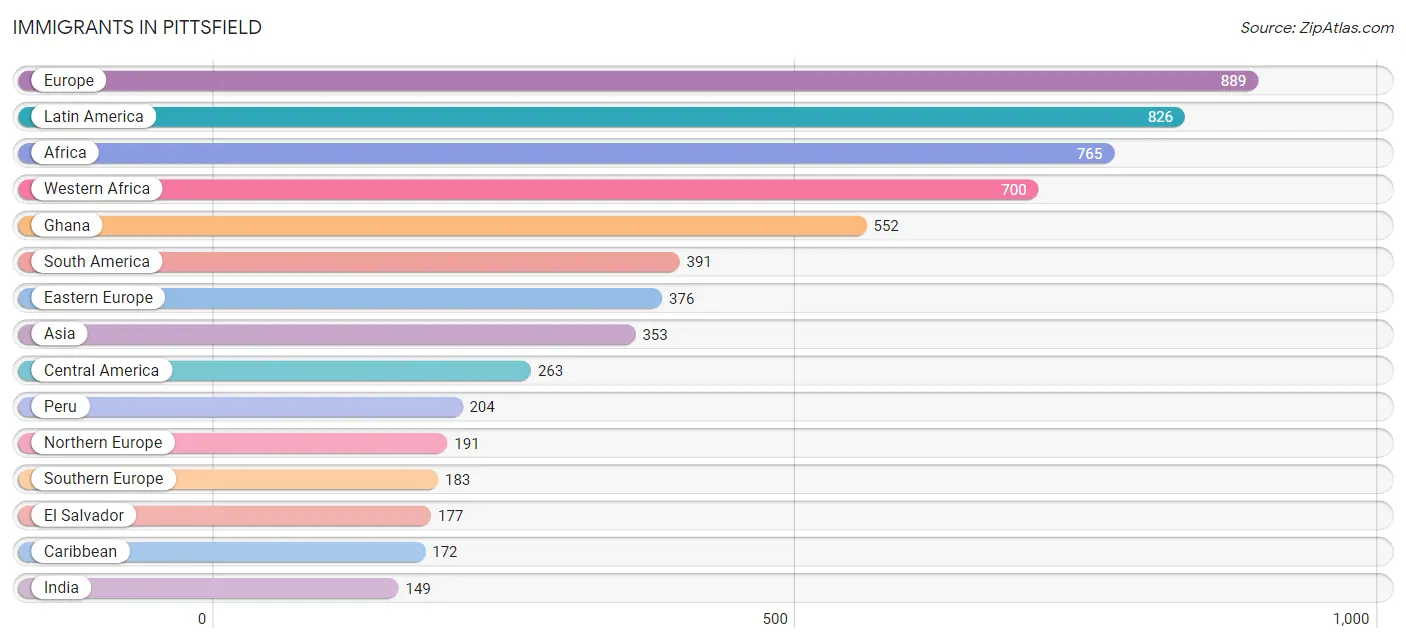
Immigrants in Pittsfield
The most numerous immigrant groups reported in Pittsfield came from Europe (889 | 2.0%), Latin America (826 | 1.9%), Africa (765 | 1.8%), Western Africa (700 | 1.6%), and Ghana (552 | 1.3%), together accounting for 8.5% of all Pittsfield residents.
| Immigration Origin | # Population | % Population |
| Africa | 765 | 1.8% |
| Asia | 353 | 0.8% |
| Australia | 8 | 0.0% |
| Barbados | 21 | 0.1% |
| Belarus | 59 | 0.1% |
| Brazil | 12 | 0.0% |
| Cabo Verde | 20 | 0.1% |
| Canada | 132 | 0.3% |
| Caribbean | 172 | 0.4% |
| Central America | 263 | 0.6% |
| China | 41 | 0.1% |
| Colombia | 106 | 0.2% |
| Cuba | 16 | 0.0% |
| Czechoslovakia | 38 | 0.1% |
| Dominican Republic | 95 | 0.2% |
| Eastern Asia | 85 | 0.2% |
| Eastern Europe | 376 | 0.9% |
| Ecuador | 69 | 0.2% |
| El Salvador | 177 | 0.4% |
| England | 44 | 0.1% |
| Europe | 889 | 2.0% |
| Fiji | 12 | 0.0% |
| France | 17 | 0.0% |
| Germany | 113 | 0.3% |
| Ghana | 552 | 1.3% |
| Greece | 79 | 0.2% |
| Haiti | 1 | 0.0% |
| Honduras | 16 | 0.0% |
| India | 149 | 0.3% |
| Ireland | 6 | 0.0% |
| Italy | 62 | 0.1% |
| Jamaica | 17 | 0.0% |
| Japan | 24 | 0.1% |
| Korea | 20 | 0.1% |
| Latin America | 826 | 1.9% |
| Mexico | 70 | 0.2% |
| Moldova | 25 | 0.1% |
| Morocco | 49 | 0.1% |
| Northern Africa | 49 | 0.1% |
| Northern Europe | 191 | 0.4% |
| Oceania | 20 | 0.1% |
| Peru | 204 | 0.5% |
| Philippines | 28 | 0.1% |
| Poland | 36 | 0.1% |
| Portugal | 42 | 0.1% |
| Romania | 21 | 0.1% |
| Russia | 78 | 0.2% |
| Serbia | 26 | 0.1% |
| South Africa | 16 | 0.0% |
| South America | 391 | 0.9% |
| South Central Asia | 149 | 0.3% |
| South Eastern Asia | 108 | 0.3% |
| Southern Europe | 183 | 0.4% |
| Sweden | 12 | 0.0% |
| Switzerland | 9 | 0.0% |
| Thailand | 54 | 0.1% |
| Trinidad and Tobago | 22 | 0.1% |
| Turkey | 11 | 0.0% |
| Ukraine | 43 | 0.1% |
| Vietnam | 26 | 0.1% |
| Western Africa | 700 | 1.6% |
| Western Asia | 11 | 0.0% |
| Western Europe | 139 | 0.3% | View All 63 Rows |
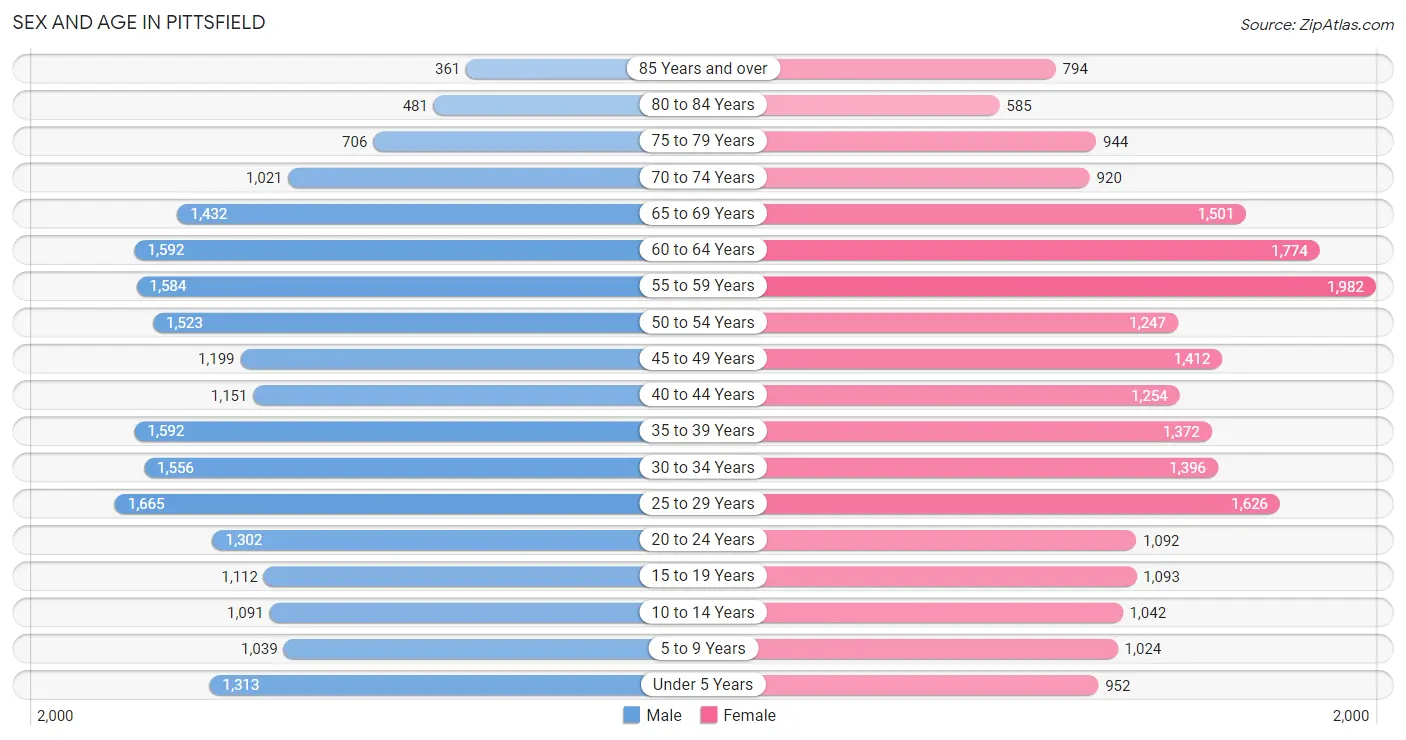
Sex and Age in Pittsfield
Sex and Age in Pittsfield
The most populous age groups in Pittsfield are 25 to 29 Years (1,665 | 7.7%) for men and 55 to 59 Years (1,982 | 9.0%) for women.
| Age Bracket | Male | Female |
| Under 5 Years | 1,313 (6.0%) | 952 (4.3%) |
| 5 to 9 Years | 1,039 (4.8%) | 1,024 (4.6%) |
| 10 to 14 Years | 1,091 (5.0%) | 1,042 (4.7%) |
| 15 to 19 Years | 1,112 (5.1%) | 1,093 (5.0%) |
| 20 to 24 Years | 1,302 (6.0%) | 1,092 (5.0%) |
| 25 to 29 Years | 1,665 (7.7%) | 1,626 (7.4%) |
| 30 to 34 Years | 1,556 (7.2%) | 1,396 (6.3%) |
| 35 to 39 Years | 1,592 (7.3%) | 1,372 (6.2%) |
| 40 to 44 Years | 1,151 (5.3%) | 1,254 (5.7%) |
| 45 to 49 Years | 1,199 (5.5%) | 1,412 (6.4%) |
| 50 to 54 Years | 1,523 (7.0%) | 1,247 (5.7%) |
| 55 to 59 Years | 1,584 (7.3%) | 1,982 (9.0%) |
| 60 to 64 Years | 1,592 (7.3%) | 1,774 (8.1%) |
| 65 to 69 Years | 1,432 (6.6%) | 1,501 (6.8%) |
| 70 to 74 Years | 1,021 (4.7%) | 920 (4.2%) |
| 75 to 79 Years | 706 (3.3%) | 944 (4.3%) |
| 80 to 84 Years | 481 (2.2%) | 585 (2.7%) |
| 85 Years and over | 361 (1.7%) | 794 (3.6%) |
| Total | 21,720 (100.0%) | 22,010 (100.0%) |
Families and Households in Pittsfield
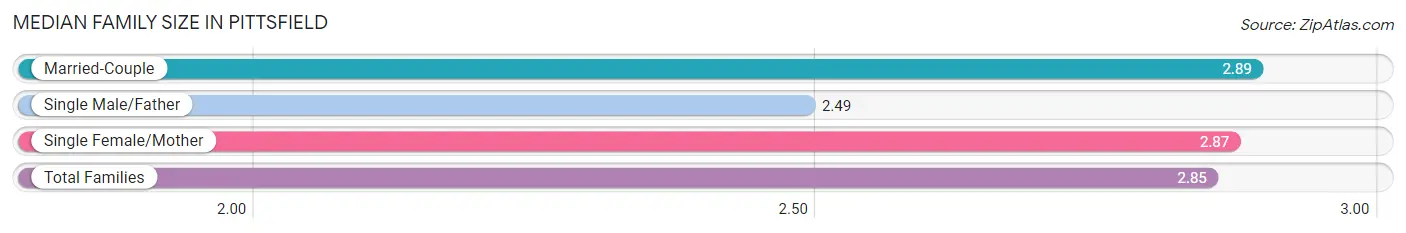
Median Family Size in Pittsfield
The median family size in Pittsfield is 2.85 persons per family, with married-couple families (7,542 | 68.5%) accounting for the largest median family size of 2.89 persons per family. On the other hand, single male/father families (1,034 | 9.4%) represent the smallest median family size with 2.49 persons per family.
| Family Type | # Families | Family Size |
| Married-Couple | 7,542 (68.5%) | 2.89 |
| Single Male/Father | 1,034 (9.4%) | 2.49 |
| Single Female/Mother | 2,431 (22.1%) | 2.87 |
| Total Families | 11,007 (100.0%) | 2.85 |
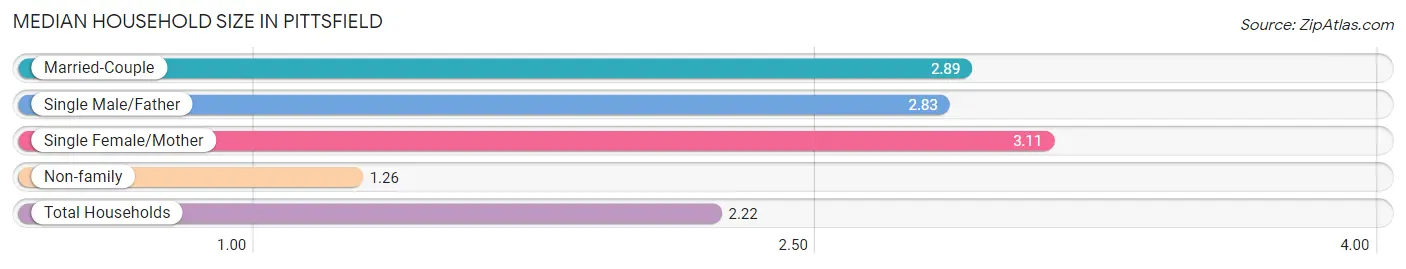
Median Household Size in Pittsfield
The median household size in Pittsfield is 2.22 persons per household, with single female/mother households (2,431 | 12.6%) accounting for the largest median household size of 3.11 persons per household. non-family households (8,230 | 42.8%) represent the smallest median household size with 1.26 persons per household.
| Household Type | # Households | Household Size |
| Married-Couple | 7,542 (39.2%) | 2.89 |
| Single Male/Father | 1,034 (5.4%) | 2.83 |
| Single Female/Mother | 2,431 (12.6%) | 3.11 |
| Non-family | 8,230 (42.8%) | 1.26 |
| Total Households | 19,237 (100.0%) | 2.22 |
Household Size by Marriage Status in Pittsfield
Out of a total of 19,237 households in Pittsfield, 11,007 (57.2%) are family households, while 8,230 (42.8%) are nonfamily households. The most numerous type of family households are 2-person households, comprising 5,548, and the most common type of nonfamily households are 1-person households, comprising 6,647.
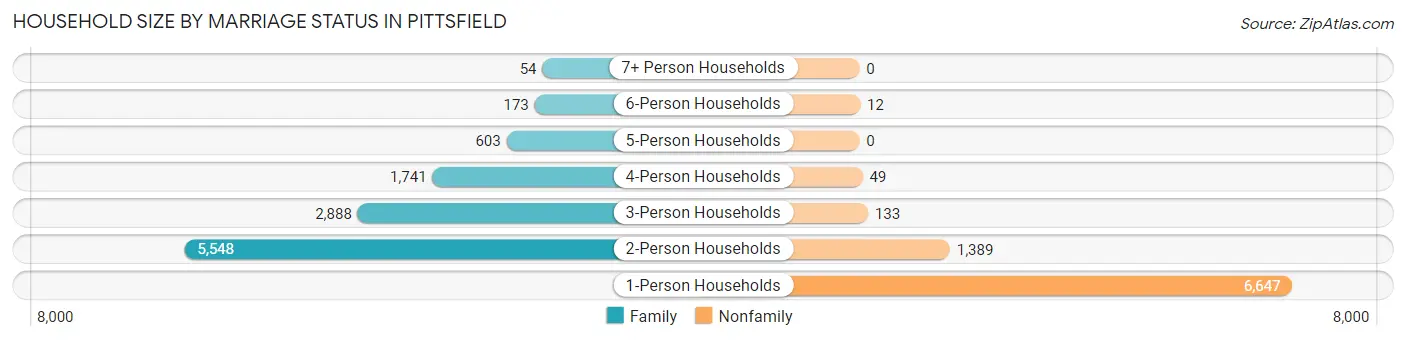
| Household Size | Family Households | Nonfamily Households |
| 1-Person Households | - | 6,647 (34.5%) |
| 2-Person Households | 5,548 (28.8%) | 1,389 (7.2%) |
| 3-Person Households | 2,888 (15.0%) | 133 (0.7%) |
| 4-Person Households | 1,741 (9.0%) | 49 (0.3%) |
| 5-Person Households | 603 (3.1%) | 0 (0.0%) |
| 6-Person Households | 173 (0.9%) | 12 (0.1%) |
| 7+ Person Households | 54 (0.3%) | 0 (0.0%) |
| Total | 11,007 (57.2%) | 8,230 (42.8%) |
Female Fertility in Pittsfield
Fertility by Age in Pittsfield
Average fertility rate in Pittsfield is 45.0 births per 1,000 women. Women in the age bracket of 20 to 34 years have the highest fertility rate with 63.0 births per 1,000 women. Women in the age bracket of 20 to 34 years acount for 61.5% of all women with births.
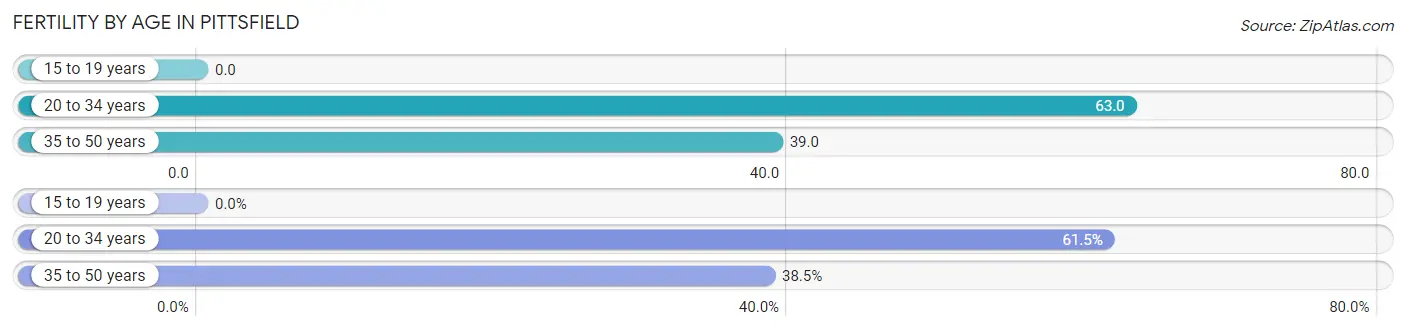
| Age Bracket | Women with Births | Births / 1,000 Women |
| 15 to 19 years | 0 (0.0%) | 0.0 |
| 20 to 34 years | 259 (61.5%) | 63.0 |
| 35 to 50 years | 162 (38.5%) | 39.0 |
| Total | 421 (100.0%) | 45.0 |
Fertility by Age by Marriage Status in Pittsfield
80.5% of women with births (421) in Pittsfield are married. The highest percentage of unmarried women with births falls into 20 to 34 years age bracket with 29.0% of them unmarried at the time of birth, while the lowest percentage of unmarried women with births belong to 35 to 50 years age bracket with 4.3% of them unmarried.
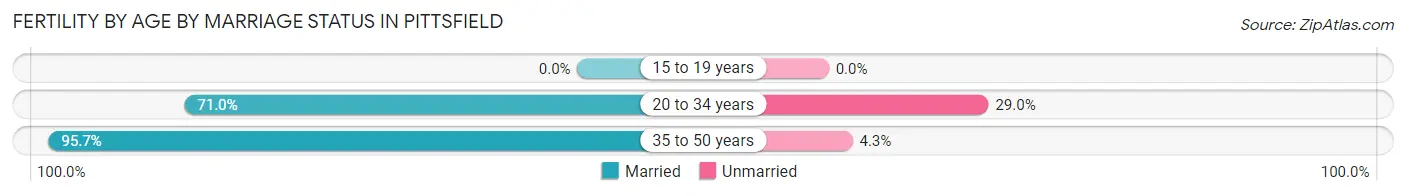
| Age Bracket | Married | Unmarried |
| 15 to 19 years | 0 (0.0%) | 0 (0.0%) |
| 20 to 34 years | 184 (71.0%) | 75 (29.0%) |
| 35 to 50 years | 155 (95.7%) | 7 (4.3%) |
| Total | 339 (80.5%) | 82 (19.5%) |
Fertility by Education in Pittsfield
Average fertility rate in Pittsfield is 45.0 births per 1,000 women. Women with the education attainment of graduate degree have the highest fertility rate of 113.0 births per 1,000 women, while women with the education attainment of high school diploma have the lowest fertility at 19.0 births per 1,000 women. Women with the education attainment of graduate degree represent 33.7% of all women with births.
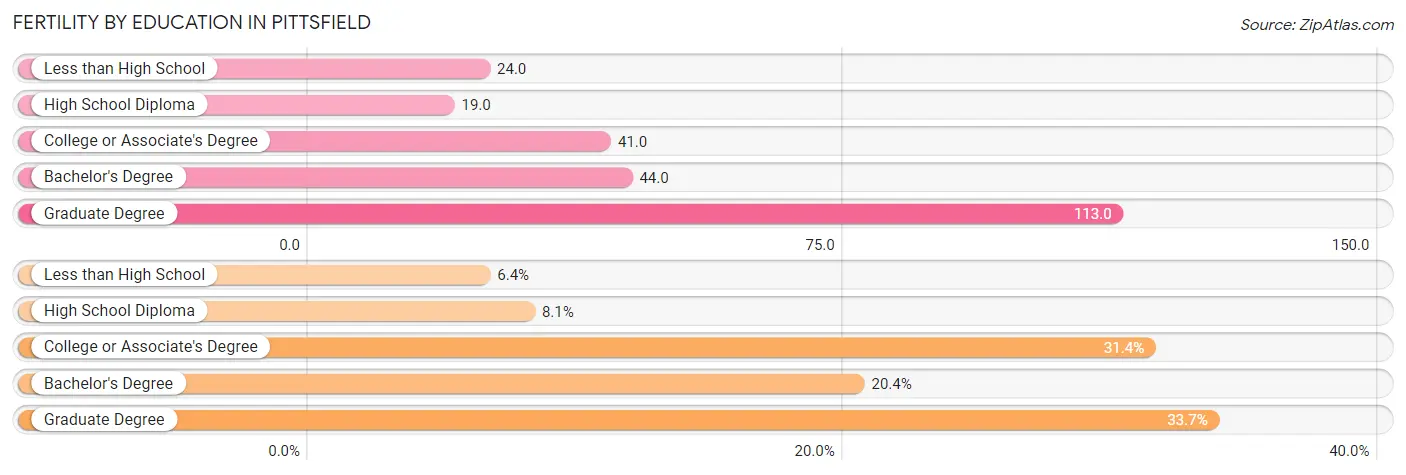
| Educational Attainment | Women with Births | Births / 1,000 Women |
| Less than High School | 27 (6.4%) | 24.0 |
| High School Diploma | 34 (8.1%) | 19.0 |
| College or Associate's Degree | 132 (31.4%) | 41.0 |
| Bachelor's Degree | 86 (20.4%) | 44.0 |
| Graduate Degree | 142 (33.7%) | 113.0 |
| Total | 421 (100.0%) | 45.0 |
Fertility by Education by Marriage Status in Pittsfield
19.5% of women with births in Pittsfield are unmarried. Women with the educational attainment of less than high school are most likely to be married with 100.0% of them married at childbirth, while women with the educational attainment of bachelor's degree are least likely to be married with 38.4% of them unmarried at childbirth.
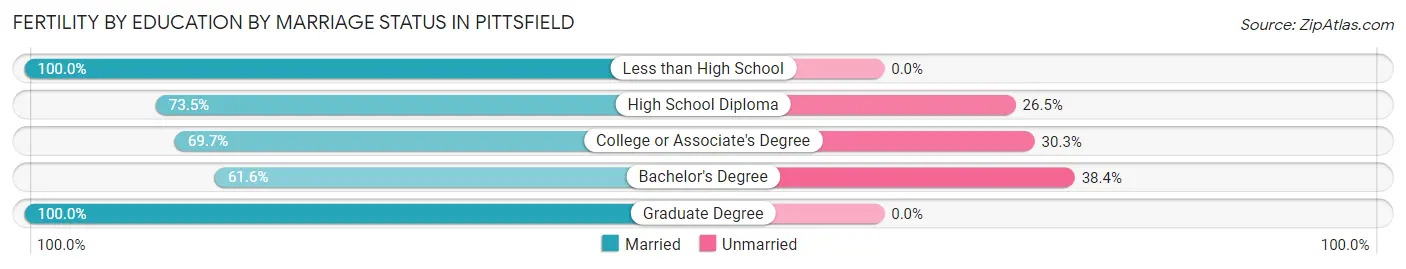
| Educational Attainment | Married | Unmarried |
| Less than High School | 27 (100.0%) | 0 (0.0%) |
| High School Diploma | 25 (73.5%) | 9 (26.5%) |
| College or Associate's Degree | 92 (69.7%) | 40 (30.3%) |
| Bachelor's Degree | 53 (61.6%) | 33 (38.4%) |
| Graduate Degree | 142 (100.0%) | 0 (0.0%) |
| Total | 339 (80.5%) | 82 (19.5%) |
Employment Characteristics in Pittsfield
Employment by Class of Employer in Pittsfield
Among the 21,165 employed individuals in Pittsfield, private company employees (12,501 | 59.1%), not-for-profit organizations (3,934 | 18.6%), and local government employees (1,588 | 7.5%) make up the most common classes of employment.
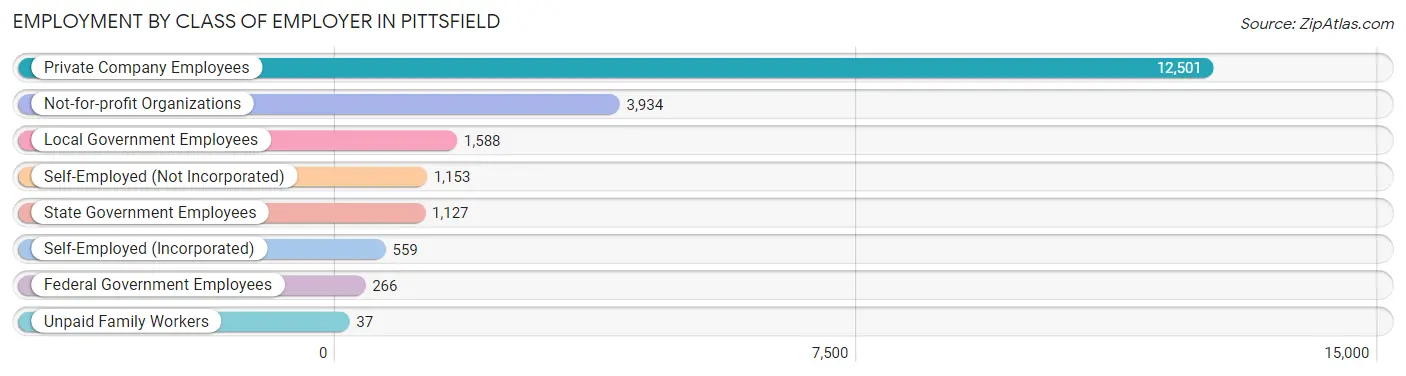
| Employer Class | # Employees | % Employees |
| Private Company Employees | 12,501 | 59.1% |
| Self-Employed (Incorporated) | 559 | 2.6% |
| Self-Employed (Not Incorporated) | 1,153 | 5.4% |
| Not-for-profit Organizations | 3,934 | 18.6% |
| Local Government Employees | 1,588 | 7.5% |
| State Government Employees | 1,127 | 5.3% |
| Federal Government Employees | 266 | 1.3% |
| Unpaid Family Workers | 37 | 0.2% |
| Total | 21,165 | 100.0% |
Employment Status by Age in Pittsfield
According to the labor force statistics for Pittsfield, out of the total population over 16 years of age (36,593), 64.6% or 23,639 individuals are in the labor force, with 7.1% or 1,678 of them unemployed. The age group with the highest labor force participation rate is 20 to 24 years, with 88.3% or 2,114 individuals in the labor force. Within the labor force, the 16 to 19 years age range has the highest percentage of unemployed individuals, with 19.7% or 127 of them being unemployed.
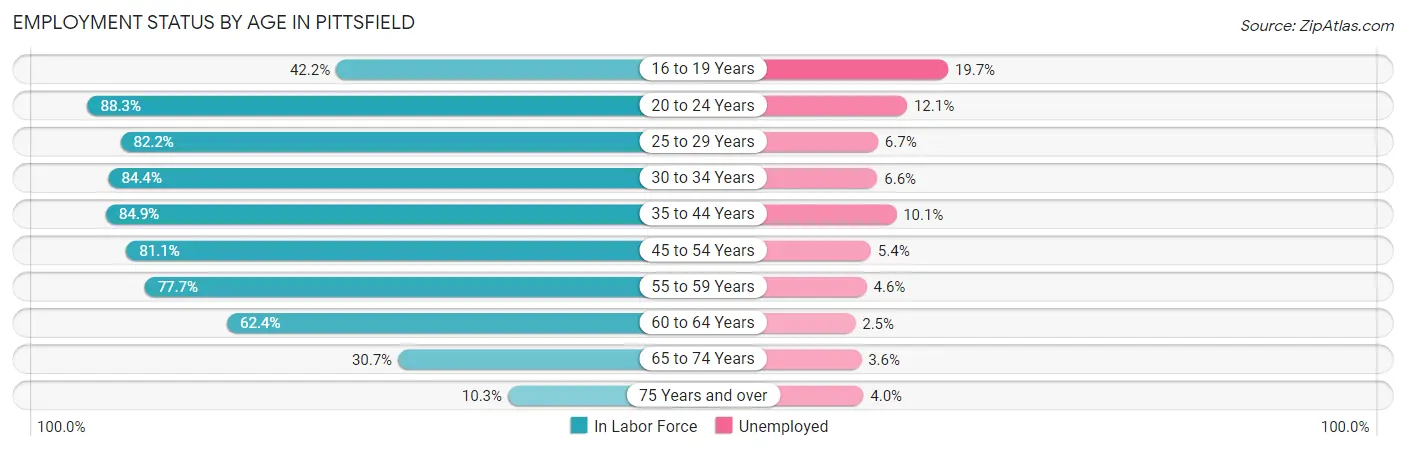
| Age Bracket | In Labor Force | Unemployed |
| 16 to 19 Years | 645 (42.2%) | 127 (19.7%) |
| 20 to 24 Years | 2,114 (88.3%) | 256 (12.1%) |
| 25 to 29 Years | 2,705 (82.2%) | 181 (6.7%) |
| 30 to 34 Years | 2,491 (84.4%) | 164 (6.6%) |
| 35 to 44 Years | 4,558 (84.9%) | 460 (10.1%) |
| 45 to 54 Years | 4,364 (81.1%) | 236 (5.4%) |
| 55 to 59 Years | 2,771 (77.7%) | 127 (4.6%) |
| 60 to 64 Years | 2,100 (62.4%) | 52 (2.5%) |
| 65 to 74 Years | 1,496 (30.7%) | 54 (3.6%) |
| 75 Years and over | 399 (10.3%) | 16 (4.0%) |
| Total | 23,639 (64.6%) | 1,678 (7.1%) |
Employment Status by Educational Attainment in Pittsfield
According to labor force statistics for Pittsfield, 79.4% of individuals (18,996) out of the total population between 25 and 64 years of age (23,925) are in the labor force, with 6.4% or 1,216 of them being unemployed. The group with the highest labor force participation rate are those with the educational attainment of bachelor's degree or higher, with 89.4% or 7,533 individuals in the labor force. Within the labor force, individuals with less than high school education have the highest percentage of unemployment, with 9.7% or 71 of them being unemployed.
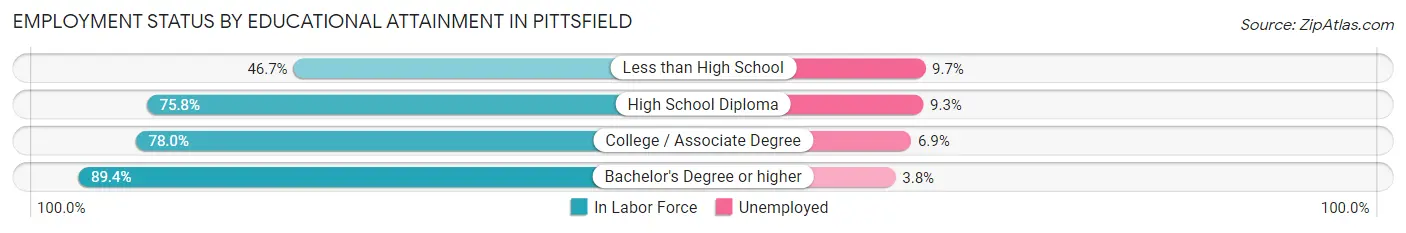
| Educational Attainment | In Labor Force | Unemployed |
| Less than High School | 734 (46.7%) | 152 (9.7%) |
| High School Diploma | 5,044 (75.8%) | 619 (9.3%) |
| College / Associate Degree | 5,672 (78.0%) | 502 (6.9%) |
| Bachelor's Degree or higher | 7,533 (89.4%) | 320 (3.8%) |
| Total | 18,996 (79.4%) | 1,531 (6.4%) |
Employment Occupations by Sex in Pittsfield
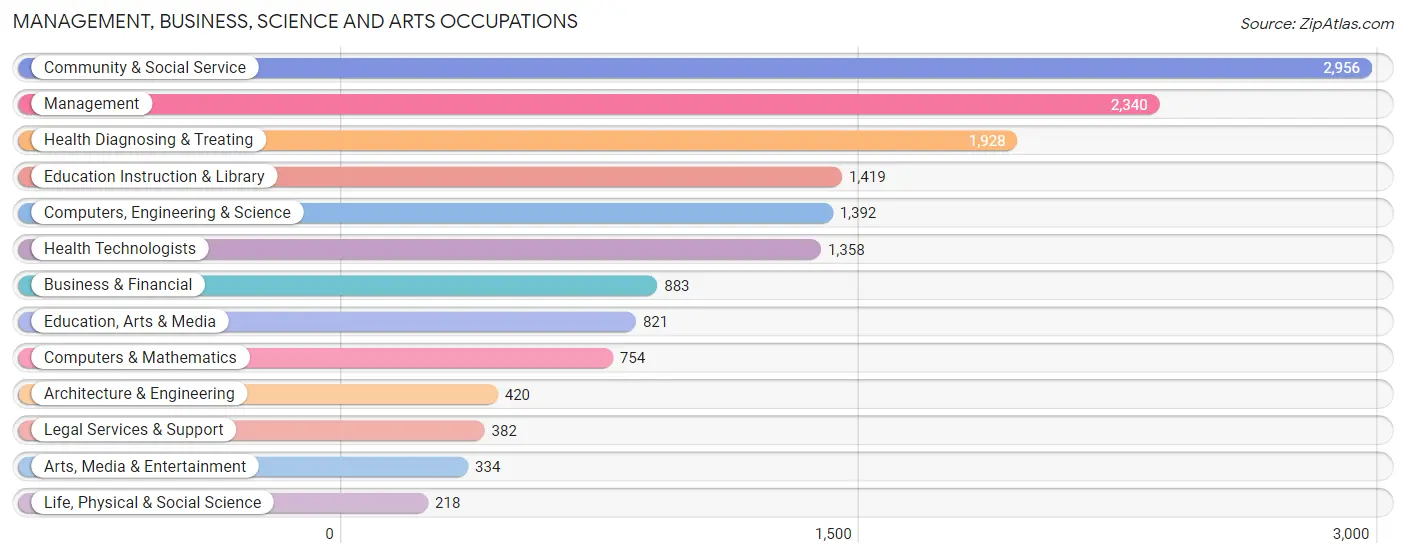
Management, Business, Science and Arts Occupations
The most common Management, Business, Science and Arts occupations in Pittsfield are Community & Social Service (2,956 | 13.5%), Management (2,340 | 10.6%), Health Diagnosing & Treating (1,928 | 8.8%), Education Instruction & Library (1,419 | 6.5%), and Computers, Engineering & Science (1,392 | 6.3%).
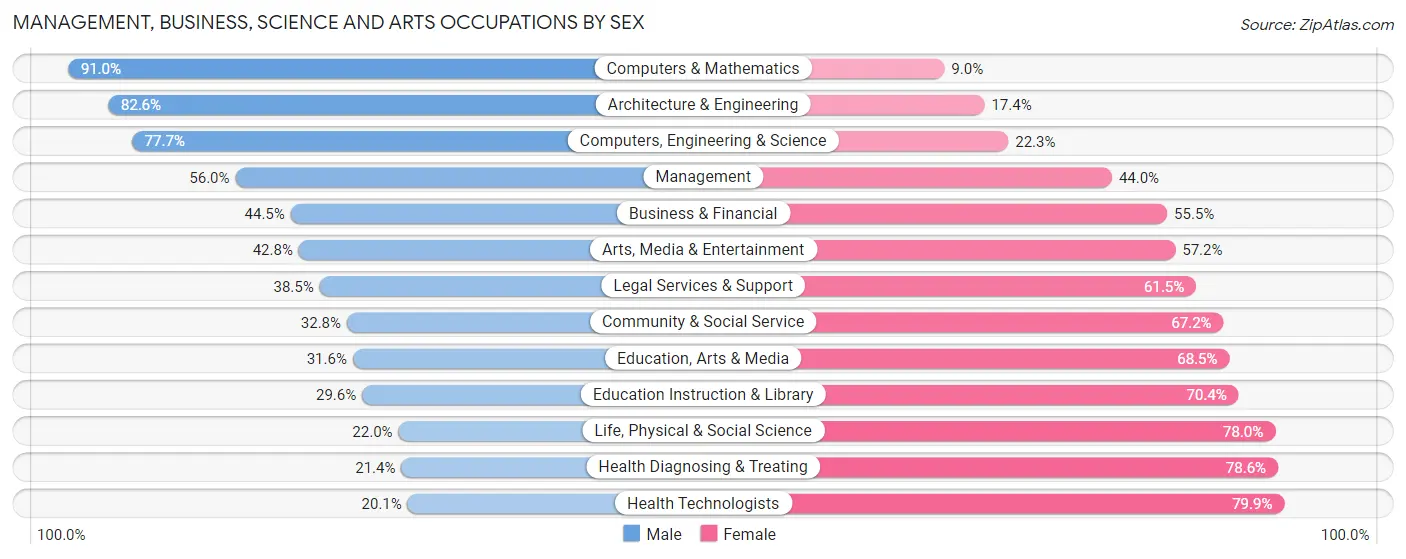
Management, Business, Science and Arts Occupations by Sex
Within the Management, Business, Science and Arts occupations in Pittsfield, the most male-oriented occupations are Computers & Mathematics (91.0%), Architecture & Engineering (82.6%), and Computers, Engineering & Science (77.7%), while the most female-oriented occupations are Health Technologists (79.9%), Health Diagnosing & Treating (78.6%), and Life, Physical & Social Science (78.0%).
| Occupation | Male | Female |
| Management | 1,311 (56.0%) | 1,029 (44.0%) |
| Business & Financial | 393 (44.5%) | 490 (55.5%) |
| Computers, Engineering & Science | 1,081 (77.7%) | 311 (22.3%) |
| Computers & Mathematics | 686 (91.0%) | 68 (9.0%) |
| Architecture & Engineering | 347 (82.6%) | 73 (17.4%) |
| Life, Physical & Social Science | 48 (22.0%) | 170 (78.0%) |
| Community & Social Service | 969 (32.8%) | 1,987 (67.2%) |
| Education, Arts & Media | 259 (31.6%) | 562 (68.4%) |
| Legal Services & Support | 147 (38.5%) | 235 (61.5%) |
| Education Instruction & Library | 420 (29.6%) | 999 (70.4%) |
| Arts, Media & Entertainment | 143 (42.8%) | 191 (57.2%) |
| Health Diagnosing & Treating | 413 (21.4%) | 1,515 (78.6%) |
| Health Technologists | 273 (20.1%) | 1,085 (79.9%) |
| Total (Category) | 4,167 (43.9%) | 5,332 (56.1%) |
| Total (Overall) | 10,883 (49.5%) | 11,087 (50.5%) |
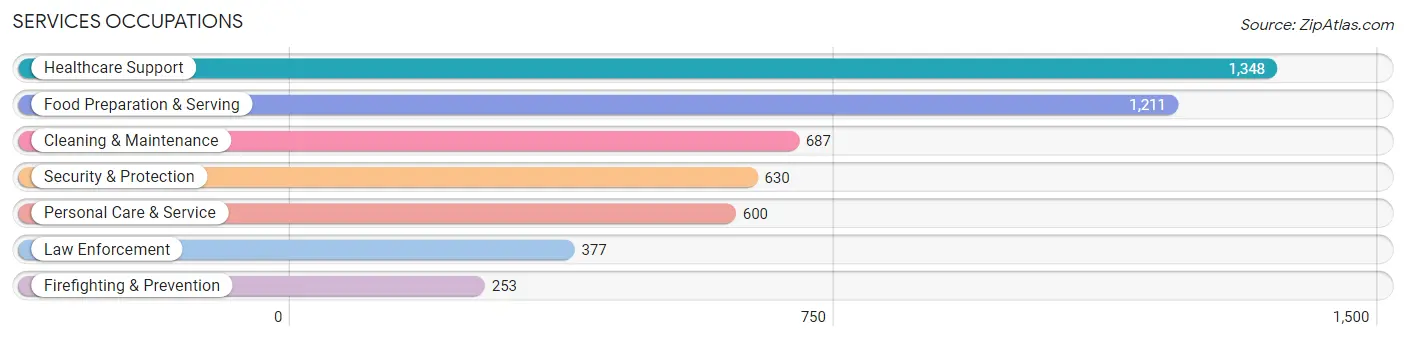
Services Occupations
The most common Services occupations in Pittsfield are Healthcare Support (1,348 | 6.1%), Food Preparation & Serving (1,211 | 5.5%), Cleaning & Maintenance (687 | 3.1%), Security & Protection (630 | 2.9%), and Personal Care & Service (600 | 2.7%).
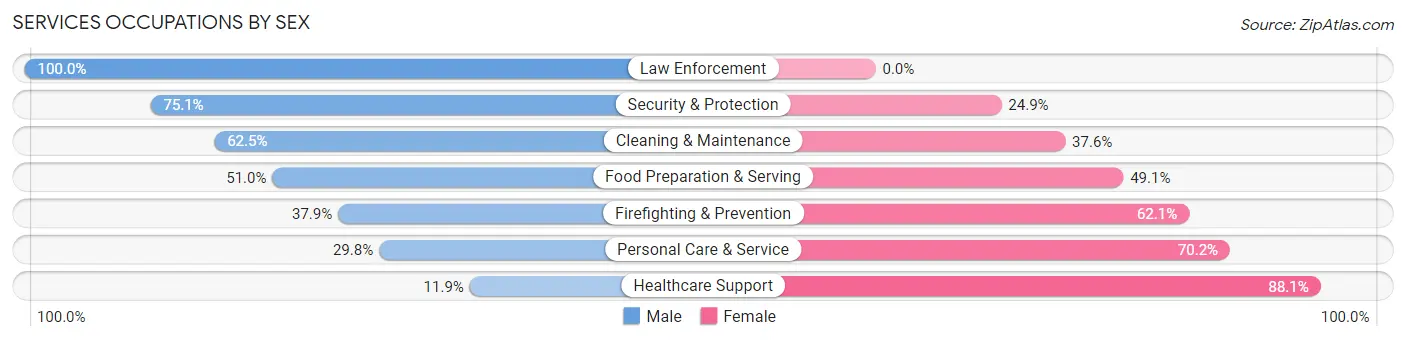
Services Occupations by Sex
Within the Services occupations in Pittsfield, the most male-oriented occupations are Law Enforcement (100.0%), Security & Protection (75.1%), and Cleaning & Maintenance (62.5%), while the most female-oriented occupations are Healthcare Support (88.1%), Personal Care & Service (70.2%), and Firefighting & Prevention (62.1%).
| Occupation | Male | Female |
| Healthcare Support | 160 (11.9%) | 1,188 (88.1%) |
| Security & Protection | 473 (75.1%) | 157 (24.9%) |
| Firefighting & Prevention | 96 (37.9%) | 157 (62.1%) |
| Law Enforcement | 377 (100.0%) | 0 (0.0%) |
| Food Preparation & Serving | 617 (50.9%) | 594 (49.0%) |
| Cleaning & Maintenance | 429 (62.5%) | 258 (37.6%) |
| Personal Care & Service | 179 (29.8%) | 421 (70.2%) |
| Total (Category) | 1,858 (41.5%) | 2,618 (58.5%) |
| Total (Overall) | 10,883 (49.5%) | 11,087 (50.5%) |
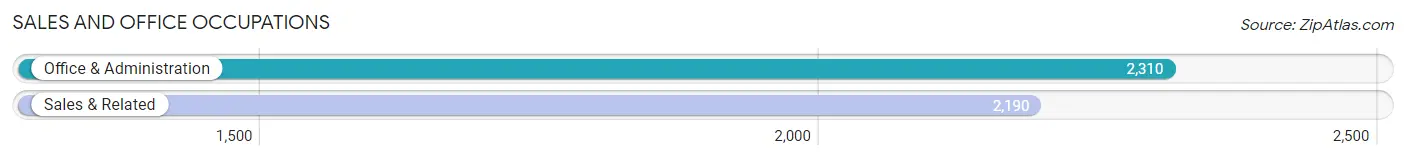
Sales and Office Occupations
The most common Sales and Office occupations in Pittsfield are Office & Administration (2,310 | 10.5%), and Sales & Related (2,190 | 10.0%).
Sales and Office Occupations by Sex
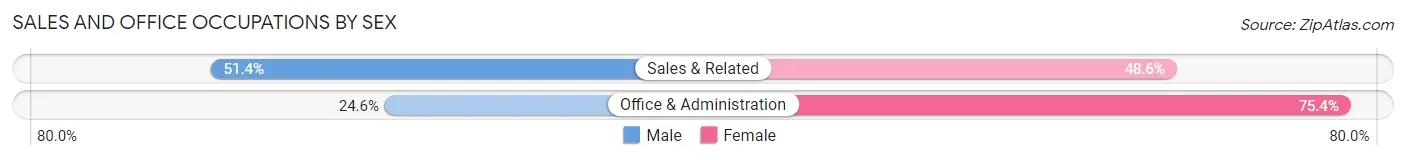
| Occupation | Male | Female |
| Sales & Related | 1,125 (51.4%) | 1,065 (48.6%) |
| Office & Administration | 568 (24.6%) | 1,742 (75.4%) |
| Total (Category) | 1,693 (37.6%) | 2,807 (62.4%) |
| Total (Overall) | 10,883 (49.5%) | 11,087 (50.5%) |
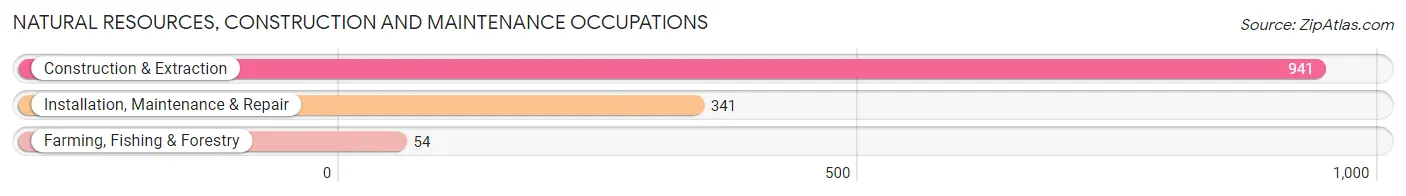
Natural Resources, Construction and Maintenance Occupations
The most common Natural Resources, Construction and Maintenance occupations in Pittsfield are Construction & Extraction (941 | 4.3%), Installation, Maintenance & Repair (341 | 1.5%), and Farming, Fishing & Forestry (54 | 0.3%).
Natural Resources, Construction and Maintenance Occupations by Sex
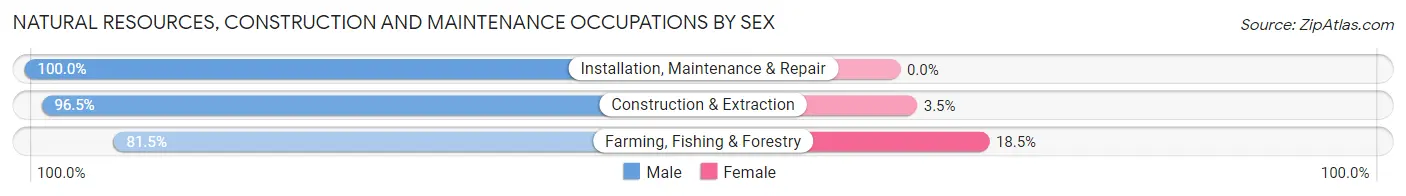
| Occupation | Male | Female |
| Farming, Fishing & Forestry | 44 (81.5%) | 10 (18.5%) |
| Construction & Extraction | 908 (96.5%) | 33 (3.5%) |
| Installation, Maintenance & Repair | 341 (100.0%) | 0 (0.0%) |
| Total (Category) | 1,293 (96.8%) | 43 (3.2%) |
| Total (Overall) | 10,883 (49.5%) | 11,087 (50.5%) |
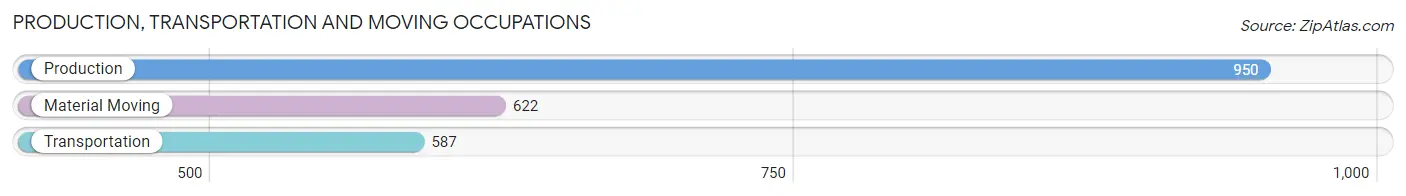
Production, Transportation and Moving Occupations
The most common Production, Transportation and Moving occupations in Pittsfield are Production (950 | 4.3%), Material Moving (622 | 2.8%), and Transportation (587 | 2.7%).
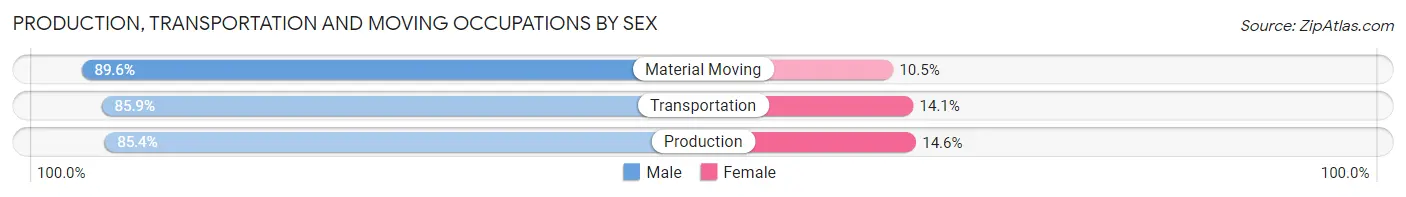
Production, Transportation and Moving Occupations by Sex
| Occupation | Male | Female |
| Production | 811 (85.4%) | 139 (14.6%) |
| Transportation | 504 (85.9%) | 83 (14.1%) |
| Material Moving | 557 (89.5%) | 65 (10.4%) |
| Total (Category) | 1,872 (86.7%) | 287 (13.3%) |
| Total (Overall) | 10,883 (49.5%) | 11,087 (50.5%) |
Employment Industries by Sex in Pittsfield
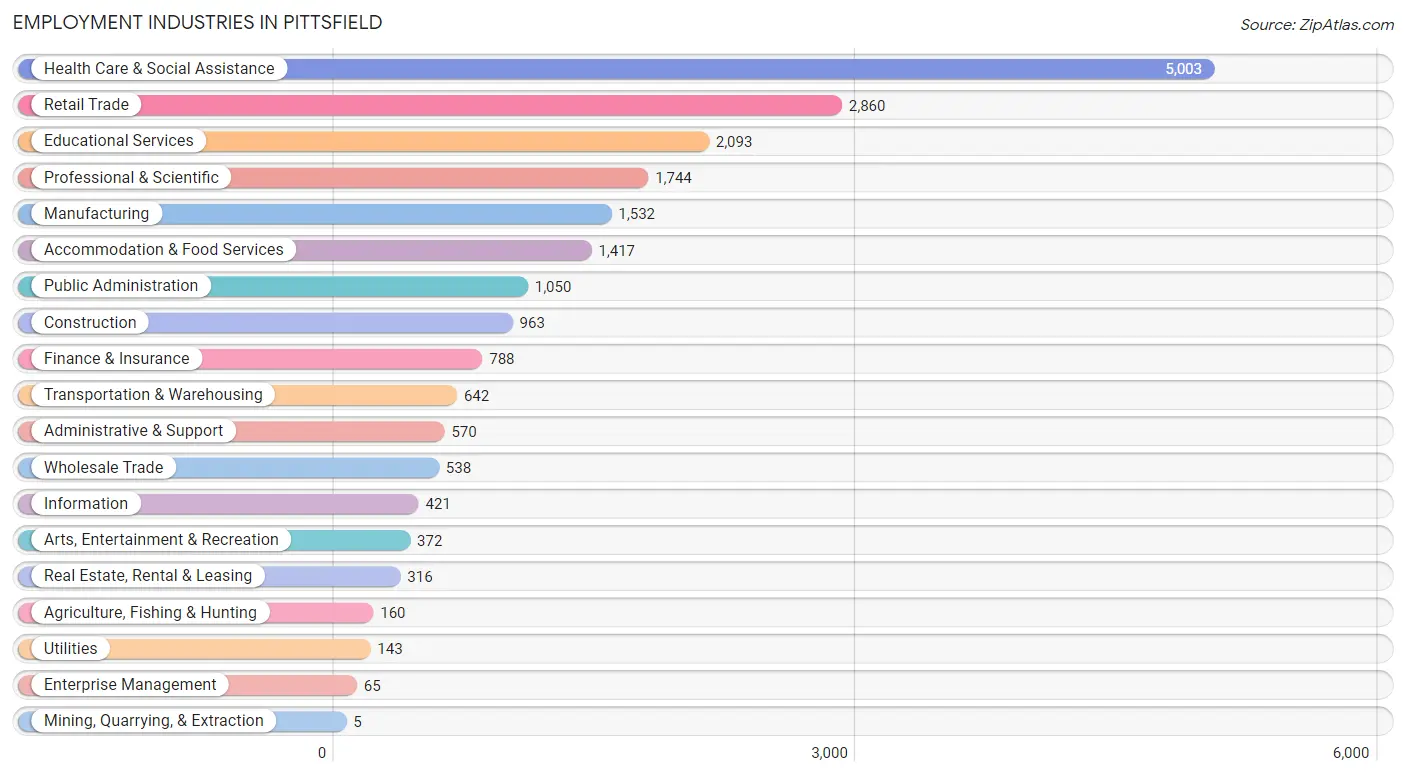
Employment Industries in Pittsfield
The major employment industries in Pittsfield include Health Care & Social Assistance (5,003 | 22.8%), Retail Trade (2,860 | 13.0%), Educational Services (2,093 | 9.5%), Professional & Scientific (1,744 | 7.9%), and Manufacturing (1,532 | 7.0%).
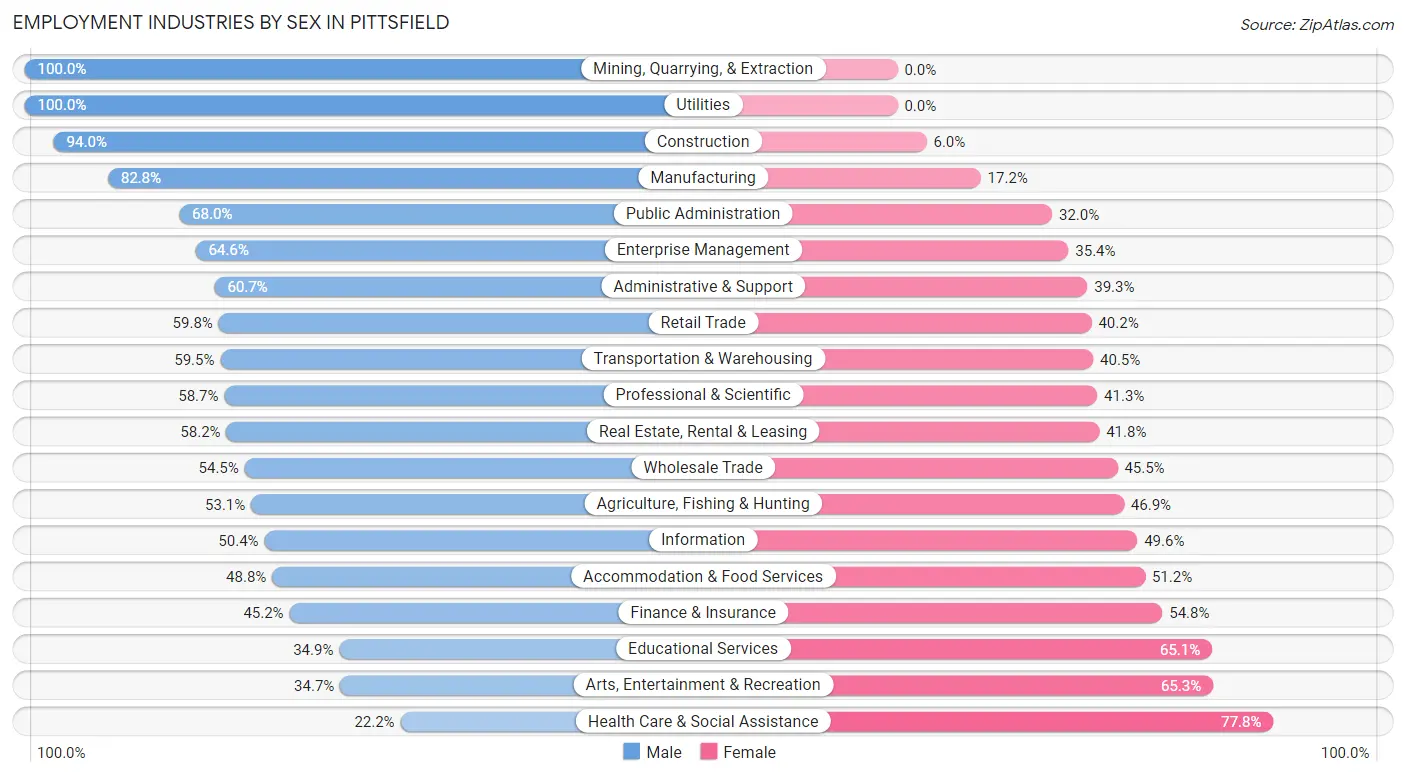
Employment Industries by Sex in Pittsfield
The Pittsfield industries that see more men than women are Mining, Quarrying, & Extraction (100.0%), Utilities (100.0%), and Construction (94.0%), whereas the industries that tend to have a higher number of women are Health Care & Social Assistance (77.8%), Arts, Entertainment & Recreation (65.3%), and Educational Services (65.1%).
| Industry | Male | Female |
| Agriculture, Fishing & Hunting | 85 (53.1%) | 75 (46.9%) |
| Mining, Quarrying, & Extraction | 5 (100.0%) | 0 (0.0%) |
| Construction | 905 (94.0%) | 58 (6.0%) |
| Manufacturing | 1,268 (82.8%) | 264 (17.2%) |
| Wholesale Trade | 293 (54.5%) | 245 (45.5%) |
| Retail Trade | 1,711 (59.8%) | 1,149 (40.2%) |
| Transportation & Warehousing | 382 (59.5%) | 260 (40.5%) |
| Utilities | 143 (100.0%) | 0 (0.0%) |
| Information | 212 (50.4%) | 209 (49.6%) |
| Finance & Insurance | 356 (45.2%) | 432 (54.8%) |
| Real Estate, Rental & Leasing | 184 (58.2%) | 132 (41.8%) |
| Professional & Scientific | 1,023 (58.7%) | 721 (41.3%) |
| Enterprise Management | 42 (64.6%) | 23 (35.4%) |
| Administrative & Support | 346 (60.7%) | 224 (39.3%) |
| Educational Services | 730 (34.9%) | 1,363 (65.1%) |
| Health Care & Social Assistance | 1,111 (22.2%) | 3,892 (77.8%) |
| Arts, Entertainment & Recreation | 129 (34.7%) | 243 (65.3%) |
| Accommodation & Food Services | 691 (48.8%) | 726 (51.2%) |
| Public Administration | 714 (68.0%) | 336 (32.0%) |
| Total | 10,883 (49.5%) | 11,087 (50.5%) |
Education in Pittsfield
School Enrollment in Pittsfield
The most common levels of schooling among the 8,656 students in Pittsfield are high school (1,999 | 23.1%), college / undergraduate (1,968 | 22.7%), and elementary school (1,756 | 20.3%).
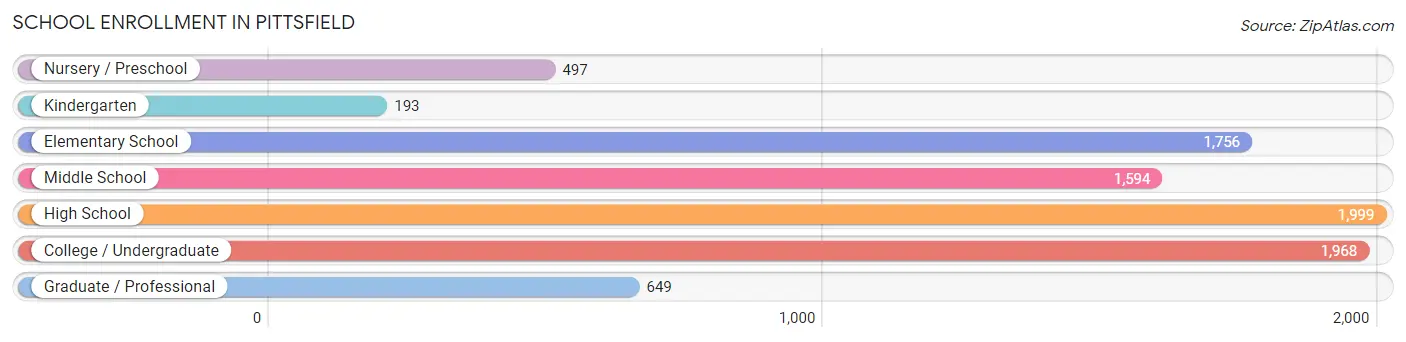
| School Level | # Students | % Students |
| Nursery / Preschool | 497 | 5.7% |
| Kindergarten | 193 | 2.2% |
| Elementary School | 1,756 | 20.3% |
| Middle School | 1,594 | 18.4% |
| High School | 1,999 | 23.1% |
| College / Undergraduate | 1,968 | 22.7% |
| Graduate / Professional | 649 | 7.5% |
| Total | 8,656 | 100.0% |
School Enrollment by Age by Funding Source in Pittsfield
Out of a total of 8,656 students who are enrolled in schools in Pittsfield, 1,298 (15.0%) attend a private institution, while the remaining 7,358 (85.0%) are enrolled in public schools. The age group of 3 to 4 year olds has the highest likelihood of being enrolled in private schools, with 191 (51.3% in the age bracket) enrolled. Conversely, the age group of 10 to 14 year olds has the lowest likelihood of being enrolled in a private school, with 2,034 (95.7% in the age bracket) attending a public institution.
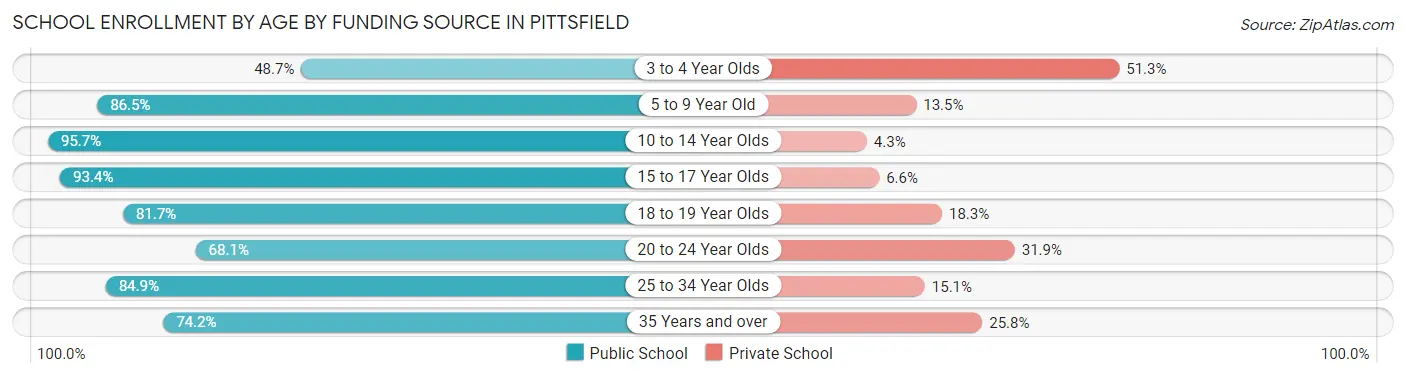
| Age Bracket | Public School | Private School |
| 3 to 4 Year Olds | 181 (48.7%) | 191 (51.3%) |
| 5 to 9 Year Old | 1,655 (86.5%) | 259 (13.5%) |
| 10 to 14 Year Olds | 2,034 (95.7%) | 92 (4.3%) |
| 15 to 17 Year Olds | 1,241 (93.4%) | 88 (6.6%) |
| 18 to 19 Year Olds | 544 (81.7%) | 122 (18.3%) |
| 20 to 24 Year Olds | 511 (68.1%) | 239 (31.9%) |
| 25 to 34 Year Olds | 651 (84.9%) | 116 (15.1%) |
| 35 Years and over | 543 (74.2%) | 189 (25.8%) |
| Total | 7,358 (85.0%) | 1,298 (15.0%) |
Educational Attainment by Field of Study in Pittsfield
Business (1,850 | 14.9%), science & technology (1,350 | 10.9%), social sciences (1,318 | 10.6%), education (1,301 | 10.5%), and bio, nature & agricultural (961 | 7.8%) are the most common fields of study among 12,385 individuals in Pittsfield who have obtained a bachelor's degree or higher.
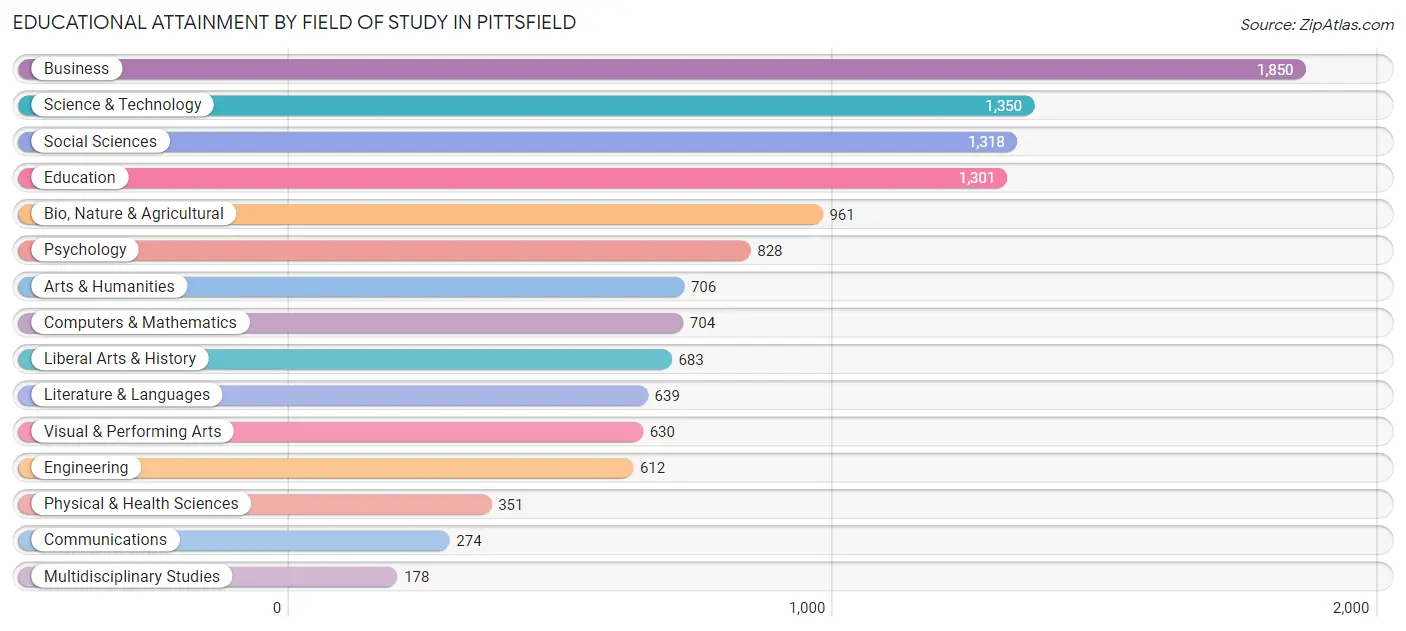
| Field of Study | # Graduates | % Graduates |
| Computers & Mathematics | 704 | 5.7% |
| Bio, Nature & Agricultural | 961 | 7.8% |
| Physical & Health Sciences | 351 | 2.8% |
| Psychology | 828 | 6.7% |
| Social Sciences | 1,318 | 10.6% |
| Engineering | 612 | 4.9% |
| Multidisciplinary Studies | 178 | 1.4% |
| Science & Technology | 1,350 | 10.9% |
| Business | 1,850 | 14.9% |
| Education | 1,301 | 10.5% |
| Literature & Languages | 639 | 5.2% |
| Liberal Arts & History | 683 | 5.5% |
| Visual & Performing Arts | 630 | 5.1% |
| Communications | 274 | 2.2% |
| Arts & Humanities | 706 | 5.7% |
| Total | 12,385 | 100.0% |
Transportation & Commute in Pittsfield
Vehicle Availability by Sex in Pittsfield
The most prevalent vehicle ownership categories in Pittsfield are males with 2 vehicles (4,583, accounting for 43.2%) and females with 2 vehicles (4,297, making up 43.8%).
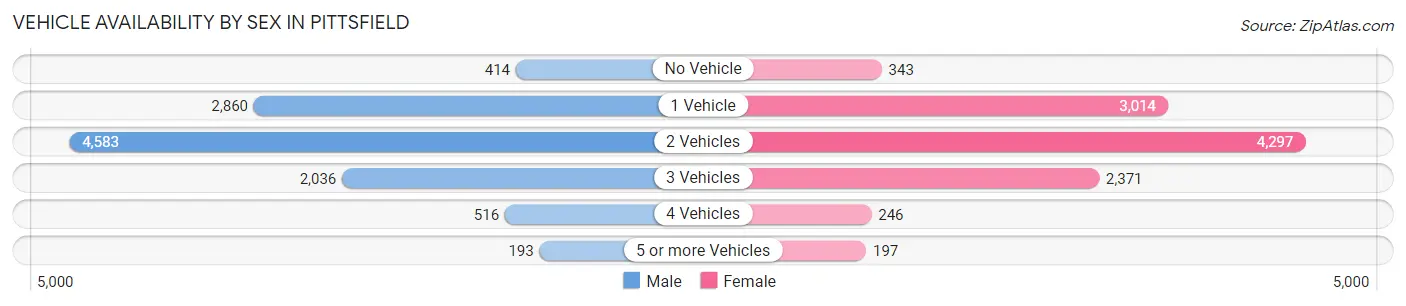
| Vehicles Available | Male | Female |
| No Vehicle | 414 (3.9%) | 343 (3.3%) |
| 1 Vehicle | 2,860 (27.0%) | 3,014 (28.8%) |
| 2 Vehicles | 4,583 (43.2%) | 4,297 (41.0%) |
| 3 Vehicles | 2,036 (19.2%) | 2,371 (22.7%) |
| 4 Vehicles | 516 (4.9%) | 246 (2.4%) |
| 5 or more Vehicles | 193 (1.8%) | 197 (1.9%) |
| Total | 10,602 (100.0%) | 10,468 (100.0%) |
Commute Time in Pittsfield
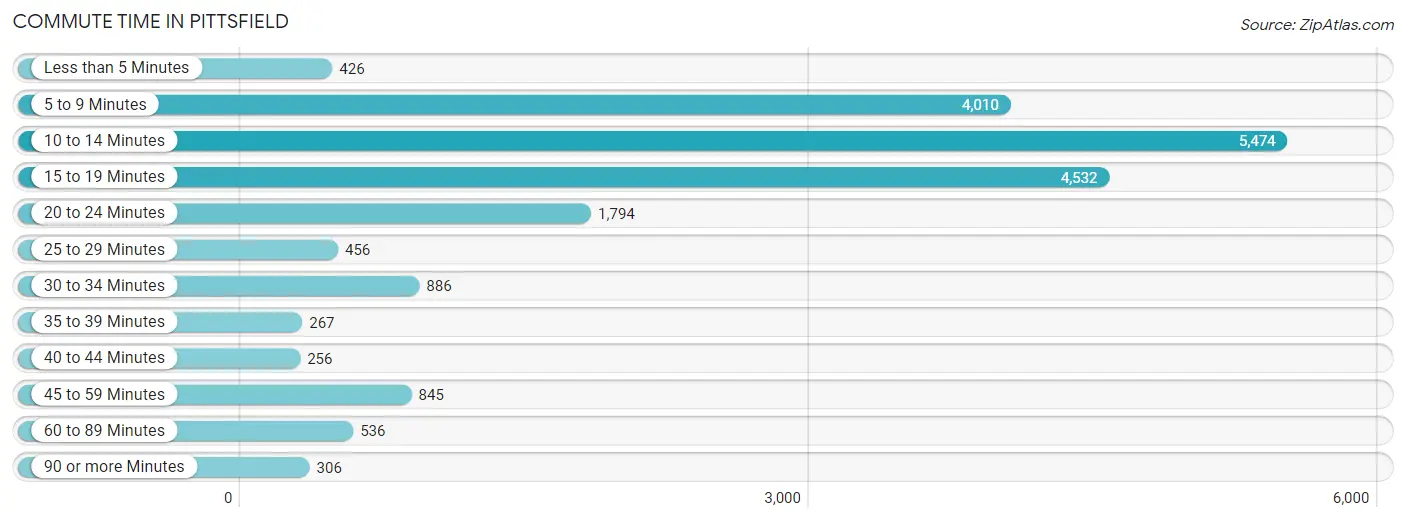
The most frequently occuring commute durations in Pittsfield are 10 to 14 minutes (5,474 commuters, 27.7%), 15 to 19 minutes (4,532 commuters, 22.9%), and 5 to 9 minutes (4,010 commuters, 20.3%).
| Commute Time | # Commuters | % Commuters |
| Less than 5 Minutes | 426 | 2.1% |
| 5 to 9 Minutes | 4,010 | 20.3% |
| 10 to 14 Minutes | 5,474 | 27.7% |
| 15 to 19 Minutes | 4,532 | 22.9% |
| 20 to 24 Minutes | 1,794 | 9.1% |
| 25 to 29 Minutes | 456 | 2.3% |
| 30 to 34 Minutes | 886 | 4.5% |
| 35 to 39 Minutes | 267 | 1.3% |
| 40 to 44 Minutes | 256 | 1.3% |
| 45 to 59 Minutes | 845 | 4.3% |
| 60 to 89 Minutes | 536 | 2.7% |
| 90 or more Minutes | 306 | 1.5% |
Commute Time by Sex in Pittsfield
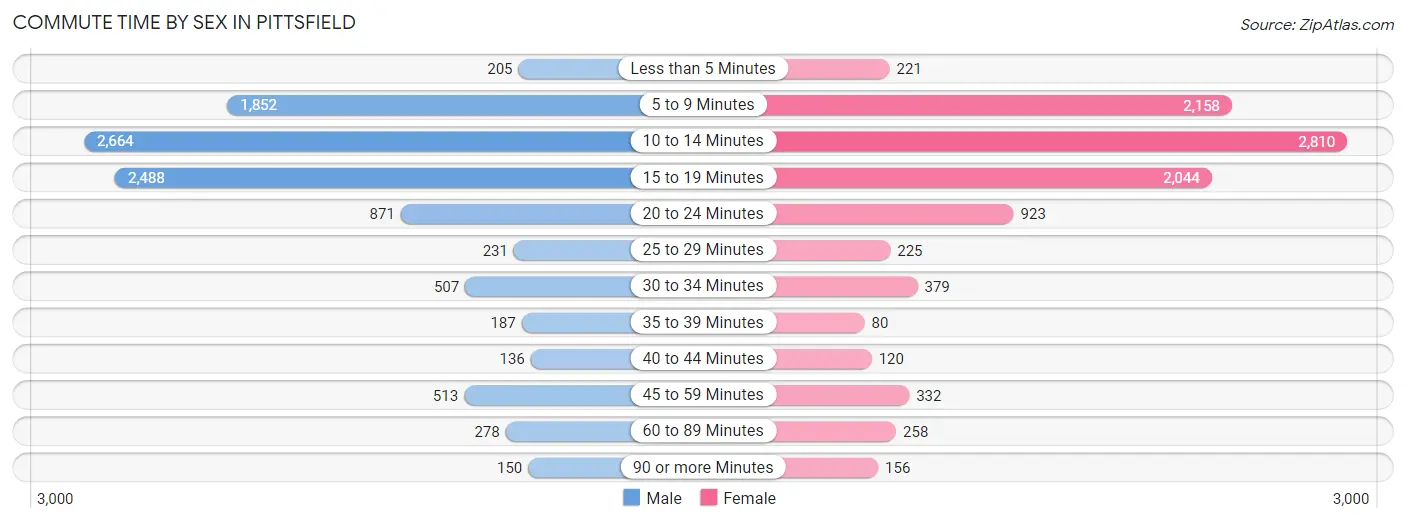
The most common commute times in Pittsfield are 10 to 14 minutes (2,664 commuters, 26.4%) for males and 10 to 14 minutes (2,810 commuters, 28.9%) for females.
| Commute Time | Male | Female |
| Less than 5 Minutes | 205 (2.0%) | 221 (2.3%) |
| 5 to 9 Minutes | 1,852 (18.4%) | 2,158 (22.2%) |
| 10 to 14 Minutes | 2,664 (26.4%) | 2,810 (28.9%) |
| 15 to 19 Minutes | 2,488 (24.7%) | 2,044 (21.1%) |
| 20 to 24 Minutes | 871 (8.6%) | 923 (9.5%) |
| 25 to 29 Minutes | 231 (2.3%) | 225 (2.3%) |
| 30 to 34 Minutes | 507 (5.0%) | 379 (3.9%) |
| 35 to 39 Minutes | 187 (1.8%) | 80 (0.8%) |
| 40 to 44 Minutes | 136 (1.3%) | 120 (1.2%) |
| 45 to 59 Minutes | 513 (5.1%) | 332 (3.4%) |
| 60 to 89 Minutes | 278 (2.8%) | 258 (2.7%) |
| 90 or more Minutes | 150 (1.5%) | 156 (1.6%) |
Time of Departure to Work by Sex in Pittsfield
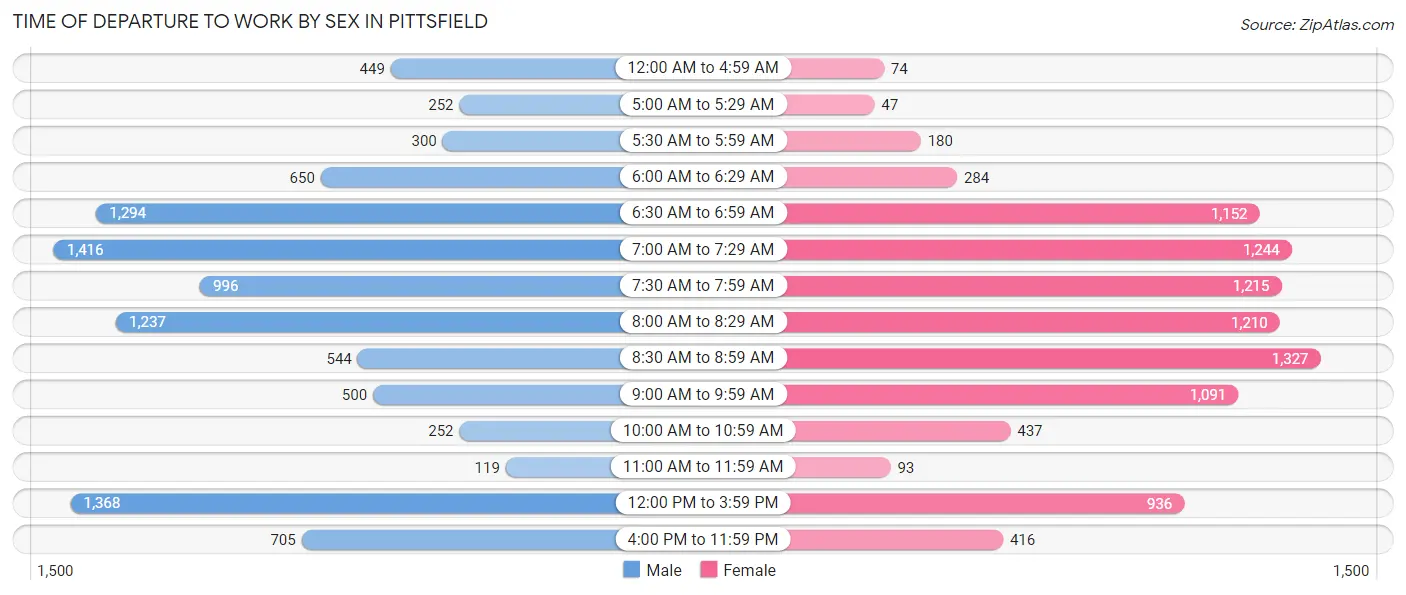
The most frequent times of departure to work in Pittsfield are 7:00 AM to 7:29 AM (1,416, 14.0%) for males and 8:30 AM to 8:59 AM (1,327, 13.7%) for females.
| Time of Departure | Male | Female |
| 12:00 AM to 4:59 AM | 449 (4.4%) | 74 (0.8%) |
| 5:00 AM to 5:29 AM | 252 (2.5%) | 47 (0.5%) |
| 5:30 AM to 5:59 AM | 300 (3.0%) | 180 (1.8%) |
| 6:00 AM to 6:29 AM | 650 (6.5%) | 284 (2.9%) |
| 6:30 AM to 6:59 AM | 1,294 (12.8%) | 1,152 (11.9%) |
| 7:00 AM to 7:29 AM | 1,416 (14.0%) | 1,244 (12.8%) |
| 7:30 AM to 7:59 AM | 996 (9.9%) | 1,215 (12.5%) |
| 8:00 AM to 8:29 AM | 1,237 (12.3%) | 1,210 (12.5%) |
| 8:30 AM to 8:59 AM | 544 (5.4%) | 1,327 (13.7%) |
| 9:00 AM to 9:59 AM | 500 (5.0%) | 1,091 (11.2%) |
| 10:00 AM to 10:59 AM | 252 (2.5%) | 437 (4.5%) |
| 11:00 AM to 11:59 AM | 119 (1.2%) | 93 (1.0%) |
| 12:00 PM to 3:59 PM | 1,368 (13.6%) | 936 (9.6%) |
| 4:00 PM to 11:59 PM | 705 (7.0%) | 416 (4.3%) |
| Total | 10,082 (100.0%) | 9,706 (100.0%) |
Housing Occupancy in Pittsfield
Occupancy by Ownership in Pittsfield
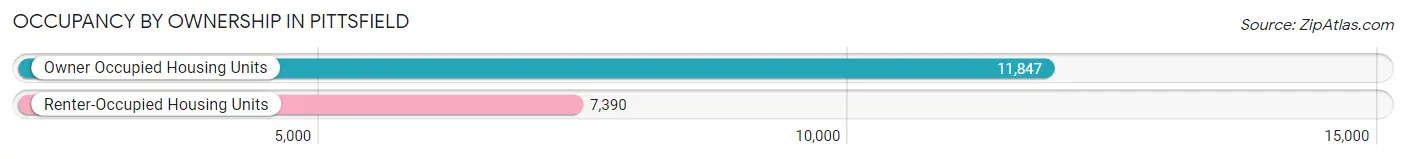
Of the total 19,237 dwellings in Pittsfield, owner-occupied units account for 11,847 (61.6%), while renter-occupied units make up 7,390 (38.4%).
| Occupancy | # Housing Units | % Housing Units |
| Owner Occupied Housing Units | 11,847 | 61.6% |
| Renter-Occupied Housing Units | 7,390 | 38.4% |
| Total Occupied Housing Units | 19,237 | 100.0% |
Occupancy by Household Size in Pittsfield
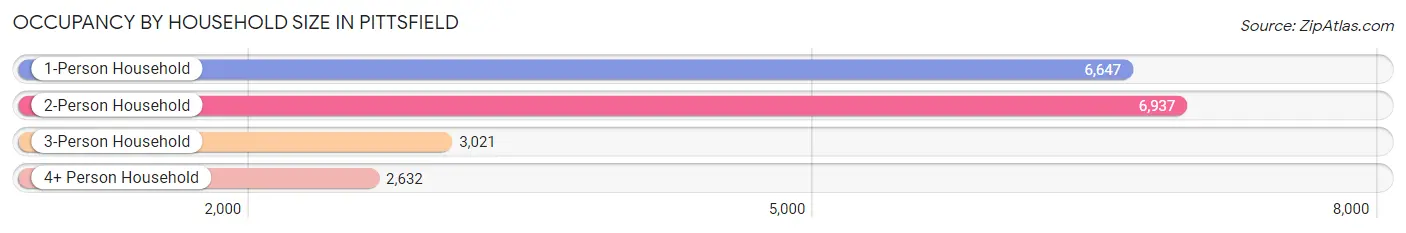
| Household Size | # Housing Units | % Housing Units |
| 1-Person Household | 6,647 | 34.5% |
| 2-Person Household | 6,937 | 36.1% |
| 3-Person Household | 3,021 | 15.7% |
| 4+ Person Household | 2,632 | 13.7% |
| Total Housing Units | 19,237 | 100.0% |
Occupancy by Ownership by Household Size in Pittsfield
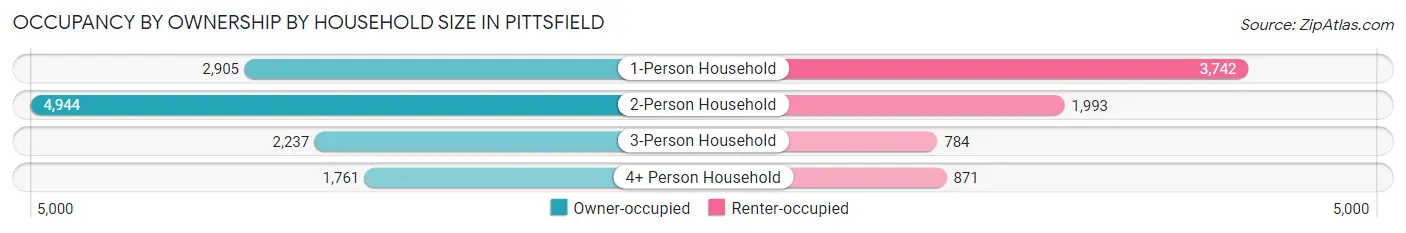
| Household Size | Owner-occupied | Renter-occupied |
| 1-Person Household | 2,905 (43.7%) | 3,742 (56.3%) |
| 2-Person Household | 4,944 (71.3%) | 1,993 (28.7%) |
| 3-Person Household | 2,237 (74.1%) | 784 (26.0%) |
| 4+ Person Household | 1,761 (66.9%) | 871 (33.1%) |
| Total Housing Units | 11,847 (61.6%) | 7,390 (38.4%) |
Occupancy by Educational Attainment in Pittsfield
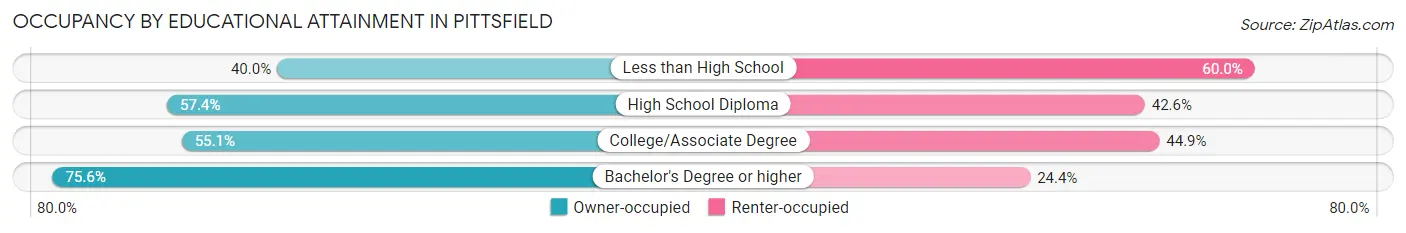
| Household Size | Owner-occupied | Renter-occupied |
| Less than High School | 482 (40.0%) | 724 (60.0%) |
| High School Diploma | 2,934 (57.4%) | 2,178 (42.6%) |
| College/Associate Degree | 3,581 (55.1%) | 2,920 (44.9%) |
| Bachelor's Degree or higher | 4,850 (75.6%) | 1,568 (24.4%) |
Occupancy by Age of Householder in Pittsfield
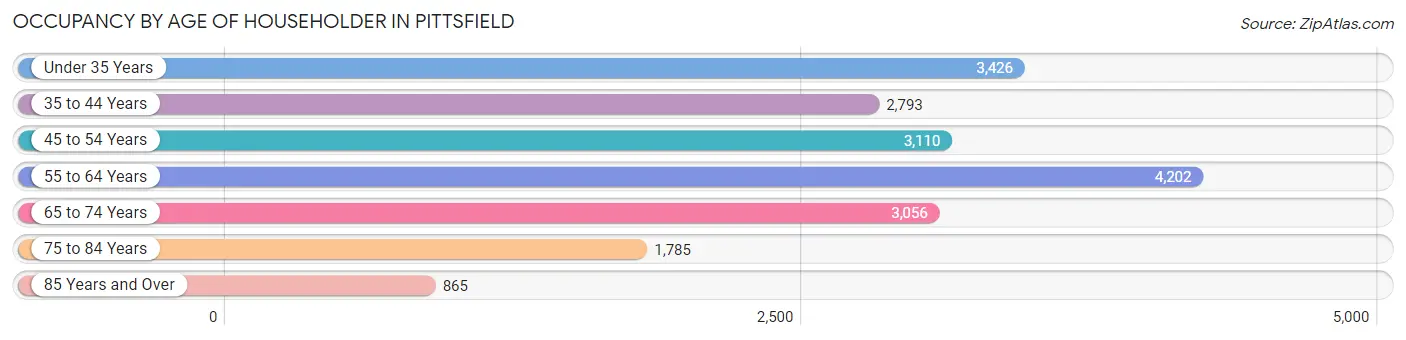
| Age Bracket | # Households | % Households |
| Under 35 Years | 3,426 | 17.8% |
| 35 to 44 Years | 2,793 | 14.5% |
| 45 to 54 Years | 3,110 | 16.2% |
| 55 to 64 Years | 4,202 | 21.8% |
| 65 to 74 Years | 3,056 | 15.9% |
| 75 to 84 Years | 1,785 | 9.3% |
| 85 Years and Over | 865 | 4.5% |
| Total | 19,237 | 100.0% |
Housing Finances in Pittsfield
Median Income by Occupancy in Pittsfield
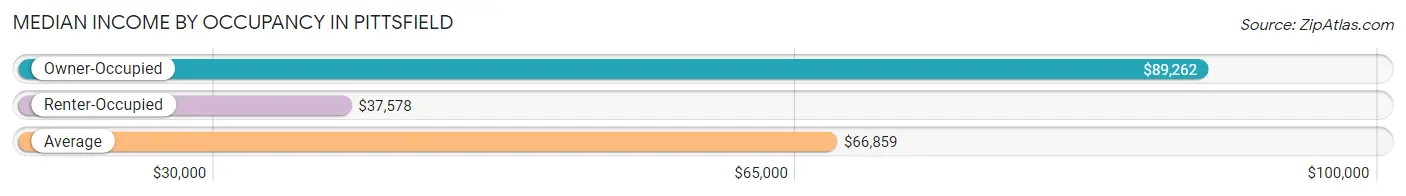
| Occupancy Type | # Households | Median Income |
| Owner-Occupied | 11,847 (61.6%) | $89,262 |
| Renter-Occupied | 7,390 (38.4%) | $37,578 |
| Average | 19,237 (100.0%) | $66,859 |
Occupancy by Householder Income Bracket in Pittsfield
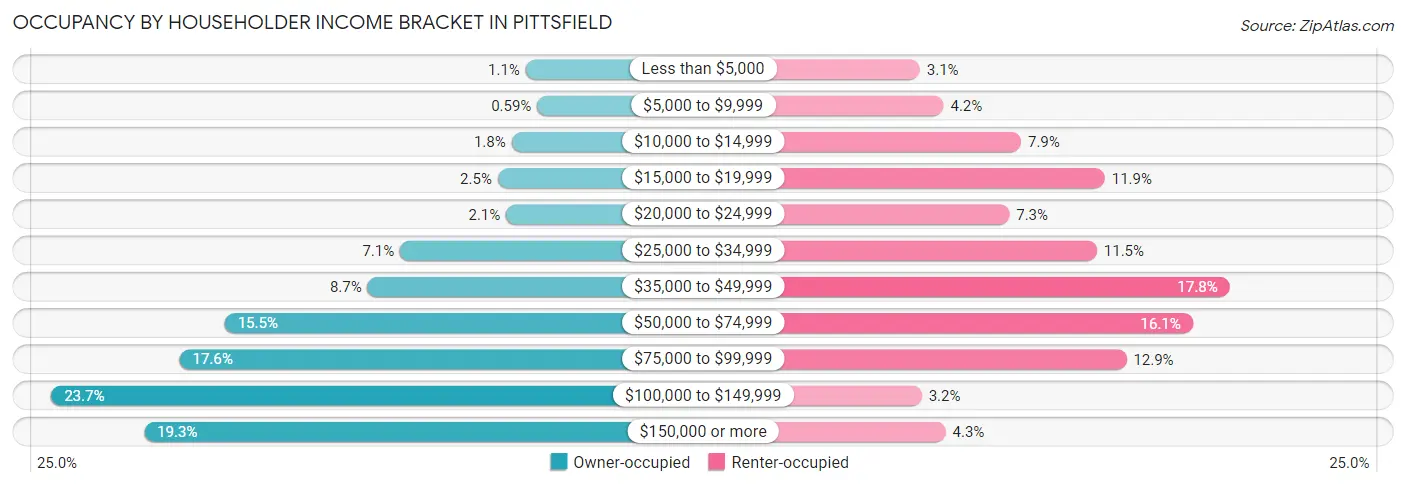
| Income Bracket | Owner-occupied | Renter-occupied |
| Less than $5,000 | 135 (1.1%) | 226 (3.1%) |
| $5,000 to $9,999 | 70 (0.6%) | 310 (4.2%) |
| $10,000 to $14,999 | 215 (1.8%) | 582 (7.9%) |
| $15,000 to $19,999 | 293 (2.5%) | 877 (11.9%) |
| $20,000 to $24,999 | 245 (2.1%) | 541 (7.3%) |
| $25,000 to $34,999 | 843 (7.1%) | 849 (11.5%) |
| $35,000 to $49,999 | 1,027 (8.7%) | 1,316 (17.8%) |
| $50,000 to $74,999 | 1,833 (15.5%) | 1,186 (16.1%) |
| $75,000 to $99,999 | 2,087 (17.6%) | 953 (12.9%) |
| $100,000 to $149,999 | 2,811 (23.7%) | 233 (3.2%) |
| $150,000 or more | 2,288 (19.3%) | 317 (4.3%) |
| Total | 11,847 (100.0%) | 7,390 (100.0%) |
Monthly Housing Cost Tiers in Pittsfield
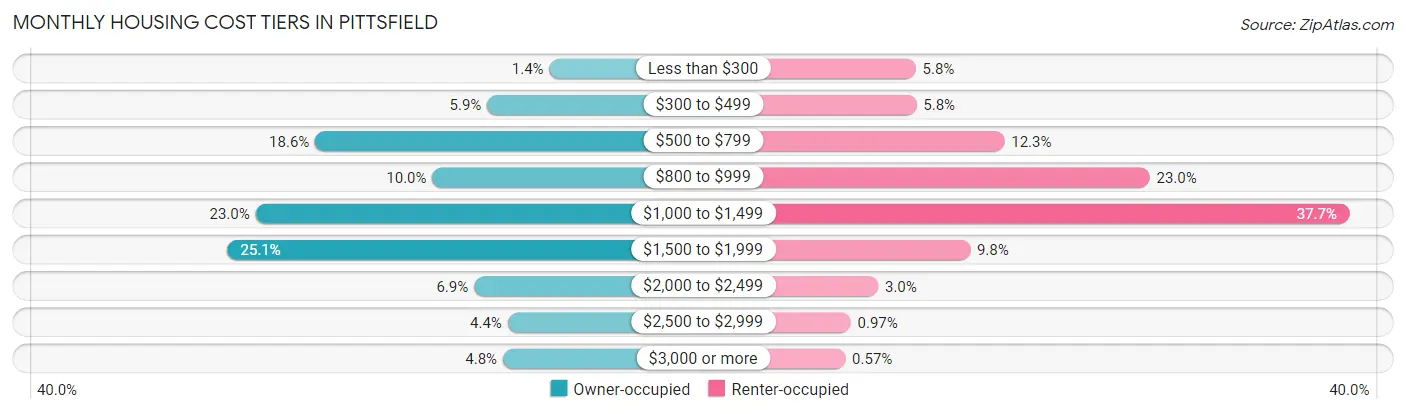
| Monthly Cost | Owner-occupied | Renter-occupied |
| Less than $300 | 160 (1.3%) | 426 (5.8%) |
| $300 to $499 | 703 (5.9%) | 429 (5.8%) |
| $500 to $799 | 2,204 (18.6%) | 908 (12.3%) |
| $800 to $999 | 1,181 (10.0%) | 1,699 (23.0%) |
| $1,000 to $1,499 | 2,724 (23.0%) | 2,783 (37.7%) |
| $1,500 to $1,999 | 2,969 (25.1%) | 721 (9.8%) |
| $2,000 to $2,499 | 817 (6.9%) | 221 (3.0%) |
| $2,500 to $2,999 | 524 (4.4%) | 72 (1.0%) |
| $3,000 or more | 565 (4.8%) | 42 (0.6%) |
| Total | 11,847 (100.0%) | 7,390 (100.0%) |
Physical Housing Characteristics in Pittsfield
Housing Structures in Pittsfield
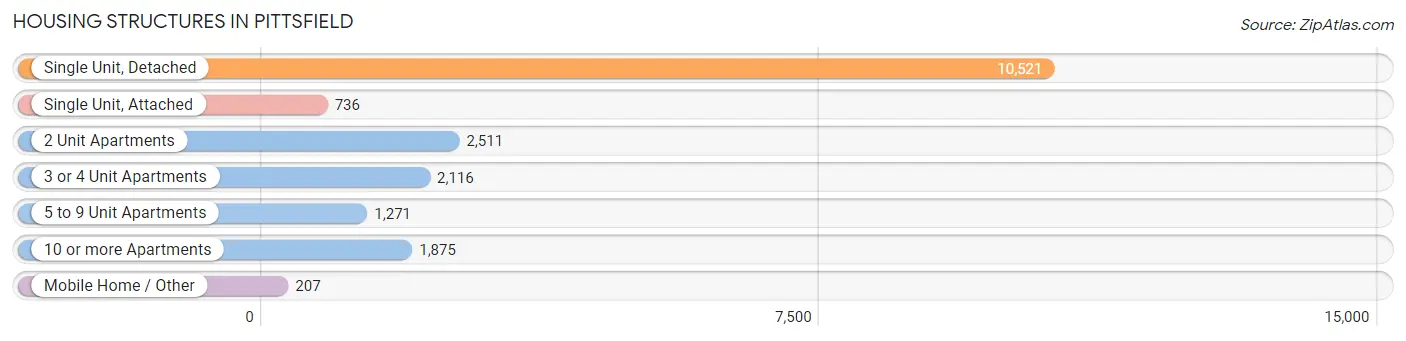
| Structure Type | # Housing Units | % Housing Units |
| Single Unit, Detached | 10,521 | 54.7% |
| Single Unit, Attached | 736 | 3.8% |
| 2 Unit Apartments | 2,511 | 13.1% |
| 3 or 4 Unit Apartments | 2,116 | 11.0% |
| 5 to 9 Unit Apartments | 1,271 | 6.6% |
| 10 or more Apartments | 1,875 | 9.8% |
| Mobile Home / Other | 207 | 1.1% |
| Total | 19,237 | 100.0% |
Housing Structures by Occupancy in Pittsfield
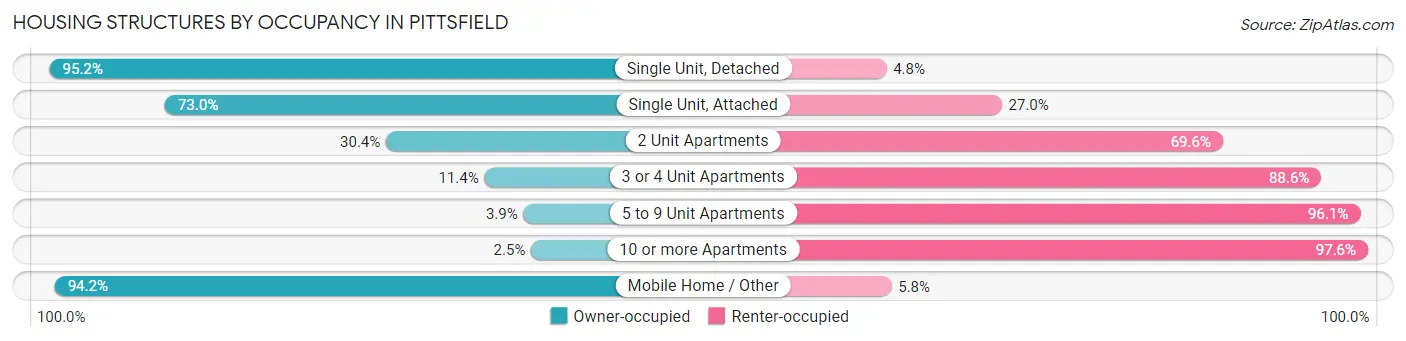
| Structure Type | Owner-occupied | Renter-occupied |
| Single Unit, Detached | 10,014 (95.2%) | 507 (4.8%) |
| Single Unit, Attached | 537 (73.0%) | 199 (27.0%) |
| 2 Unit Apartments | 763 (30.4%) | 1,748 (69.6%) |
| 3 or 4 Unit Apartments | 242 (11.4%) | 1,874 (88.6%) |
| 5 to 9 Unit Apartments | 50 (3.9%) | 1,221 (96.1%) |
| 10 or more Apartments | 46 (2.5%) | 1,829 (97.6%) |
| Mobile Home / Other | 195 (94.2%) | 12 (5.8%) |
| Total | 11,847 (61.6%) | 7,390 (38.4%) |
Housing Structures by Number of Rooms in Pittsfield
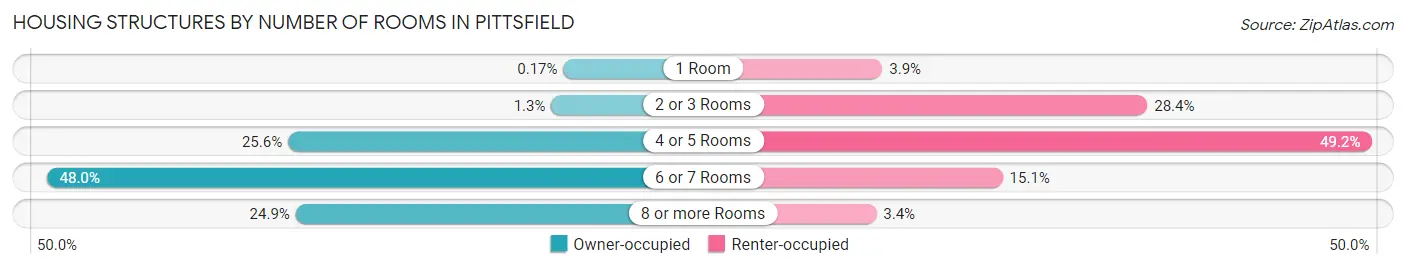
| Number of Rooms | Owner-occupied | Renter-occupied |
| 1 Room | 20 (0.2%) | 290 (3.9%) |
| 2 or 3 Rooms | 153 (1.3%) | 2,101 (28.4%) |
| 4 or 5 Rooms | 3,038 (25.6%) | 3,638 (49.2%) |
| 6 or 7 Rooms | 5,682 (48.0%) | 1,112 (15.0%) |
| 8 or more Rooms | 2,954 (24.9%) | 249 (3.4%) |
| Total | 11,847 (100.0%) | 7,390 (100.0%) |
Housing Structure by Heating Type in Pittsfield
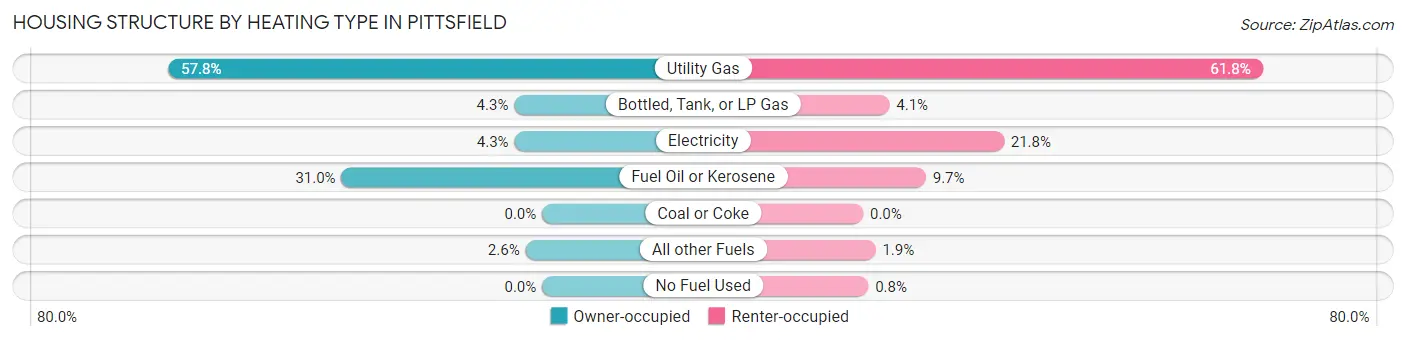
| Heating Type | Owner-occupied | Renter-occupied |
| Utility Gas | 6,849 (57.8%) | 4,563 (61.8%) |
| Bottled, Tank, or LP Gas | 511 (4.3%) | 301 (4.1%) |
| Electricity | 507 (4.3%) | 1,608 (21.8%) |
| Fuel Oil or Kerosene | 3,675 (31.0%) | 717 (9.7%) |
| Coal or Coke | 0 (0.0%) | 0 (0.0%) |
| All other Fuels | 305 (2.6%) | 142 (1.9%) |
| No Fuel Used | 0 (0.0%) | 59 (0.8%) |
| Total | 11,847 (100.0%) | 7,390 (100.0%) |
Household Vehicle Usage in Pittsfield
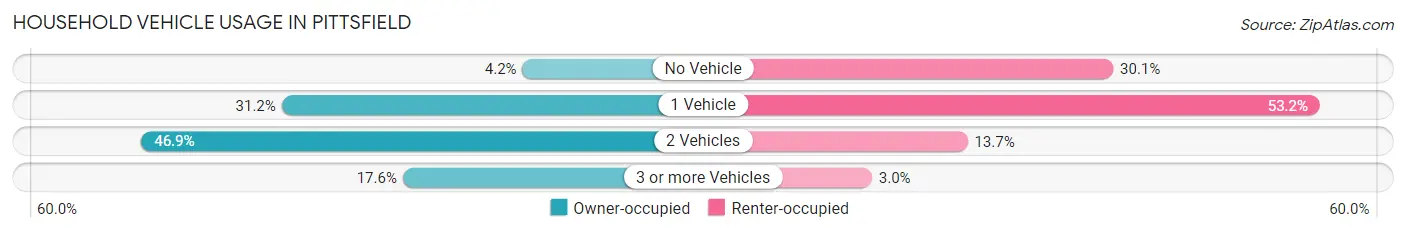
| Vehicles per Household | Owner-occupied | Renter-occupied |
| No Vehicle | 501 (4.2%) | 2,221 (30.0%) |
| 1 Vehicle | 3,697 (31.2%) | 3,931 (53.2%) |
| 2 Vehicles | 5,559 (46.9%) | 1,015 (13.7%) |
| 3 or more Vehicles | 2,090 (17.6%) | 223 (3.0%) |
| Total | 11,847 (100.0%) | 7,390 (100.0%) |
Real Estate & Mortgages in Pittsfield
Real Estate and Mortgage Overview in Pittsfield
| Characteristic | Without Mortgage | With Mortgage |
| Housing Units | 4,323 | 7,524 |
| Median Property Value | $213,200 | $224,100 |
| Median Household Income | $70,115 | $1,720 |
| Monthly Housing Costs | $705 | $544 |
| Real Estate Taxes | $3,741 | $62 |
Property Value by Mortgage Status in Pittsfield
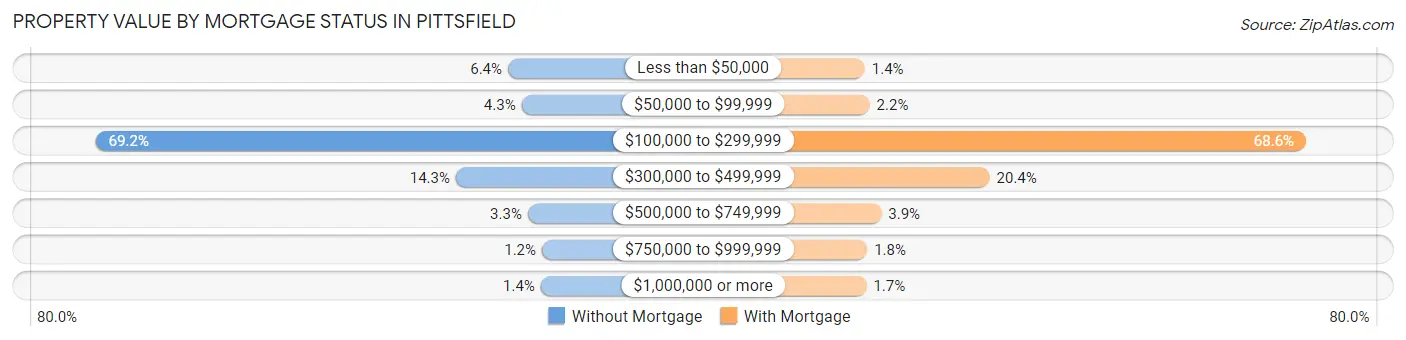
| Property Value | Without Mortgage | With Mortgage |
| Less than $50,000 | 275 (6.4%) | 107 (1.4%) |
| $50,000 to $99,999 | 185 (4.3%) | 162 (2.1%) |
| $100,000 to $299,999 | 2,991 (69.2%) | 5,163 (68.6%) |
| $300,000 to $499,999 | 618 (14.3%) | 1,537 (20.4%) |
| $500,000 to $749,999 | 144 (3.3%) | 296 (3.9%) |
| $750,000 to $999,999 | 51 (1.2%) | 134 (1.8%) |
| $1,000,000 or more | 59 (1.4%) | 125 (1.7%) |
| Total | 4,323 (100.0%) | 7,524 (100.0%) |
Household Income by Mortgage Status in Pittsfield
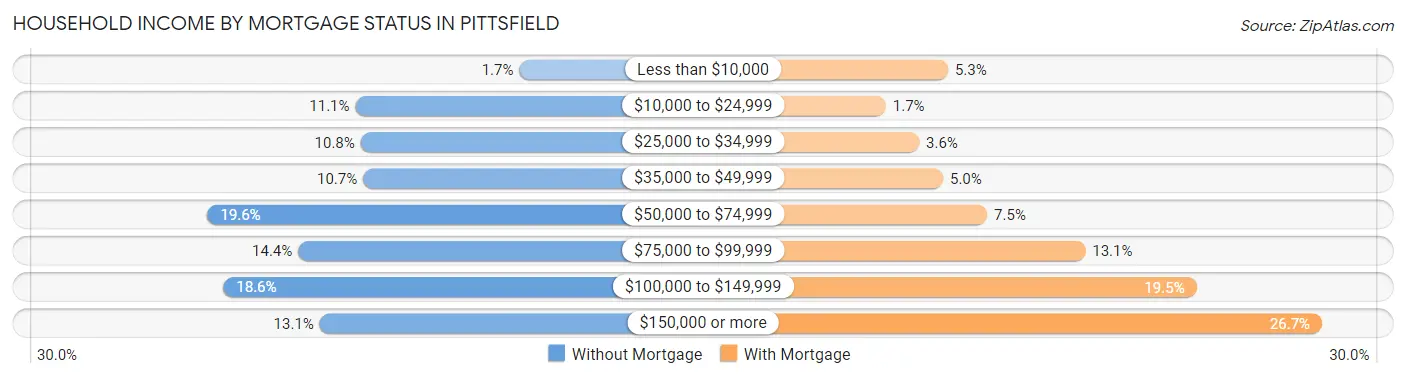
| Household Income | Without Mortgage | With Mortgage |
| Less than $10,000 | 75 (1.7%) | 397 (5.3%) |
| $10,000 to $24,999 | 480 (11.1%) | 130 (1.7%) |
| $25,000 to $34,999 | 467 (10.8%) | 273 (3.6%) |
| $35,000 to $49,999 | 461 (10.7%) | 376 (5.0%) |
| $50,000 to $74,999 | 845 (19.6%) | 566 (7.5%) |
| $75,000 to $99,999 | 621 (14.4%) | 988 (13.1%) |
| $100,000 to $149,999 | 806 (18.6%) | 1,466 (19.5%) |
| $150,000 or more | 568 (13.1%) | 2,005 (26.7%) |
| Total | 4,323 (100.0%) | 7,524 (100.0%) |
Property Value to Household Income Ratio in Pittsfield
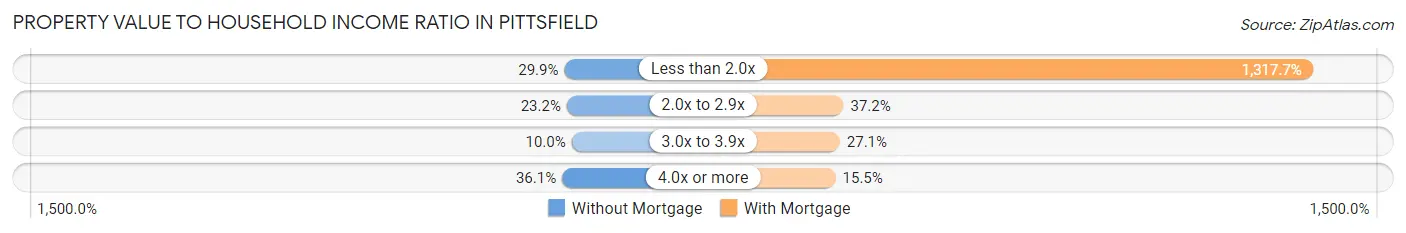
| Value-to-Income Ratio | Without Mortgage | With Mortgage |
| Less than 2.0x | 1,292 (29.9%) | 99,144 (1,317.7%) |
| 2.0x to 2.9x | 1,001 (23.2%) | 2,801 (37.2%) |
| 3.0x to 3.9x | 432 (10.0%) | 2,037 (27.1%) |
| 4.0x or more | 1,560 (36.1%) | 1,169 (15.5%) |
| Total | 4,323 (100.0%) | 7,524 (100.0%) |
Real Estate Taxes by Mortgage Status in Pittsfield
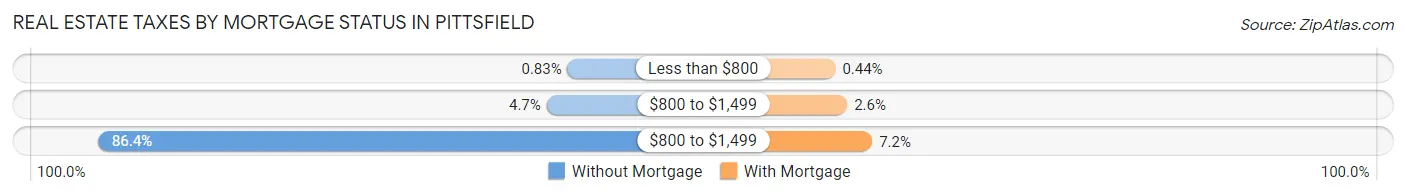
| Property Taxes | Without Mortgage | With Mortgage |
| Less than $800 | 36 (0.8%) | 33 (0.4%) |
| $800 to $1,499 | 201 (4.6%) | 195 (2.6%) |
| $800 to $1,499 | 3,736 (86.4%) | 539 (7.2%) |
| Total | 4,323 (100.0%) | 7,524 (100.0%) |
Health & Disability in Pittsfield
Health Insurance Coverage by Age in Pittsfield
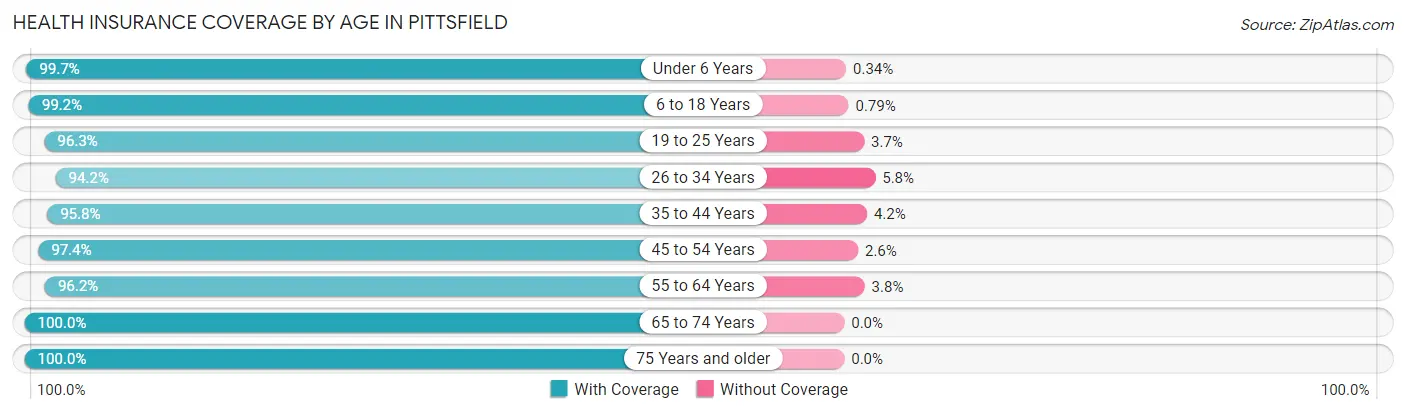
| Age Bracket | With Coverage | Without Coverage |
| Under 6 Years | 2,634 (99.7%) | 9 (0.3%) |
| 6 to 18 Years | 5,385 (99.2%) | 43 (0.8%) |
| 19 to 25 Years | 3,536 (96.3%) | 136 (3.7%) |
| 26 to 34 Years | 5,122 (94.2%) | 314 (5.8%) |
| 35 to 44 Years | 5,097 (95.8%) | 225 (4.2%) |
| 45 to 54 Years | 5,212 (97.4%) | 137 (2.6%) |
| 55 to 64 Years | 6,588 (96.2%) | 260 (3.8%) |
| 65 to 74 Years | 4,796 (100.0%) | 0 (0.0%) |
| 75 Years and older | 3,583 (100.0%) | 0 (0.0%) |
| Total | 41,953 (97.4%) | 1,124 (2.6%) |
Health Insurance Coverage by Citizenship Status in Pittsfield
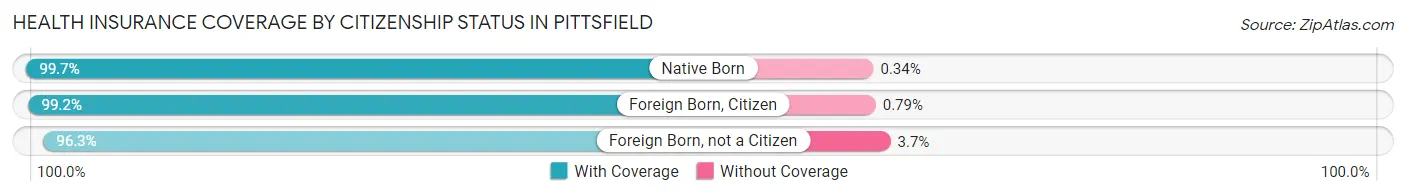
| Citizenship Status | With Coverage | Without Coverage |
| Native Born | 2,634 (99.7%) | 9 (0.3%) |
| Foreign Born, Citizen | 5,385 (99.2%) | 43 (0.8%) |
| Foreign Born, not a Citizen | 3,536 (96.3%) | 136 (3.7%) |
Health Insurance Coverage by Household Income in Pittsfield
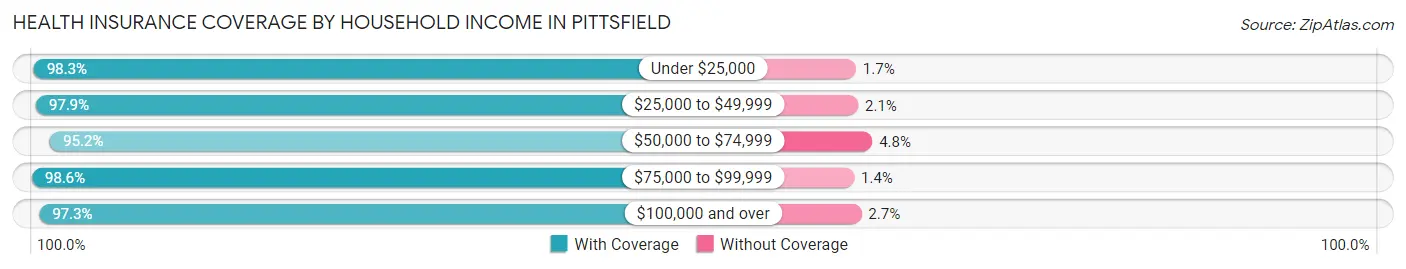
| Household Income | With Coverage | Without Coverage |
| Under $25,000 | 5,302 (98.3%) | 92 (1.7%) |
| $25,000 to $49,999 | 7,303 (97.9%) | 158 (2.1%) |
| $50,000 to $74,999 | 6,175 (95.2%) | 309 (4.8%) |
| $75,000 to $99,999 | 7,559 (98.6%) | 105 (1.4%) |
| $100,000 and over | 15,230 (97.3%) | 429 (2.7%) |
Public vs Private Health Insurance Coverage by Age in Pittsfield
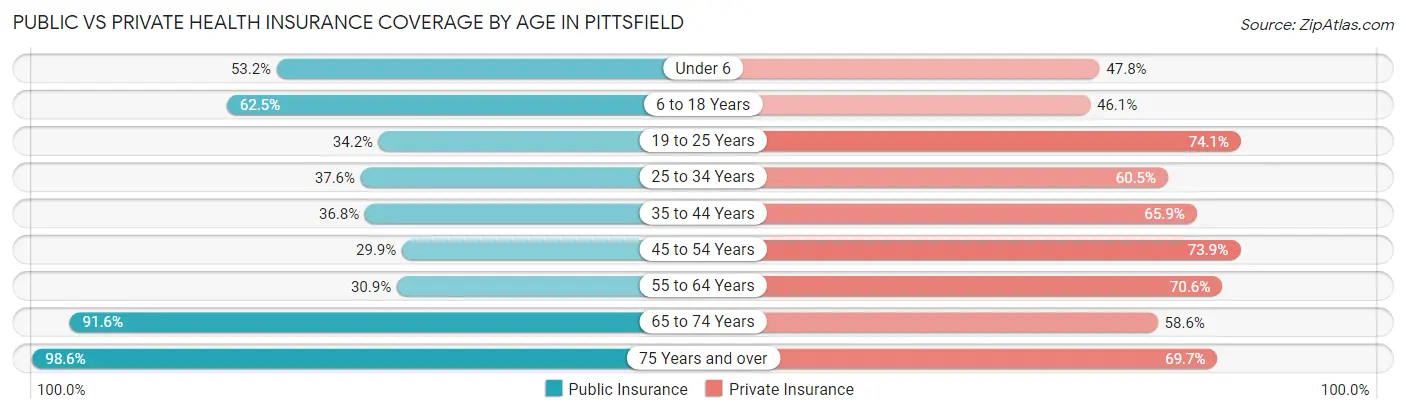
| Age Bracket | Public Insurance | Private Insurance |
| Under 6 | 1,405 (53.2%) | 1,264 (47.8%) |
| 6 to 18 Years | 3,390 (62.5%) | 2,501 (46.1%) |
| 19 to 25 Years | 1,257 (34.2%) | 2,719 (74.1%) |
| 25 to 34 Years | 2,043 (37.6%) | 3,290 (60.5%) |
| 35 to 44 Years | 1,959 (36.8%) | 3,505 (65.9%) |
| 45 to 54 Years | 1,601 (29.9%) | 3,953 (73.9%) |
| 55 to 64 Years | 2,115 (30.9%) | 4,834 (70.6%) |
| 65 to 74 Years | 4,395 (91.6%) | 2,812 (58.6%) |
| 75 Years and over | 3,531 (98.6%) | 2,497 (69.7%) |
| Total | 21,696 (50.4%) | 27,375 (63.5%) |
Disability Status by Sex by Age in Pittsfield
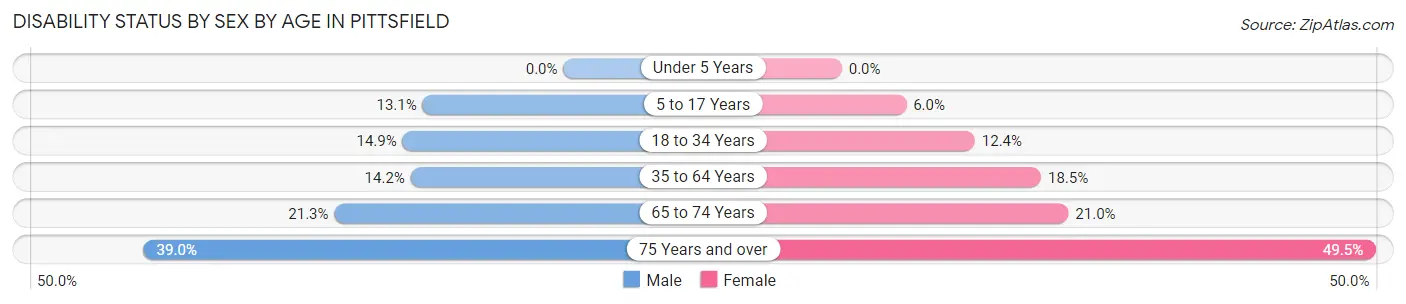
| Age Bracket | Male | Female |
| Under 5 Years | 0 (0.0%) | 0 (0.0%) |
| 5 to 17 Years | 359 (13.1%) | 166 (6.0%) |
| 18 to 34 Years | 732 (14.9%) | 554 (12.3%) |
| 35 to 64 Years | 1,212 (14.2%) | 1,658 (18.5%) |
| 65 to 74 Years | 509 (21.2%) | 505 (21.0%) |
| 75 Years and over | 555 (39.0%) | 1,068 (49.5%) |
Disability Class by Sex by Age in Pittsfield
Disability Class: Hearing Difficulty
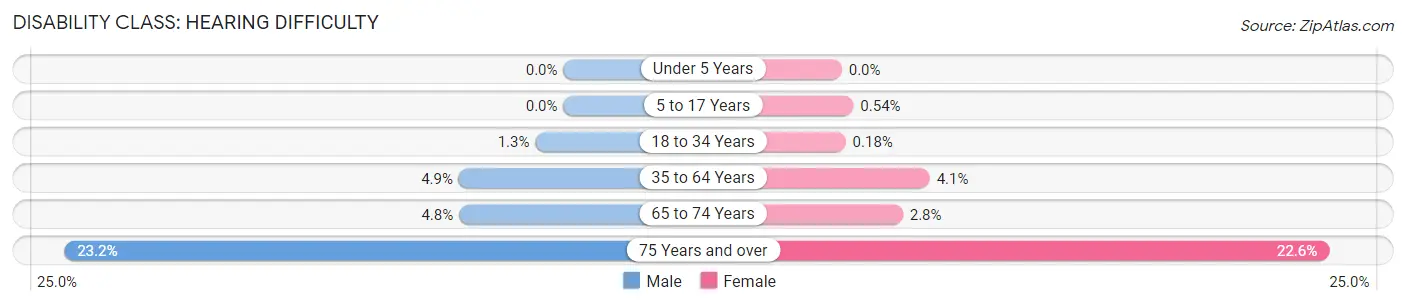
| Age Bracket | Male | Female |
| Under 5 Years | 0 (0.0%) | 0 (0.0%) |
| 5 to 17 Years | 0 (0.0%) | 15 (0.5%) |
| 18 to 34 Years | 64 (1.3%) | 8 (0.2%) |
| 35 to 64 Years | 415 (4.9%) | 366 (4.1%) |
| 65 to 74 Years | 116 (4.8%) | 68 (2.8%) |
| 75 Years and over | 330 (23.2%) | 488 (22.6%) |
Disability Class: Vision Difficulty
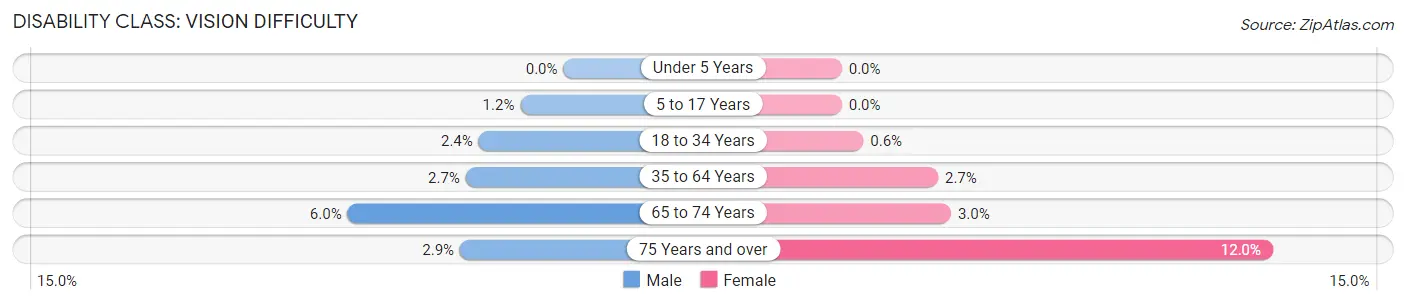
| Age Bracket | Male | Female |
| Under 5 Years | 0 (0.0%) | 0 (0.0%) |
| 5 to 17 Years | 33 (1.2%) | 0 (0.0%) |
| 18 to 34 Years | 116 (2.4%) | 27 (0.6%) |
| 35 to 64 Years | 233 (2.7%) | 240 (2.7%) |
| 65 to 74 Years | 144 (6.0%) | 73 (3.0%) |
| 75 Years and over | 41 (2.9%) | 259 (12.0%) |
Disability Class: Cognitive Difficulty
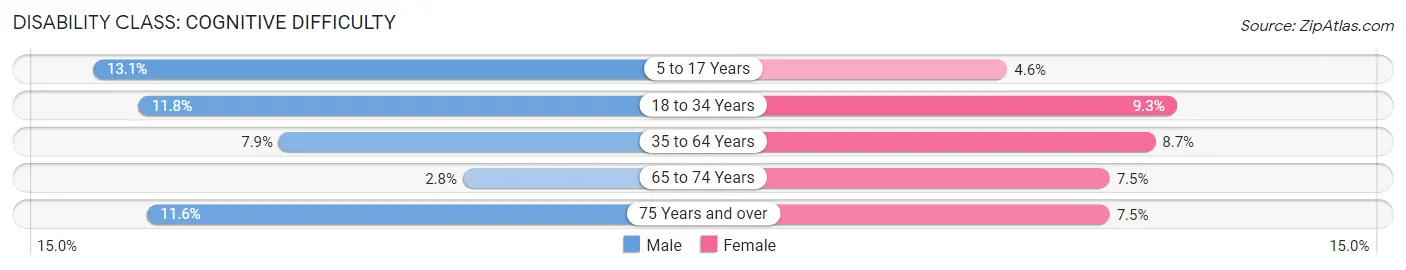
| Age Bracket | Male | Female |
| 5 to 17 Years | 359 (13.1%) | 128 (4.6%) |
| 18 to 34 Years | 580 (11.8%) | 418 (9.3%) |
| 35 to 64 Years | 677 (7.9%) | 783 (8.7%) |
| 65 to 74 Years | 67 (2.8%) | 179 (7.5%) |
| 75 Years and over | 165 (11.6%) | 161 (7.5%) |
Disability Class: Ambulatory Difficulty
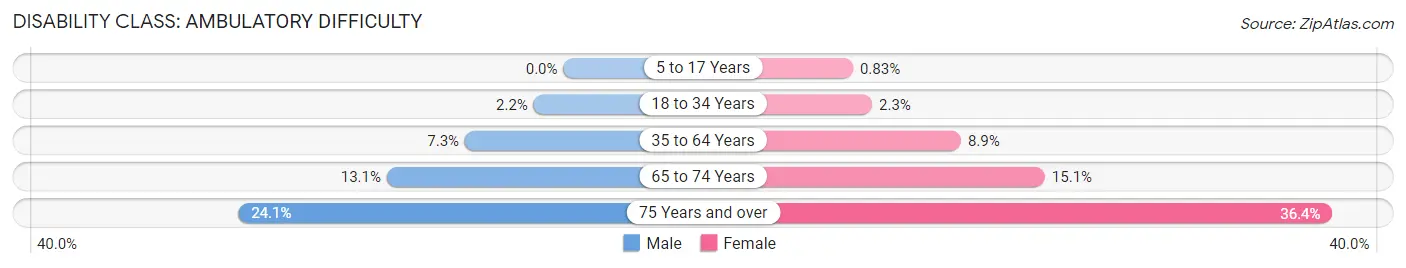
| Age Bracket | Male | Female |
| 5 to 17 Years | 0 (0.0%) | 23 (0.8%) |
| 18 to 34 Years | 108 (2.2%) | 101 (2.2%) |
| 35 to 64 Years | 625 (7.3%) | 794 (8.8%) |
| 65 to 74 Years | 314 (13.1%) | 362 (15.1%) |
| 75 Years and over | 344 (24.1%) | 786 (36.4%) |
Disability Class: Self-Care Difficulty
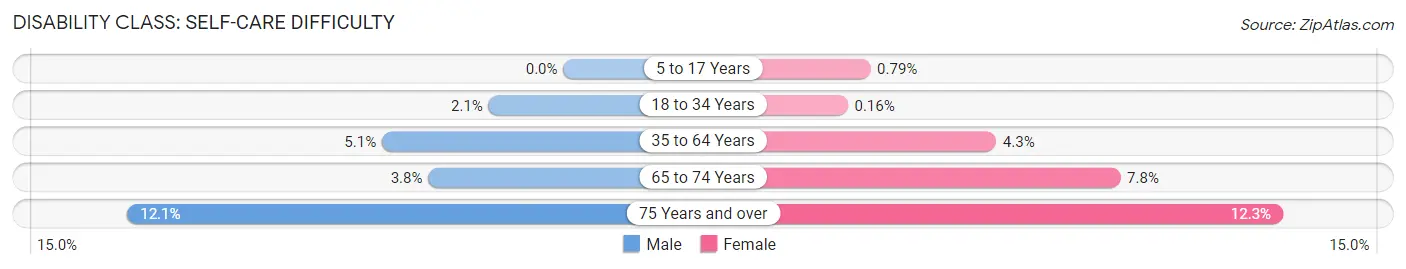
| Age Bracket | Male | Female |
| 5 to 17 Years | 0 (0.0%) | 22 (0.8%) |
| 18 to 34 Years | 102 (2.1%) | 7 (0.2%) |
| 35 to 64 Years | 432 (5.1%) | 385 (4.3%) |
| 65 to 74 Years | 90 (3.8%) | 186 (7.7%) |
| 75 Years and over | 173 (12.1%) | 265 (12.3%) |
Technology Access in Pittsfield
Computing Device Access in Pittsfield
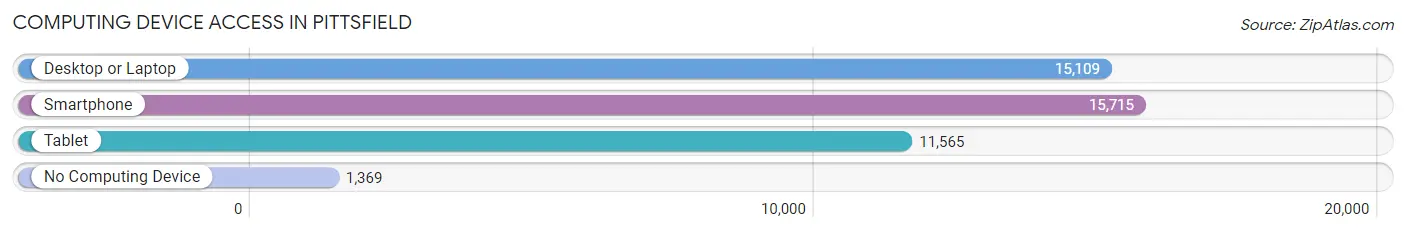
| Device Type | # Households | % Households |
| Desktop or Laptop | 15,109 | 78.5% |
| Smartphone | 15,715 | 81.7% |
| Tablet | 11,565 | 60.1% |
| No Computing Device | 1,369 | 7.1% |
| Total | 19,237 | 100.0% |
Internet Access in Pittsfield
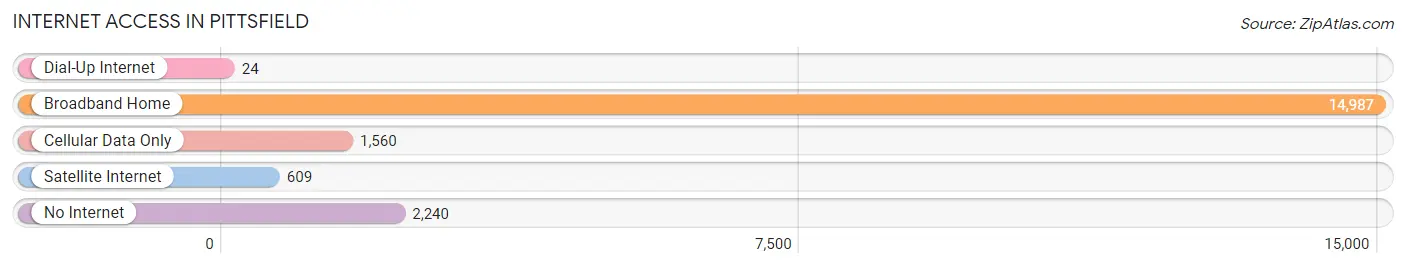
| Internet Type | # Households | % Households |
| Dial-Up Internet | 24 | 0.1% |
| Broadband Home | 14,987 | 77.9% |
| Cellular Data Only | 1,560 | 8.1% |
| Satellite Internet | 609 | 3.2% |
| No Internet | 2,240 | 11.6% |
| Total | 19,237 | 100.0% |
Pittsfield Summary
Pittsfield, Massachusetts is a city located in the western part of the state, in Berkshire County. It is the largest city in the county and the principal city of the Pittsfield, Massachusetts Metropolitan Statistical Area. The city is situated in the Berkshires, a region of the Appalachian Mountains, and is located approximately 110 miles west of Boston.
History
The area that is now Pittsfield was originally inhabited by the Mahican Native American tribe. The first European settlers arrived in the area in 1752, and the town was officially incorporated in 1761. The town was named after William Pitt, the Earl of Chatham, who was a prominent British statesman.
In the late 18th century, Pittsfield became an important center for the production of iron and steel. The city was also home to several important manufacturing companies, including the Berkshire Cotton Manufacturing Company, the Berkshire Woolen Company, and the Berkshire Iron Works.
In the 19th century, Pittsfield was an important center for the abolitionist movement. The city was home to several prominent abolitionists, including William Lloyd Garrison and Sojourner Truth.
Geography
Pittsfield is located in western Massachusetts, in Berkshire County. The city is situated in the Berkshires, a region of the Appalachian Mountains. The city is located approximately 110 miles west of Boston.
The city has a total area of 24.2 square miles, of which 24.1 square miles is land and 0.1 square miles is water. The city is located at the confluence of the Housatonic and Green Rivers.
Economy
Pittsfield has a diverse economy, with a mix of manufacturing, retail, and service industries. The city is home to several major employers, including General Dynamics, Berkshire Health Systems, and the Pittsfield Public Schools.
The city is also home to several major cultural institutions, including the Berkshire Museum, the Berkshire Theatre Festival, and the Colonial Theatre.
Demographics
As of the 2010 census, Pittsfield had a population of 44,737. The racial makeup of the city was 87.2% White, 5.3% African American, 0.4% Native American, 1.2% Asian, 0.1% Pacific Islander, 3.2% from other races, and 2.6% from two or more races. Hispanic or Latino of any race were 8.2% of the population.
The median household income in Pittsfield was $41,837, and the median family income was $50,817. The per capita income for the city was $22,945. About 16.2% of families and 19.7% of the population were below the poverty line, including 28.2% of those under age 18 and 10.2% of those age 65 or over.
Common Questions
What is Per Capita Income in Pittsfield?
Per Capita income in Pittsfield is $42,303.
What is the Median Family Income in Pittsfield?
Median Family Income in Pittsfield is $85,314.
What is the Median Household income in Pittsfield?
Median Household Income in Pittsfield is $66,859.
What is Income or Wage Gap in Pittsfield?
Income or Wage Gap in Pittsfield is 22.7%.
Women in Pittsfield earn 77.3 cents for every dollar earned by a man.
What is Family Income Deficit in Pittsfield?
Family Income Deficit in Pittsfield is $9,719.
Families that are below poverty line in Pittsfield earn $9,719 less on average than the poverty threshold level.
What is Inequality or Gini Index in Pittsfield?
Inequality or Gini Index in Pittsfield is 0.48.
What is the Total Population of Pittsfield?
Total Population of Pittsfield is 43,730.
What is the Total Male Population of Pittsfield?
Total Male Population of Pittsfield is 21,720.
What is the Total Female Population of Pittsfield?
Total Female Population of Pittsfield is 22,010.
What is the Ratio of Males per 100 Females in Pittsfield?
There are 98.68 Males per 100 Females in Pittsfield.
What is the Ratio of Females per 100 Males in Pittsfield?
There are 101.34 Females per 100 Males in Pittsfield.
What is the Median Population Age in Pittsfield?
Median Population Age in Pittsfield is 43.4 Years.
What is the Average Family Size in Pittsfield
Average Family Size in Pittsfield is 2.9 People.
What is the Average Household Size in Pittsfield
Average Household Size in Pittsfield is 2.2 People.
How Large is the Labor Force in Pittsfield?
There are 23,639 People in the Labor Forcein in Pittsfield.
What is the Percentage of People in the Labor Force in Pittsfield?
64.6% of People are in the Labor Force in Pittsfield.
What is the Unemployment Rate in Pittsfield?
Unemployment Rate in Pittsfield is 7.1%.