Millis Clicquot, MA Map & Demographics
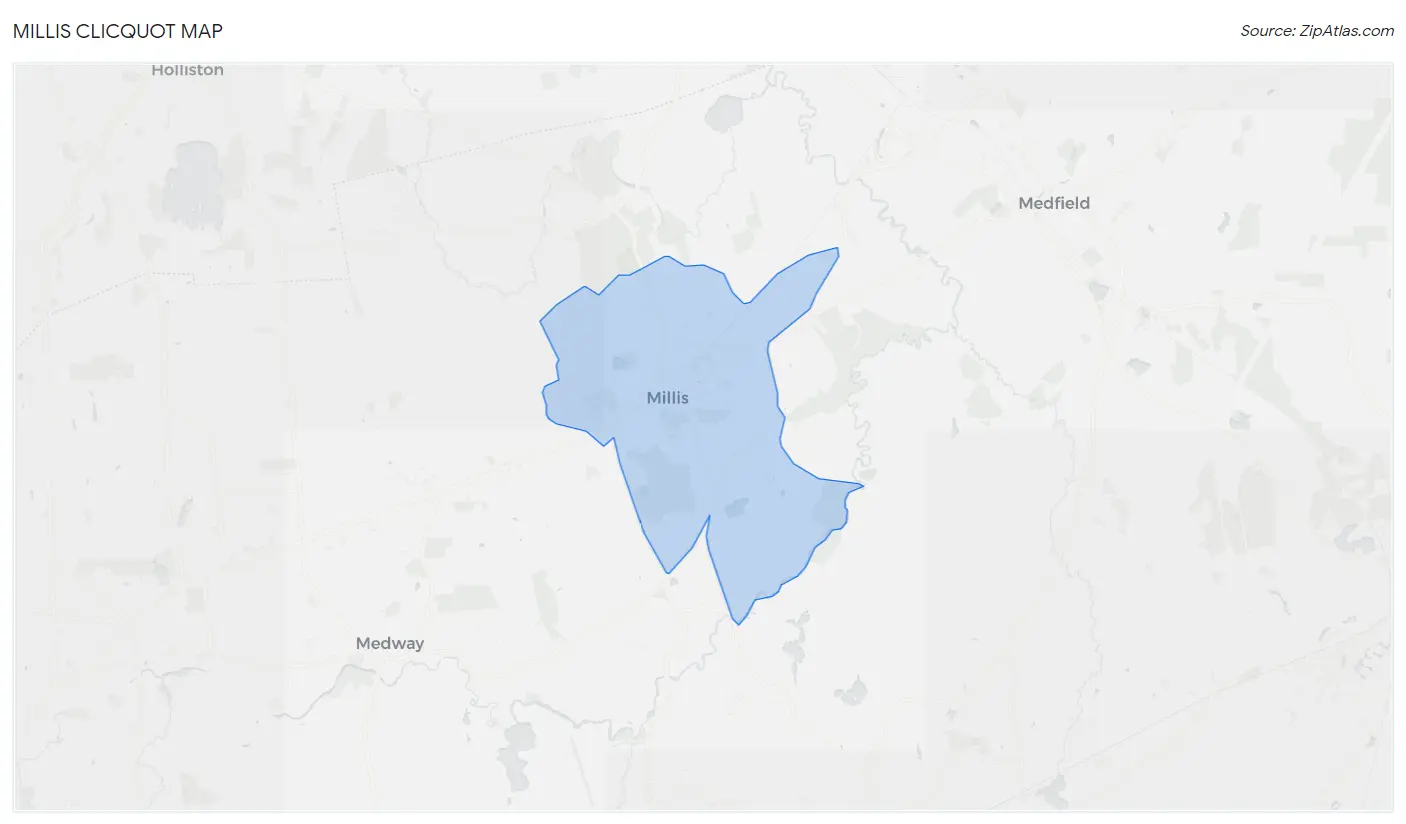
Millis Clicquot Map
Millis Clicquot Overview
$64,023
PER CAPITA INCOME
$142,241
AVG FAMILY INCOME
$111,192
AVG HOUSEHOLD INCOME
47.7%
WAGE / INCOME GAP [ % ]
52.3¢/ $1
WAGE / INCOME GAP [ $ ]
0.45
INEQUALITY / GINI INDEX
4,718
TOTAL POPULATION
2,145
MALE POPULATION
2,573
FEMALE POPULATION
83.37
MALES / 100 FEMALES
119.95
FEMALES / 100 MALES
44.3
MEDIAN AGE
3.3
AVG FAMILY SIZE
2.6
AVG HOUSEHOLD SIZE
2,778
LABOR FORCE [ PEOPLE ]
72.8%
PERCENT IN LABOR FORCE
1.8%
UNEMPLOYMENT RATE
Income in Millis Clicquot
Income Overview in Millis Clicquot
Per Capita Income in Millis Clicquot is $64,023, while median incomes of families and households are $142,241 and $111,192 respectively.
| Characteristic | Number | Measure |
| Per Capita Income | 4,718 | $64,023 |
| Median Family Income | 1,212 | $142,241 |
| Mean Family Income | 1,212 | $182,033 |
| Median Household Income | 1,791 | $111,192 |
| Mean Household Income | 1,791 | $148,278 |
| Income Deficit | 1,212 | $0 |
| Wage / Income Gap (%) | 4,718 | 47.71% |
| Wage / Income Gap ($) | 4,718 | 52.29¢ per $1 |
| Gini / Inequality Index | 4,718 | 0.45 |
Earnings by Sex in Millis Clicquot
Average Earnings in Millis Clicquot are $59,776, $81,406 for men and $42,571 for women, a difference of 47.7%.
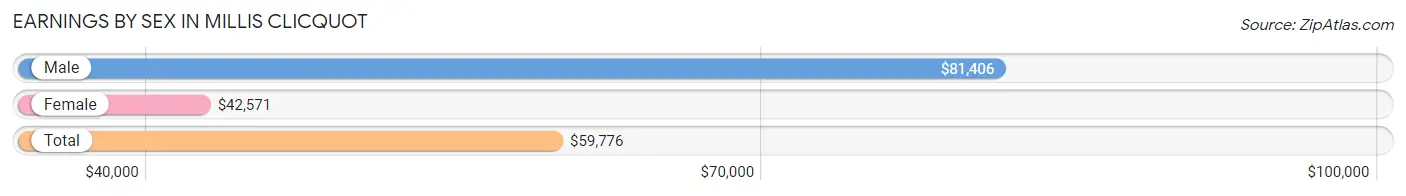
| Sex | Number | Average Earnings |
| Male | 1,334 (45.1%) | $81,406 |
| Female | 1,627 (54.9%) | $42,571 |
| Total | 2,961 (100.0%) | $59,776 |
Earnings by Sex by Income Bracket in Millis Clicquot
The most common earnings brackets in Millis Clicquot are $100,000+ for men (502 | 37.6%) and $100,000+ for women (402 | 24.7%).
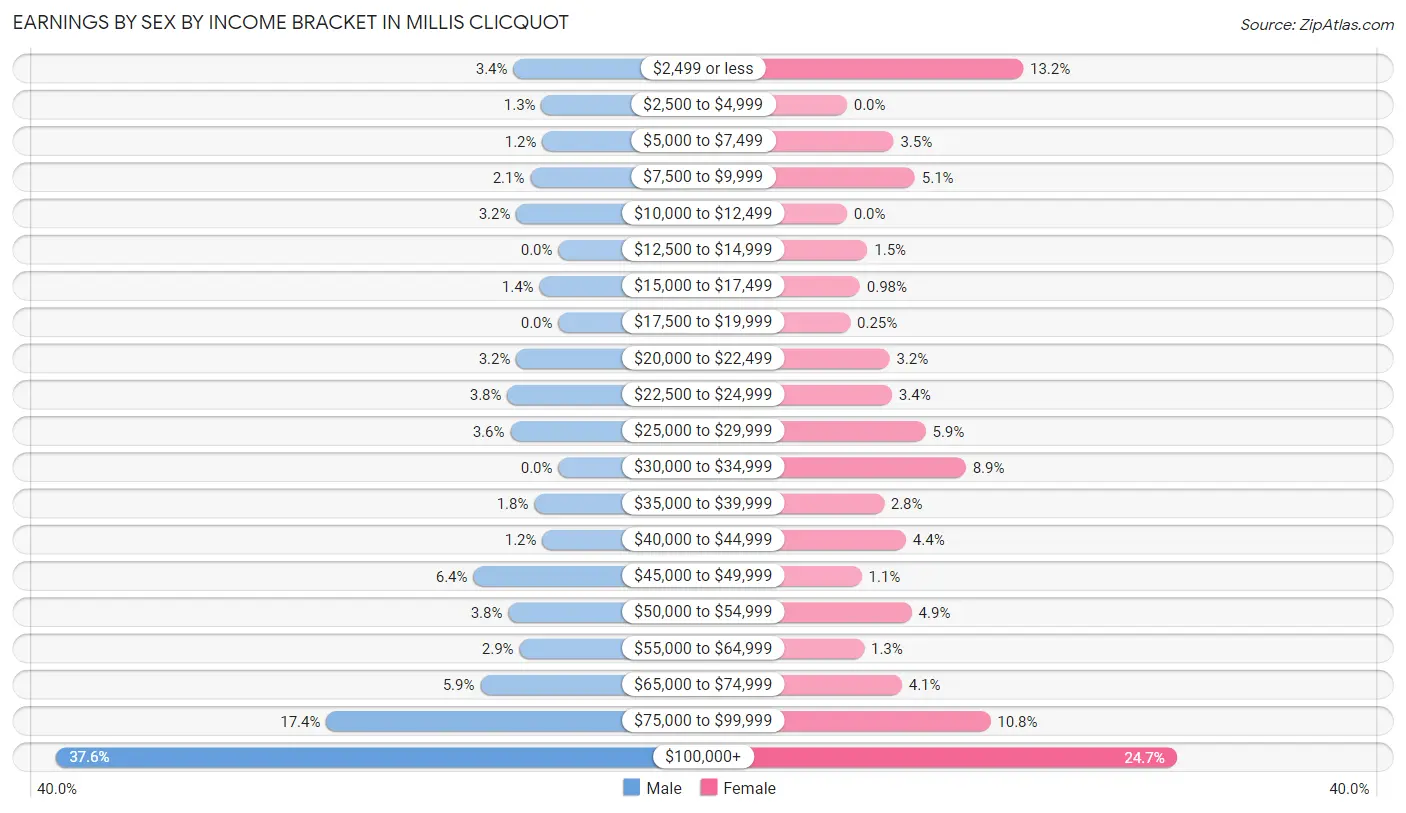
| Income | Male | Female |
| $2,499 or less | 45 (3.4%) | 215 (13.2%) |
| $2,500 to $4,999 | 17 (1.3%) | 0 (0.0%) |
| $5,000 to $7,499 | 16 (1.2%) | 57 (3.5%) |
| $7,500 to $9,999 | 28 (2.1%) | 83 (5.1%) |
| $10,000 to $12,499 | 42 (3.2%) | 0 (0.0%) |
| $12,500 to $14,999 | 0 (0.0%) | 25 (1.5%) |
| $15,000 to $17,499 | 19 (1.4%) | 16 (1.0%) |
| $17,500 to $19,999 | 0 (0.0%) | 4 (0.3%) |
| $20,000 to $22,499 | 42 (3.2%) | 52 (3.2%) |
| $22,500 to $24,999 | 51 (3.8%) | 55 (3.4%) |
| $25,000 to $29,999 | 48 (3.6%) | 96 (5.9%) |
| $30,000 to $34,999 | 0 (0.0%) | 145 (8.9%) |
| $35,000 to $39,999 | 24 (1.8%) | 45 (2.8%) |
| $40,000 to $44,999 | 16 (1.2%) | 72 (4.4%) |
| $45,000 to $49,999 | 85 (6.4%) | 18 (1.1%) |
| $50,000 to $54,999 | 50 (3.7%) | 79 (4.9%) |
| $55,000 to $64,999 | 39 (2.9%) | 21 (1.3%) |
| $65,000 to $74,999 | 78 (5.9%) | 67 (4.1%) |
| $75,000 to $99,999 | 232 (17.4%) | 175 (10.8%) |
| $100,000+ | 502 (37.6%) | 402 (24.7%) |
| Total | 1,334 (100.0%) | 1,627 (100.0%) |
Earnings by Sex by Educational Attainment in Millis Clicquot
Average earnings in Millis Clicquot are $92,727 for men and $53,341 for women, a difference of 42.5%. Men with an educational attainment of graduate degree enjoy the highest average annual earnings of $105,489, while those with high school diploma education earn the least with $68,387. Women with an educational attainment of graduate degree earn the most with the average annual earnings of $89,712, while those with bachelor's degree education have the smallest earnings of $57,917.
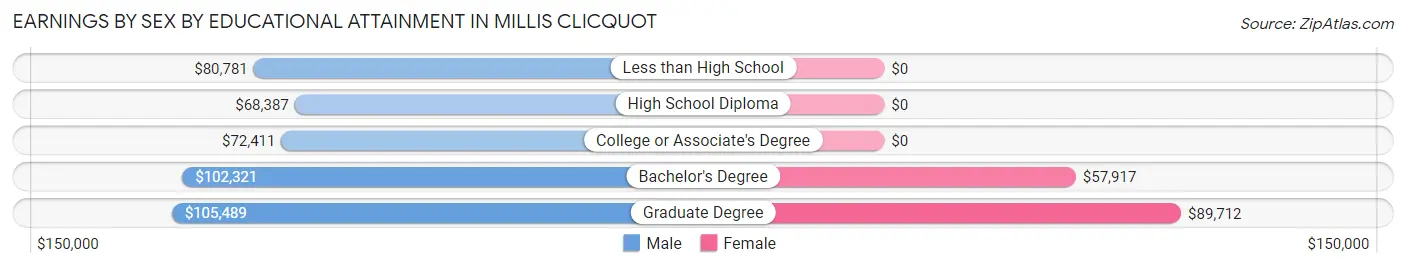
| Educational Attainment | Male Income | Female Income |
| Less than High School | $80,781 | $0 |
| High School Diploma | $68,387 | $0 |
| College or Associate's Degree | $72,411 | $0 |
| Bachelor's Degree | $102,321 | $57,917 |
| Graduate Degree | $105,489 | $89,712 |
| Total | $92,727 | $53,341 |
Family Income in Millis Clicquot
Family Income Brackets in Millis Clicquot
According to the Millis Clicquot family income data, there are 349 families falling into the $100,000 to $149,999 income range, which is the most common income bracket and makes up 28.8% of all families.
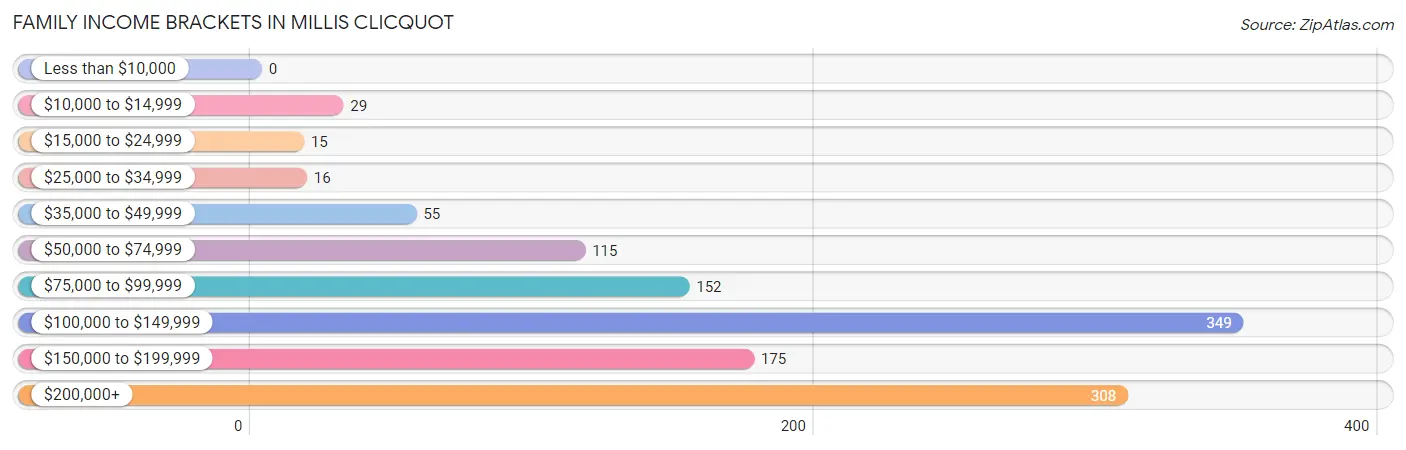
| Income Bracket | # Families | % Families |
| Less than $10,000 | 0 | 0.0% |
| $10,000 to $14,999 | 29 | 2.4% |
| $15,000 to $24,999 | 15 | 1.2% |
| $25,000 to $34,999 | 16 | 1.3% |
| $35,000 to $49,999 | 55 | 4.5% |
| $50,000 to $74,999 | 115 | 9.5% |
| $75,000 to $99,999 | 152 | 12.5% |
| $100,000 to $149,999 | 349 | 28.8% |
| $150,000 to $199,999 | 175 | 14.4% |
| $200,000+ | 308 | 25.4% |
Family Income by Famaliy Size in Millis Clicquot
7+ person families (39 | 3.2%) account for the highest median family income in Millis Clicquot with $250,001 per family, while 2-person families (501 | 41.3%) have the highest median income of $72,926 per family member.
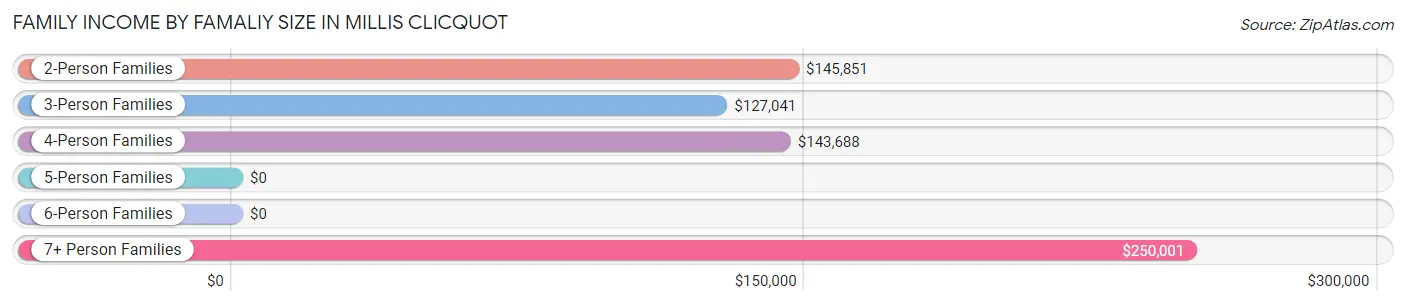
| Income Bracket | # Families | Median Income |
| 2-Person Families | 501 (41.3%) | $145,851 |
| 3-Person Families | 300 (24.7%) | $127,041 |
| 4-Person Families | 281 (23.2%) | $143,688 |
| 5-Person Families | 91 (7.5%) | $0 |
| 6-Person Families | 0 (0.0%) | $0 |
| 7+ Person Families | 39 (3.2%) | $250,001 |
| Total | 1,212 (100.0%) | $142,241 |
Family Income by Number of Earners in Millis Clicquot
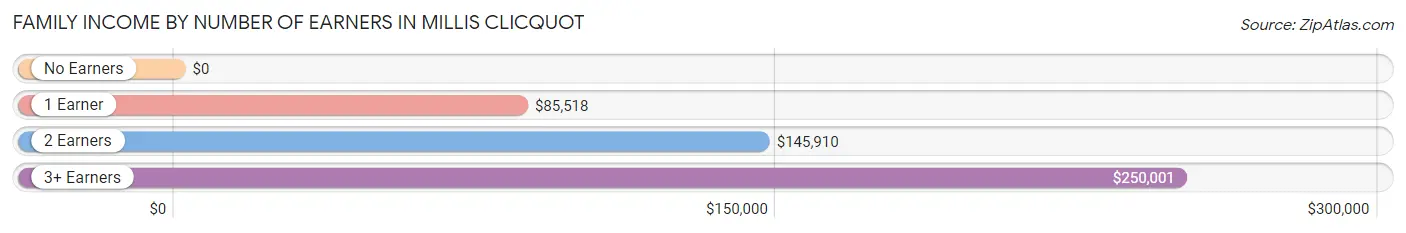
| Number of Earners | # Families | Median Income |
| No Earners | 73 (6.0%) | $0 |
| 1 Earner | 213 (17.6%) | $85,518 |
| 2 Earners | 715 (59.0%) | $145,910 |
| 3+ Earners | 211 (17.4%) | $250,001 |
| Total | 1,212 (100.0%) | $142,241 |
Household Income in Millis Clicquot
Household Income Brackets in Millis Clicquot
With 494 households falling in the category, the $100,000 to $149,999 income range is the most frequent in Millis Clicquot, accounting for 27.6% of all households. In contrast, only 39 households (2.2%) fall into the $15,000 to $24,999 income bracket, making it the least populous group.
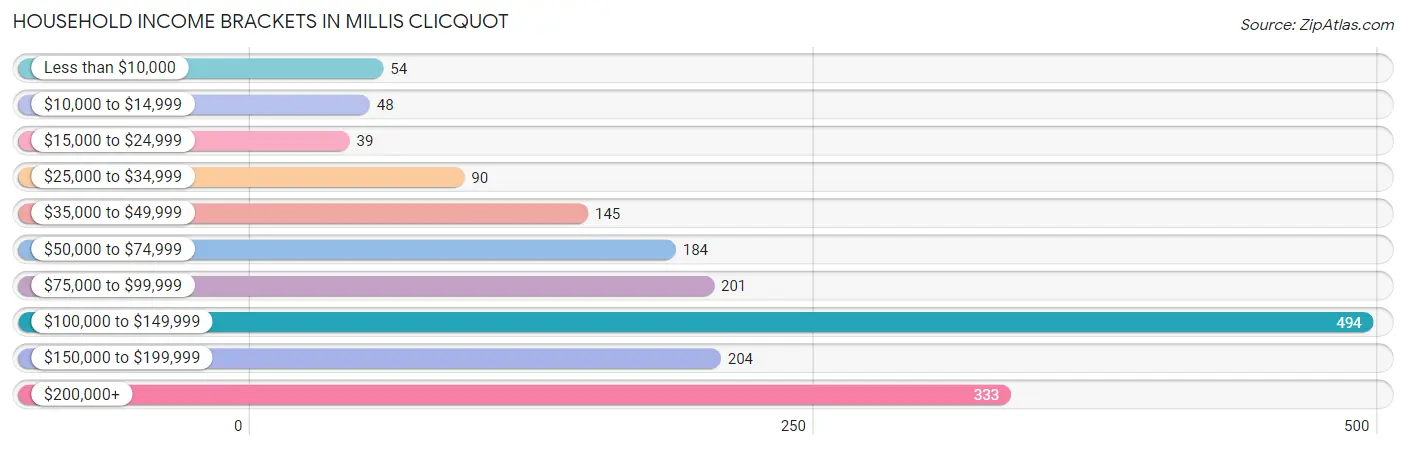
| Income Bracket | # Households | % Households |
| Less than $10,000 | 54 | 3.0% |
| $10,000 to $14,999 | 48 | 2.7% |
| $15,000 to $24,999 | 39 | 2.2% |
| $25,000 to $34,999 | 90 | 5.0% |
| $35,000 to $49,999 | 145 | 8.1% |
| $50,000 to $74,999 | 184 | 10.3% |
| $75,000 to $99,999 | 201 | 11.2% |
| $100,000 to $149,999 | 494 | 27.6% |
| $150,000 to $199,999 | 204 | 11.4% |
| $200,000+ | 333 | 18.6% |
Household Income by Householder Age in Millis Clicquot
The median household income in Millis Clicquot is $111,192, with the highest median household income of $141,767 found in the 25 to 44 years age bracket for the primary householder. A total of 453 households (25.3%) fall into this category.
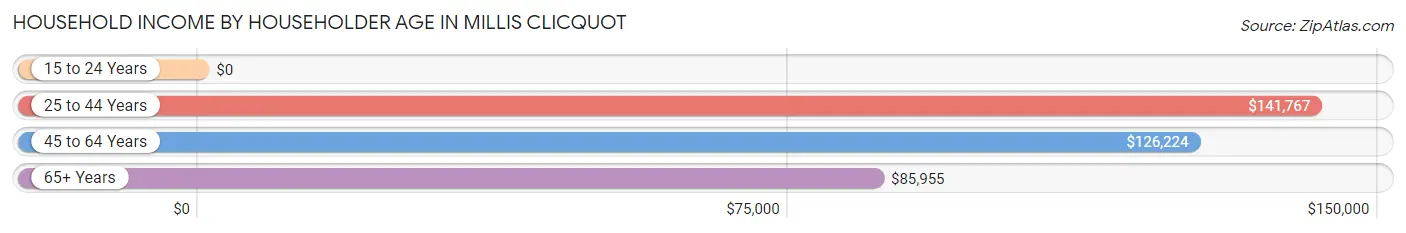
| Income Bracket | # Households | Median Income |
| 15 to 24 Years | 0 (0.0%) | $0 |
| 25 to 44 Years | 453 (25.3%) | $141,767 |
| 45 to 64 Years | 940 (52.5%) | $126,224 |
| 65+ Years | 398 (22.2%) | $85,955 |
| Total | 1,791 (100.0%) | $111,192 |
Poverty in Millis Clicquot
Income Below Poverty by Sex and Age in Millis Clicquot
With 6.7% poverty level for males and 6.6% for females among the residents of Millis Clicquot, 16 and 17 year old males and 35 to 44 year old females are the most vulnerable to poverty, with 16 males (45.7%) and 88 females (31.2%) in their respective age groups living below the poverty level.
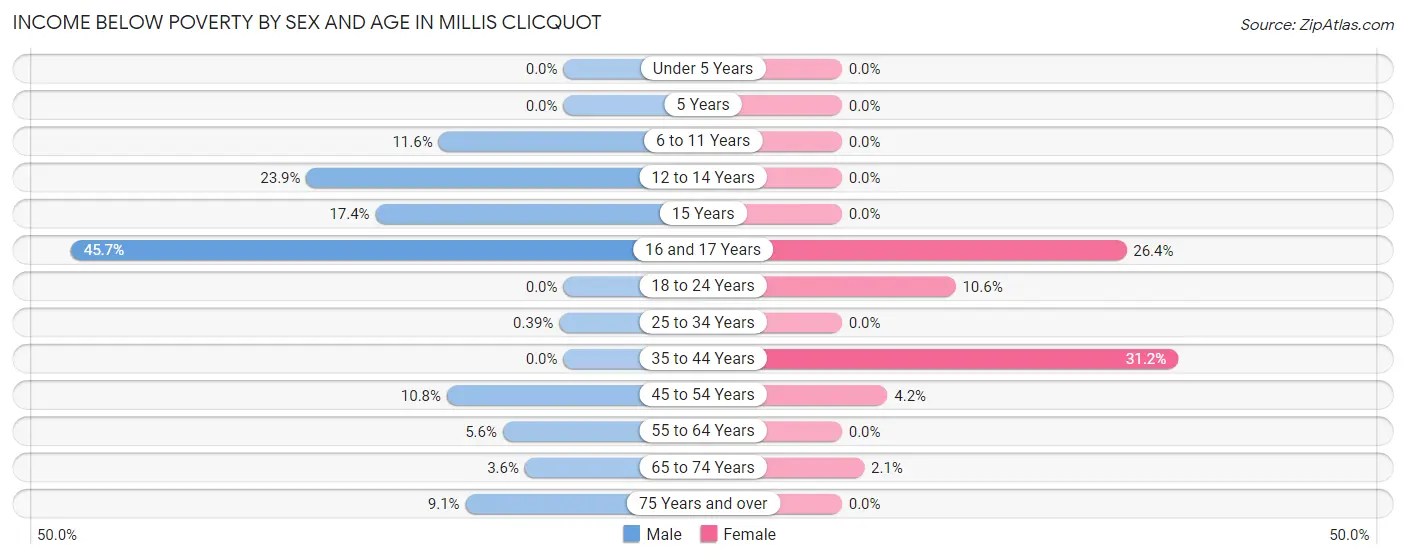
| Age Bracket | Male | Female |
| Under 5 Years | 0 (0.0%) | 0 (0.0%) |
| 5 Years | 0 (0.0%) | 0 (0.0%) |
| 6 to 11 Years | 16 (11.6%) | 0 (0.0%) |
| 12 to 14 Years | 31 (23.8%) | 0 (0.0%) |
| 15 Years | 15 (17.4%) | 0 (0.0%) |
| 16 and 17 Years | 16 (45.7%) | 33 (26.4%) |
| 18 to 24 Years | 0 (0.0%) | 23 (10.5%) |
| 25 to 34 Years | 1 (0.4%) | 0 (0.0%) |
| 35 to 44 Years | 0 (0.0%) | 88 (31.2%) |
| 45 to 54 Years | 32 (10.8%) | 15 (4.2%) |
| 55 to 64 Years | 19 (5.6%) | 0 (0.0%) |
| 65 to 74 Years | 10 (3.6%) | 8 (2.1%) |
| 75 Years and over | 4 (9.1%) | 0 (0.0%) |
| Total | 144 (6.7%) | 167 (6.6%) |
Income Above Poverty by Sex and Age in Millis Clicquot
According to the poverty statistics in Millis Clicquot, males aged under 5 years and females aged under 5 years are the age groups that are most secure financially, with 100.0% of males and 100.0% of females in these age groups living above the poverty line.
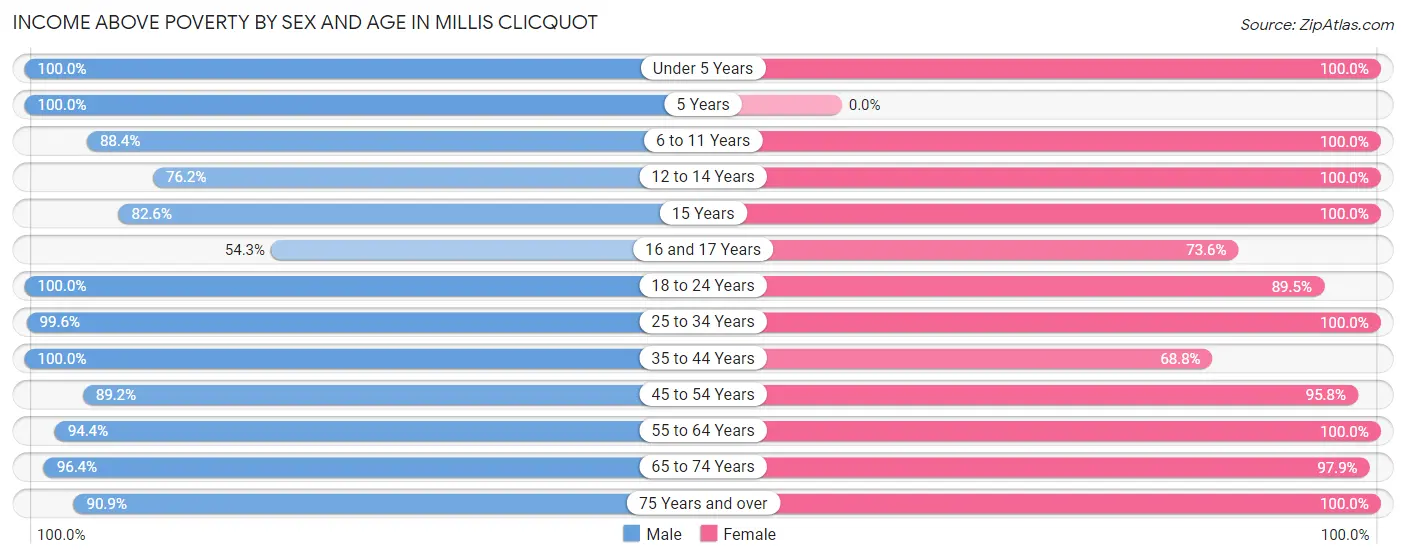
| Age Bracket | Male | Female |
| Under 5 Years | 125 (100.0%) | 124 (100.0%) |
| 5 Years | 31 (100.0%) | 0 (0.0%) |
| 6 to 11 Years | 122 (88.4%) | 83 (100.0%) |
| 12 to 14 Years | 99 (76.1%) | 131 (100.0%) |
| 15 Years | 71 (82.6%) | 54 (100.0%) |
| 16 and 17 Years | 19 (54.3%) | 92 (73.6%) |
| 18 to 24 Years | 87 (100.0%) | 195 (89.4%) |
| 25 to 34 Years | 258 (99.6%) | 275 (100.0%) |
| 35 to 44 Years | 292 (100.0%) | 194 (68.8%) |
| 45 to 54 Years | 264 (89.2%) | 340 (95.8%) |
| 55 to 64 Years | 319 (94.4%) | 395 (100.0%) |
| 65 to 74 Years | 269 (96.4%) | 379 (97.9%) |
| 75 Years and over | 40 (90.9%) | 116 (100.0%) |
| Total | 1,996 (93.3%) | 2,378 (93.4%) |
Income Below Poverty Among Married-Couple Families in Millis Clicquot
The poverty statistics for married-couple families in Millis Clicquot show that 3.4% or 31 of the total 904 families live below the poverty line. Families with 1 or 2 children have the highest poverty rate of 8.2%, comprising of 31 families. On the other hand, families with no children have the lowest poverty rate of 0.0%, which includes 0 families.
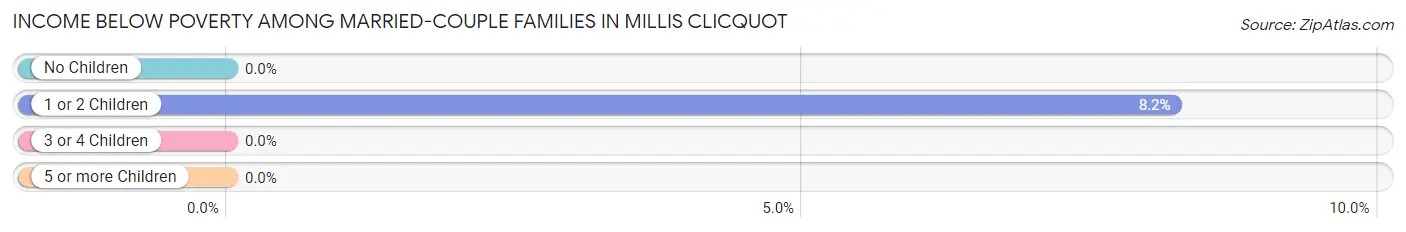
| Children | Above Poverty | Below Poverty |
| No Children | 477 (100.0%) | 0 (0.0%) |
| 1 or 2 Children | 346 (91.8%) | 31 (8.2%) |
| 3 or 4 Children | 50 (100.0%) | 0 (0.0%) |
| 5 or more Children | 0 (0.0%) | 0 (0.0%) |
| Total | 873 (96.6%) | 31 (3.4%) |
Income Below Poverty Among Single-Parent Households in Millis Clicquot
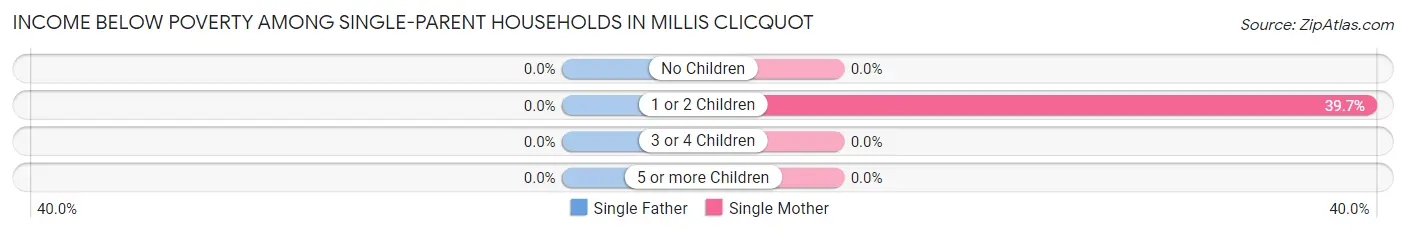
| Children | Single Father | Single Mother |
| No Children | 0 (0.0%) | 0 (0.0%) |
| 1 or 2 Children | 0 (0.0%) | 29 (39.7%) |
| 3 or 4 Children | 0 (0.0%) | 0 (0.0%) |
| 5 or more Children | 0 (0.0%) | 0 (0.0%) |
| Total | 0 (0.0%) | 29 (13.8%) |
Income Below Poverty Among Married-Couple vs Single-Parent Households in Millis Clicquot
The poverty data for Millis Clicquot shows that 31 of the married-couple family households (3.4%) and 29 of the single-parent households (9.4%) are living below the poverty level. Within the married-couple family households, those with 1 or 2 children have the highest poverty rate, with 31 households (8.2%) falling below the poverty line. Among the single-parent households, those with 1 or 2 children have the highest poverty rate, with 29 household (39.7%) living below poverty.
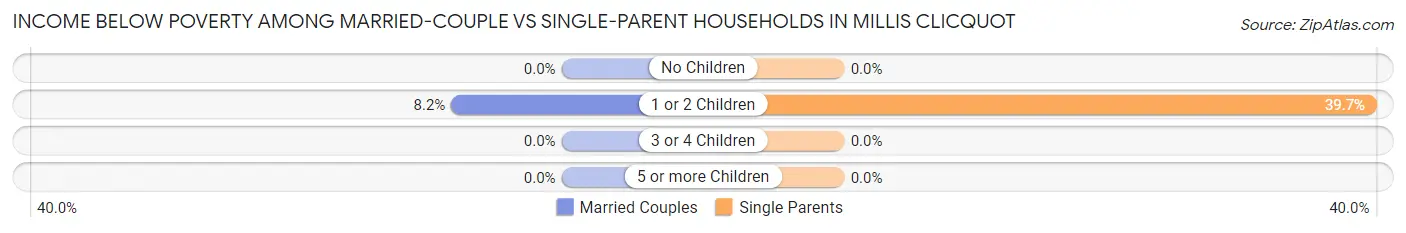
| Children | Married-Couple Families | Single-Parent Households |
| No Children | 0 (0.0%) | 0 (0.0%) |
| 1 or 2 Children | 31 (8.2%) | 29 (39.7%) |
| 3 or 4 Children | 0 (0.0%) | 0 (0.0%) |
| 5 or more Children | 0 (0.0%) | 0 (0.0%) |
| Total | 31 (3.4%) | 29 (9.4%) |
Race in Millis Clicquot
The most populous races in Millis Clicquot are White / Caucasian (4,191 | 88.8%), Asian (198 | 4.2%), and Two or more Races (149 | 3.2%).
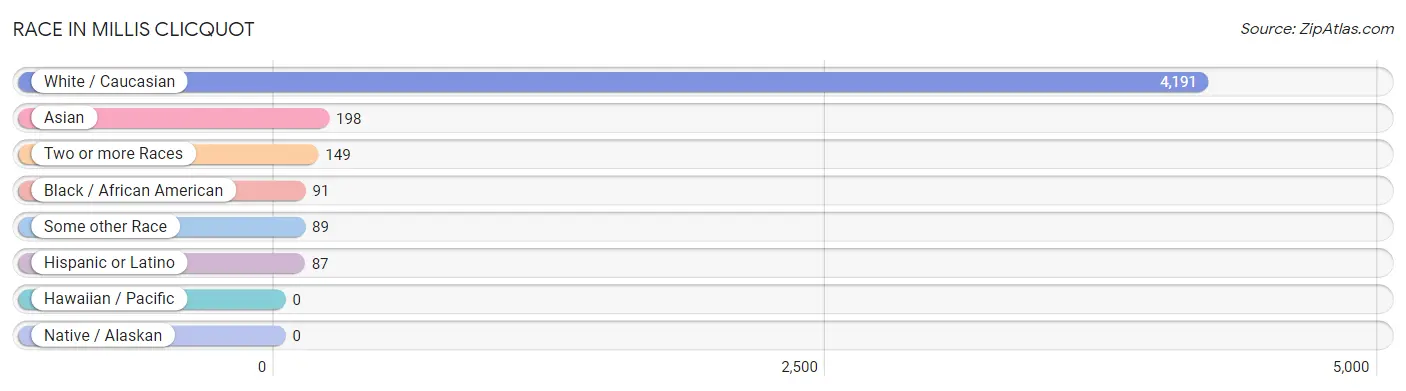
| Race | # Population | % Population |
| Asian | 198 | 4.2% |
| Black / African American | 91 | 1.9% |
| Hawaiian / Pacific | 0 | 0.0% |
| Hispanic or Latino | 87 | 1.8% |
| Native / Alaskan | 0 | 0.0% |
| White / Caucasian | 4,191 | 88.8% |
| Two or more Races | 149 | 3.2% |
| Some other Race | 89 | 1.9% |
| Total | 4,718 | 100.0% |
Ancestry in Millis Clicquot
The most populous ancestries reported in Millis Clicquot are Irish (1,713 | 36.3%), Italian (802 | 17.0%), English (575 | 12.2%), German (371 | 7.9%), and French (210 | 4.4%), together accounting for 77.8% of all Millis Clicquot residents.
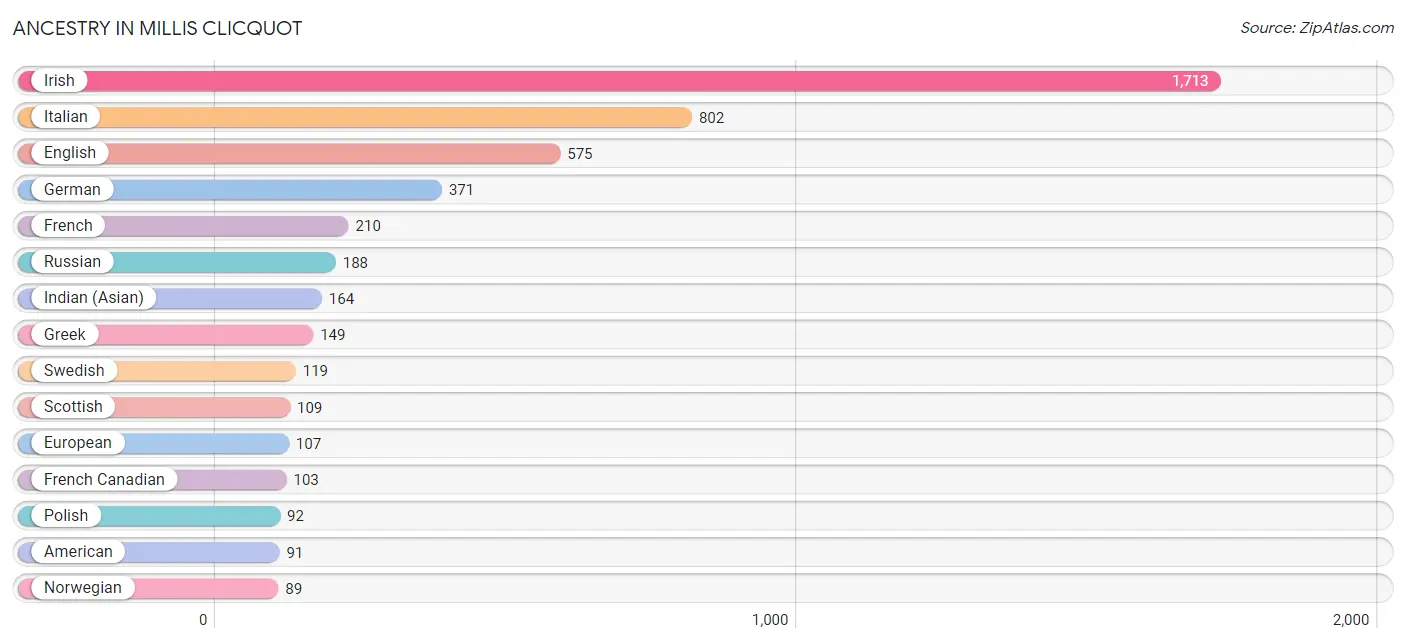
| Ancestry | # Population | % Population |
| American | 91 | 1.9% |
| Arab | 63 | 1.3% |
| Armenian | 17 | 0.4% |
| British | 10 | 0.2% |
| Bulgarian | 44 | 0.9% |
| Burmese | 22 | 0.5% |
| Canadian | 57 | 1.2% |
| Cape Verdean | 33 | 0.7% |
| Czech | 9 | 0.2% |
| Czechoslovakian | 13 | 0.3% |
| Dominican | 44 | 0.9% |
| Egyptian | 63 | 1.3% |
| English | 575 | 12.2% |
| European | 107 | 2.3% |
| French | 210 | 4.4% |
| French Canadian | 103 | 2.2% |
| German | 371 | 7.9% |
| Greek | 149 | 3.2% |
| Hungarian | 51 | 1.1% |
| Indian (Asian) | 164 | 3.5% |
| Irish | 1,713 | 36.3% |
| Italian | 802 | 17.0% |
| Jamaican | 84 | 1.8% |
| Latvian | 11 | 0.2% |
| Lithuanian | 25 | 0.5% |
| Norwegian | 89 | 1.9% |
| Polish | 92 | 1.9% |
| Portuguese | 77 | 1.6% |
| Puerto Rican | 36 | 0.8% |
| Russian | 188 | 4.0% |
| Scotch-Irish | 14 | 0.3% |
| Scottish | 109 | 2.3% |
| Sioux | 12 | 0.3% |
| Subsaharan African | 33 | 0.7% |
| Swedish | 119 | 2.5% |
| Thai | 22 | 0.5% | View All 36 Rows |
Immigrants in Millis Clicquot
The most numerous immigrant groups reported in Millis Clicquot came from Europe (206 | 4.4%), Latin America (152 | 3.2%), Caribbean (128 | 2.7%), Jamaica (84 | 1.8%), and Eastern Europe (73 | 1.5%), together accounting for 13.6% of all Millis Clicquot residents.
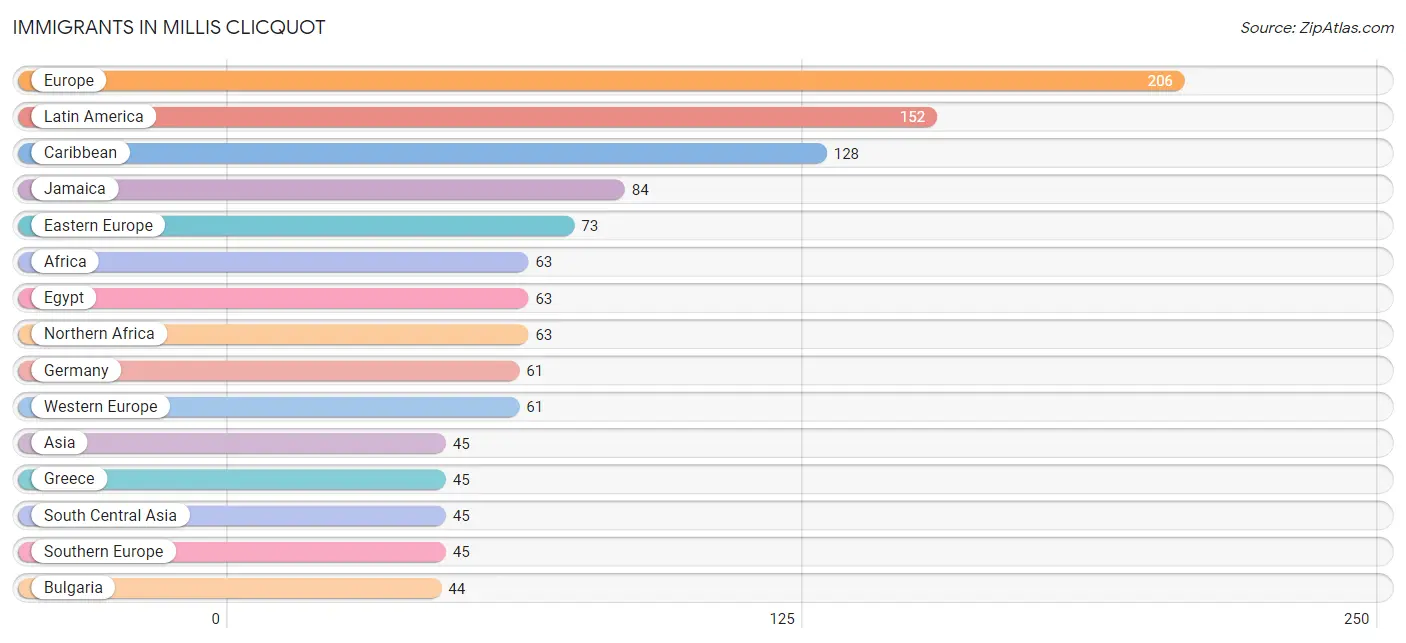
| Immigration Origin | # Population | % Population |
| Africa | 63 | 1.3% |
| Asia | 45 | 0.9% |
| Brazil | 9 | 0.2% |
| Bulgaria | 44 | 0.9% |
| Canada | 10 | 0.2% |
| Caribbean | 128 | 2.7% |
| Dominican Republic | 44 | 0.9% |
| Eastern Europe | 73 | 1.5% |
| Ecuador | 15 | 0.3% |
| Egypt | 63 | 1.3% |
| Europe | 206 | 4.4% |
| Germany | 61 | 1.3% |
| Greece | 45 | 0.9% |
| India | 12 | 0.3% |
| Jamaica | 84 | 1.8% |
| Latin America | 152 | 3.2% |
| Northern Africa | 63 | 1.3% |
| Northern Europe | 27 | 0.6% |
| South America | 24 | 0.5% |
| South Central Asia | 45 | 0.9% |
| Southern Europe | 45 | 0.9% |
| Ukraine | 29 | 0.6% |
| Uzbekistan | 33 | 0.7% |
| Western Europe | 61 | 1.3% | View All 24 Rows |
Sex and Age in Millis Clicquot
Sex and Age in Millis Clicquot
The most populous age groups in Millis Clicquot are 60 to 64 Years (243 | 11.3%) for men and 65 to 69 Years (341 | 13.3%) for women.
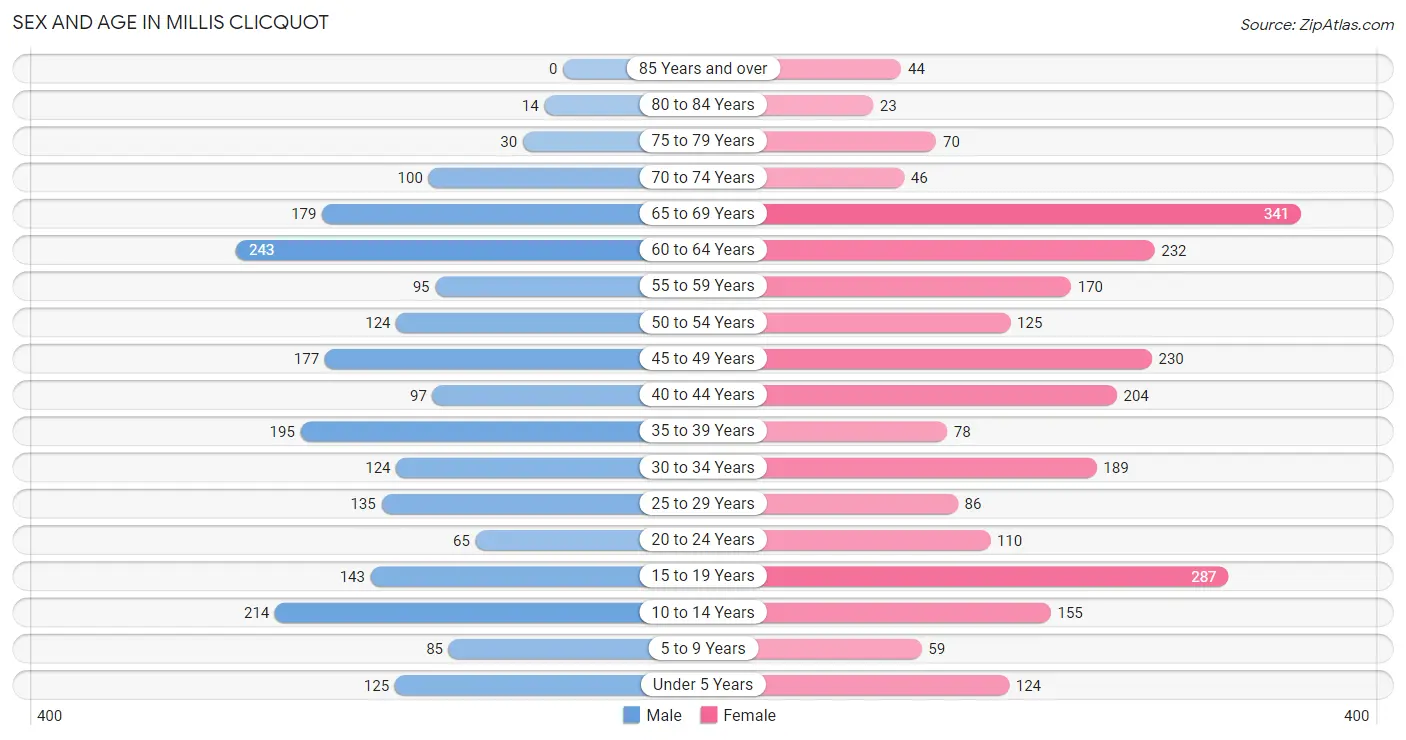
| Age Bracket | Male | Female |
| Under 5 Years | 125 (5.8%) | 124 (4.8%) |
| 5 to 9 Years | 85 (4.0%) | 59 (2.3%) |
| 10 to 14 Years | 214 (10.0%) | 155 (6.0%) |
| 15 to 19 Years | 143 (6.7%) | 287 (11.2%) |
| 20 to 24 Years | 65 (3.0%) | 110 (4.3%) |
| 25 to 29 Years | 135 (6.3%) | 86 (3.3%) |
| 30 to 34 Years | 124 (5.8%) | 189 (7.3%) |
| 35 to 39 Years | 195 (9.1%) | 78 (3.0%) |
| 40 to 44 Years | 97 (4.5%) | 204 (7.9%) |
| 45 to 49 Years | 177 (8.3%) | 230 (8.9%) |
| 50 to 54 Years | 124 (5.8%) | 125 (4.9%) |
| 55 to 59 Years | 95 (4.4%) | 170 (6.6%) |
| 60 to 64 Years | 243 (11.3%) | 232 (9.0%) |
| 65 to 69 Years | 179 (8.3%) | 341 (13.3%) |
| 70 to 74 Years | 100 (4.7%) | 46 (1.8%) |
| 75 to 79 Years | 30 (1.4%) | 70 (2.7%) |
| 80 to 84 Years | 14 (0.6%) | 23 (0.9%) |
| 85 Years and over | 0 (0.0%) | 44 (1.7%) |
| Total | 2,145 (100.0%) | 2,573 (100.0%) |
Families and Households in Millis Clicquot
Median Family Size in Millis Clicquot
The median family size in Millis Clicquot is 3.27 persons per family, with married-couple families (904 | 74.6%) accounting for the largest median family size of 3.39 persons per family. On the other hand, single female/mother families (210 | 17.3%) represent the smallest median family size with 2.78 persons per family.
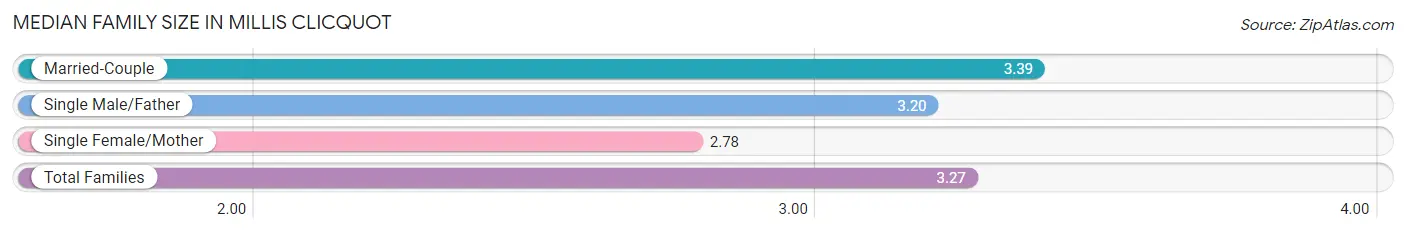
| Family Type | # Families | Family Size |
| Married-Couple | 904 (74.6%) | 3.39 |
| Single Male/Father | 98 (8.1%) | 3.20 |
| Single Female/Mother | 210 (17.3%) | 2.78 |
| Total Families | 1,212 (100.0%) | 3.27 |
Median Household Size in Millis Clicquot
The median household size in Millis Clicquot is 2.61 persons per household, with married-couple households (904 | 50.5%) accounting for the largest median household size of 3.4 persons per household. non-family households (579 | 32.3%) represent the smallest median household size with 1.16 persons per household.
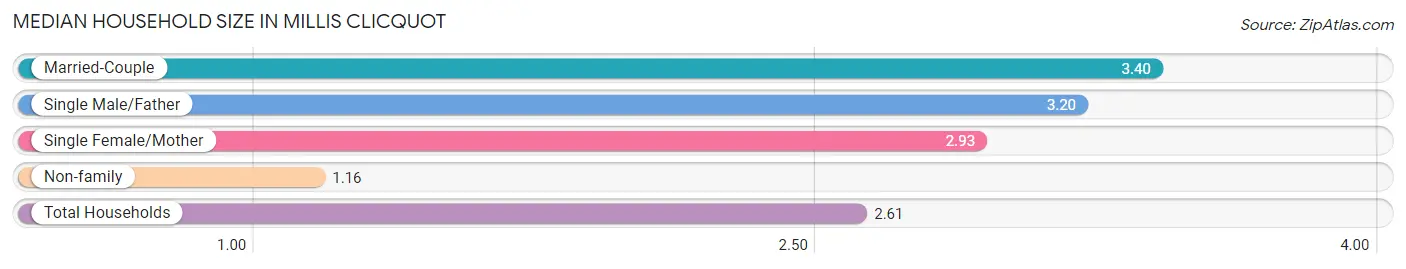
| Household Type | # Households | Household Size |
| Married-Couple | 904 (50.5%) | 3.40 |
| Single Male/Father | 98 (5.5%) | 3.20 |
| Single Female/Mother | 210 (11.7%) | 2.93 |
| Non-family | 579 (32.3%) | 1.16 |
| Total Households | 1,791 (100.0%) | 2.61 |
Household Size by Marriage Status in Millis Clicquot
Out of a total of 1,791 households in Millis Clicquot, 1,212 (67.7%) are family households, while 579 (32.3%) are nonfamily households. The most numerous type of family households are 2-person households, comprising 501, and the most common type of nonfamily households are 1-person households, comprising 486.
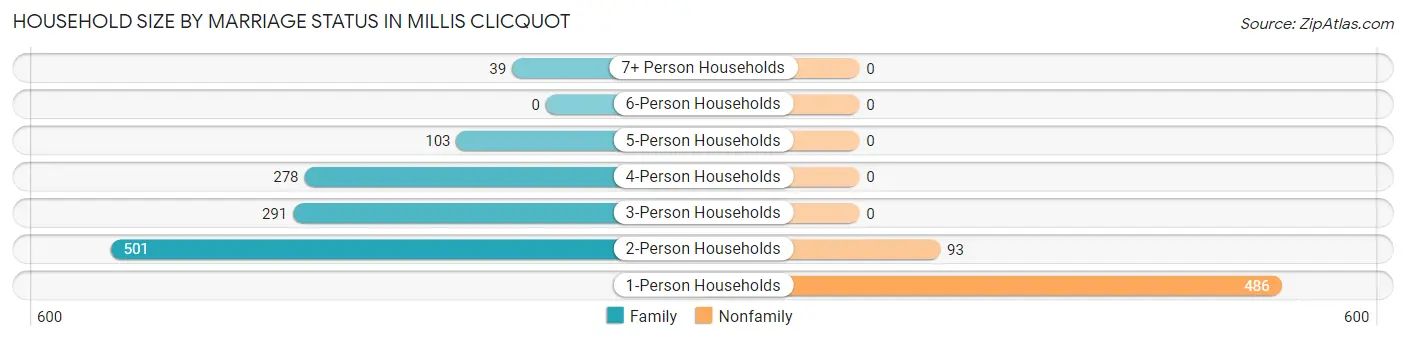
| Household Size | Family Households | Nonfamily Households |
| 1-Person Households | - | 486 (27.1%) |
| 2-Person Households | 501 (28.0%) | 93 (5.2%) |
| 3-Person Households | 291 (16.3%) | 0 (0.0%) |
| 4-Person Households | 278 (15.5%) | 0 (0.0%) |
| 5-Person Households | 103 (5.8%) | 0 (0.0%) |
| 6-Person Households | 0 (0.0%) | 0 (0.0%) |
| 7+ Person Households | 39 (2.2%) | 0 (0.0%) |
| Total | 1,212 (67.7%) | 579 (32.3%) |
Female Fertility in Millis Clicquot
Fertility by Age in Millis Clicquot
Average fertility rate in Millis Clicquot is 9.0 births per 1,000 women. Women in the age bracket of 20 to 34 years have the highest fertility rate with 29.0 births per 1,000 women. Women in the age bracket of 20 to 34 years acount for 100.0% of all women with births.
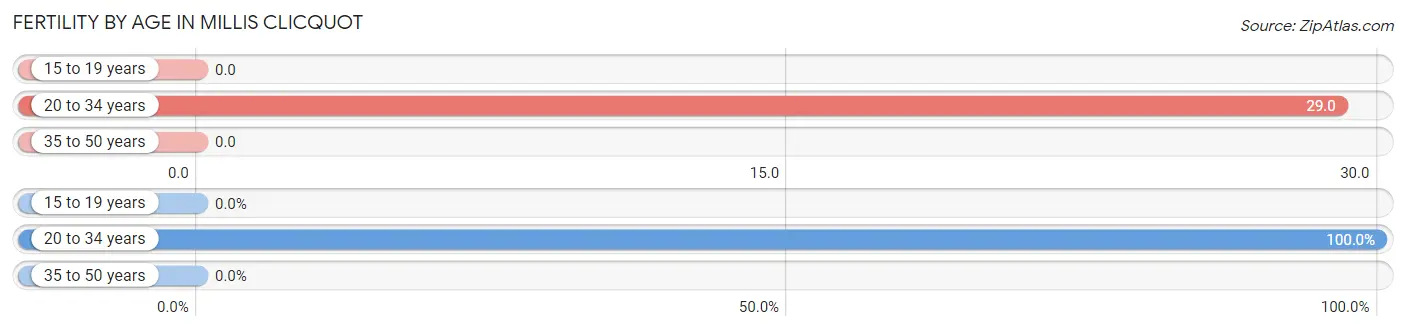
| Age Bracket | Women with Births | Births / 1,000 Women |
| 15 to 19 years | 0 (0.0%) | 0.0 |
| 20 to 34 years | 11 (100.0%) | 29.0 |
| 35 to 50 years | 0 (0.0%) | 0.0 |
| Total | 11 (100.0%) | 9.0 |
Fertility by Age by Marriage Status in Millis Clicquot
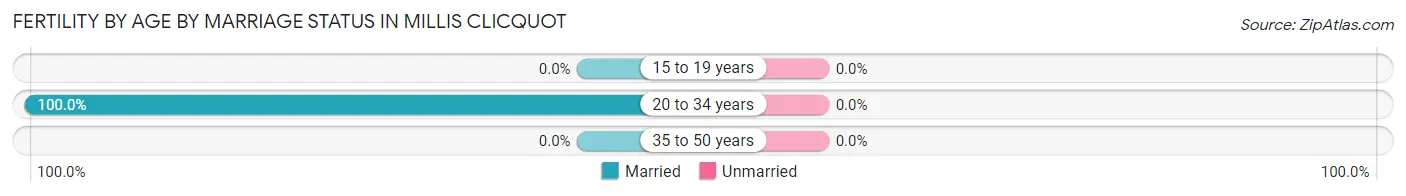
| Age Bracket | Married | Unmarried |
| 15 to 19 years | 0 (0.0%) | 0 (0.0%) |
| 20 to 34 years | 11 (100.0%) | 0 (0.0%) |
| 35 to 50 years | 0 (0.0%) | 0 (0.0%) |
| Total | 11 (100.0%) | 0 (0.0%) |
Fertility by Education in Millis Clicquot
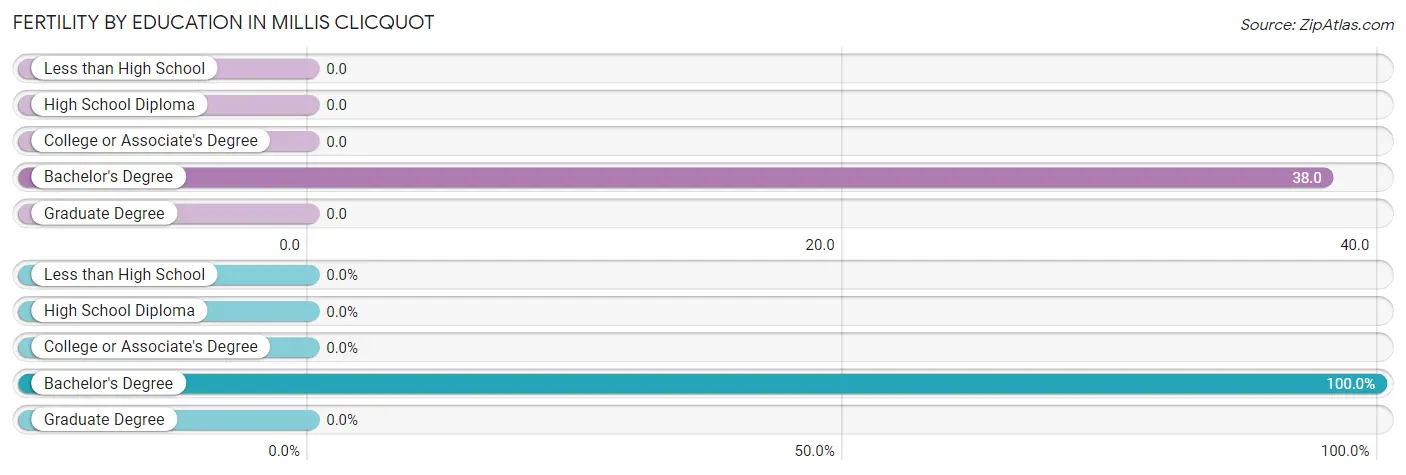
| Educational Attainment | Women with Births | Births / 1,000 Women |
| Less than High School | 0 (0.0%) | 0.0 |
| High School Diploma | 0 (0.0%) | 0.0 |
| College or Associate's Degree | 0 (0.0%) | 0.0 |
| Bachelor's Degree | 11 (100.0%) | 38.0 |
| Graduate Degree | 0 (0.0%) | 0.0 |
| Total | 11 (100.0%) | 9.0 |
Fertility by Education by Marriage Status in Millis Clicquot
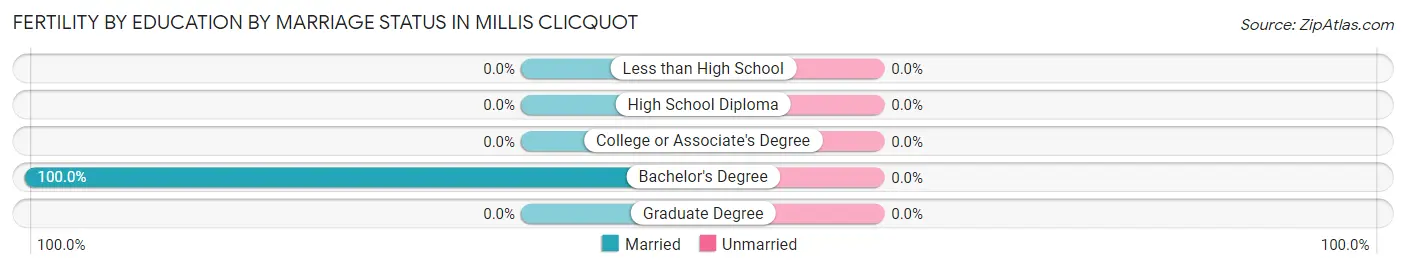
| Educational Attainment | Married | Unmarried |
| Less than High School | 0 (0.0%) | 0 (0.0%) |
| High School Diploma | 0 (0.0%) | 0 (0.0%) |
| College or Associate's Degree | 0 (0.0%) | 0 (0.0%) |
| Bachelor's Degree | 11 (100.0%) | 0 (0.0%) |
| Graduate Degree | 0 (0.0%) | 0 (0.0%) |
| Total | 11 (100.0%) | 0 (0.0%) |
Employment Characteristics in Millis Clicquot
Employment by Class of Employer in Millis Clicquot
Among the 2,684 employed individuals in Millis Clicquot, private company employees (1,734 | 64.6%), local government employees (294 | 11.0%), and self-employed (not incorporated) (217 | 8.1%) make up the most common classes of employment.
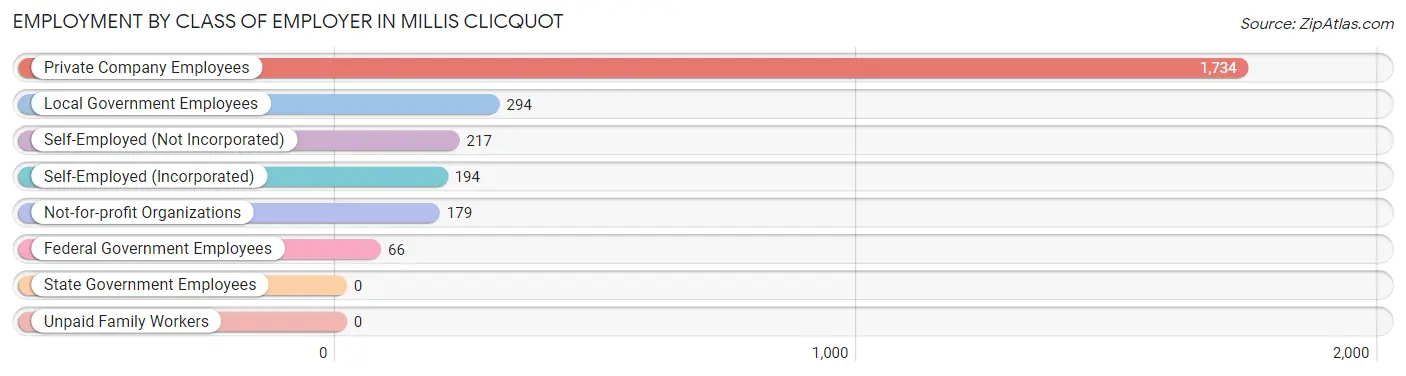
| Employer Class | # Employees | % Employees |
| Private Company Employees | 1,734 | 64.6% |
| Self-Employed (Incorporated) | 194 | 7.2% |
| Self-Employed (Not Incorporated) | 217 | 8.1% |
| Not-for-profit Organizations | 179 | 6.7% |
| Local Government Employees | 294 | 11.0% |
| State Government Employees | 0 | 0.0% |
| Federal Government Employees | 66 | 2.5% |
| Unpaid Family Workers | 0 | 0.0% |
| Total | 2,684 | 100.0% |
Employment Status by Age in Millis Clicquot
According to the labor force statistics for Millis Clicquot, out of the total population over 16 years of age (3,816), 72.8% or 2,778 individuals are in the labor force, with 1.8% or 50 of them unemployed. The age group with the highest labor force participation rate is 45 to 54 years, with 95.4% or 626 individuals in the labor force. Within the labor force, the 20 to 24 years age range has the highest percentage of unemployed individuals, with 6.4% or 10 of them being unemployed.
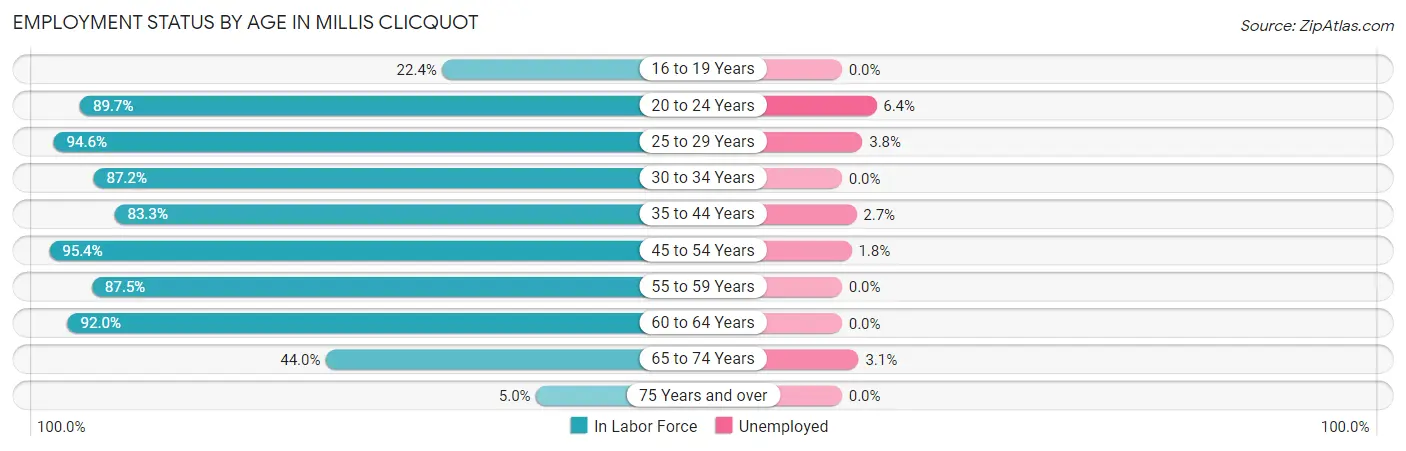
| Age Bracket | In Labor Force | Unemployed |
| 16 to 19 Years | 65 (22.4%) | 0 (0.0%) |
| 20 to 24 Years | 157 (89.7%) | 10 (6.4%) |
| 25 to 29 Years | 209 (94.6%) | 8 (3.8%) |
| 30 to 34 Years | 273 (87.2%) | 0 (0.0%) |
| 35 to 44 Years | 478 (83.3%) | 13 (2.7%) |
| 45 to 54 Years | 626 (95.4%) | 11 (1.8%) |
| 55 to 59 Years | 232 (87.5%) | 0 (0.0%) |
| 60 to 64 Years | 437 (92.0%) | 0 (0.0%) |
| 65 to 74 Years | 293 (44.0%) | 9 (3.1%) |
| 75 Years and over | 9 (5.0%) | 0 (0.0%) |
| Total | 2,778 (72.8%) | 50 (1.8%) |
Employment Status by Educational Attainment in Millis Clicquot
According to labor force statistics for Millis Clicquot, 90.1% of individuals (2,256) out of the total population between 25 and 64 years of age (2,504) are in the labor force, with 1.4% or 32 of them being unemployed. The group with the highest labor force participation rate are those with the educational attainment of high school diploma, with 93.9% or 429 individuals in the labor force. Within the labor force, individuals with bachelor's degree or higher education have the highest percentage of unemployment, with 2.6% or 32 of them being unemployed.
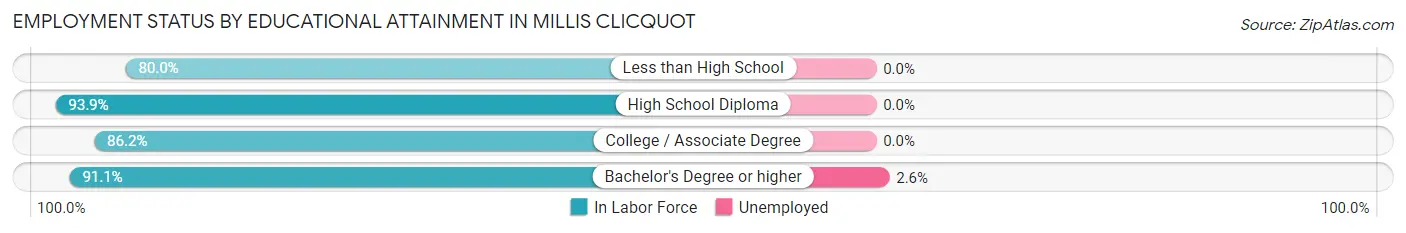
| Educational Attainment | In Labor Force | Unemployed |
| Less than High School | 44 (80.0%) | 0 (0.0%) |
| High School Diploma | 429 (93.9%) | 0 (0.0%) |
| College / Associate Degree | 560 (86.2%) | 0 (0.0%) |
| Bachelor's Degree or higher | 1,223 (91.1%) | 35 (2.6%) |
| Total | 2,256 (90.1%) | 35 (1.4%) |
Employment Occupations by Sex in Millis Clicquot
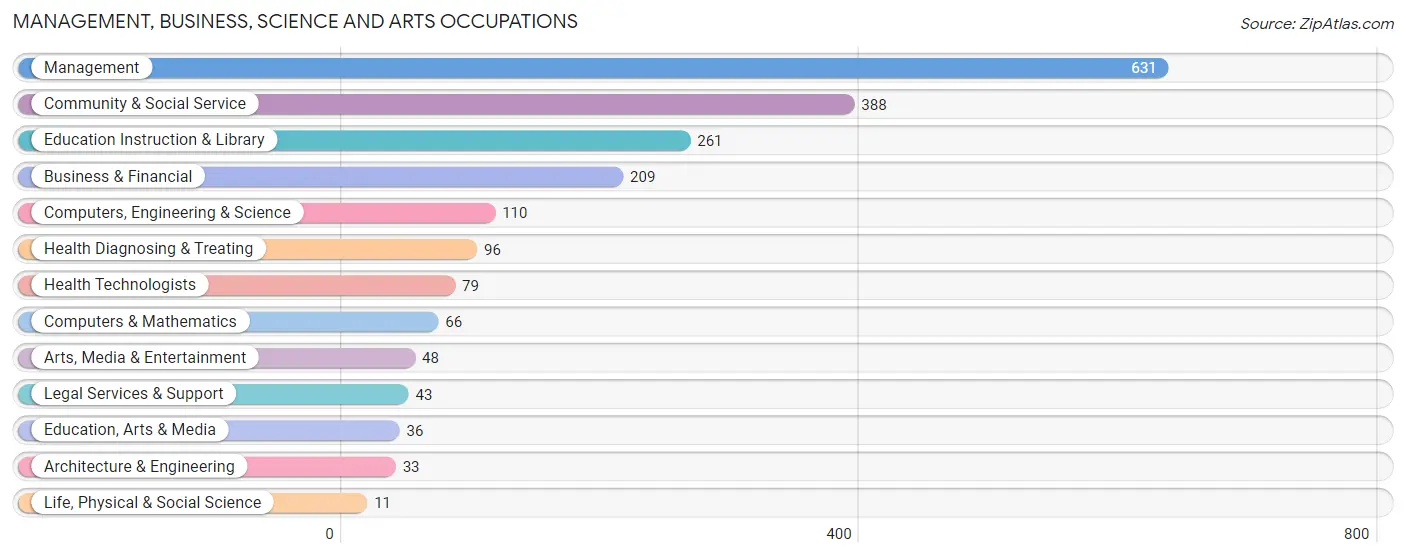
Management, Business, Science and Arts Occupations
The most common Management, Business, Science and Arts occupations in Millis Clicquot are Management (631 | 23.1%), Community & Social Service (388 | 14.2%), Education Instruction & Library (261 | 9.6%), Business & Financial (209 | 7.7%), and Computers, Engineering & Science (110 | 4.0%).
Management, Business, Science and Arts Occupations by Sex
Within the Management, Business, Science and Arts occupations in Millis Clicquot, the most male-oriented occupations are Life, Physical & Social Science (100.0%), Computers & Mathematics (78.8%), and Computers, Engineering & Science (74.6%), while the most female-oriented occupations are Education, Arts & Media (100.0%), Health Technologists (100.0%), and Education Instruction & Library (85.4%).
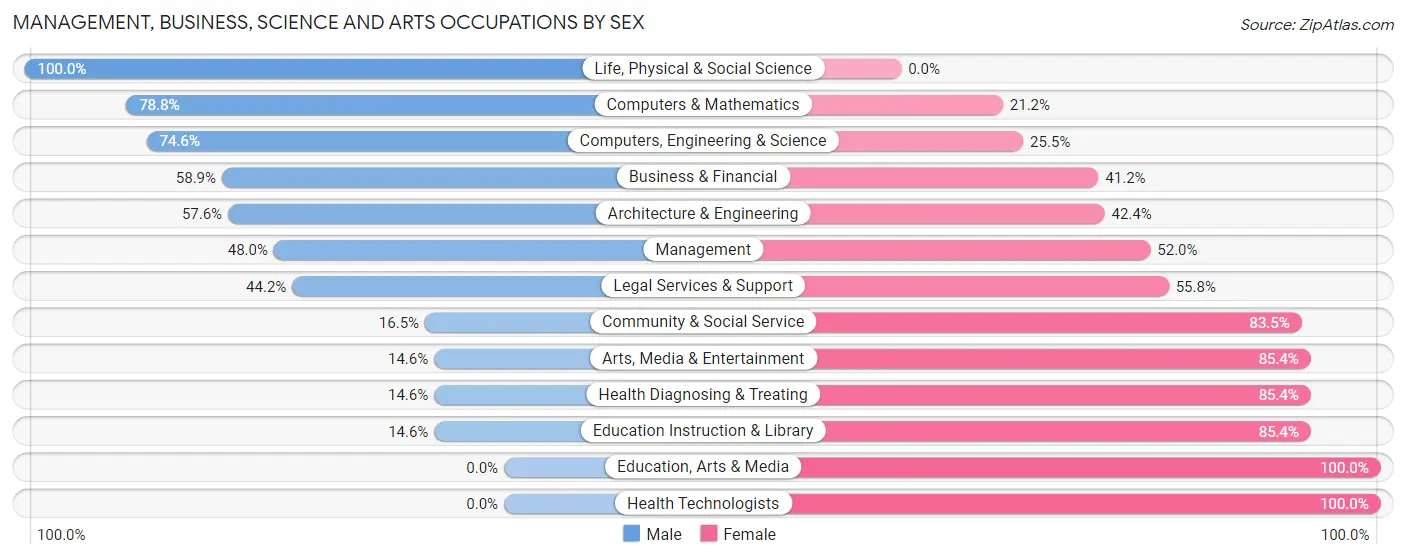
| Occupation | Male | Female |
| Management | 303 (48.0%) | 328 (52.0%) |
| Business & Financial | 123 (58.9%) | 86 (41.1%) |
| Computers, Engineering & Science | 82 (74.6%) | 28 (25.5%) |
| Computers & Mathematics | 52 (78.8%) | 14 (21.2%) |
| Architecture & Engineering | 19 (57.6%) | 14 (42.4%) |
| Life, Physical & Social Science | 11 (100.0%) | 0 (0.0%) |
| Community & Social Service | 64 (16.5%) | 324 (83.5%) |
| Education, Arts & Media | 0 (0.0%) | 36 (100.0%) |
| Legal Services & Support | 19 (44.2%) | 24 (55.8%) |
| Education Instruction & Library | 38 (14.6%) | 223 (85.4%) |
| Arts, Media & Entertainment | 7 (14.6%) | 41 (85.4%) |
| Health Diagnosing & Treating | 14 (14.6%) | 82 (85.4%) |
| Health Technologists | 0 (0.0%) | 79 (100.0%) |
| Total (Category) | 586 (40.9%) | 848 (59.1%) |
| Total (Overall) | 1,310 (48.0%) | 1,418 (52.0%) |
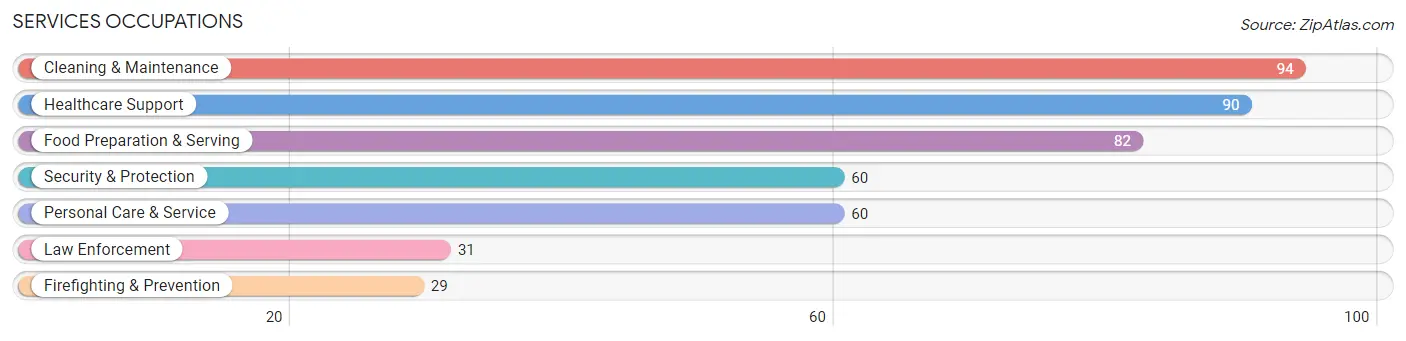
Services Occupations
The most common Services occupations in Millis Clicquot are Cleaning & Maintenance (94 | 3.5%), Healthcare Support (90 | 3.3%), Food Preparation & Serving (82 | 3.0%), Security & Protection (60 | 2.2%), and Personal Care & Service (60 | 2.2%).
Services Occupations by Sex
Within the Services occupations in Millis Clicquot, the most male-oriented occupations are Law Enforcement (100.0%), Cleaning & Maintenance (100.0%), and Security & Protection (51.7%), while the most female-oriented occupations are Firefighting & Prevention (100.0%), Personal Care & Service (93.3%), and Healthcare Support (64.4%).
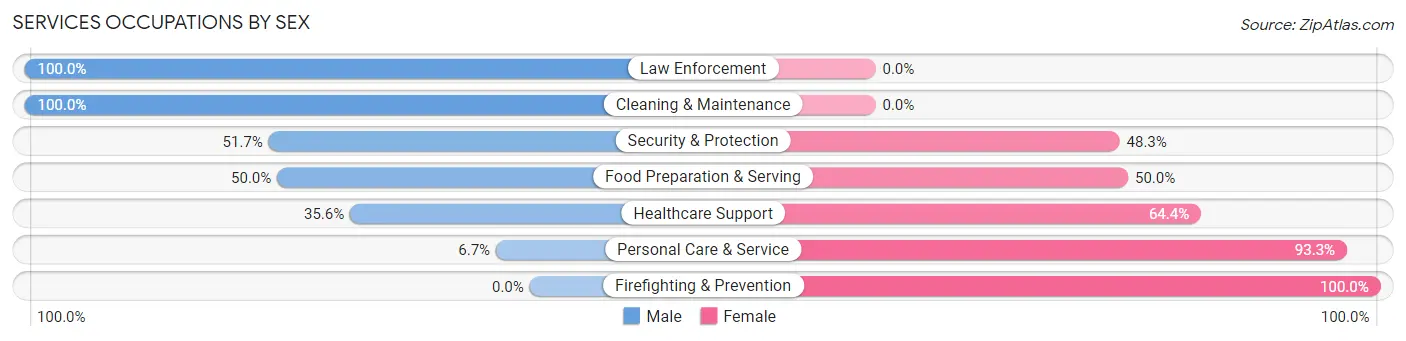
| Occupation | Male | Female |
| Healthcare Support | 32 (35.6%) | 58 (64.4%) |
| Security & Protection | 31 (51.7%) | 29 (48.3%) |
| Firefighting & Prevention | 0 (0.0%) | 29 (100.0%) |
| Law Enforcement | 31 (100.0%) | 0 (0.0%) |
| Food Preparation & Serving | 41 (50.0%) | 41 (50.0%) |
| Cleaning & Maintenance | 94 (100.0%) | 0 (0.0%) |
| Personal Care & Service | 4 (6.7%) | 56 (93.3%) |
| Total (Category) | 202 (52.3%) | 184 (47.7%) |
| Total (Overall) | 1,310 (48.0%) | 1,418 (52.0%) |
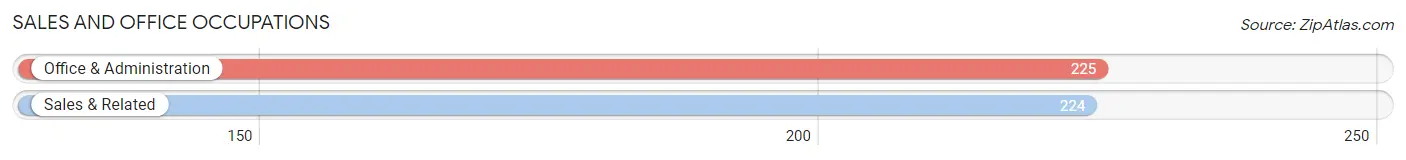
Sales and Office Occupations
The most common Sales and Office occupations in Millis Clicquot are Office & Administration (225 | 8.3%), and Sales & Related (224 | 8.2%).
Sales and Office Occupations by Sex
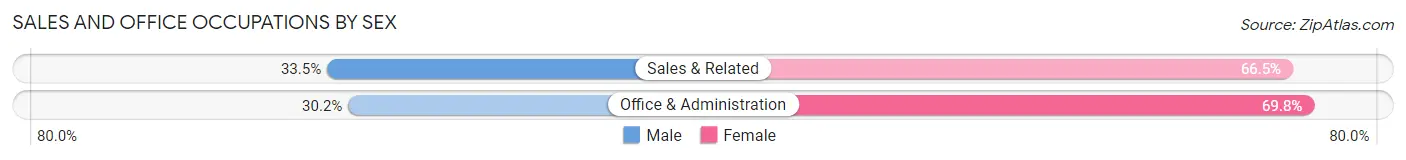
| Occupation | Male | Female |
| Sales & Related | 75 (33.5%) | 149 (66.5%) |
| Office & Administration | 68 (30.2%) | 157 (69.8%) |
| Total (Category) | 143 (31.9%) | 306 (68.1%) |
| Total (Overall) | 1,310 (48.0%) | 1,418 (52.0%) |
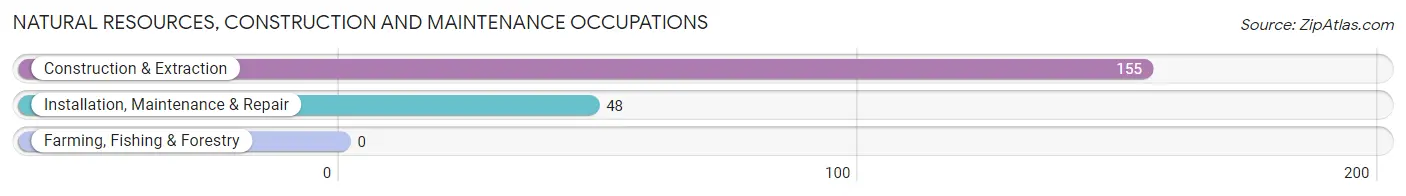
Natural Resources, Construction and Maintenance Occupations
The most common Natural Resources, Construction and Maintenance occupations in Millis Clicquot are Construction & Extraction (155 | 5.7%), and Installation, Maintenance & Repair (48 | 1.8%).
Natural Resources, Construction and Maintenance Occupations by Sex
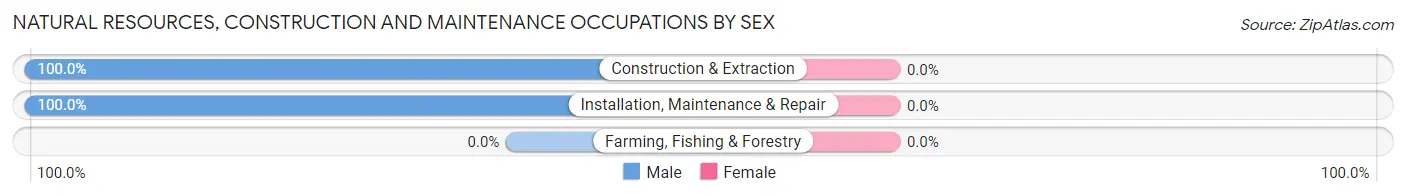
| Occupation | Male | Female |
| Farming, Fishing & Forestry | 0 (0.0%) | 0 (0.0%) |
| Construction & Extraction | 155 (100.0%) | 0 (0.0%) |
| Installation, Maintenance & Repair | 48 (100.0%) | 0 (0.0%) |
| Total (Category) | 203 (100.0%) | 0 (0.0%) |
| Total (Overall) | 1,310 (48.0%) | 1,418 (52.0%) |
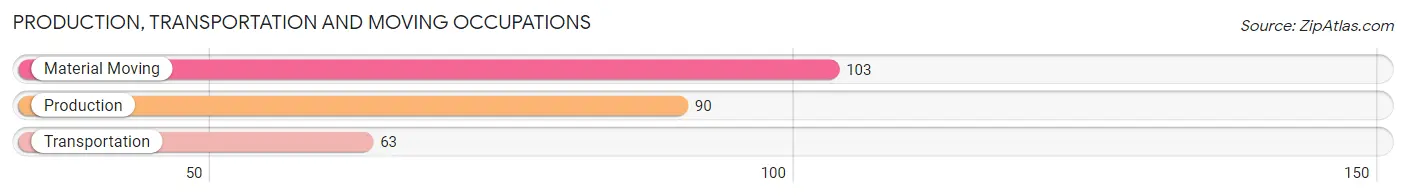
Production, Transportation and Moving Occupations
The most common Production, Transportation and Moving occupations in Millis Clicquot are Material Moving (103 | 3.8%), Production (90 | 3.3%), and Transportation (63 | 2.3%).
Production, Transportation and Moving Occupations by Sex
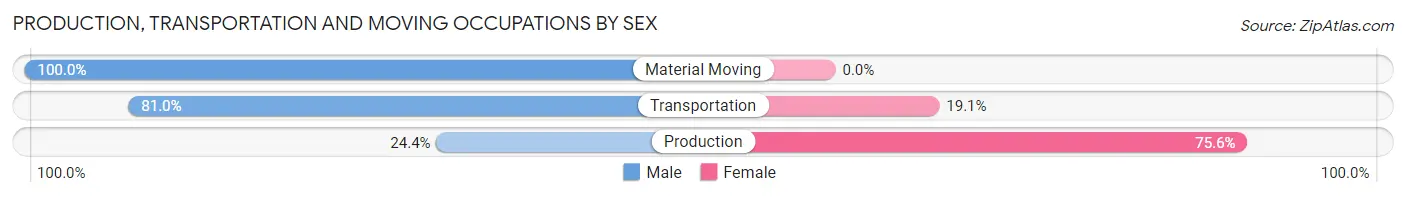
| Occupation | Male | Female |
| Production | 22 (24.4%) | 68 (75.6%) |
| Transportation | 51 (80.9%) | 12 (19.1%) |
| Material Moving | 103 (100.0%) | 0 (0.0%) |
| Total (Category) | 176 (68.8%) | 80 (31.2%) |
| Total (Overall) | 1,310 (48.0%) | 1,418 (52.0%) |
Employment Industries by Sex in Millis Clicquot
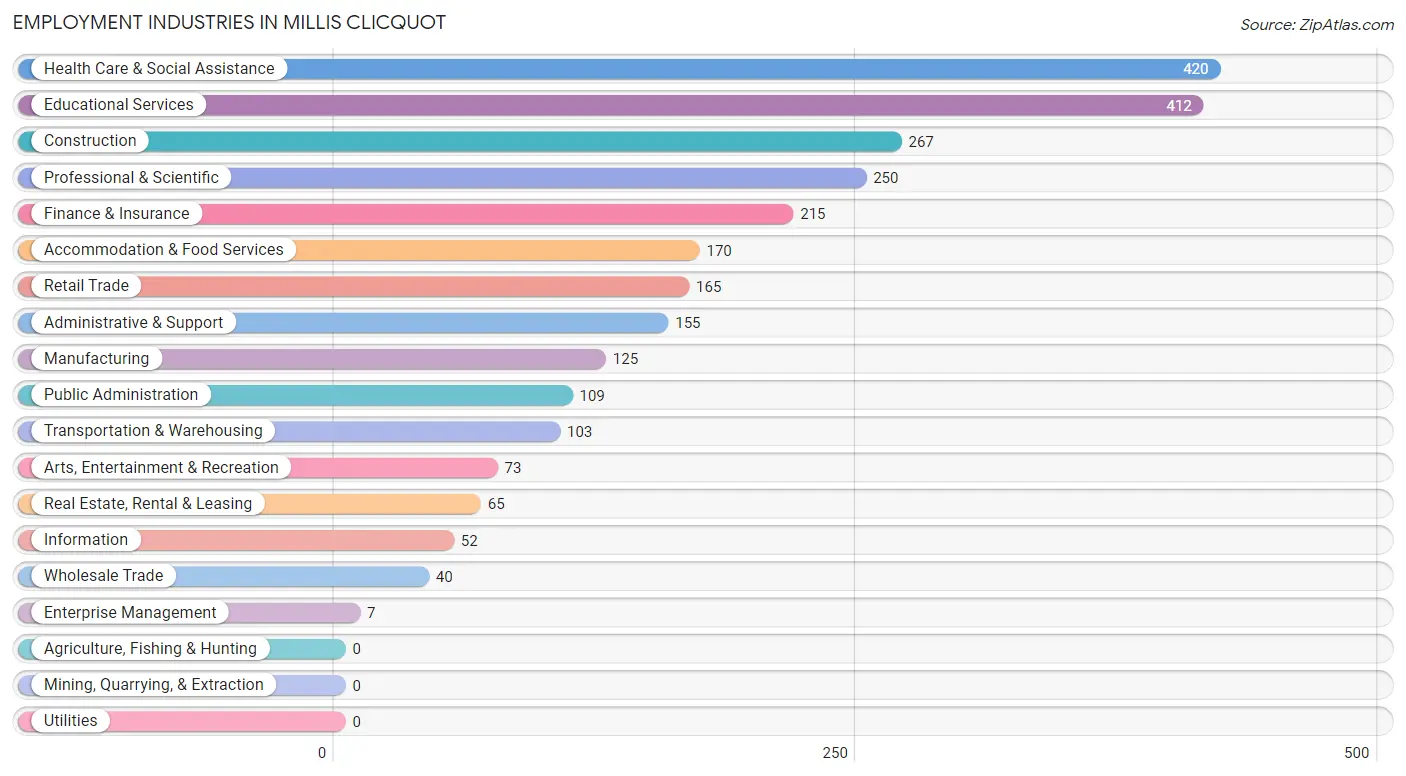
Employment Industries in Millis Clicquot
The major employment industries in Millis Clicquot include Health Care & Social Assistance (420 | 15.4%), Educational Services (412 | 15.1%), Construction (267 | 9.8%), Professional & Scientific (250 | 9.2%), and Finance & Insurance (215 | 7.9%).
Employment Industries by Sex in Millis Clicquot
The Millis Clicquot industries that see more men than women are Construction (100.0%), Wholesale Trade (100.0%), and Transportation & Warehousing (88.3%), whereas the industries that tend to have a higher number of women are Enterprise Management (100.0%), Health Care & Social Assistance (87.1%), and Educational Services (72.1%).
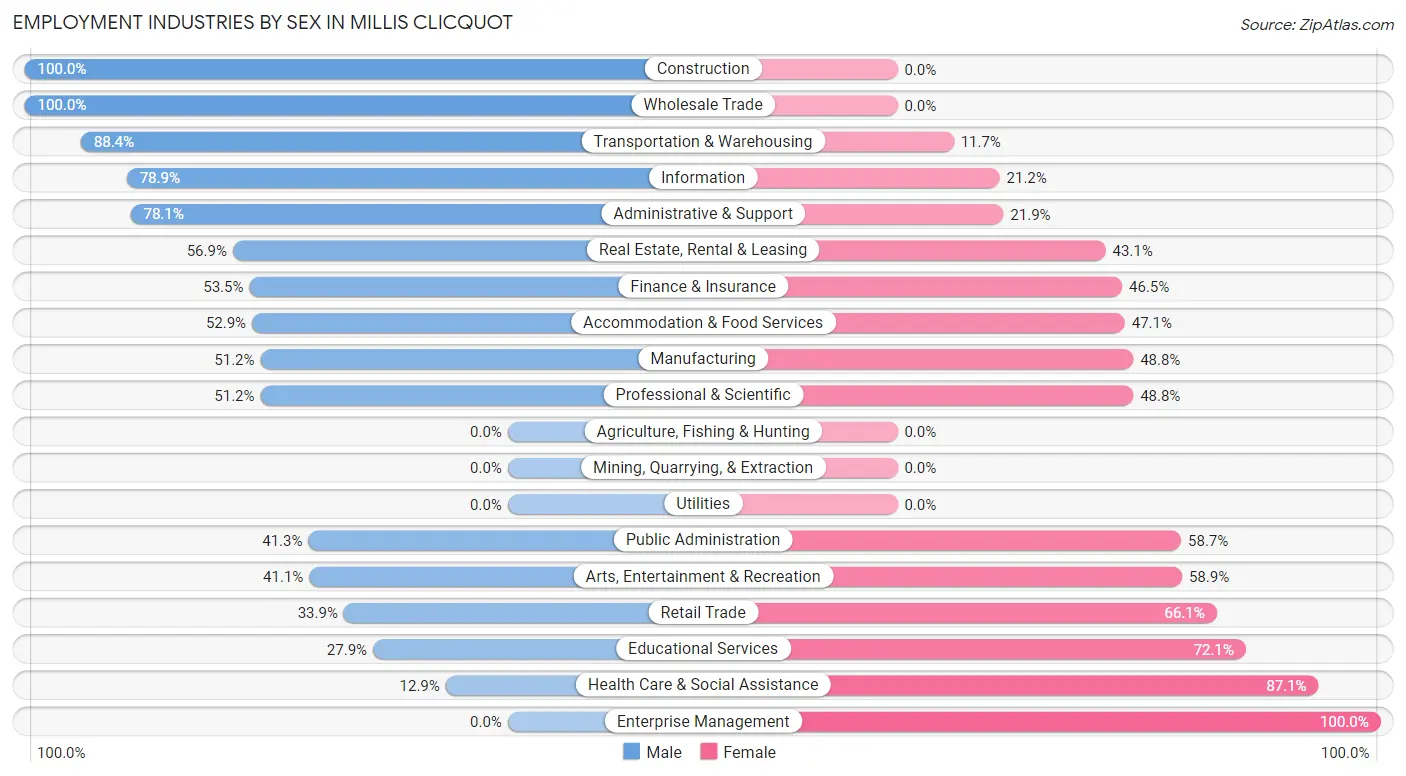
| Industry | Male | Female |
| Agriculture, Fishing & Hunting | 0 (0.0%) | 0 (0.0%) |
| Mining, Quarrying, & Extraction | 0 (0.0%) | 0 (0.0%) |
| Construction | 267 (100.0%) | 0 (0.0%) |
| Manufacturing | 64 (51.2%) | 61 (48.8%) |
| Wholesale Trade | 40 (100.0%) | 0 (0.0%) |
| Retail Trade | 56 (33.9%) | 109 (66.1%) |
| Transportation & Warehousing | 91 (88.3%) | 12 (11.7%) |
| Utilities | 0 (0.0%) | 0 (0.0%) |
| Information | 41 (78.8%) | 11 (21.1%) |
| Finance & Insurance | 115 (53.5%) | 100 (46.5%) |
| Real Estate, Rental & Leasing | 37 (56.9%) | 28 (43.1%) |
| Professional & Scientific | 128 (51.2%) | 122 (48.8%) |
| Enterprise Management | 0 (0.0%) | 7 (100.0%) |
| Administrative & Support | 121 (78.1%) | 34 (21.9%) |
| Educational Services | 115 (27.9%) | 297 (72.1%) |
| Health Care & Social Assistance | 54 (12.9%) | 366 (87.1%) |
| Arts, Entertainment & Recreation | 30 (41.1%) | 43 (58.9%) |
| Accommodation & Food Services | 90 (52.9%) | 80 (47.1%) |
| Public Administration | 45 (41.3%) | 64 (58.7%) |
| Total | 1,310 (48.0%) | 1,418 (52.0%) |
Education in Millis Clicquot
School Enrollment in Millis Clicquot
The most common levels of schooling among the 1,151 students in Millis Clicquot are high school (394 | 34.2%), middle school (280 | 24.3%), and college / undergraduate (210 | 18.2%).
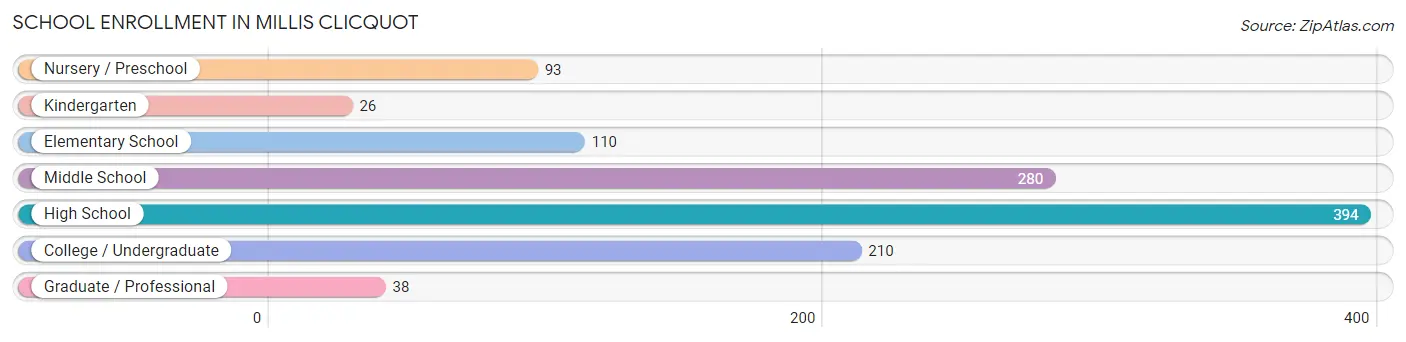
| School Level | # Students | % Students |
| Nursery / Preschool | 93 | 8.1% |
| Kindergarten | 26 | 2.3% |
| Elementary School | 110 | 9.6% |
| Middle School | 280 | 24.3% |
| High School | 394 | 34.2% |
| College / Undergraduate | 210 | 18.2% |
| Graduate / Professional | 38 | 3.3% |
| Total | 1,151 | 100.0% |
School Enrollment by Age by Funding Source in Millis Clicquot
Out of a total of 1,151 students who are enrolled in schools in Millis Clicquot, 261 (22.7%) attend a private institution, while the remaining 890 (77.3%) are enrolled in public schools. The age group of 3 to 4 year olds has the highest likelihood of being enrolled in private schools, with 75 (80.6% in the age bracket) enrolled. Conversely, the age group of 5 to 9 year old has the lowest likelihood of being enrolled in a private school, with 113 (100.0% in the age bracket) attending a public institution.
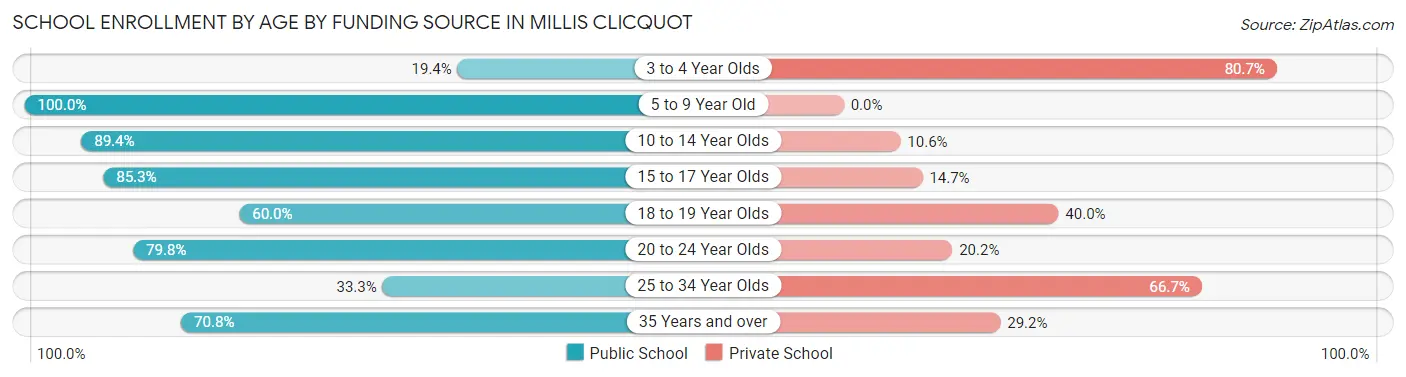
| Age Bracket | Public School | Private School |
| 3 to 4 Year Olds | 18 (19.4%) | 75 (80.6%) |
| 5 to 9 Year Old | 113 (100.0%) | 0 (0.0%) |
| 10 to 14 Year Olds | 330 (89.4%) | 39 (10.6%) |
| 15 to 17 Year Olds | 256 (85.3%) | 44 (14.7%) |
| 18 to 19 Year Olds | 69 (60.0%) | 46 (40.0%) |
| 20 to 24 Year Olds | 71 (79.8%) | 18 (20.2%) |
| 25 to 34 Year Olds | 16 (33.3%) | 32 (66.7%) |
| 35 Years and over | 17 (70.8%) | 7 (29.2%) |
| Total | 890 (77.3%) | 261 (22.7%) |
Educational Attainment by Field of Study in Millis Clicquot
Business (366 | 24.2%), education (209 | 13.8%), psychology (134 | 8.9%), arts & humanities (125 | 8.3%), and science & technology (117 | 7.7%) are the most common fields of study among 1,510 individuals in Millis Clicquot who have obtained a bachelor's degree or higher.
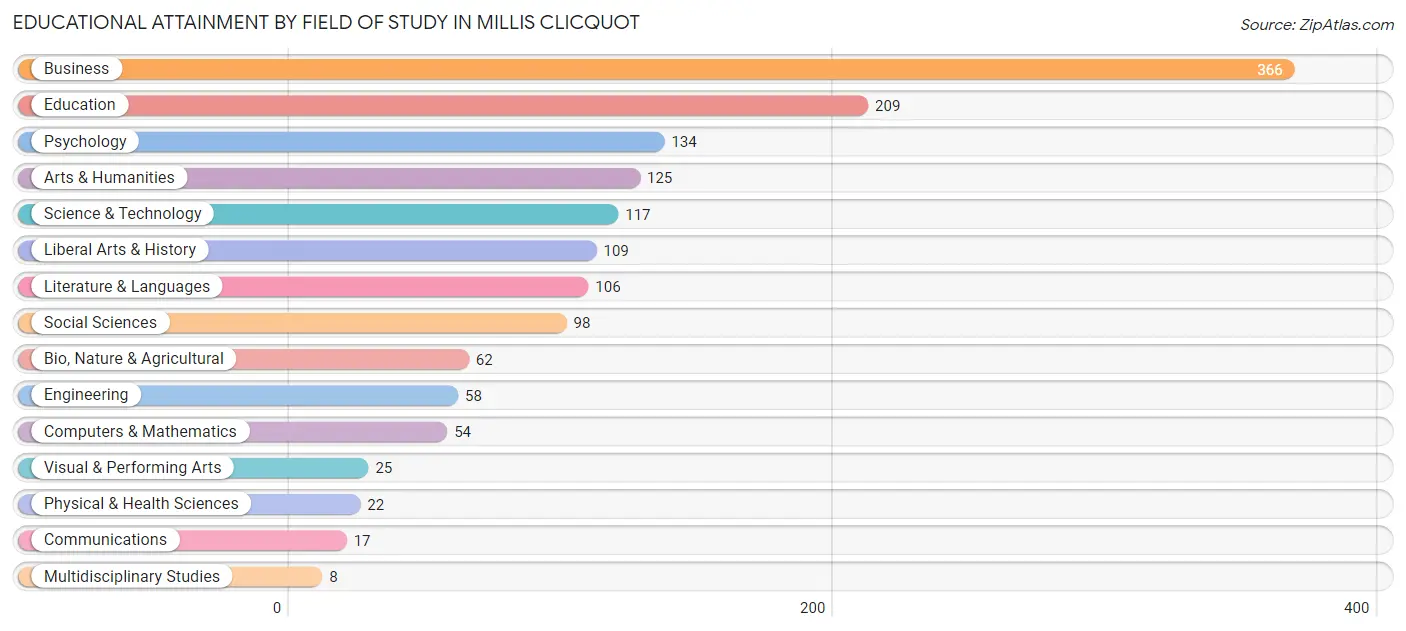
| Field of Study | # Graduates | % Graduates |
| Computers & Mathematics | 54 | 3.6% |
| Bio, Nature & Agricultural | 62 | 4.1% |
| Physical & Health Sciences | 22 | 1.5% |
| Psychology | 134 | 8.9% |
| Social Sciences | 98 | 6.5% |
| Engineering | 58 | 3.8% |
| Multidisciplinary Studies | 8 | 0.5% |
| Science & Technology | 117 | 7.7% |
| Business | 366 | 24.2% |
| Education | 209 | 13.8% |
| Literature & Languages | 106 | 7.0% |
| Liberal Arts & History | 109 | 7.2% |
| Visual & Performing Arts | 25 | 1.7% |
| Communications | 17 | 1.1% |
| Arts & Humanities | 125 | 8.3% |
| Total | 1,510 | 100.0% |
Transportation & Commute in Millis Clicquot
Vehicle Availability by Sex in Millis Clicquot
The most prevalent vehicle ownership categories in Millis Clicquot are males with 2 vehicles (578, accounting for 44.5%) and females with 2 vehicles (569, making up 41.8%).
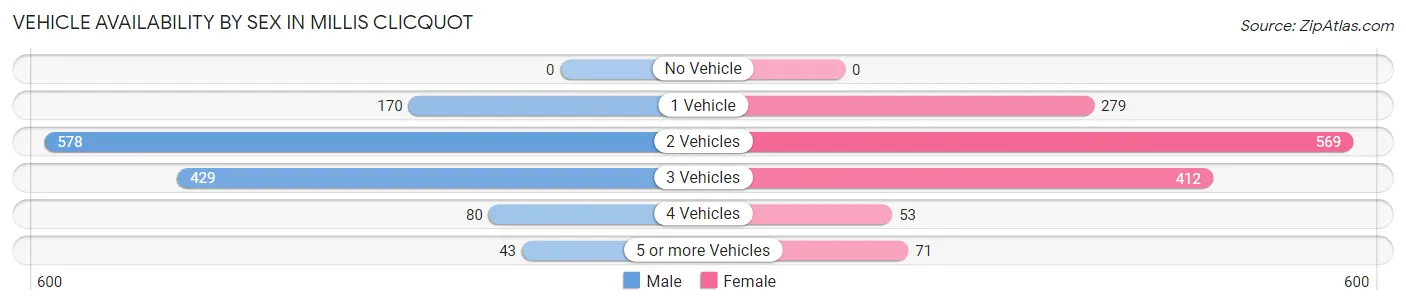
| Vehicles Available | Male | Female |
| No Vehicle | 0 (0.0%) | 0 (0.0%) |
| 1 Vehicle | 170 (13.1%) | 279 (20.2%) |
| 2 Vehicles | 578 (44.5%) | 569 (41.1%) |
| 3 Vehicles | 429 (33.0%) | 412 (29.8%) |
| 4 Vehicles | 80 (6.1%) | 53 (3.8%) |
| 5 or more Vehicles | 43 (3.3%) | 71 (5.1%) |
| Total | 1,300 (100.0%) | 1,384 (100.0%) |
Commute Time in Millis Clicquot
The most frequently occuring commute durations in Millis Clicquot are 15 to 19 minutes (460 commuters, 20.1%), 45 to 59 minutes (359 commuters, 15.7%), and 20 to 24 minutes (316 commuters, 13.8%).
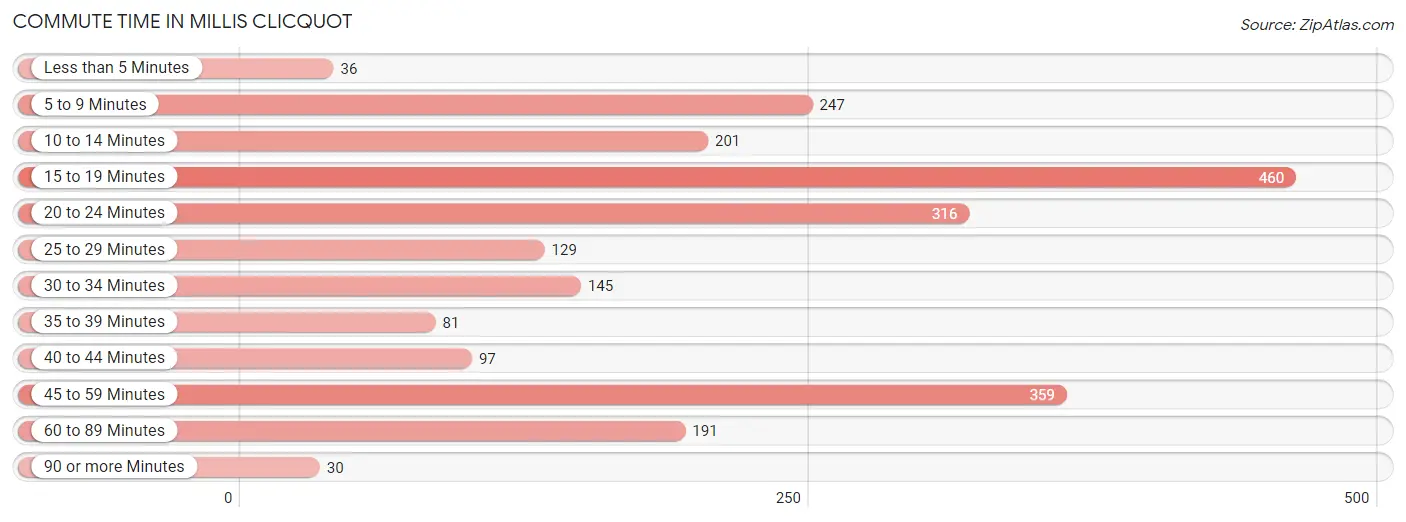
| Commute Time | # Commuters | % Commuters |
| Less than 5 Minutes | 36 | 1.6% |
| 5 to 9 Minutes | 247 | 10.8% |
| 10 to 14 Minutes | 201 | 8.8% |
| 15 to 19 Minutes | 460 | 20.1% |
| 20 to 24 Minutes | 316 | 13.8% |
| 25 to 29 Minutes | 129 | 5.6% |
| 30 to 34 Minutes | 145 | 6.3% |
| 35 to 39 Minutes | 81 | 3.5% |
| 40 to 44 Minutes | 97 | 4.2% |
| 45 to 59 Minutes | 359 | 15.7% |
| 60 to 89 Minutes | 191 | 8.3% |
| 90 or more Minutes | 30 | 1.3% |
Commute Time by Sex in Millis Clicquot
The most common commute times in Millis Clicquot are 15 to 19 minutes (254 commuters, 22.8%) for males and 45 to 59 minutes (316 commuters, 26.8%) for females.
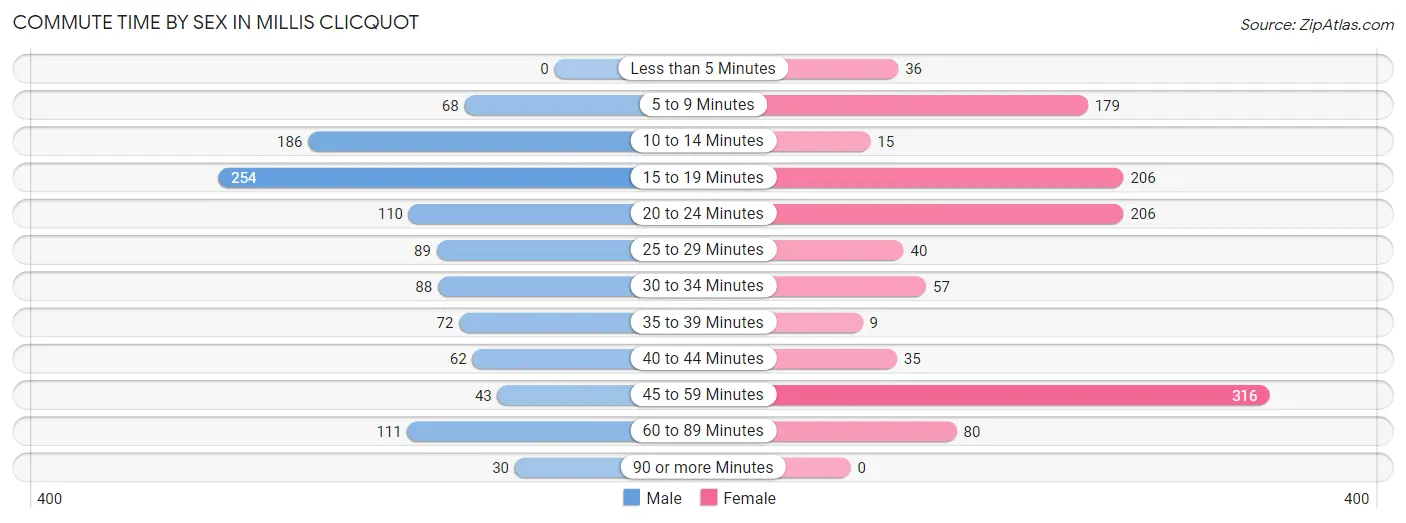
| Commute Time | Male | Female |
| Less than 5 Minutes | 0 (0.0%) | 36 (3.0%) |
| 5 to 9 Minutes | 68 (6.1%) | 179 (15.2%) |
| 10 to 14 Minutes | 186 (16.7%) | 15 (1.3%) |
| 15 to 19 Minutes | 254 (22.8%) | 206 (17.5%) |
| 20 to 24 Minutes | 110 (9.9%) | 206 (17.5%) |
| 25 to 29 Minutes | 89 (8.0%) | 40 (3.4%) |
| 30 to 34 Minutes | 88 (7.9%) | 57 (4.8%) |
| 35 to 39 Minutes | 72 (6.5%) | 9 (0.8%) |
| 40 to 44 Minutes | 62 (5.6%) | 35 (3.0%) |
| 45 to 59 Minutes | 43 (3.9%) | 316 (26.8%) |
| 60 to 89 Minutes | 111 (10.0%) | 80 (6.8%) |
| 90 or more Minutes | 30 (2.7%) | 0 (0.0%) |
Time of Departure to Work by Sex in Millis Clicquot
The most frequent times of departure to work in Millis Clicquot are 8:00 AM to 8:29 AM (209, 18.8%) for males and 9:00 AM to 9:59 AM (278, 23.6%) for females.
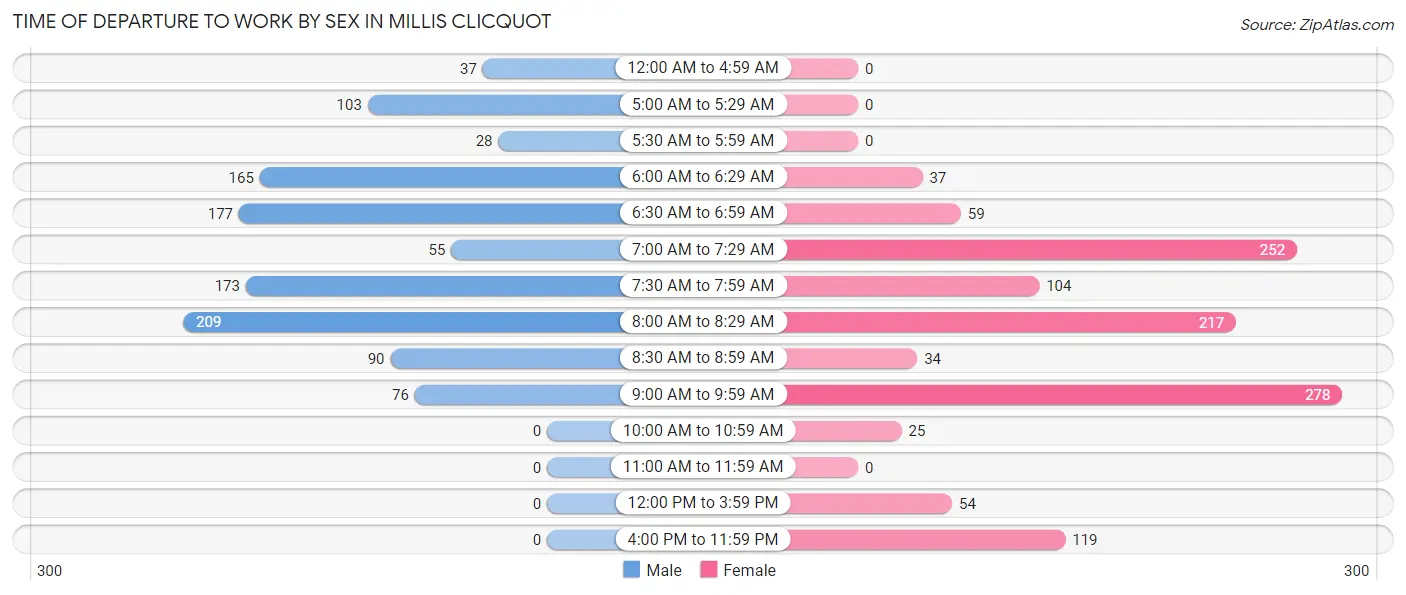
| Time of Departure | Male | Female |
| 12:00 AM to 4:59 AM | 37 (3.3%) | 0 (0.0%) |
| 5:00 AM to 5:29 AM | 103 (9.2%) | 0 (0.0%) |
| 5:30 AM to 5:59 AM | 28 (2.5%) | 0 (0.0%) |
| 6:00 AM to 6:29 AM | 165 (14.8%) | 37 (3.1%) |
| 6:30 AM to 6:59 AM | 177 (15.9%) | 59 (5.0%) |
| 7:00 AM to 7:29 AM | 55 (4.9%) | 252 (21.4%) |
| 7:30 AM to 7:59 AM | 173 (15.5%) | 104 (8.8%) |
| 8:00 AM to 8:29 AM | 209 (18.8%) | 217 (18.4%) |
| 8:30 AM to 8:59 AM | 90 (8.1%) | 34 (2.9%) |
| 9:00 AM to 9:59 AM | 76 (6.8%) | 278 (23.6%) |
| 10:00 AM to 10:59 AM | 0 (0.0%) | 25 (2.1%) |
| 11:00 AM to 11:59 AM | 0 (0.0%) | 0 (0.0%) |
| 12:00 PM to 3:59 PM | 0 (0.0%) | 54 (4.6%) |
| 4:00 PM to 11:59 PM | 0 (0.0%) | 119 (10.1%) |
| Total | 1,113 (100.0%) | 1,179 (100.0%) |
Housing Occupancy in Millis Clicquot
Occupancy by Ownership in Millis Clicquot
Of the total 1,791 dwellings in Millis Clicquot, owner-occupied units account for 1,382 (77.2%), while renter-occupied units make up 409 (22.8%).
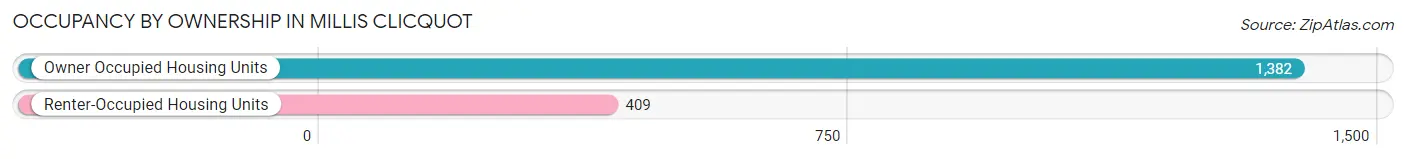
| Occupancy | # Housing Units | % Housing Units |
| Owner Occupied Housing Units | 1,382 | 77.2% |
| Renter-Occupied Housing Units | 409 | 22.8% |
| Total Occupied Housing Units | 1,791 | 100.0% |
Occupancy by Household Size in Millis Clicquot
| Household Size | # Housing Units | % Housing Units |
| 1-Person Household | 486 | 27.1% |
| 2-Person Household | 594 | 33.2% |
| 3-Person Household | 291 | 16.3% |
| 4+ Person Household | 420 | 23.4% |
| Total Housing Units | 1,791 | 100.0% |
Occupancy by Ownership by Household Size in Millis Clicquot
| Household Size | Owner-occupied | Renter-occupied |
| 1-Person Household | 273 (56.2%) | 213 (43.8%) |
| 2-Person Household | 524 (88.2%) | 70 (11.8%) |
| 3-Person Household | 242 (83.2%) | 49 (16.8%) |
| 4+ Person Household | 343 (81.7%) | 77 (18.3%) |
| Total Housing Units | 1,382 (77.2%) | 409 (22.8%) |
Occupancy by Educational Attainment in Millis Clicquot
| Household Size | Owner-occupied | Renter-occupied |
| Less than High School | 0 (0.0%) | 15 (100.0%) |
| High School Diploma | 235 (68.7%) | 107 (31.3%) |
| College/Associate Degree | 313 (59.7%) | 211 (40.3%) |
| Bachelor's Degree or higher | 834 (91.6%) | 76 (8.4%) |
Occupancy by Age of Householder in Millis Clicquot
| Age Bracket | # Households | % Households |
| Under 35 Years | 124 | 6.9% |
| 35 to 44 Years | 329 | 18.4% |
| 45 to 54 Years | 387 | 21.6% |
| 55 to 64 Years | 553 | 30.9% |
| 65 to 74 Years | 307 | 17.1% |
| 75 to 84 Years | 67 | 3.7% |
| 85 Years and Over | 24 | 1.3% |
| Total | 1,791 | 100.0% |
Housing Finances in Millis Clicquot
Median Income by Occupancy in Millis Clicquot
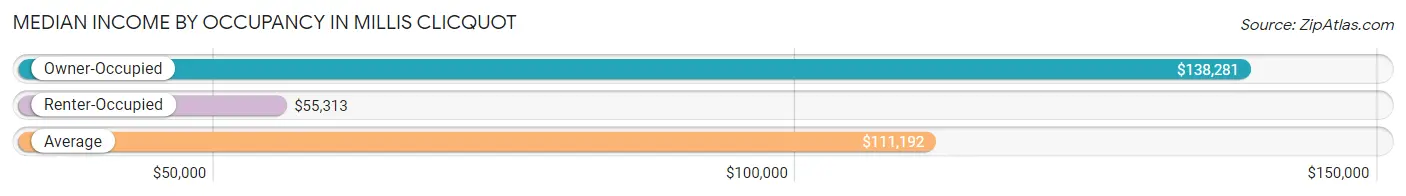
| Occupancy Type | # Households | Median Income |
| Owner-Occupied | 1,382 (77.2%) | $138,281 |
| Renter-Occupied | 409 (22.8%) | $55,313 |
| Average | 1,791 (100.0%) | $111,192 |
Occupancy by Householder Income Bracket in Millis Clicquot
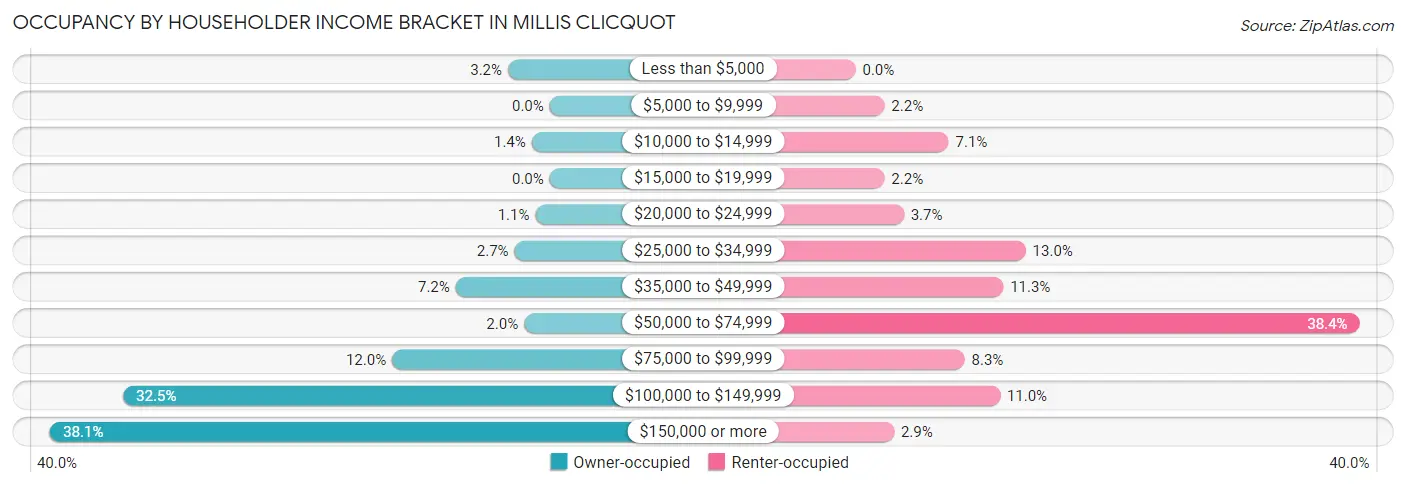
| Income Bracket | Owner-occupied | Renter-occupied |
| Less than $5,000 | 44 (3.2%) | 0 (0.0%) |
| $5,000 to $9,999 | 0 (0.0%) | 9 (2.2%) |
| $10,000 to $14,999 | 19 (1.4%) | 29 (7.1%) |
| $15,000 to $19,999 | 0 (0.0%) | 9 (2.2%) |
| $20,000 to $24,999 | 15 (1.1%) | 15 (3.7%) |
| $25,000 to $34,999 | 37 (2.7%) | 53 (13.0%) |
| $35,000 to $49,999 | 99 (7.2%) | 46 (11.3%) |
| $50,000 to $74,999 | 27 (1.9%) | 157 (38.4%) |
| $75,000 to $99,999 | 166 (12.0%) | 34 (8.3%) |
| $100,000 to $149,999 | 449 (32.5%) | 45 (11.0%) |
| $150,000 or more | 526 (38.1%) | 12 (2.9%) |
| Total | 1,382 (100.0%) | 409 (100.0%) |
Monthly Housing Cost Tiers in Millis Clicquot
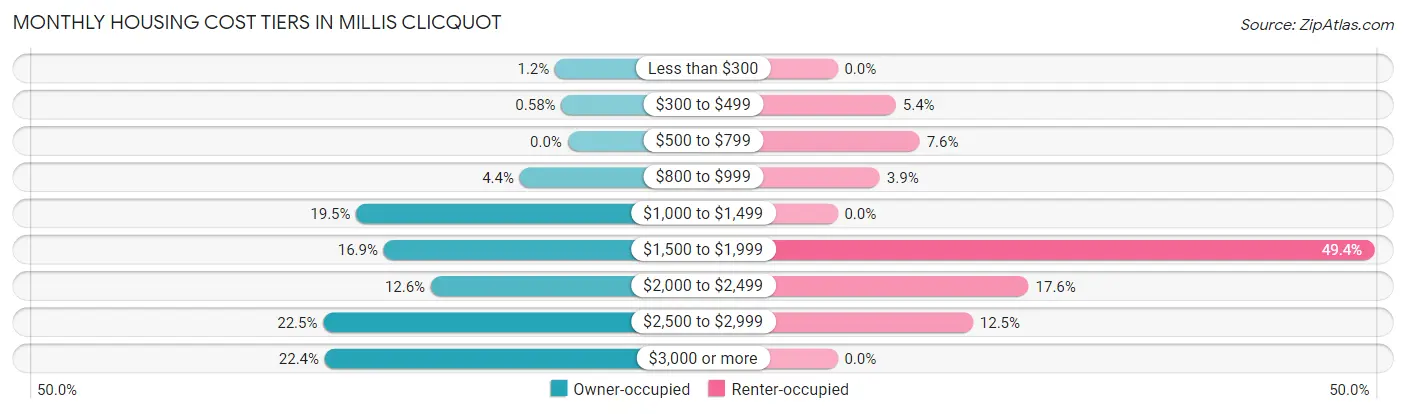
| Monthly Cost | Owner-occupied | Renter-occupied |
| Less than $300 | 16 (1.2%) | 0 (0.0%) |
| $300 to $499 | 8 (0.6%) | 22 (5.4%) |
| $500 to $799 | 0 (0.0%) | 31 (7.6%) |
| $800 to $999 | 61 (4.4%) | 16 (3.9%) |
| $1,000 to $1,499 | 269 (19.5%) | 0 (0.0%) |
| $1,500 to $1,999 | 234 (16.9%) | 202 (49.4%) |
| $2,000 to $2,499 | 174 (12.6%) | 72 (17.6%) |
| $2,500 to $2,999 | 311 (22.5%) | 51 (12.5%) |
| $3,000 or more | 309 (22.4%) | 0 (0.0%) |
| Total | 1,382 (100.0%) | 409 (100.0%) |
Physical Housing Characteristics in Millis Clicquot
Housing Structures in Millis Clicquot
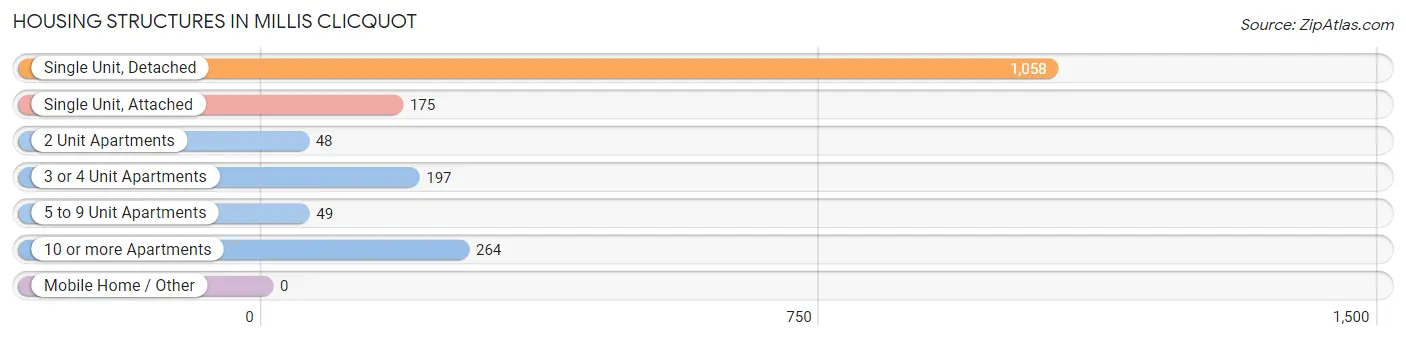
| Structure Type | # Housing Units | % Housing Units |
| Single Unit, Detached | 1,058 | 59.1% |
| Single Unit, Attached | 175 | 9.8% |
| 2 Unit Apartments | 48 | 2.7% |
| 3 or 4 Unit Apartments | 197 | 11.0% |
| 5 to 9 Unit Apartments | 49 | 2.7% |
| 10 or more Apartments | 264 | 14.7% |
| Mobile Home / Other | 0 | 0.0% |
| Total | 1,791 | 100.0% |
Housing Structures by Occupancy in Millis Clicquot
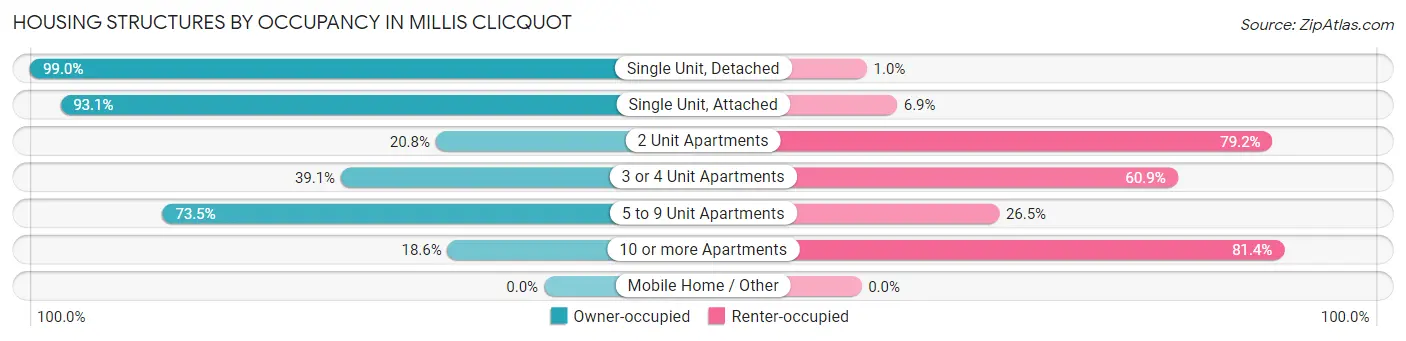
| Structure Type | Owner-occupied | Renter-occupied |
| Single Unit, Detached | 1,047 (99.0%) | 11 (1.0%) |
| Single Unit, Attached | 163 (93.1%) | 12 (6.9%) |
| 2 Unit Apartments | 10 (20.8%) | 38 (79.2%) |
| 3 or 4 Unit Apartments | 77 (39.1%) | 120 (60.9%) |
| 5 to 9 Unit Apartments | 36 (73.5%) | 13 (26.5%) |
| 10 or more Apartments | 49 (18.6%) | 215 (81.4%) |
| Mobile Home / Other | 0 (0.0%) | 0 (0.0%) |
| Total | 1,382 (77.2%) | 409 (22.8%) |
Housing Structures by Number of Rooms in Millis Clicquot
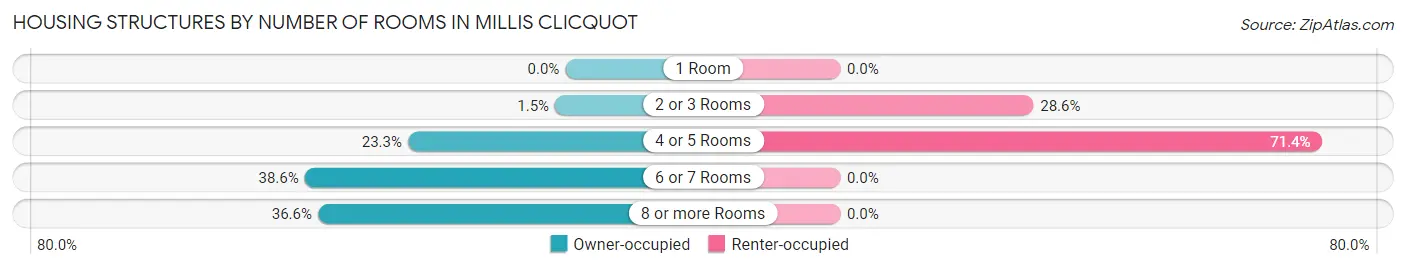
| Number of Rooms | Owner-occupied | Renter-occupied |
| 1 Room | 0 (0.0%) | 0 (0.0%) |
| 2 or 3 Rooms | 21 (1.5%) | 117 (28.6%) |
| 4 or 5 Rooms | 322 (23.3%) | 292 (71.4%) |
| 6 or 7 Rooms | 533 (38.6%) | 0 (0.0%) |
| 8 or more Rooms | 506 (36.6%) | 0 (0.0%) |
| Total | 1,382 (100.0%) | 409 (100.0%) |
Housing Structure by Heating Type in Millis Clicquot
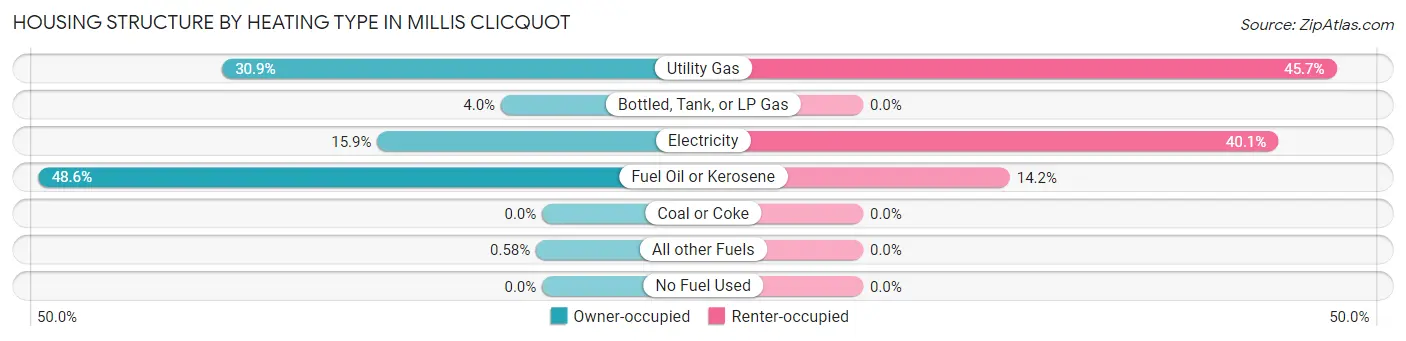
| Heating Type | Owner-occupied | Renter-occupied |
| Utility Gas | 427 (30.9%) | 187 (45.7%) |
| Bottled, Tank, or LP Gas | 55 (4.0%) | 0 (0.0%) |
| Electricity | 220 (15.9%) | 164 (40.1%) |
| Fuel Oil or Kerosene | 672 (48.6%) | 58 (14.2%) |
| Coal or Coke | 0 (0.0%) | 0 (0.0%) |
| All other Fuels | 8 (0.6%) | 0 (0.0%) |
| No Fuel Used | 0 (0.0%) | 0 (0.0%) |
| Total | 1,382 (100.0%) | 409 (100.0%) |
Household Vehicle Usage in Millis Clicquot
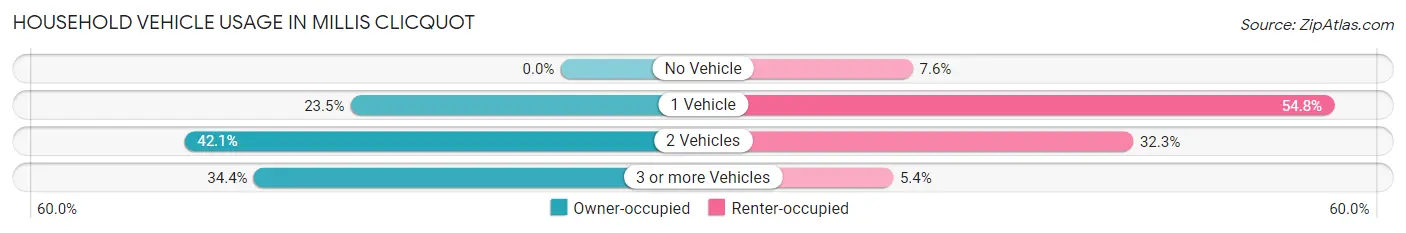
| Vehicles per Household | Owner-occupied | Renter-occupied |
| No Vehicle | 0 (0.0%) | 31 (7.6%) |
| 1 Vehicle | 325 (23.5%) | 224 (54.8%) |
| 2 Vehicles | 582 (42.1%) | 132 (32.3%) |
| 3 or more Vehicles | 475 (34.4%) | 22 (5.4%) |
| Total | 1,382 (100.0%) | 409 (100.0%) |
Real Estate & Mortgages in Millis Clicquot
Real Estate and Mortgage Overview in Millis Clicquot
| Characteristic | Without Mortgage | With Mortgage |
| Housing Units | 351 | 1,031 |
| Median Property Value | $448,000 | $467,800 |
| Median Household Income | $101,875 | $429 |
| Monthly Housing Costs | $1,133 | $309 |
| Real Estate Taxes | $8,049 | $0 |
Property Value by Mortgage Status in Millis Clicquot
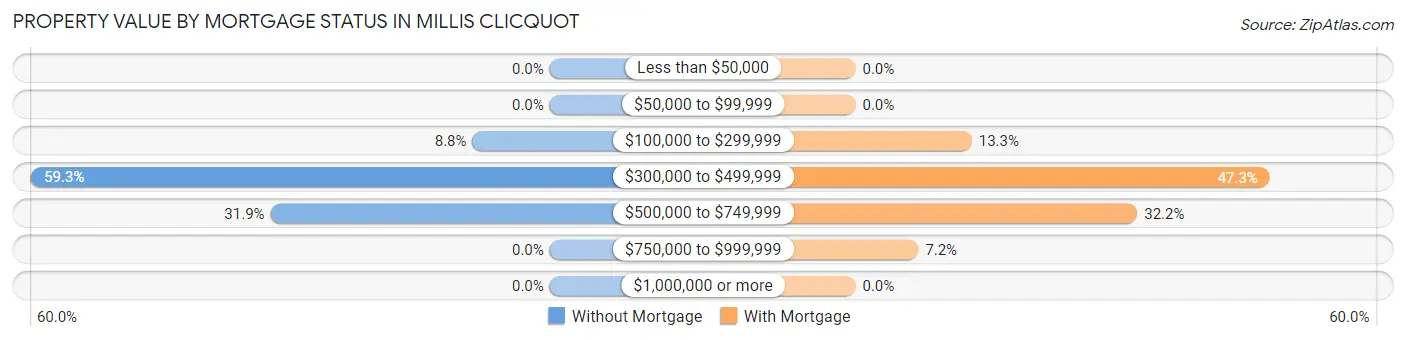
| Property Value | Without Mortgage | With Mortgage |
| Less than $50,000 | 0 (0.0%) | 0 (0.0%) |
| $50,000 to $99,999 | 0 (0.0%) | 0 (0.0%) |
| $100,000 to $299,999 | 31 (8.8%) | 137 (13.3%) |
| $300,000 to $499,999 | 208 (59.3%) | 488 (47.3%) |
| $500,000 to $749,999 | 112 (31.9%) | 332 (32.2%) |
| $750,000 to $999,999 | 0 (0.0%) | 74 (7.2%) |
| $1,000,000 or more | 0 (0.0%) | 0 (0.0%) |
| Total | 351 (100.0%) | 1,031 (100.0%) |
Household Income by Mortgage Status in Millis Clicquot
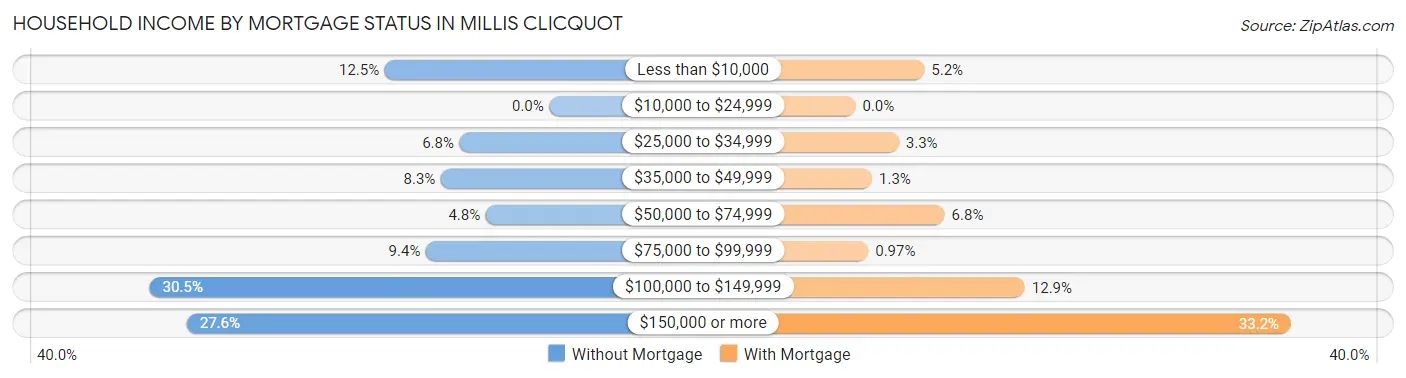
| Household Income | Without Mortgage | With Mortgage |
| Less than $10,000 | 44 (12.5%) | 54 (5.2%) |
| $10,000 to $24,999 | 0 (0.0%) | 0 (0.0%) |
| $25,000 to $34,999 | 24 (6.8%) | 34 (3.3%) |
| $35,000 to $49,999 | 29 (8.3%) | 13 (1.3%) |
| $50,000 to $74,999 | 17 (4.8%) | 70 (6.8%) |
| $75,000 to $99,999 | 33 (9.4%) | 10 (1.0%) |
| $100,000 to $149,999 | 107 (30.5%) | 133 (12.9%) |
| $150,000 or more | 97 (27.6%) | 342 (33.2%) |
| Total | 351 (100.0%) | 1,031 (100.0%) |
Property Value to Household Income Ratio in Millis Clicquot
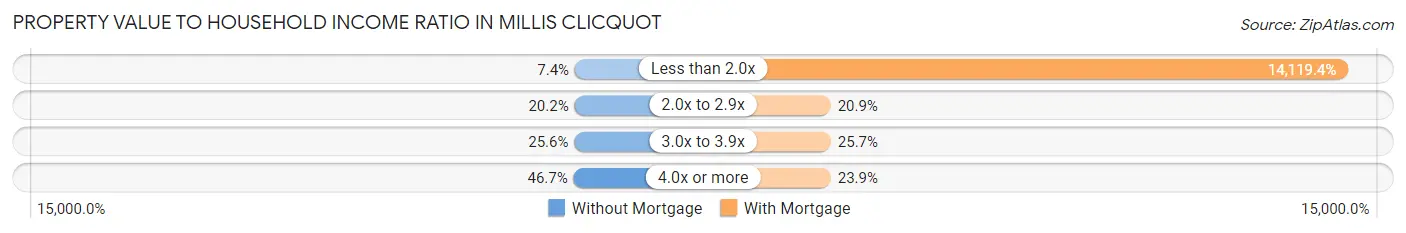
| Value-to-Income Ratio | Without Mortgage | With Mortgage |
| Less than 2.0x | 26 (7.4%) | 145,571 (14,119.4%) |
| 2.0x to 2.9x | 71 (20.2%) | 215 (20.8%) |
| 3.0x to 3.9x | 90 (25.6%) | 265 (25.7%) |
| 4.0x or more | 164 (46.7%) | 246 (23.9%) |
| Total | 351 (100.0%) | 1,031 (100.0%) |
Real Estate Taxes by Mortgage Status in Millis Clicquot
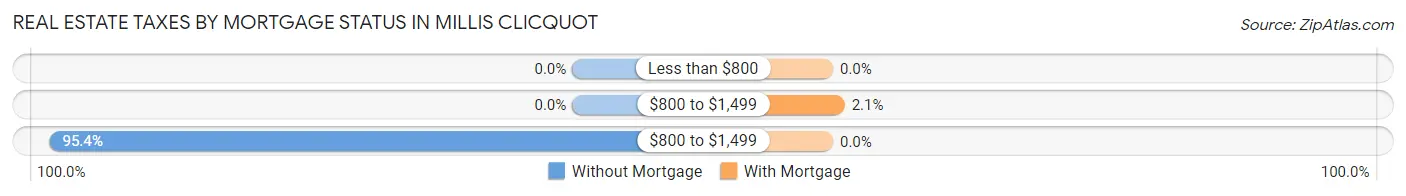
| Property Taxes | Without Mortgage | With Mortgage |
| Less than $800 | 0 (0.0%) | 0 (0.0%) |
| $800 to $1,499 | 0 (0.0%) | 22 (2.1%) |
| $800 to $1,499 | 335 (95.4%) | 0 (0.0%) |
| Total | 351 (100.0%) | 1,031 (100.0%) |
Health & Disability in Millis Clicquot
Health Insurance Coverage by Age in Millis Clicquot
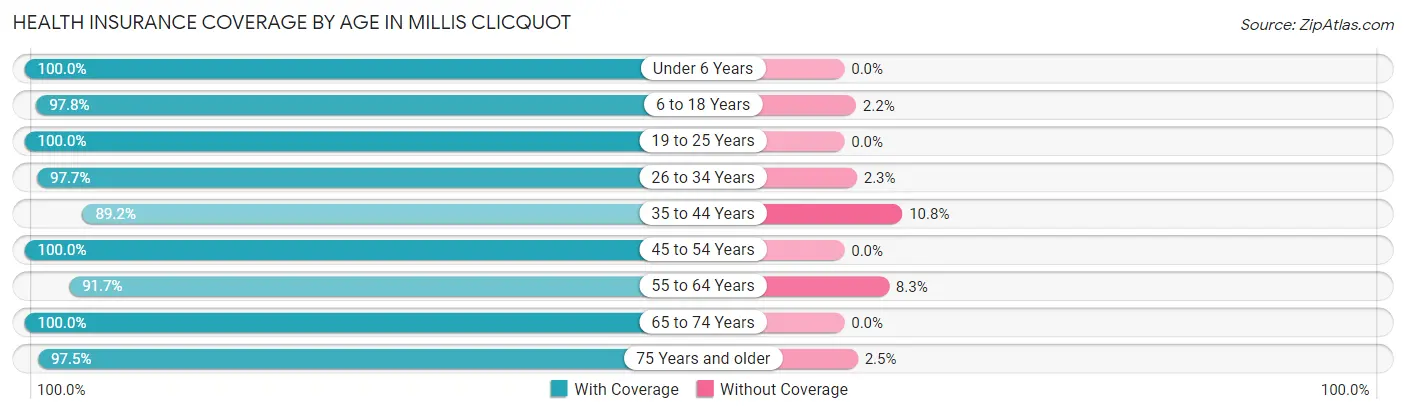
| Age Bracket | With Coverage | Without Coverage |
| Under 6 Years | 280 (100.0%) | 0 (0.0%) |
| 6 to 18 Years | 857 (97.8%) | 19 (2.2%) |
| 19 to 25 Years | 272 (100.0%) | 0 (0.0%) |
| 26 to 34 Years | 462 (97.7%) | 11 (2.3%) |
| 35 to 44 Years | 512 (89.2%) | 62 (10.8%) |
| 45 to 54 Years | 651 (100.0%) | 0 (0.0%) |
| 55 to 64 Years | 672 (91.7%) | 61 (8.3%) |
| 65 to 74 Years | 666 (100.0%) | 0 (0.0%) |
| 75 Years and older | 156 (97.5%) | 4 (2.5%) |
| Total | 4,528 (96.7%) | 157 (3.4%) |
Health Insurance Coverage by Citizenship Status in Millis Clicquot
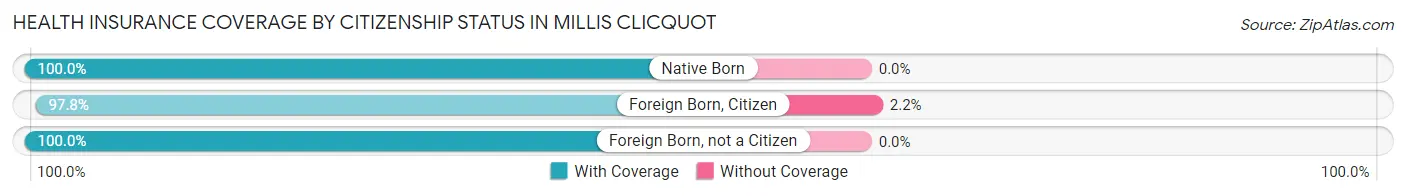
| Citizenship Status | With Coverage | Without Coverage |
| Native Born | 280 (100.0%) | 0 (0.0%) |
| Foreign Born, Citizen | 857 (97.8%) | 19 (2.2%) |
| Foreign Born, not a Citizen | 272 (100.0%) | 0 (0.0%) |
Health Insurance Coverage by Household Income in Millis Clicquot
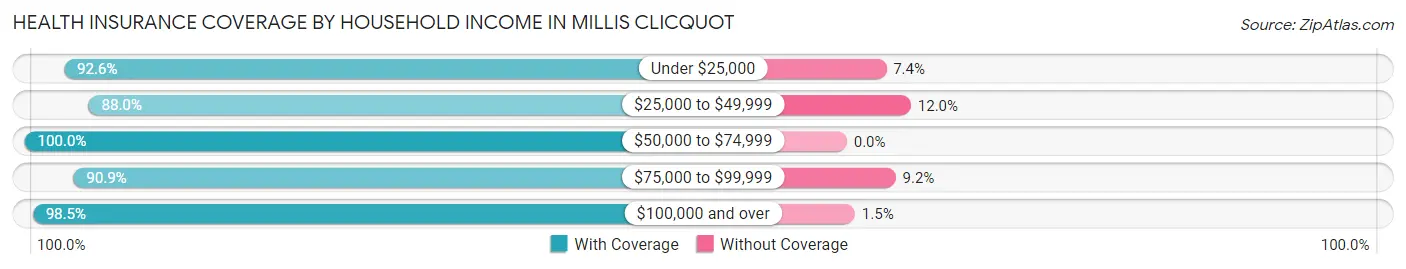
| Household Income | With Coverage | Without Coverage |
| Under $25,000 | 238 (92.6%) | 19 (7.4%) |
| $25,000 to $49,999 | 308 (88.0%) | 42 (12.0%) |
| $50,000 to $74,999 | 434 (100.0%) | 0 (0.0%) |
| $75,000 to $99,999 | 437 (90.8%) | 44 (9.1%) |
| $100,000 and over | 3,108 (98.5%) | 48 (1.5%) |
Public vs Private Health Insurance Coverage by Age in Millis Clicquot
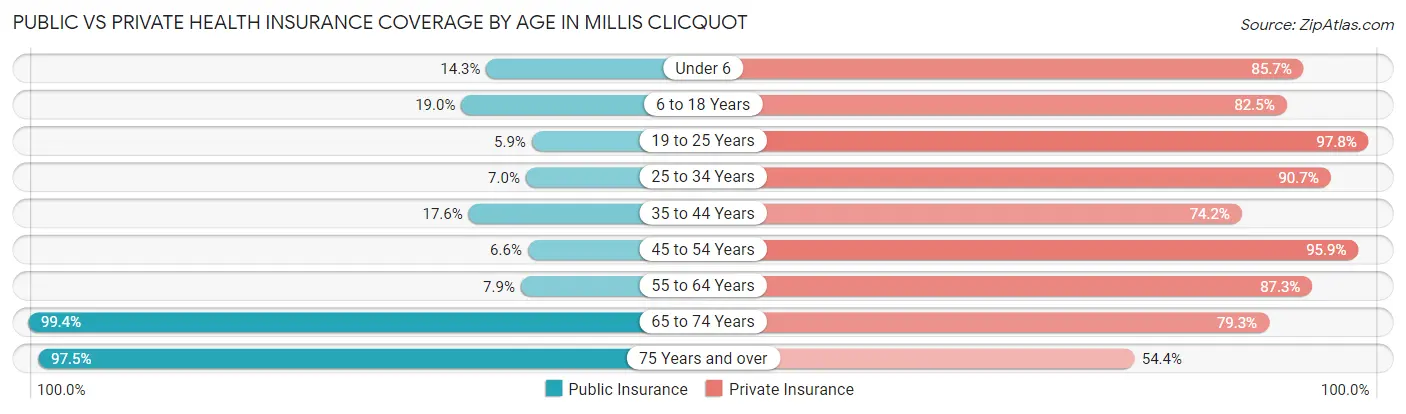
| Age Bracket | Public Insurance | Private Insurance |
| Under 6 | 40 (14.3%) | 240 (85.7%) |
| 6 to 18 Years | 166 (19.0%) | 723 (82.5%) |
| 19 to 25 Years | 16 (5.9%) | 266 (97.8%) |
| 25 to 34 Years | 33 (7.0%) | 429 (90.7%) |
| 35 to 44 Years | 101 (17.6%) | 426 (74.2%) |
| 45 to 54 Years | 43 (6.6%) | 624 (95.9%) |
| 55 to 64 Years | 58 (7.9%) | 640 (87.3%) |
| 65 to 74 Years | 662 (99.4%) | 528 (79.3%) |
| 75 Years and over | 156 (97.5%) | 87 (54.4%) |
| Total | 1,275 (27.2%) | 3,963 (84.6%) |
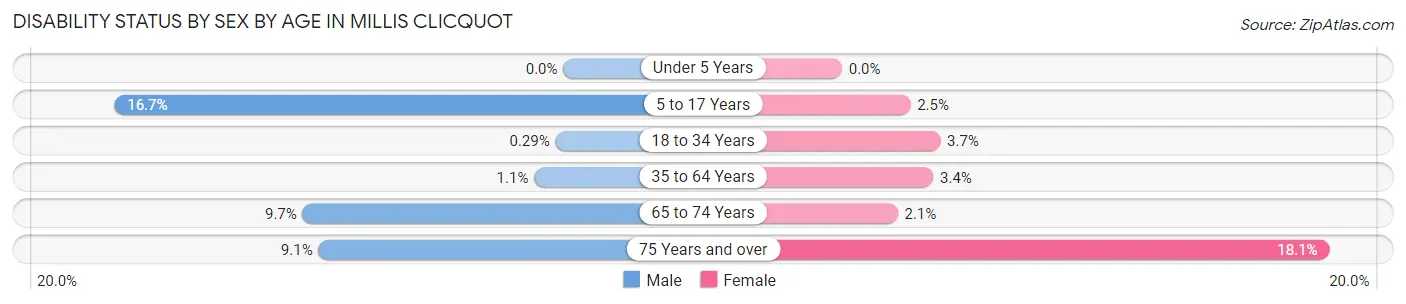
Disability Status by Sex by Age in Millis Clicquot
| Age Bracket | Male | Female |
| Under 5 Years | 0 (0.0%) | 0 (0.0%) |
| 5 to 17 Years | 70 (16.7%) | 10 (2.5%) |
| 18 to 34 Years | 1 (0.3%) | 18 (3.6%) |
| 35 to 64 Years | 10 (1.1%) | 35 (3.4%) |
| 65 to 74 Years | 27 (9.7%) | 8 (2.1%) |
| 75 Years and over | 4 (9.1%) | 21 (18.1%) |
Disability Class by Sex by Age in Millis Clicquot
Disability Class: Hearing Difficulty
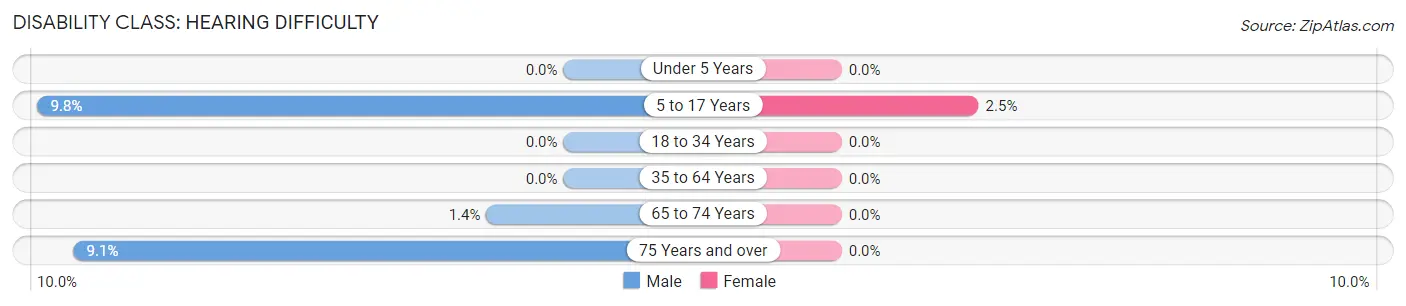
| Age Bracket | Male | Female |
| Under 5 Years | 0 (0.0%) | 0 (0.0%) |
| 5 to 17 Years | 41 (9.8%) | 10 (2.5%) |
| 18 to 34 Years | 0 (0.0%) | 0 (0.0%) |
| 35 to 64 Years | 0 (0.0%) | 0 (0.0%) |
| 65 to 74 Years | 4 (1.4%) | 0 (0.0%) |
| 75 Years and over | 4 (9.1%) | 0 (0.0%) |
Disability Class: Vision Difficulty
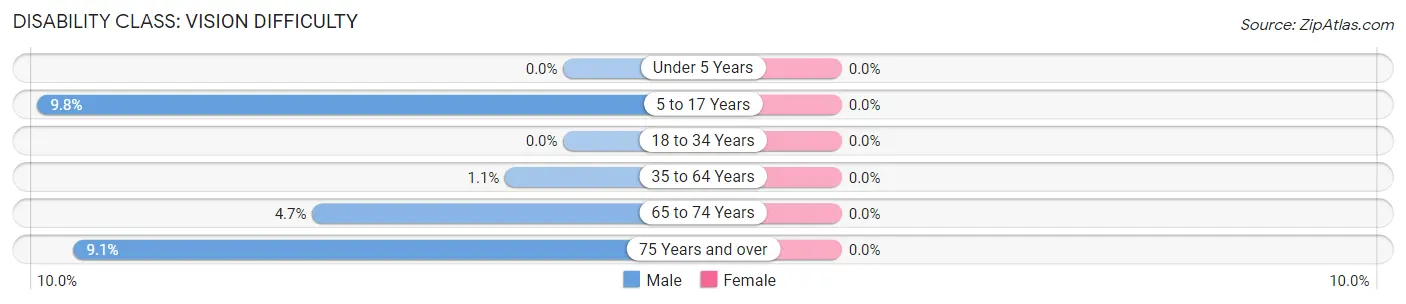
| Age Bracket | Male | Female |
| Under 5 Years | 0 (0.0%) | 0 (0.0%) |
| 5 to 17 Years | 41 (9.8%) | 0 (0.0%) |
| 18 to 34 Years | 0 (0.0%) | 0 (0.0%) |
| 35 to 64 Years | 10 (1.1%) | 0 (0.0%) |
| 65 to 74 Years | 13 (4.7%) | 0 (0.0%) |
| 75 Years and over | 4 (9.1%) | 0 (0.0%) |
Disability Class: Cognitive Difficulty
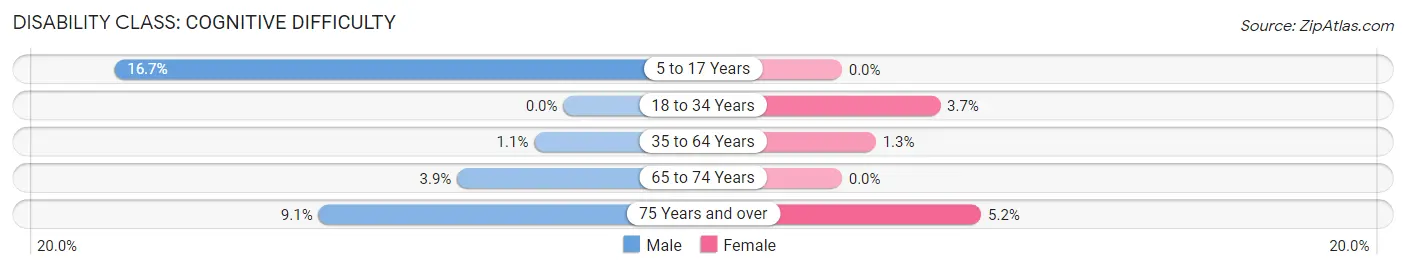
| Age Bracket | Male | Female |
| 5 to 17 Years | 70 (16.7%) | 0 (0.0%) |
| 18 to 34 Years | 0 (0.0%) | 18 (3.6%) |
| 35 to 64 Years | 10 (1.1%) | 13 (1.3%) |
| 65 to 74 Years | 11 (3.9%) | 0 (0.0%) |
| 75 Years and over | 4 (9.1%) | 6 (5.2%) |
Disability Class: Ambulatory Difficulty
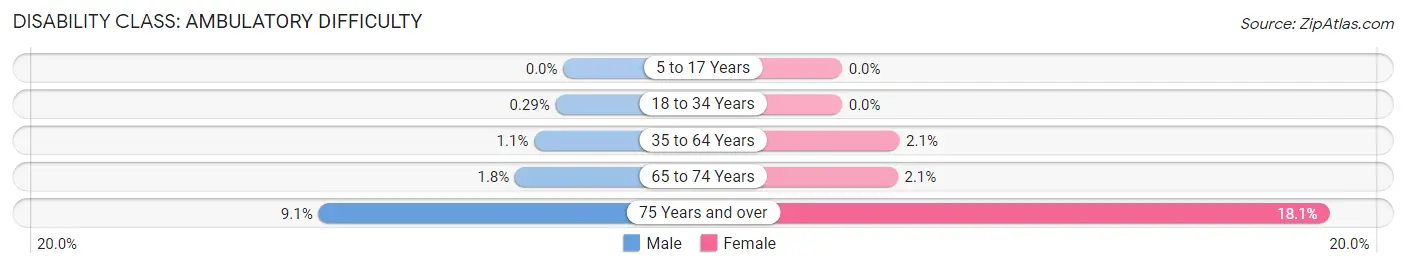
| Age Bracket | Male | Female |
| 5 to 17 Years | 0 (0.0%) | 0 (0.0%) |
| 18 to 34 Years | 1 (0.3%) | 0 (0.0%) |
| 35 to 64 Years | 10 (1.1%) | 22 (2.1%) |
| 65 to 74 Years | 5 (1.8%) | 8 (2.1%) |
| 75 Years and over | 4 (9.1%) | 21 (18.1%) |
Disability Class: Self-Care Difficulty
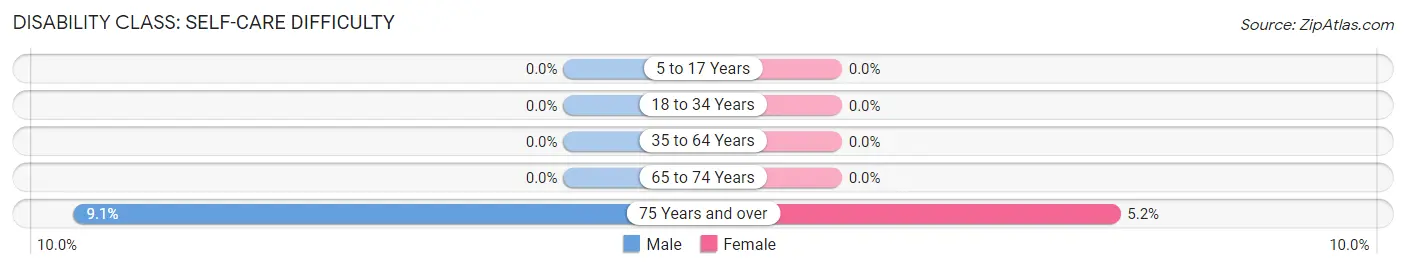
| Age Bracket | Male | Female |
| 5 to 17 Years | 0 (0.0%) | 0 (0.0%) |
| 18 to 34 Years | 0 (0.0%) | 0 (0.0%) |
| 35 to 64 Years | 0 (0.0%) | 0 (0.0%) |
| 65 to 74 Years | 0 (0.0%) | 0 (0.0%) |
| 75 Years and over | 4 (9.1%) | 6 (5.2%) |
Technology Access in Millis Clicquot
Computing Device Access in Millis Clicquot
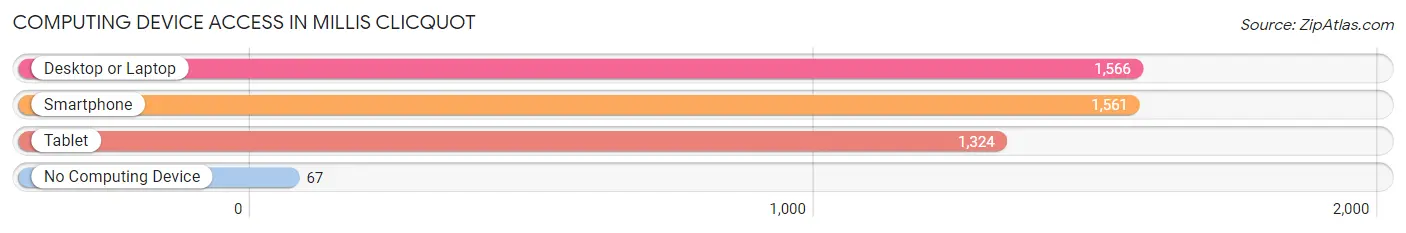
| Device Type | # Households | % Households |
| Desktop or Laptop | 1,566 | 87.4% |
| Smartphone | 1,561 | 87.2% |
| Tablet | 1,324 | 73.9% |
| No Computing Device | 67 | 3.7% |
| Total | 1,791 | 100.0% |
Internet Access in Millis Clicquot
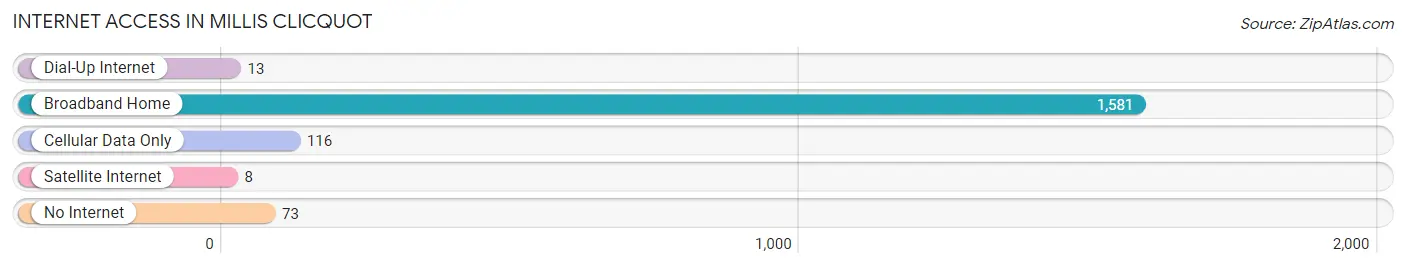
| Internet Type | # Households | % Households |
| Dial-Up Internet | 13 | 0.7% |
| Broadband Home | 1,581 | 88.3% |
| Cellular Data Only | 116 | 6.5% |
| Satellite Internet | 8 | 0.4% |
| No Internet | 73 | 4.1% |
| Total | 1,791 | 100.0% |
Millis Clicquot Summary
Millis Clicquot is a small town located in the state of Massachusetts, in the United States of America. It is situated in Norfolk County, and is part of the Greater Boston metropolitan area. The town has a population of approximately 8,000 people, and is located about 20 miles southwest of Boston.
History
Millis Clicquot was first settled in 1657 by a group of English settlers from Dedham, Massachusetts. The town was originally known as “Millis”, and was named after the nearby Millis River. The town was incorporated in 1713, and was named after the French Huguenot settler, Pierre Clicquot.
The town was primarily an agricultural community for many years, with the main crops being corn, wheat, and hay. In the late 19th century, the town began to develop into a manufacturing center, with the establishment of several factories. These factories included a paper mill, a shoe factory, and a woolen mill.
Geography
Millis Clicquot is located in the eastern part of Norfolk County, in the state of Massachusetts. It is situated about 20 miles southwest of Boston, and is bordered by the towns of Medfield, Norfolk, and Medway. The town has a total area of 8.3 square miles, of which 8.2 square miles is land and 0.1 square miles is water.
The town is located in the Charles River watershed, and is home to several small streams and ponds. The highest point in the town is located at the intersection of Millis and Clicquot Streets, and is approximately 200 feet above sea level.
Economy
Millis Clicquot is primarily a residential community, with most of its residents commuting to nearby cities for work. The town does have a few small businesses, including a few restaurants, a grocery store, and a few retail stores.
The town is also home to several industrial and manufacturing businesses, including a paper mill, a shoe factory, and a woolen mill. These businesses provide employment for many of the town’s residents.
Demographics
As of the 2010 census, the population of Millis Clicquot was 8,000 people. The racial makeup of the town was 94.3% White, 1.3% African American, 0.3% Native American, 1.3% Asian, 0.1% Pacific Islander, 1.3% from other races, and 1.7% from two or more races. Hispanic or Latino of any race were 3.3% of the population.
The median household income in the town was $76,250, and the median family income was $86,250. The per capita income for the town was $32,000. About 4.3% of families and 5.3% of the population were below the poverty line, including 6.3% of those under age 18 and 4.3% of those age 65 or over.
Millis Clicquot is a small town with a rich history and a diverse population. The town is home to several small businesses, and is a popular destination for commuters to nearby cities. The town has a strong sense of community, and is a great place to live and work.
Common Questions
What is Per Capita Income in Millis Clicquot?
Per Capita income in Millis Clicquot is $64,023.
What is the Median Family Income in Millis Clicquot?
Median Family Income in Millis Clicquot is $142,241.
What is the Median Household income in Millis Clicquot?
Median Household Income in Millis Clicquot is $111,192.
What is Income or Wage Gap in Millis Clicquot?
Income or Wage Gap in Millis Clicquot is 47.7%.
Women in Millis Clicquot earn 52.3 cents for every dollar earned by a man.
What is Inequality or Gini Index in Millis Clicquot?
Inequality or Gini Index in Millis Clicquot is 0.45.
What is the Total Population of Millis Clicquot?
Total Population of Millis Clicquot is 4,718.
What is the Total Male Population of Millis Clicquot?
Total Male Population of Millis Clicquot is 2,145.
What is the Total Female Population of Millis Clicquot?
Total Female Population of Millis Clicquot is 2,573.
What is the Ratio of Males per 100 Females in Millis Clicquot?
There are 83.37 Males per 100 Females in Millis Clicquot.
What is the Ratio of Females per 100 Males in Millis Clicquot?
There are 119.95 Females per 100 Males in Millis Clicquot.
What is the Median Population Age in Millis Clicquot?
Median Population Age in Millis Clicquot is 44.3 Years.
What is the Average Family Size in Millis Clicquot
Average Family Size in Millis Clicquot is 3.3 People.
What is the Average Household Size in Millis Clicquot
Average Household Size in Millis Clicquot is 2.6 People.
How Large is the Labor Force in Millis Clicquot?
There are 2,778 People in the Labor Forcein in Millis Clicquot.
What is the Percentage of People in the Labor Force in Millis Clicquot?
72.8% of People are in the Labor Force in Millis Clicquot.
What is the Unemployment Rate in Millis Clicquot?
Unemployment Rate in Millis Clicquot is 1.8%.