Cities with the Highest Renter-Occupied Median Costs of Housing in Massachusetts
RELATED REPORTS & OPTIONS
Highest Renter Housing Costs
Massachusetts
Compare Cities
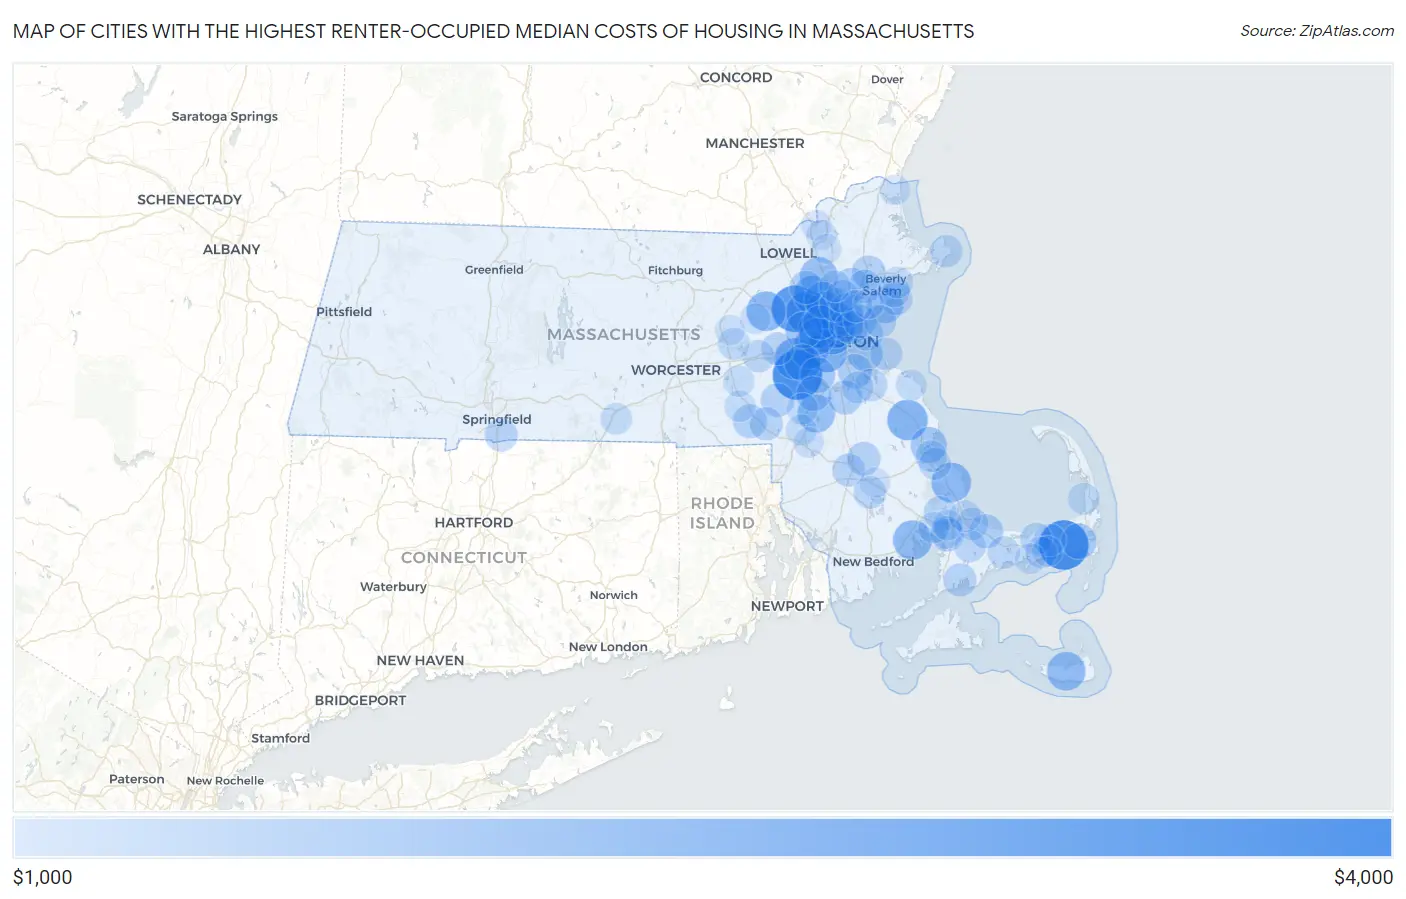
Map of Cities with the Highest Renter-Occupied Median Costs of Housing in Massachusetts
$0
$4,000
Cities with the Highest Renter-Occupied Median Costs of Housing in Massachusetts
| City | Housing Costs | vs State | vs National | |
| 1. | Northwest Harwich | $3,501 | $1,588(+1.91k)#1 | $1,268(+2.23k)#66 |
| 2. | Dover | $3,501 | $1,588(+1.91k)#2 | $1,268(+2.23k)#83 |
| 3. | Hanscom Afb | $3,203 | $1,588(+1.61k)#3 | $1,268(+1.94k)#190 |
| 4. | Lexington | $2,818 | $1,588(+1.23k)#4 | $1,268(+1.55k)#317 |
| 5. | Brookline | $2,702 | $1,588(+1.11k)#5 | $1,268(+1.43k)#365 |
| 6. | Wellesley | $2,637 | $1,588(+1.05k)#6 | $1,268(+1.37k)#404 |
| 7. | Cambridge | $2,628 | $1,588(+1.04k)#7 | $1,268(+1.36k)#414 |
| 8. | North Pembroke | $2,540 | $1,588(+952)#8 | $1,268(+1.27k)#498 |
| 9. | The Pinehills | $2,457 | $1,588(+869)#9 | $1,268(+1.19k)#573 |
| 10. | West Concord | $2,449 | $1,588(+861)#10 | $1,268(+1.18k)#578 |
| 11. | Marion Center | $2,400 | $1,588(+812)#11 | $1,268(+1.13k)#626 |
| 12. | Somerville | $2,357 | $1,588(+769)#12 | $1,268(+1.09k)#665 |
| 13. | Nantucket | $2,342 | $1,588(+754)#13 | $1,268(+1.07k)#682 |
| 14. | Belmont | $2,339 | $1,588(+751)#14 | $1,268(+1.07k)#685 |
| 15. | Burlington | $2,319 | $1,588(+731)#15 | $1,268(+1.05k)#705 |
| 16. | Medford | $2,305 | $1,588(+717)#16 | $1,268(+1.04k)#730 |
| 17. | Wilmington | $2,293 | $1,588(+705)#17 | $1,268(+1.02k)#750 |
| 18. | Newton | $2,252 | $1,588(+664)#18 | $1,268(+984)#812 |
| 19. | Sharon | $2,244 | $1,588(+656)#19 | $1,268(+976)#836 |
| 20. | Winchester | $2,192 | $1,588(+604)#20 | $1,268(+924)#943 |
| 21. | Watertown Town | $2,183 | $1,588(+595)#21 | $1,268(+915)#959 |
| 22. | Waltham | $2,141 | $1,588(+553)#22 | $1,268(+873)#1,051 |
| 23. | Swampscott | $2,134 | $1,588(+546)#23 | $1,268(+866)#1,073 |
| 24. | Needham | $2,133 | $1,588(+545)#24 | $1,268(+865)#1,076 |
| 25. | Woburn | $2,131 | $1,588(+543)#25 | $1,268(+863)#1,083 |
| 26. | South Duxbury | $2,087 | $1,588(+499)#26 | $1,268(+819)#1,174 |
| 27. | East Harwich | $2,026 | $1,588(+438)#27 | $1,268(+758)#1,320 |
| 28. | Dedham | $2,006 | $1,588(+418)#28 | $1,268(+738)#1,352 |
| 29. | Boston | $1,981 | $1,588(+393)#29 | $1,268(+713)#1,417 |
| 30. | Malden | $1,962 | $1,588(+374)#30 | $1,268(+694)#1,466 |
| 31. | Norwood | $1,948 | $1,588(+360)#31 | $1,268(+680)#1,495 |
| 32. | Arlington | $1,902 | $1,588(+314)#32 | $1,268(+634)#1,604 |
| 33. | Quincy | $1,901 | $1,588(+313)#33 | $1,268(+633)#1,608 |
| 34. | Everett | $1,892 | $1,588(+304)#34 | $1,268(+624)#1,630 |
| 35. | Lynnfield | $1,891 | $1,588(+303)#35 | $1,268(+623)#1,640 |
| 36. | Randolph Town | $1,883 | $1,588(+295)#36 | $1,268(+615)#1,667 |
| 37. | East Sandwich | $1,867 | $1,588(+279)#37 | $1,268(+599)#1,724 |
| 38. | Danvers | $1,862 | $1,588(+274)#38 | $1,268(+594)#1,739 |
| 39. | Bellingham | $1,854 | $1,588(+266)#39 | $1,268(+586)#1,766 |
| 40. | Stoneham | $1,843 | $1,588(+255)#40 | $1,268(+575)#1,823 |
| 41. | Winthrop Town | $1,841 | $1,588(+253)#41 | $1,268(+573)#1,832 |
| 42. | Melrose | $1,837 | $1,588(+249)#42 | $1,268(+569)#1,852 |
| 43. | Bridgewater Town | $1,820 | $1,588(+232)#43 | $1,268(+552)#1,922 |
| 44. | Pinehurst | $1,817 | $1,588(+229)#44 | $1,268(+549)#1,937 |
| 45. | Millis Clicquot | $1,817 | $1,588(+229)#45 | $1,268(+549)#1,938 |
| 46. | Chelsea | $1,806 | $1,588(+218)#46 | $1,268(+538)#1,974 |
| 47. | Peabody | $1,795 | $1,588(+207)#47 | $1,268(+527)#2,023 |
| 48. | Franklin Town | $1,792 | $1,588(+204)#48 | $1,268(+524)#2,037 |
| 49. | Revere | $1,790 | $1,588(+202)#49 | $1,268(+522)#2,044 |
| 50. | East Falmouth | $1,780 | $1,588(+192)#50 | $1,268(+512)#2,091 |
| 51. | Raynham Center | $1,766 | $1,588(+178)#51 | $1,268(+498)#2,150 |
| 52. | Longmeadow | $1,760 | $1,588(+172)#52 | $1,268(+492)#2,172 |
| 53. | White Island Shores | $1,753 | $1,588(+165)#53 | $1,268(+485)#2,207 |
| 54. | Marblehead | $1,749 | $1,588(+161)#54 | $1,268(+481)#2,247 |
| 55. | Nahant | $1,747 | $1,588(+159)#55 | $1,268(+479)#2,252 |
| 56. | Monument Beach | $1,743 | $1,588(+155)#56 | $1,268(+475)#2,273 |
| 57. | Wakefield | $1,742 | $1,588(+154)#57 | $1,268(+474)#2,276 |
| 58. | Cochituate | $1,739 | $1,588(+151)#58 | $1,268(+471)#2,295 |
| 59. | Hull | $1,728 | $1,588(+140)#59 | $1,268(+460)#2,350 |
| 60. | Weymouth Town | $1,718 | $1,588(+130)#60 | $1,268(+450)#2,400 |
| 61. | North Lakeville | $1,718 | $1,588(+130)#61 | $1,268(+450)#2,403 |
| 62. | Saugus | $1,717 | $1,588(+129)#62 | $1,268(+449)#2,404 |
| 63. | Rockport | $1,712 | $1,588(+124)#63 | $1,268(+444)#2,432 |
| 64. | Barnstable Town | $1,711 | $1,588(+123)#64 | $1,268(+443)#2,441 |
| 65. | South Dennis | $1,696 | $1,588(+108)#65 | $1,268(+428)#2,530 |
| 66. | Bourne | $1,695 | $1,588(+107)#66 | $1,268(+427)#2,532 |
| 67. | Framingham | $1,689 | $1,588(+101)#67 | $1,268(+421)#2,562 |
| 68. | Sandwich | $1,688 | $1,588(+100.0)#68 | $1,268(+420)#2,577 |
| 69. | Salem | $1,678 | $1,588(+90.0)#69 | $1,268(+410)#2,631 |
| 70. | Braintree Town | $1,678 | $1,588(+90.0)#70 | $1,268(+410)#2,632 |
| 71. | Plymouth | $1,672 | $1,588(+84.0)#71 | $1,268(+404)#2,670 |
| 72. | Yarmouth Port | $1,671 | $1,588(+83.0)#72 | $1,268(+403)#2,676 |
| 73. | Forestdale | $1,665 | $1,588(+77.0)#73 | $1,268(+397)#2,713 |
| 74. | South Yarmouth | $1,655 | $1,588(+67.0)#74 | $1,268(+387)#2,779 |
| 75. | Reading | $1,650 | $1,588(+62.0)#75 | $1,268(+382)#2,797 |
| 76. | Marlborough | $1,648 | $1,588(+60.0)#76 | $1,268(+380)#2,813 |
| 77. | North Plymouth | $1,646 | $1,588(+58.0)#77 | $1,268(+378)#2,827 |
| 78. | North Eastham | $1,645 | $1,588(+57.0)#78 | $1,268(+377)#2,830 |
| 79. | Sagamore | $1,641 | $1,588(+53.0)#79 | $1,268(+373)#2,855 |
| 80. | Sturbridge | $1,625 | $1,588(+37.0)#80 | $1,268(+357)#2,941 |
| 81. | Beverly | $1,622 | $1,588(+34.0)#81 | $1,268(+354)#2,964 |
| 82. | Walpole | $1,604 | $1,588(+16.0)#82 | $1,268(+336)#3,067 |
| 83. | Milford | $1,588 | $1,588(=0.000)#83 | $1,268(+320)#3,147 |
| 84. | Hopkinton | $1,588 | $1,588(=0.000)#84 | $1,268(+320)#3,151 |
| 85. | Onset | $1,583 | $1,588(-5.00)#85 | $1,268(+315)#3,178 |
| 86. | Foxborough | $1,566 | $1,588(-22.0)#86 | $1,268(+298)#3,255 |
| 87. | North Scituate | $1,564 | $1,588(-24.0)#87 | $1,268(+296)#3,271 |
| 88. | Buzzards Bay | $1,556 | $1,588(-32.0)#88 | $1,268(+288)#3,310 |
| 89. | West Yarmouth | $1,547 | $1,588(-41.0)#89 | $1,268(+279)#3,354 |
| 90. | West Dennis | $1,541 | $1,588(-47.0)#90 | $1,268(+273)#3,382 |
| 91. | Mansfield Center | $1,519 | $1,588(-69.0)#91 | $1,268(+251)#3,497 |
| 92. | Maynard | $1,516 | $1,588(-72.0)#92 | $1,268(+248)#3,511 |
| 93. | Methuen Town | $1,514 | $1,588(-74.0)#93 | $1,268(+246)#3,516 |
| 94. | Lynn | $1,511 | $1,588(-77.0)#94 | $1,268(+243)#3,532 |
| 95. | Salisbury | $1,509 | $1,588(-79.0)#95 | $1,268(+241)#3,544 |
| 96. | Lawrence | $1,502 | $1,588(-86.0)#96 | $1,268(+234)#3,572 |
| 97. | Amherst | $1,484 | $1,588(-104)#97 | $1,268(+216)#3,672 |
| 98. | Hudson | $1,484 | $1,588(-104)#98 | $1,268(+216)#3,674 |
| 99. | Middleborough Center | $1,484 | $1,588(-104)#99 | $1,268(+216)#3,675 |
| 100. | Andover | $1,477 | $1,588(-111)#100 | $1,268(+209)#3,710 |
Common Questions
What are the Top 10 Cities with the Highest Renter-Occupied Median Costs of Housing in Massachusetts?
Top 10 Cities with the Highest Renter-Occupied Median Costs of Housing in Massachusetts are:
#1
$3,501
#2
$3,501
#3
$3,203
#4
$2,818
#5
$2,702
#6
$2,637
#7
$2,628
#8
$2,540
#9
$2,457
#10
$2,449
What city has the Highest Renter-Occupied Median Costs of Housing in Massachusetts?
Northwest Harwich has the Highest Renter-Occupied Median Costs of Housing in Massachusetts with $3,501.
What is the Median Renter-Occupied Housing Costs in the State of Massachusetts?
Median Renter-Occupied Housing Costs in Massachusetts is $1,588.
What is the Median Renter-Occupied Housing Costs in the United States?
Median Renter-Occupied Housing Costs in the United States is $1,268.