Buzzards Bay, MA Map & Demographics
Buzzards Bay Map
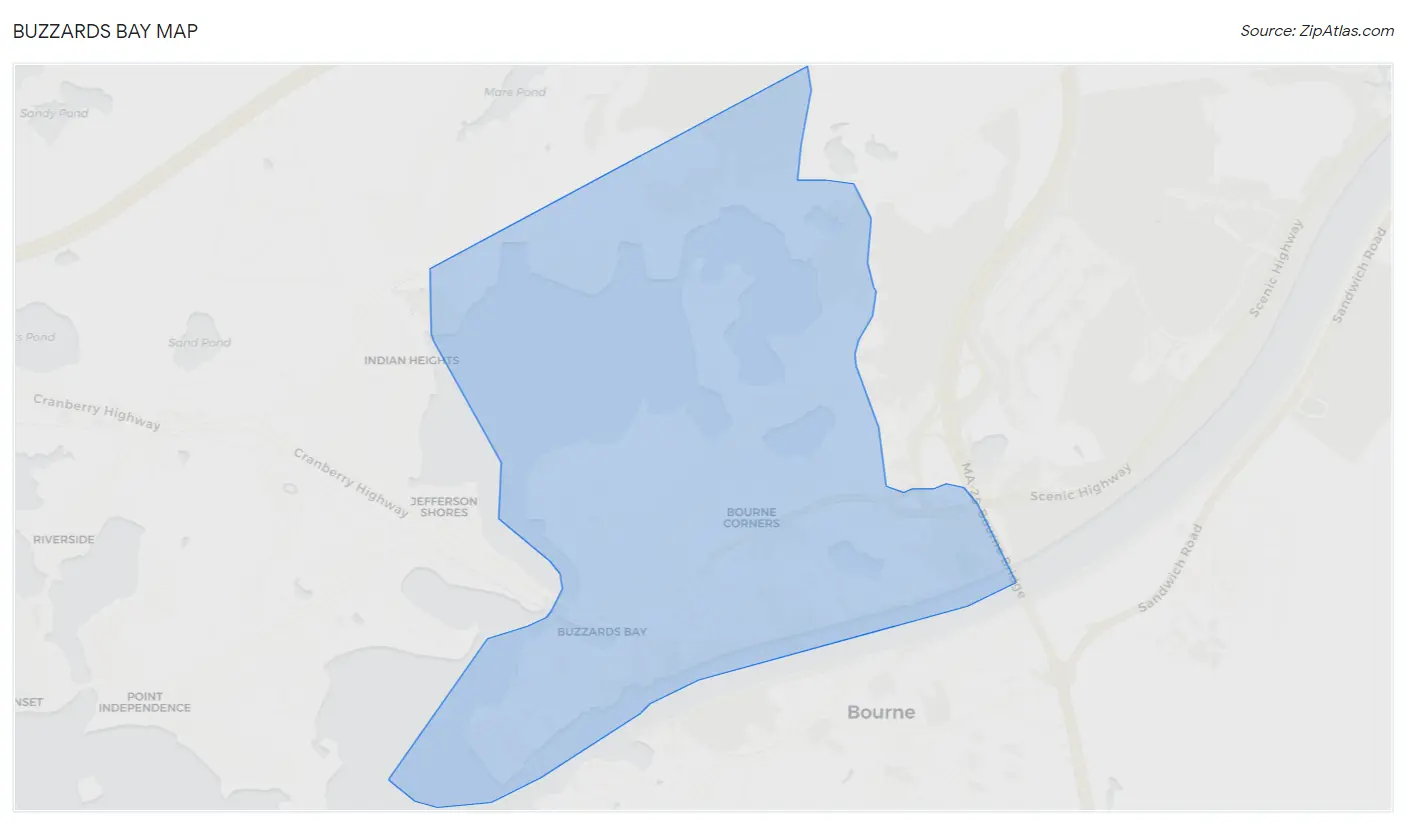
Buzzards Bay Overview
$48,675
PER CAPITA INCOME
$88,068
AVG FAMILY INCOME
$88,791
AVG HOUSEHOLD INCOME
29.6%
WAGE / INCOME GAP [ % ]
70.4¢/ $1
WAGE / INCOME GAP [ $ ]
0.37
INEQUALITY / GINI INDEX
2,993
TOTAL POPULATION
1,522
MALE POPULATION
1,471
FEMALE POPULATION
103.47
MALES / 100 FEMALES
96.65
FEMALES / 100 MALES
57.2
MEDIAN AGE
2.4
AVG FAMILY SIZE
1.9
AVG HOUSEHOLD SIZE
1,752
LABOR FORCE [ PEOPLE ]
62.5%
PERCENT IN LABOR FORCE
2.4%
UNEMPLOYMENT RATE
Income in Buzzards Bay
Income Overview in Buzzards Bay
Per Capita Income in Buzzards Bay is $48,675, while median incomes of families and households are $88,068 and $88,791 respectively.
| Characteristic | Number | Measure |
| Per Capita Income | 2,993 | $48,675 |
| Median Family Income | 695 | $88,068 |
| Mean Family Income | 695 | $109,918 |
| Median Household Income | 1,415 | $88,791 |
| Mean Household Income | 1,415 | $99,723 |
| Income Deficit | 695 | $0 |
| Wage / Income Gap (%) | 2,993 | 29.57% |
| Wage / Income Gap ($) | 2,993 | 70.43¢ per $1 |
| Gini / Inequality Index | 2,993 | 0.37 |
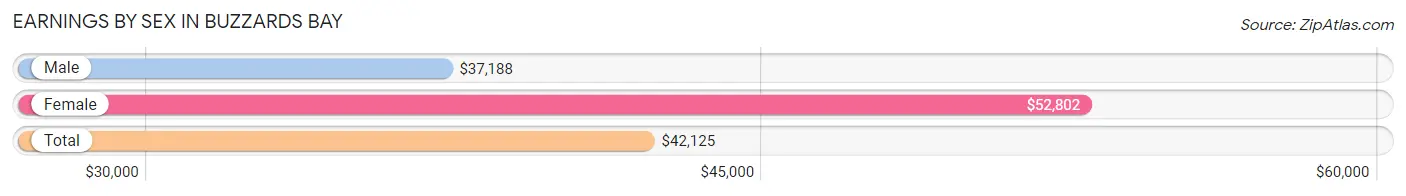
Earnings by Sex in Buzzards Bay
Average Earnings in Buzzards Bay are $42,125, $37,188 for men and $52,802 for women, a difference of 29.6%.
| Sex | Number | Average Earnings |
| Male | 1,067 (55.7%) | $37,188 |
| Female | 847 (44.3%) | $52,802 |
| Total | 1,914 (100.0%) | $42,125 |
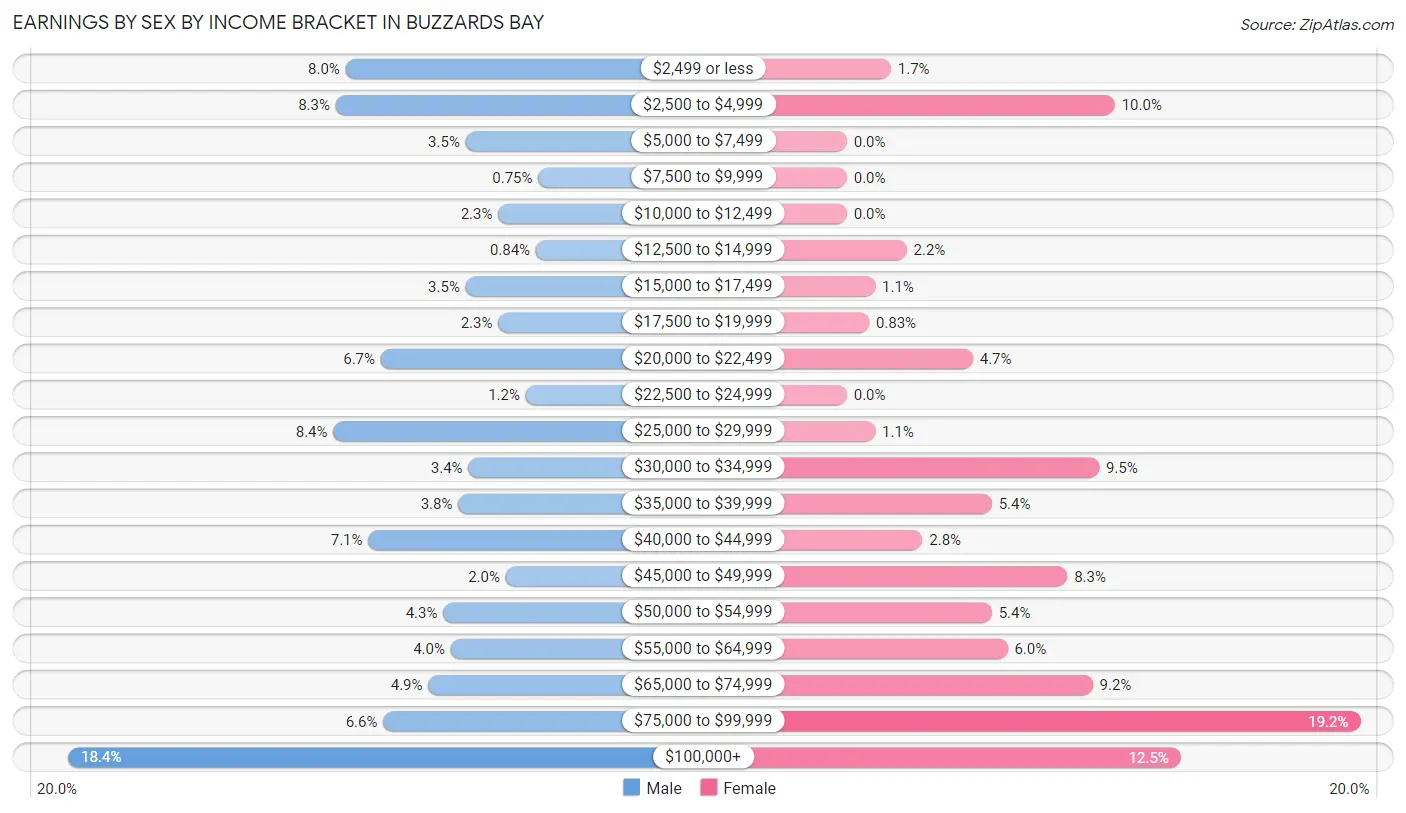
Earnings by Sex by Income Bracket in Buzzards Bay
The most common earnings brackets in Buzzards Bay are $100,000+ for men (196 | 18.4%) and $75,000 to $99,999 for women (163 | 19.2%).
| Income | Male | Female |
| $2,499 or less | 85 (8.0%) | 14 (1.7%) |
| $2,500 to $4,999 | 89 (8.3%) | 85 (10.0%) |
| $5,000 to $7,499 | 37 (3.5%) | 0 (0.0%) |
| $7,500 to $9,999 | 8 (0.7%) | 0 (0.0%) |
| $10,000 to $12,499 | 24 (2.2%) | 0 (0.0%) |
| $12,500 to $14,999 | 9 (0.8%) | 19 (2.2%) |
| $15,000 to $17,499 | 37 (3.5%) | 9 (1.1%) |
| $17,500 to $19,999 | 24 (2.2%) | 7 (0.8%) |
| $20,000 to $22,499 | 71 (6.7%) | 40 (4.7%) |
| $22,500 to $24,999 | 13 (1.2%) | 0 (0.0%) |
| $25,000 to $29,999 | 90 (8.4%) | 9 (1.1%) |
| $30,000 to $34,999 | 36 (3.4%) | 80 (9.5%) |
| $35,000 to $39,999 | 40 (3.7%) | 46 (5.4%) |
| $40,000 to $44,999 | 76 (7.1%) | 24 (2.8%) |
| $45,000 to $49,999 | 21 (2.0%) | 70 (8.3%) |
| $50,000 to $54,999 | 46 (4.3%) | 46 (5.4%) |
| $55,000 to $64,999 | 43 (4.0%) | 51 (6.0%) |
| $65,000 to $74,999 | 52 (4.9%) | 78 (9.2%) |
| $75,000 to $99,999 | 70 (6.6%) | 163 (19.2%) |
| $100,000+ | 196 (18.4%) | 106 (12.5%) |
| Total | 1,067 (100.0%) | 847 (100.0%) |
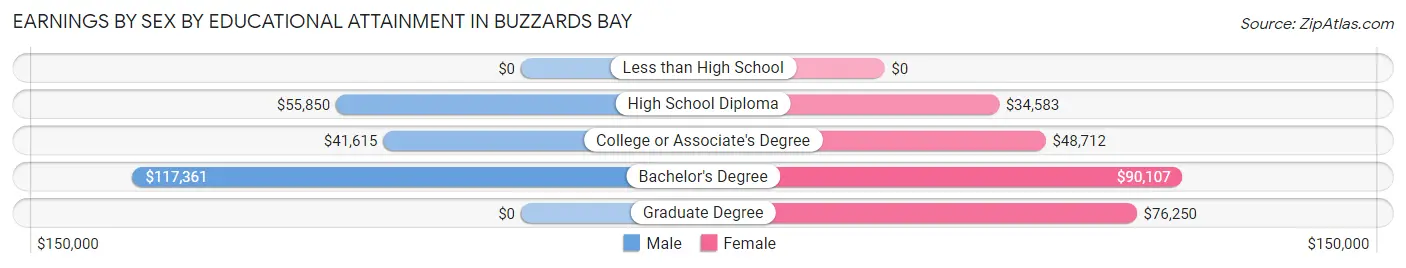
Earnings by Sex by Educational Attainment in Buzzards Bay
Average earnings in Buzzards Bay are $53,207 for men and $55,625 for women, a difference of 4.3%. Men with an educational attainment of bachelor's degree enjoy the highest average annual earnings of $117,361, while those with college or associate's degree education earn the least with $41,615. Women with an educational attainment of bachelor's degree earn the most with the average annual earnings of $90,107, while those with high school diploma education have the smallest earnings of $34,583.
| Educational Attainment | Male Income | Female Income |
| Less than High School | - | - |
| High School Diploma | $55,850 | $34,583 |
| College or Associate's Degree | $41,615 | $48,712 |
| Bachelor's Degree | $117,361 | $90,107 |
| Graduate Degree | - | - |
| Total | $53,207 | $55,625 |
Family Income in Buzzards Bay
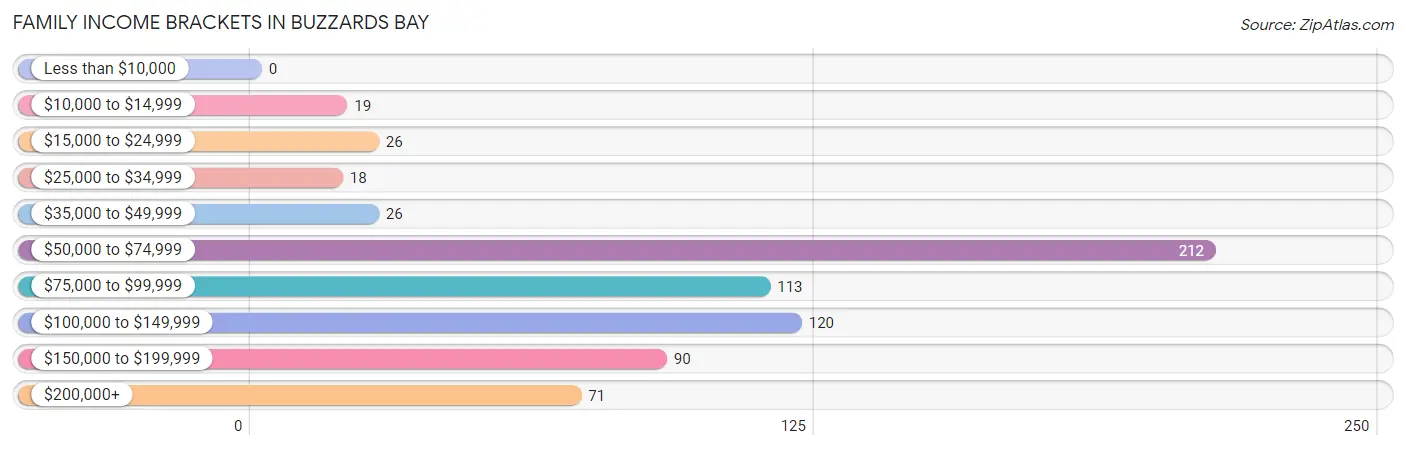
Family Income Brackets in Buzzards Bay
According to the Buzzards Bay family income data, there are 212 families falling into the $50,000 to $74,999 income range, which is the most common income bracket and makes up 30.5% of all families.
| Income Bracket | # Families | % Families |
| Less than $10,000 | 0 | 0.0% |
| $10,000 to $14,999 | 19 | 2.7% |
| $15,000 to $24,999 | 26 | 3.7% |
| $25,000 to $34,999 | 18 | 2.6% |
| $35,000 to $49,999 | 26 | 3.7% |
| $50,000 to $74,999 | 212 | 30.5% |
| $75,000 to $99,999 | 113 | 16.3% |
| $100,000 to $149,999 | 120 | 17.3% |
| $150,000 to $199,999 | 90 | 12.9% |
| $200,000+ | 71 | 10.2% |
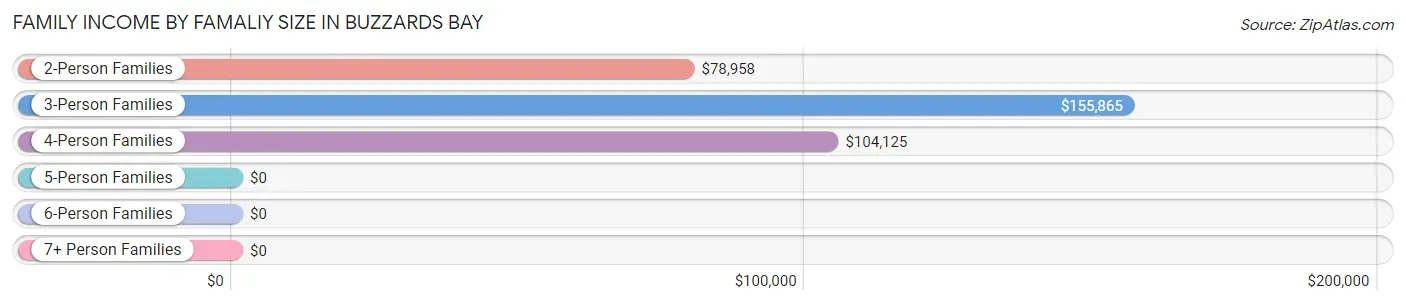
Family Income by Famaliy Size in Buzzards Bay
3-person families (115 | 16.6%) account for the highest median family income in Buzzards Bay with $155,865 per family, while 3-person families (115 | 16.6%) have the highest median income of $51,955 per family member.
| Income Bracket | # Families | Median Income |
| 2-Person Families | 530 (76.3%) | $78,958 |
| 3-Person Families | 115 (16.6%) | $155,865 |
| 4-Person Families | 33 (4.8%) | $104,125 |
| 5-Person Families | 17 (2.5%) | $0 |
| 6-Person Families | 0 (0.0%) | $0 |
| 7+ Person Families | 0 (0.0%) | $0 |
| Total | 695 (100.0%) | $88,068 |
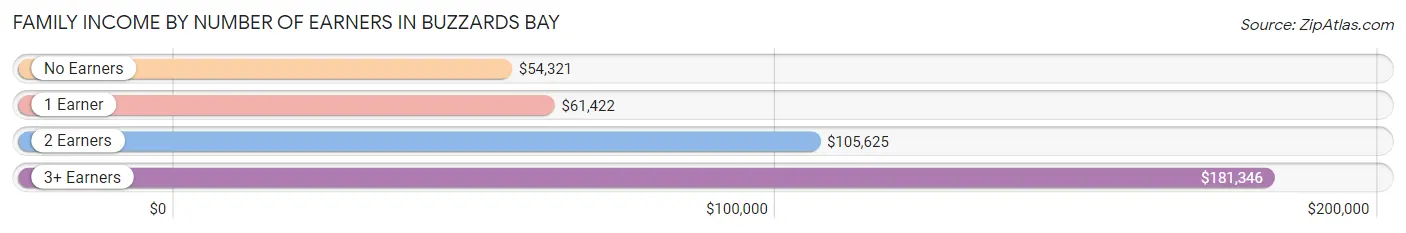
Family Income by Number of Earners in Buzzards Bay
The median family income in Buzzards Bay is $88,068, with families comprising 3+ earners (106) having the highest median family income of $181,346, while families with no earners (103) have the lowest median family income of $54,321, accounting for 15.2% and 14.8% of families, respectively.
| Number of Earners | # Families | Median Income |
| No Earners | 103 (14.8%) | $54,321 |
| 1 Earner | 305 (43.9%) | $61,422 |
| 2 Earners | 181 (26.0%) | $105,625 |
| 3+ Earners | 106 (15.2%) | $181,346 |
| Total | 695 (100.0%) | $88,068 |
Household Income in Buzzards Bay
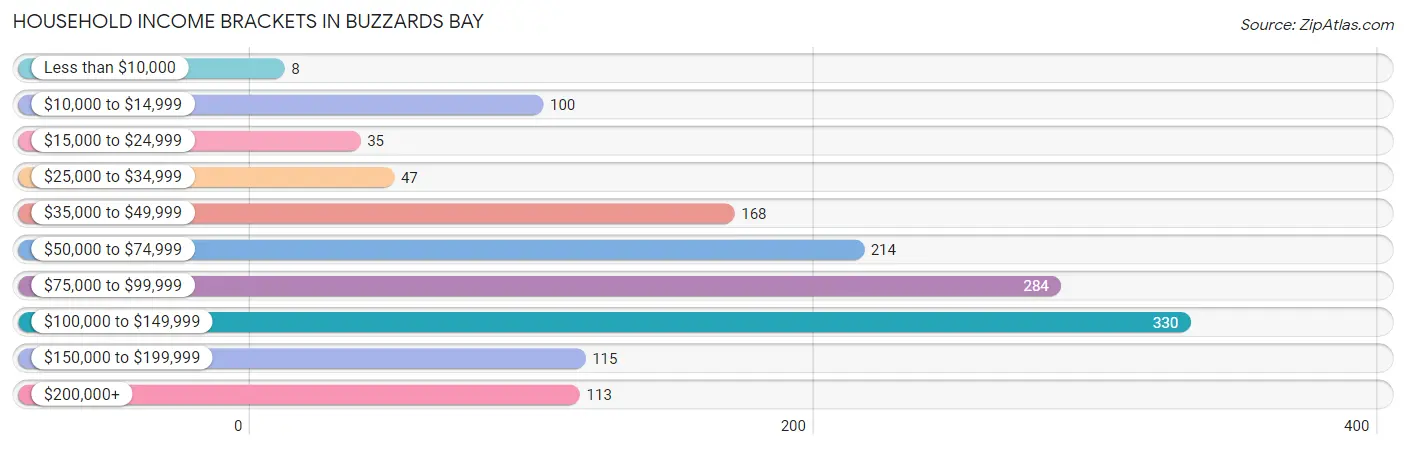
Household Income Brackets in Buzzards Bay
With 330 households falling in the category, the $100,000 to $149,999 income range is the most frequent in Buzzards Bay, accounting for 23.3% of all households. In contrast, only 8 households (0.6%) fall into the less than $10,000 income bracket, making it the least populous group.
| Income Bracket | # Households | % Households |
| Less than $10,000 | 8 | 0.6% |
| $10,000 to $14,999 | 100 | 7.1% |
| $15,000 to $24,999 | 35 | 2.5% |
| $25,000 to $34,999 | 47 | 3.3% |
| $35,000 to $49,999 | 168 | 11.9% |
| $50,000 to $74,999 | 214 | 15.1% |
| $75,000 to $99,999 | 284 | 20.1% |
| $100,000 to $149,999 | 330 | 23.3% |
| $150,000 to $199,999 | 115 | 8.1% |
| $200,000+ | 113 | 8.0% |
Household Income by Householder Age in Buzzards Bay
The median household income in Buzzards Bay is $88,791, with the highest median household income of $111,600 found in the 45 to 64 years age bracket for the primary householder. A total of 626 households (44.2%) fall into this category. Meanwhile, the 15 to 24 years age bracket for the primary householder has the lowest median household income of $0, with 67 households (4.7%) in this group.
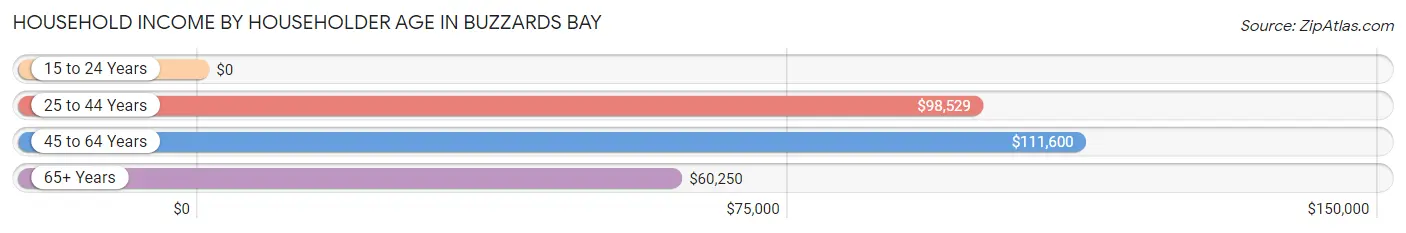
| Income Bracket | # Households | Median Income |
| 15 to 24 Years | 67 (4.7%) | $0 |
| 25 to 44 Years | 142 (10.0%) | $98,529 |
| 45 to 64 Years | 626 (44.2%) | $111,600 |
| 65+ Years | 580 (41.0%) | $60,250 |
| Total | 1,415 (100.0%) | $88,791 |
Poverty in Buzzards Bay
Income Below Poverty by Sex and Age in Buzzards Bay
With 6.4% poverty level for males and 9.3% for females among the residents of Buzzards Bay, 25 to 34 year old males and 16 and 17 year old females are the most vulnerable to poverty, with 26 males (22.2%) and 6 females (42.9%) in their respective age groups living below the poverty level.
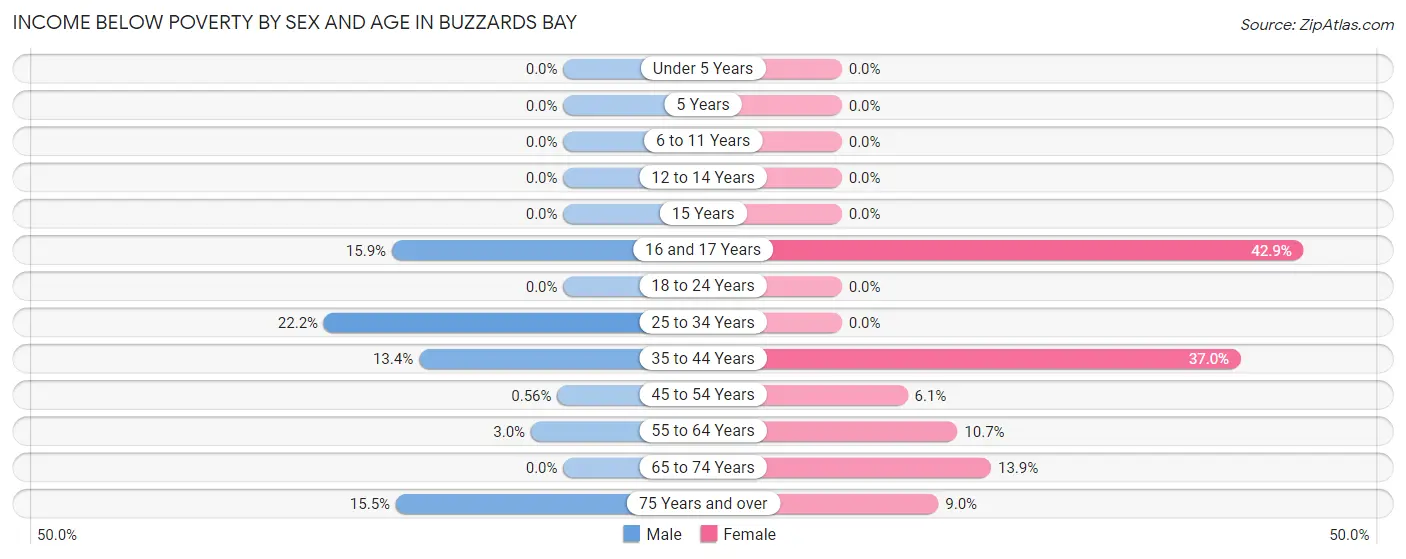
| Age Bracket | Male | Female |
| Under 5 Years | 0 (0.0%) | 0 (0.0%) |
| 5 Years | 0 (0.0%) | 0 (0.0%) |
| 6 to 11 Years | 0 (0.0%) | 0 (0.0%) |
| 12 to 14 Years | 0 (0.0%) | 0 (0.0%) |
| 15 Years | 0 (0.0%) | 0 (0.0%) |
| 16 and 17 Years | 7 (15.9%) | 6 (42.9%) |
| 18 to 24 Years | 0 (0.0%) | 0 (0.0%) |
| 25 to 34 Years | 26 (22.2%) | 0 (0.0%) |
| 35 to 44 Years | 13 (13.4%) | 10 (37.0%) |
| 45 to 54 Years | 1 (0.6%) | 11 (6.1%) |
| 55 to 64 Years | 8 (3.0%) | 41 (10.7%) |
| 65 to 74 Years | 0 (0.0%) | 50 (13.9%) |
| 75 Years and over | 30 (15.5%) | 12 (9.0%) |
| Total | 85 (6.4%) | 130 (9.3%) |
Income Above Poverty by Sex and Age in Buzzards Bay
According to the poverty statistics in Buzzards Bay, males aged 6 to 11 years and females aged under 5 years are the age groups that are most secure financially, with 100.0% of males and 100.0% of females in these age groups living above the poverty line.
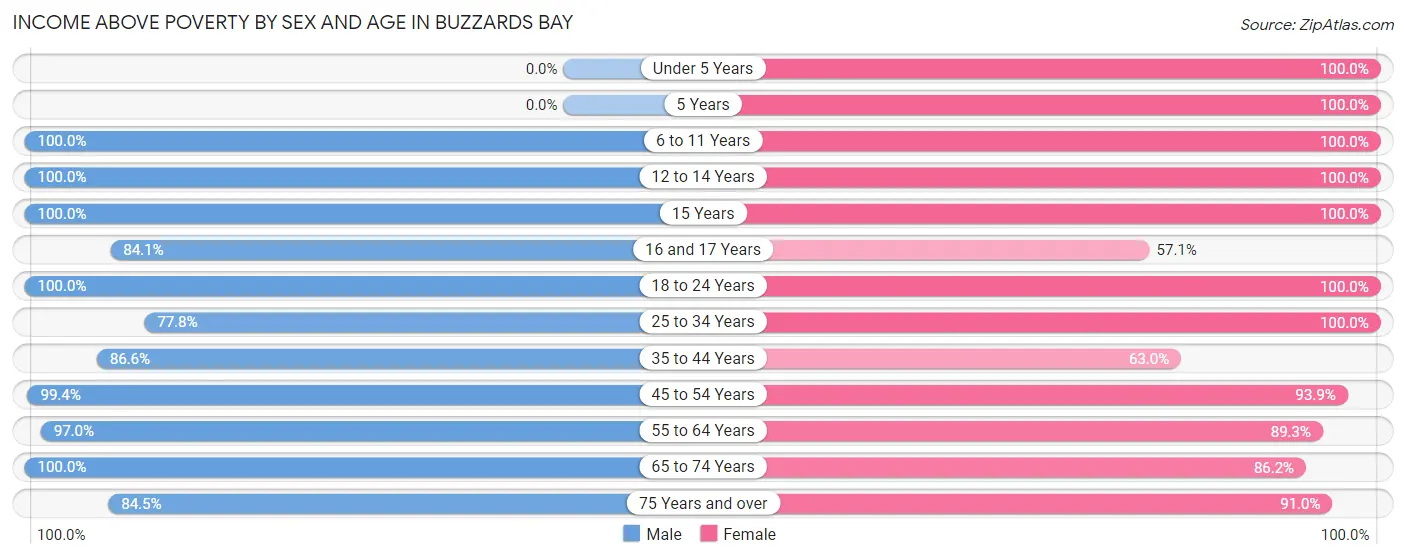
| Age Bracket | Male | Female |
| Under 5 Years | 0 (0.0%) | 41 (100.0%) |
| 5 Years | 0 (0.0%) | 27 (100.0%) |
| 6 to 11 Years | 19 (100.0%) | 44 (100.0%) |
| 12 to 14 Years | 8 (100.0%) | 20 (100.0%) |
| 15 Years | 18 (100.0%) | 6 (100.0%) |
| 16 and 17 Years | 37 (84.1%) | 8 (57.1%) |
| 18 to 24 Years | 175 (100.0%) | 77 (100.0%) |
| 25 to 34 Years | 91 (77.8%) | 78 (100.0%) |
| 35 to 44 Years | 84 (86.6%) | 17 (63.0%) |
| 45 to 54 Years | 176 (99.4%) | 169 (93.9%) |
| 55 to 64 Years | 258 (97.0%) | 341 (89.3%) |
| 65 to 74 Years | 209 (100.0%) | 311 (86.2%) |
| 75 Years and over | 163 (84.5%) | 122 (91.0%) |
| Total | 1,238 (93.6%) | 1,261 (90.6%) |
Income Below Poverty Among Married-Couple Families in Buzzards Bay
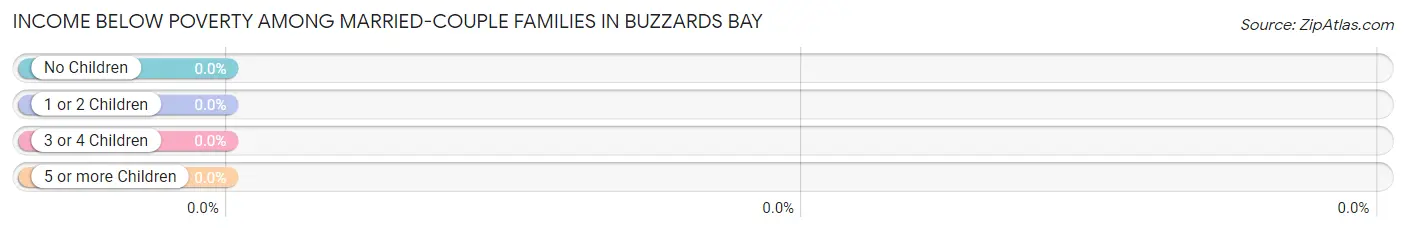
| Children | Above Poverty | Below Poverty |
| No Children | 409 (100.0%) | 0 (0.0%) |
| 1 or 2 Children | 48 (100.0%) | 0 (0.0%) |
| 3 or 4 Children | 8 (100.0%) | 0 (0.0%) |
| 5 or more Children | 0 (0.0%) | 0 (0.0%) |
| Total | 465 (100.0%) | 0 (0.0%) |
Income Below Poverty Among Single-Parent Households in Buzzards Bay
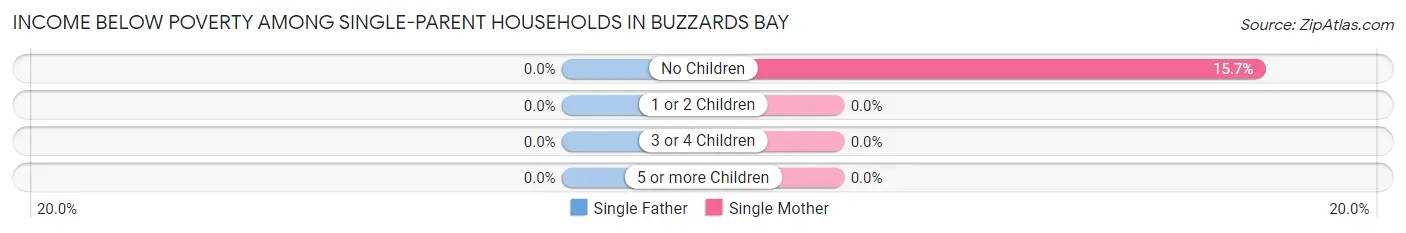
| Children | Single Father | Single Mother |
| No Children | 0 (0.0%) | 19 (15.7%) |
| 1 or 2 Children | 0 (0.0%) | 0 (0.0%) |
| 3 or 4 Children | 0 (0.0%) | 0 (0.0%) |
| 5 or more Children | 0 (0.0%) | 0 (0.0%) |
| Total | 0 (0.0%) | 19 (9.7%) |
Income Below Poverty Among Married-Couple vs Single-Parent Households in Buzzards Bay
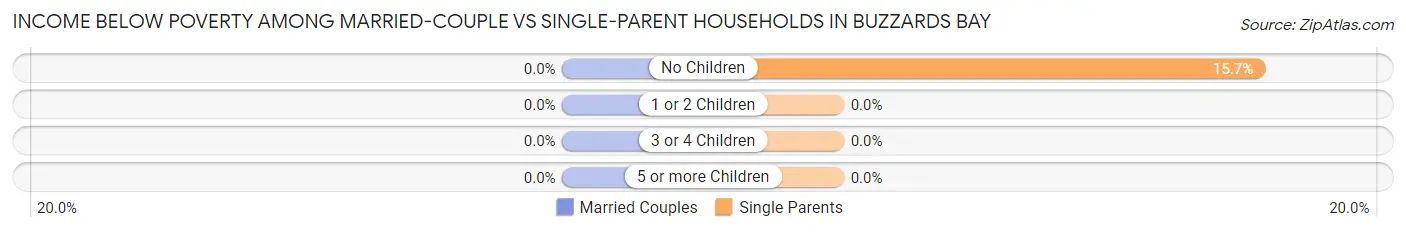
| Children | Married-Couple Families | Single-Parent Households |
| No Children | 0 (0.0%) | 19 (15.7%) |
| 1 or 2 Children | 0 (0.0%) | 0 (0.0%) |
| 3 or 4 Children | 0 (0.0%) | 0 (0.0%) |
| 5 or more Children | 0 (0.0%) | 0 (0.0%) |
| Total | 0 (0.0%) | 19 (8.3%) |
Race in Buzzards Bay
The most populous races in Buzzards Bay are White / Caucasian (2,769 | 92.5%), Two or more Races (139 | 4.6%), and Hispanic or Latino (74 | 2.5%).
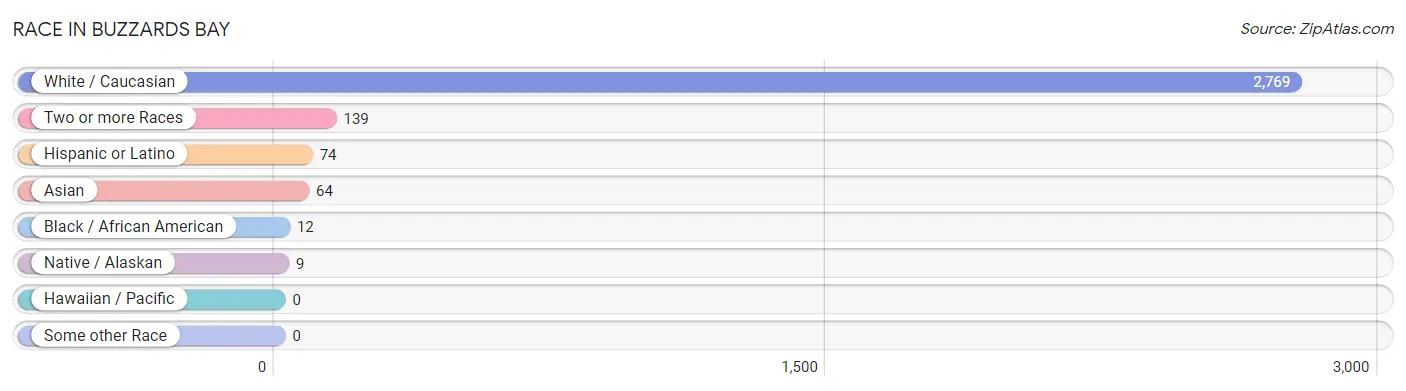
| Race | # Population | % Population |
| Asian | 64 | 2.1% |
| Black / African American | 12 | 0.4% |
| Hawaiian / Pacific | 0 | 0.0% |
| Hispanic or Latino | 74 | 2.5% |
| Native / Alaskan | 9 | 0.3% |
| White / Caucasian | 2,769 | 92.5% |
| Two or more Races | 139 | 4.6% |
| Some other Race | 0 | 0.0% |
| Total | 2,993 | 100.0% |
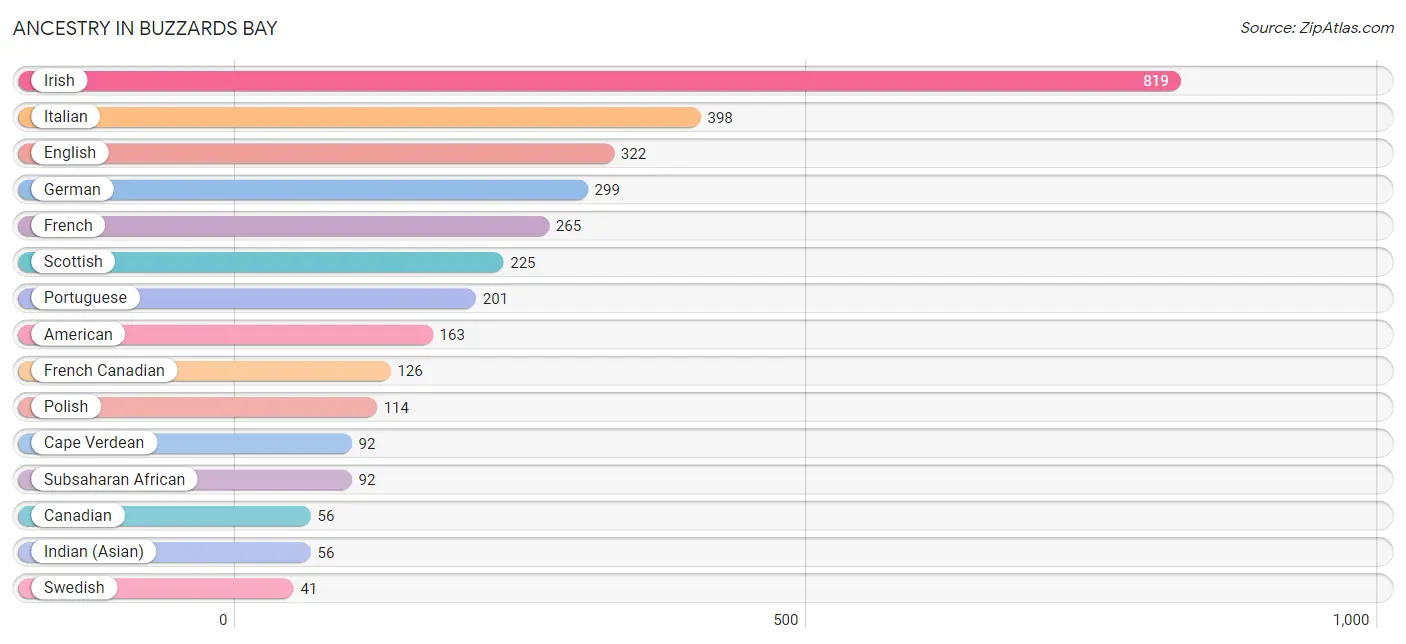
Ancestry in Buzzards Bay
The most populous ancestries reported in Buzzards Bay are Irish (819 | 27.4%), Italian (398 | 13.3%), English (322 | 10.8%), German (299 | 10.0%), and French (265 | 8.8%), together accounting for 70.3% of all Buzzards Bay residents.
| Ancestry | # Population | % Population |
| Albanian | 40 | 1.3% |
| American | 163 | 5.4% |
| Arab | 8 | 0.3% |
| Assyrian / Chaldean / Syriac | 11 | 0.4% |
| British | 32 | 1.1% |
| Canadian | 56 | 1.9% |
| Cape Verdean | 92 | 3.1% |
| Danish | 13 | 0.4% |
| Dutch | 22 | 0.7% |
| Eastern European | 18 | 0.6% |
| English | 322 | 10.8% |
| European | 21 | 0.7% |
| Finnish | 11 | 0.4% |
| French | 265 | 8.8% |
| French Canadian | 126 | 4.2% |
| German | 299 | 10.0% |
| Greek | 37 | 1.2% |
| Haitian | 1 | 0.0% |
| Hungarian | 10 | 0.3% |
| Indian (Asian) | 56 | 1.9% |
| Irish | 819 | 27.4% |
| Italian | 398 | 13.3% |
| Lithuanian | 18 | 0.6% |
| Mexican | 6 | 0.2% |
| Norwegian | 20 | 0.7% |
| Polish | 114 | 3.8% |
| Portuguese | 201 | 6.7% |
| Puerto Rican | 34 | 1.1% |
| Russian | 19 | 0.6% |
| Scotch-Irish | 34 | 1.1% |
| Scottish | 225 | 7.5% |
| Spaniard | 10 | 0.3% |
| Sri Lankan | 8 | 0.3% |
| Subsaharan African | 92 | 3.1% |
| Swedish | 41 | 1.4% |
| Syrian | 8 | 0.3% |
| Turkish | 10 | 0.3% |
| Ukrainian | 12 | 0.4% |
| Welsh | 20 | 0.7% | View All 39 Rows |
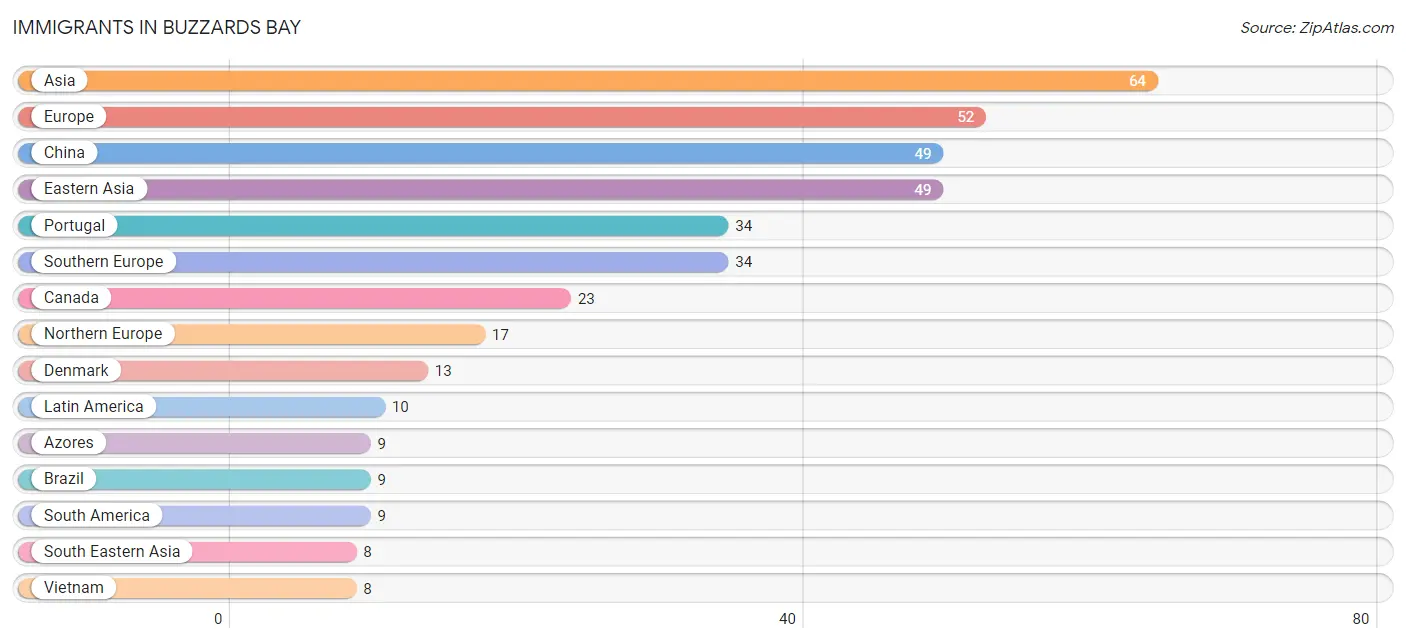
Immigrants in Buzzards Bay
The most numerous immigrant groups reported in Buzzards Bay came from Asia (64 | 2.1%), Europe (52 | 1.7%), China (49 | 1.6%), Eastern Asia (49 | 1.6%), and Portugal (34 | 1.1%), together accounting for 8.3% of all Buzzards Bay residents.
| Immigration Origin | # Population | % Population |
| Asia | 64 | 2.1% |
| Azores | 9 | 0.3% |
| Brazil | 9 | 0.3% |
| Canada | 23 | 0.8% |
| Caribbean | 1 | 0.0% |
| China | 49 | 1.6% |
| Denmark | 13 | 0.4% |
| Eastern Asia | 49 | 1.6% |
| Eastern Europe | 1 | 0.0% |
| Europe | 52 | 1.7% |
| Haiti | 1 | 0.0% |
| India | 7 | 0.2% |
| Ireland | 4 | 0.1% |
| Latin America | 10 | 0.3% |
| Northern Europe | 17 | 0.6% |
| Poland | 1 | 0.0% |
| Portugal | 34 | 1.1% |
| South America | 9 | 0.3% |
| South Central Asia | 7 | 0.2% |
| South Eastern Asia | 8 | 0.3% |
| Southern Europe | 34 | 1.1% |
| Vietnam | 8 | 0.3% | View All 22 Rows |
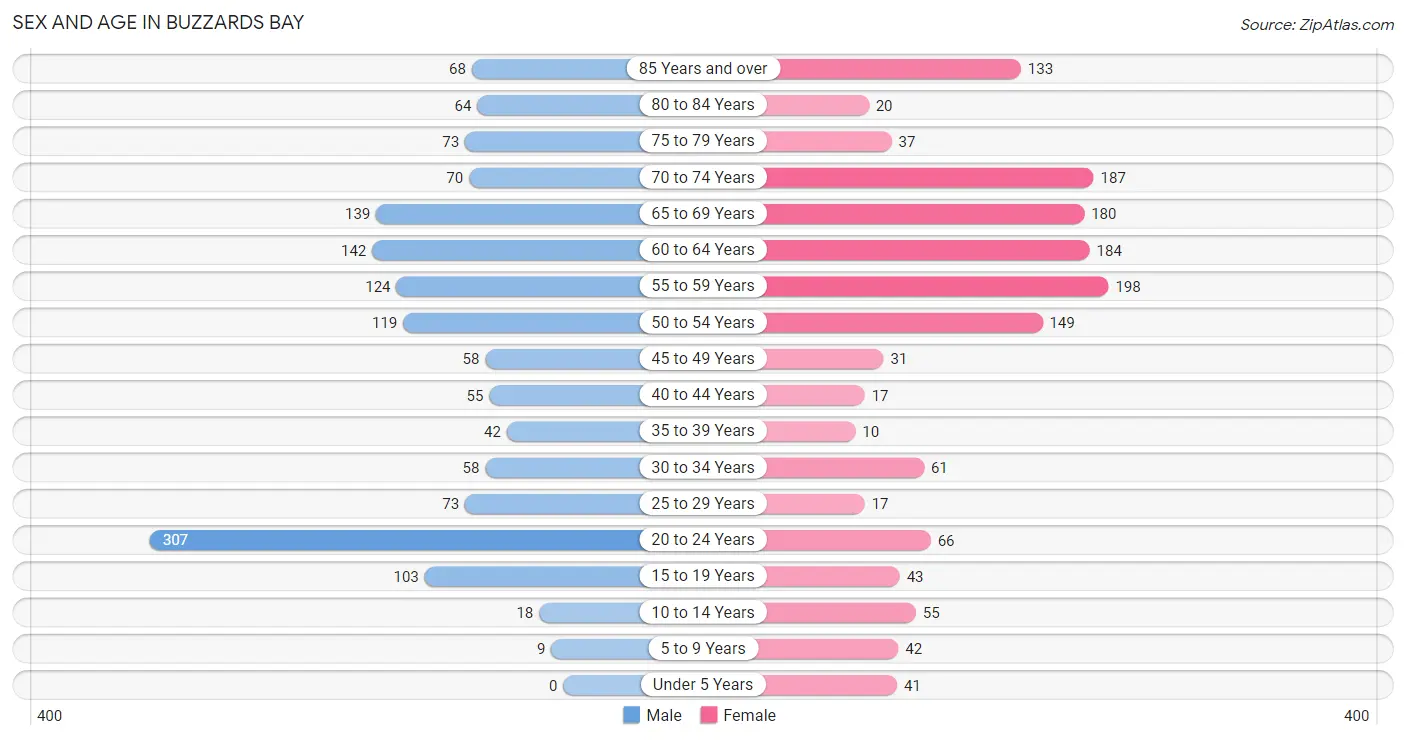
Sex and Age in Buzzards Bay
Sex and Age in Buzzards Bay
The most populous age groups in Buzzards Bay are 20 to 24 Years (307 | 20.2%) for men and 55 to 59 Years (198 | 13.5%) for women.
| Age Bracket | Male | Female |
| Under 5 Years | 0 (0.0%) | 41 (2.8%) |
| 5 to 9 Years | 9 (0.6%) | 42 (2.9%) |
| 10 to 14 Years | 18 (1.2%) | 55 (3.7%) |
| 15 to 19 Years | 103 (6.8%) | 43 (2.9%) |
| 20 to 24 Years | 307 (20.2%) | 66 (4.5%) |
| 25 to 29 Years | 73 (4.8%) | 17 (1.2%) |
| 30 to 34 Years | 58 (3.8%) | 61 (4.2%) |
| 35 to 39 Years | 42 (2.8%) | 10 (0.7%) |
| 40 to 44 Years | 55 (3.6%) | 17 (1.2%) |
| 45 to 49 Years | 58 (3.8%) | 31 (2.1%) |
| 50 to 54 Years | 119 (7.8%) | 149 (10.1%) |
| 55 to 59 Years | 124 (8.2%) | 198 (13.5%) |
| 60 to 64 Years | 142 (9.3%) | 184 (12.5%) |
| 65 to 69 Years | 139 (9.1%) | 180 (12.2%) |
| 70 to 74 Years | 70 (4.6%) | 187 (12.7%) |
| 75 to 79 Years | 73 (4.8%) | 37 (2.5%) |
| 80 to 84 Years | 64 (4.2%) | 20 (1.4%) |
| 85 Years and over | 68 (4.5%) | 133 (9.0%) |
| Total | 1,522 (100.0%) | 1,471 (100.0%) |
Families and Households in Buzzards Bay
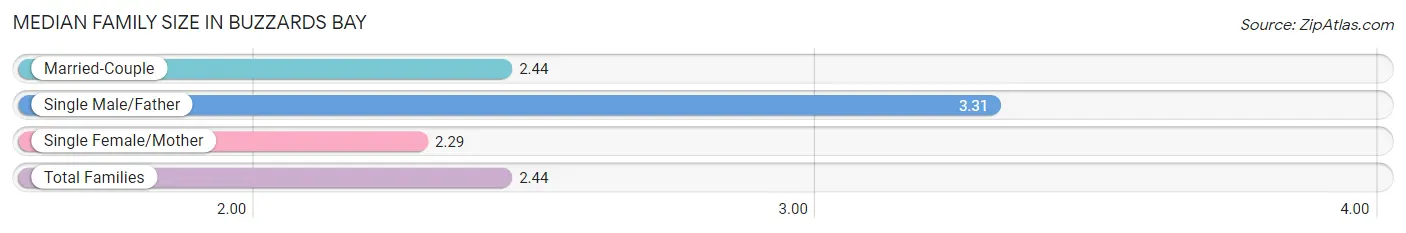
Median Family Size in Buzzards Bay
The median family size in Buzzards Bay is 2.44 persons per family, with single male/father families (35 | 5.0%) accounting for the largest median family size of 3.31 persons per family. On the other hand, single female/mother families (195 | 28.1%) represent the smallest median family size with 2.29 persons per family.
| Family Type | # Families | Family Size |
| Married-Couple | 465 (66.9%) | 2.44 |
| Single Male/Father | 35 (5.0%) | 3.31 |
| Single Female/Mother | 195 (28.1%) | 2.29 |
| Total Families | 695 (100.0%) | 2.44 |
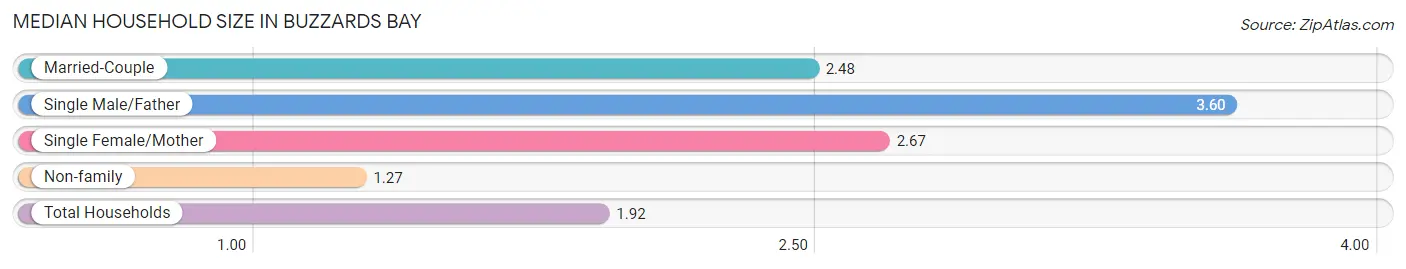
Median Household Size in Buzzards Bay
The median household size in Buzzards Bay is 1.92 persons per household, with single male/father households (35 | 2.5%) accounting for the largest median household size of 3.6 persons per household. non-family households (720 | 50.9%) represent the smallest median household size with 1.27 persons per household.
| Household Type | # Households | Household Size |
| Married-Couple | 465 (32.9%) | 2.48 |
| Single Male/Father | 35 (2.5%) | 3.60 |
| Single Female/Mother | 195 (13.8%) | 2.67 |
| Non-family | 720 (50.9%) | 1.27 |
| Total Households | 1,415 (100.0%) | 1.92 |
Household Size by Marriage Status in Buzzards Bay
Out of a total of 1,415 households in Buzzards Bay, 695 (49.1%) are family households, while 720 (50.9%) are nonfamily households. The most numerous type of family households are 2-person households, comprising 451, and the most common type of nonfamily households are 1-person households, comprising 543.
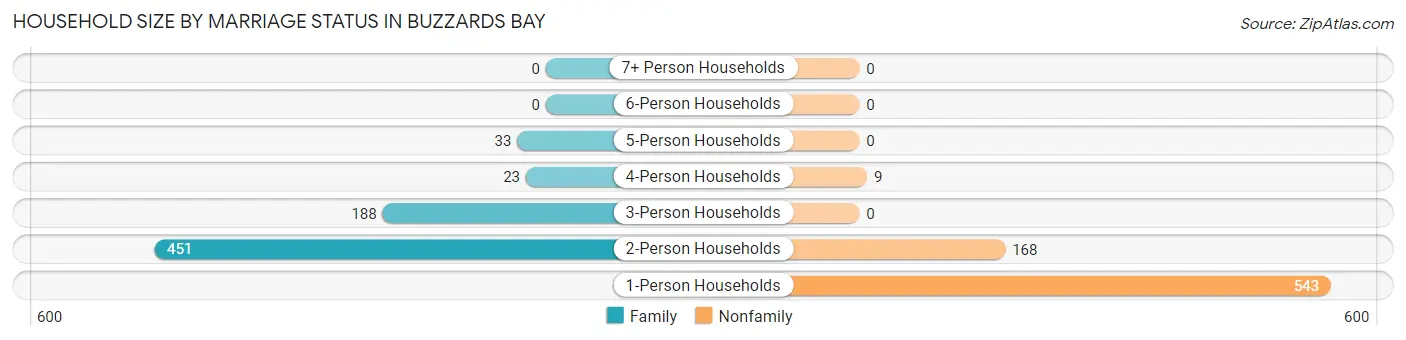
| Household Size | Family Households | Nonfamily Households |
| 1-Person Households | - | 543 (38.4%) |
| 2-Person Households | 451 (31.9%) | 168 (11.9%) |
| 3-Person Households | 188 (13.3%) | 0 (0.0%) |
| 4-Person Households | 23 (1.6%) | 9 (0.6%) |
| 5-Person Households | 33 (2.3%) | 0 (0.0%) |
| 6-Person Households | 0 (0.0%) | 0 (0.0%) |
| 7+ Person Households | 0 (0.0%) | 0 (0.0%) |
| Total | 695 (49.1%) | 720 (50.9%) |
Female Fertility in Buzzards Bay
Fertility by Age in Buzzards Bay
| Age Bracket | Women with Births | Births / 1,000 Women |
| 15 to 19 years | 0 (0.0%) | 0.0 |
| 20 to 34 years | 0 (0.0%) | 0.0 |
| 35 to 50 years | 0 (0.0%) | 0.0 |
| Total | 0 (0.0%) | 0.0 |
Fertility by Age by Marriage Status in Buzzards Bay
| Age Bracket | Married | Unmarried |
| 15 to 19 years | 0 (0.0%) | 0 (0.0%) |
| 20 to 34 years | 0 (0.0%) | 0 (0.0%) |
| 35 to 50 years | 0 (0.0%) | 0 (0.0%) |
| Total | 0 (0.0%) | 0 (0.0%) |
Fertility by Education in Buzzards Bay
| Educational Attainment | Women with Births | Births / 1,000 Women |
| Less than High School | 0 (0.0%) | 0.0 |
| High School Diploma | 0 (0.0%) | 0.0 |
| College or Associate's Degree | 0 (0.0%) | 0.0 |
| Bachelor's Degree | 0 (0.0%) | 0.0 |
| Graduate Degree | 0 (0.0%) | 0.0 |
| Total | 0 (0.0%) | 0.0 |
Fertility by Education by Marriage Status in Buzzards Bay
| Educational Attainment | Married | Unmarried |
| Less than High School | 0 (0.0%) | 0 (0.0%) |
| High School Diploma | 0 (0.0%) | 0 (0.0%) |
| College or Associate's Degree | 0 (0.0%) | 0 (0.0%) |
| Bachelor's Degree | 0 (0.0%) | 0 (0.0%) |
| Graduate Degree | 0 (0.0%) | 0 (0.0%) |
| Total | 0 (0.0%) | 0 (0.0%) |
Employment Characteristics in Buzzards Bay
Employment by Class of Employer in Buzzards Bay
Among the 1,670 employed individuals in Buzzards Bay, private company employees (1,113 | 66.6%), local government employees (124 | 7.4%), and federal government employees (102 | 6.1%) make up the most common classes of employment.
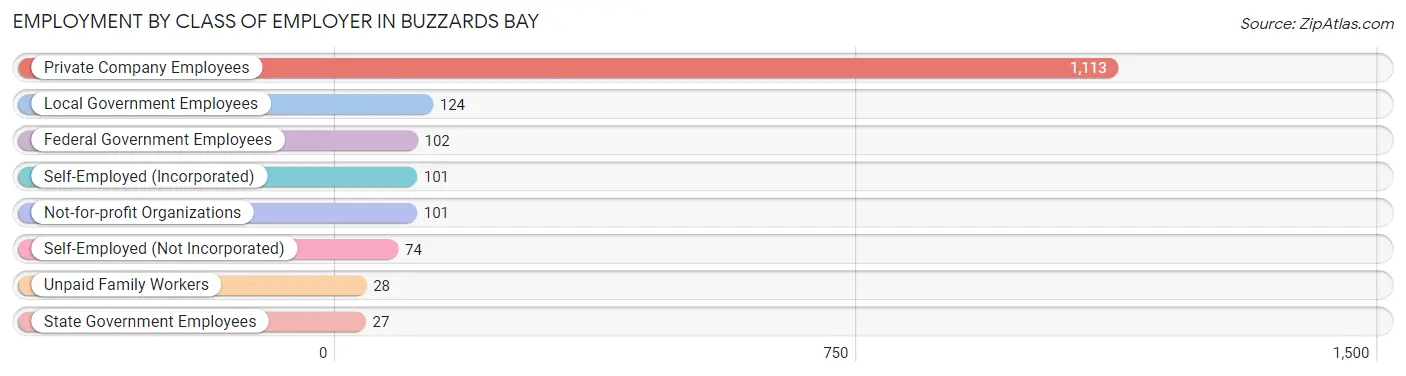
| Employer Class | # Employees | % Employees |
| Private Company Employees | 1,113 | 66.6% |
| Self-Employed (Incorporated) | 101 | 6.0% |
| Self-Employed (Not Incorporated) | 74 | 4.4% |
| Not-for-profit Organizations | 101 | 6.0% |
| Local Government Employees | 124 | 7.4% |
| State Government Employees | 27 | 1.6% |
| Federal Government Employees | 102 | 6.1% |
| Unpaid Family Workers | 28 | 1.7% |
| Total | 1,670 | 100.0% |
Employment Status by Age in Buzzards Bay
According to the labor force statistics for Buzzards Bay, out of the total population over 16 years of age (2,804), 62.5% or 1,752 individuals are in the labor force, with 2.4% or 42 of them unemployed. The age group with the highest labor force participation rate is 25 to 29 years, with 100.0% or 90 individuals in the labor force. Within the labor force, the 55 to 59 years age range has the highest percentage of unemployed individuals, with 6.7% or 19 of them being unemployed.
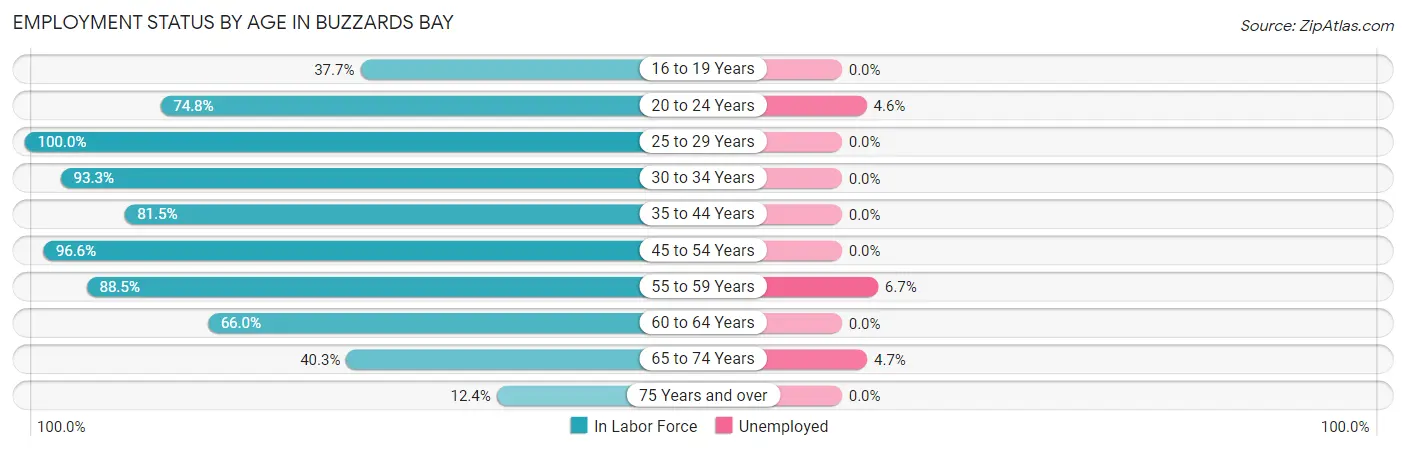
| Age Bracket | In Labor Force | Unemployed |
| 16 to 19 Years | 46 (37.7%) | 0 (0.0%) |
| 20 to 24 Years | 279 (74.8%) | 13 (4.6%) |
| 25 to 29 Years | 90 (100.0%) | 0 (0.0%) |
| 30 to 34 Years | 111 (93.3%) | 0 (0.0%) |
| 35 to 44 Years | 101 (81.5%) | 0 (0.0%) |
| 45 to 54 Years | 345 (96.6%) | 0 (0.0%) |
| 55 to 59 Years | 285 (88.5%) | 19 (6.7%) |
| 60 to 64 Years | 215 (66.0%) | 0 (0.0%) |
| 65 to 74 Years | 232 (40.3%) | 11 (4.7%) |
| 75 Years and over | 49 (12.4%) | 0 (0.0%) |
| Total | 1,752 (62.5%) | 42 (2.4%) |
Employment Status by Educational Attainment in Buzzards Bay
According to labor force statistics for Buzzards Bay, 85.7% of individuals (1,147) out of the total population between 25 and 64 years of age (1,338) are in the labor force, with 1.7% or 19 of them being unemployed. The group with the highest labor force participation rate are those with the educational attainment of bachelor's degree or higher, with 88.3% or 371 individuals in the labor force. Within the labor force, individuals with bachelor's degree or higher education have the highest percentage of unemployment, with 3.0% or 11 of them being unemployed.
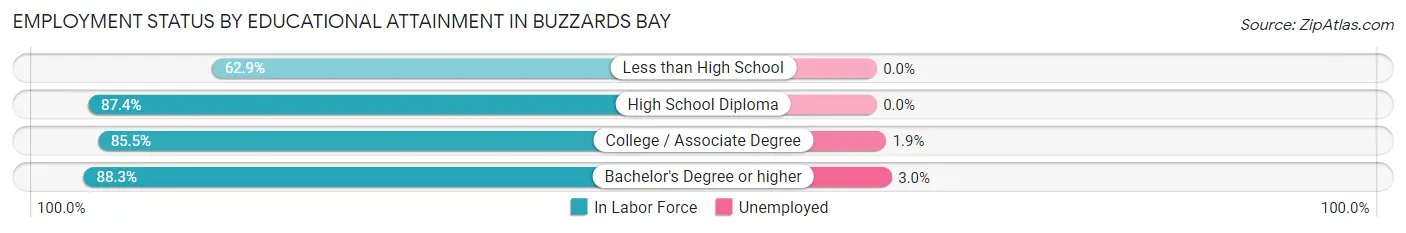
| Educational Attainment | In Labor Force | Unemployed |
| Less than High School | 44 (62.9%) | 0 (0.0%) |
| High School Diploma | 312 (87.4%) | 0 (0.0%) |
| College / Associate Degree | 420 (85.5%) | 9 (1.9%) |
| Bachelor's Degree or higher | 371 (88.3%) | 13 (3.0%) |
| Total | 1,147 (85.7%) | 23 (1.7%) |
Employment Occupations by Sex in Buzzards Bay
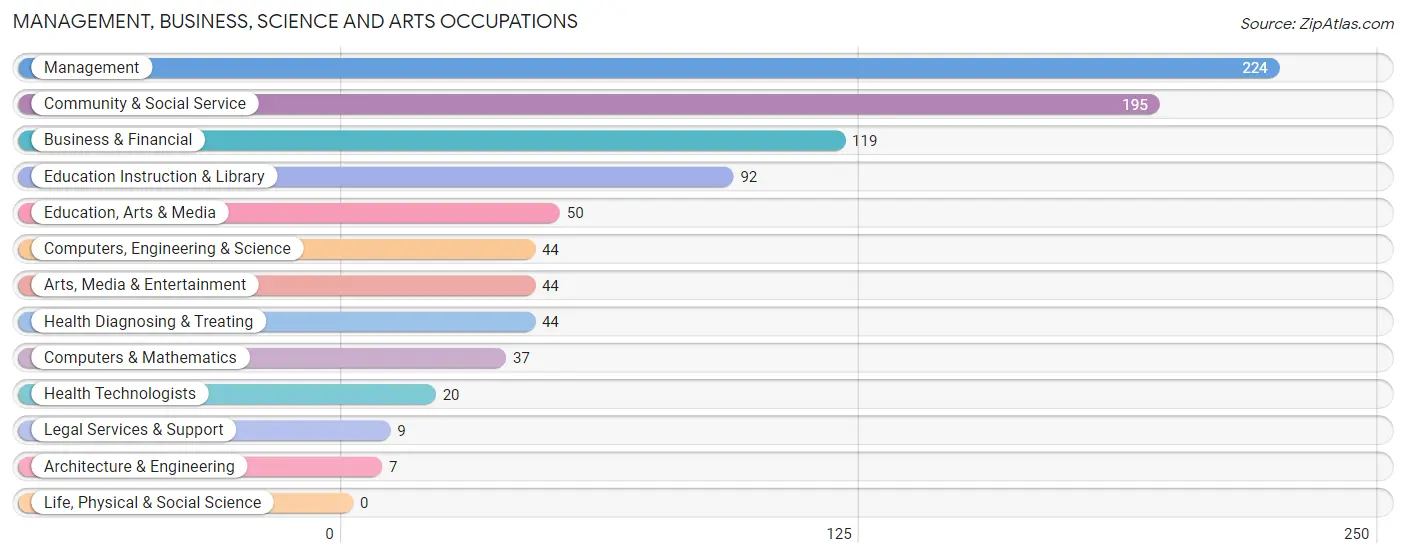
Management, Business, Science and Arts Occupations
The most common Management, Business, Science and Arts occupations in Buzzards Bay are Management (224 | 13.4%), Community & Social Service (195 | 11.7%), Business & Financial (119 | 7.1%), Education Instruction & Library (92 | 5.5%), and Education, Arts & Media (50 | 3.0%).
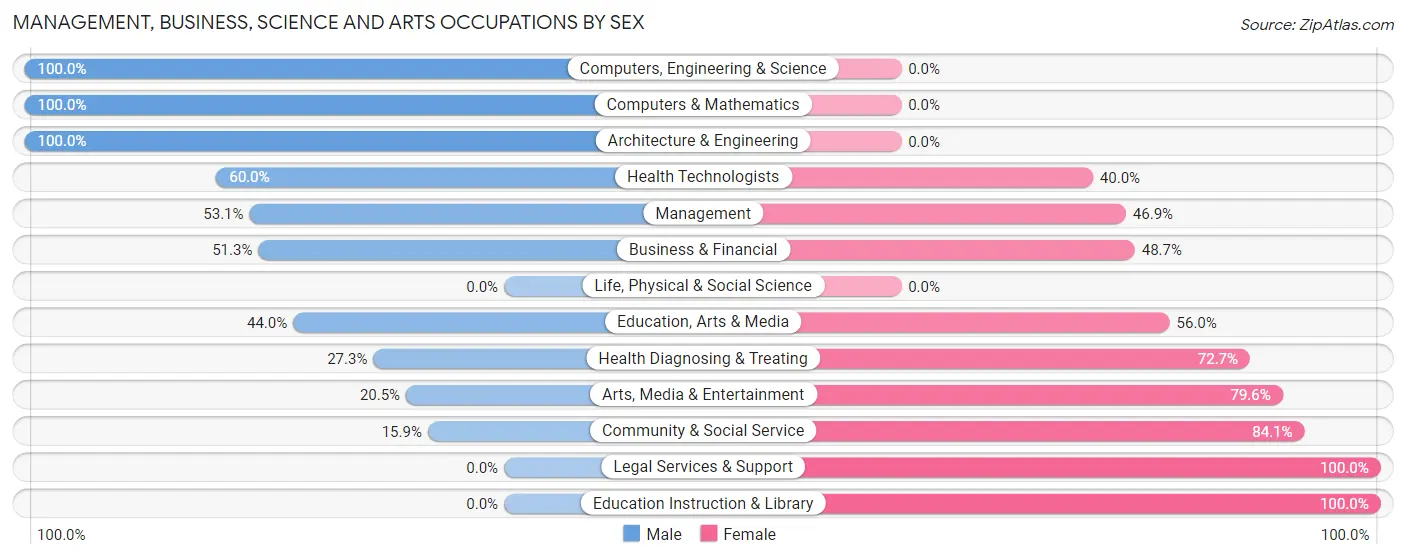
Management, Business, Science and Arts Occupations by Sex
Within the Management, Business, Science and Arts occupations in Buzzards Bay, the most male-oriented occupations are Computers, Engineering & Science (100.0%), Computers & Mathematics (100.0%), and Architecture & Engineering (100.0%), while the most female-oriented occupations are Legal Services & Support (100.0%), Education Instruction & Library (100.0%), and Community & Social Service (84.1%).
| Occupation | Male | Female |
| Management | 119 (53.1%) | 105 (46.9%) |
| Business & Financial | 61 (51.3%) | 58 (48.7%) |
| Computers, Engineering & Science | 44 (100.0%) | 0 (0.0%) |
| Computers & Mathematics | 37 (100.0%) | 0 (0.0%) |
| Architecture & Engineering | 7 (100.0%) | 0 (0.0%) |
| Life, Physical & Social Science | 0 (0.0%) | 0 (0.0%) |
| Community & Social Service | 31 (15.9%) | 164 (84.1%) |
| Education, Arts & Media | 22 (44.0%) | 28 (56.0%) |
| Legal Services & Support | 0 (0.0%) | 9 (100.0%) |
| Education Instruction & Library | 0 (0.0%) | 92 (100.0%) |
| Arts, Media & Entertainment | 9 (20.4%) | 35 (79.5%) |
| Health Diagnosing & Treating | 12 (27.3%) | 32 (72.7%) |
| Health Technologists | 12 (60.0%) | 8 (40.0%) |
| Total (Category) | 267 (42.6%) | 359 (57.4%) |
| Total (Overall) | 951 (56.9%) | 721 (43.1%) |
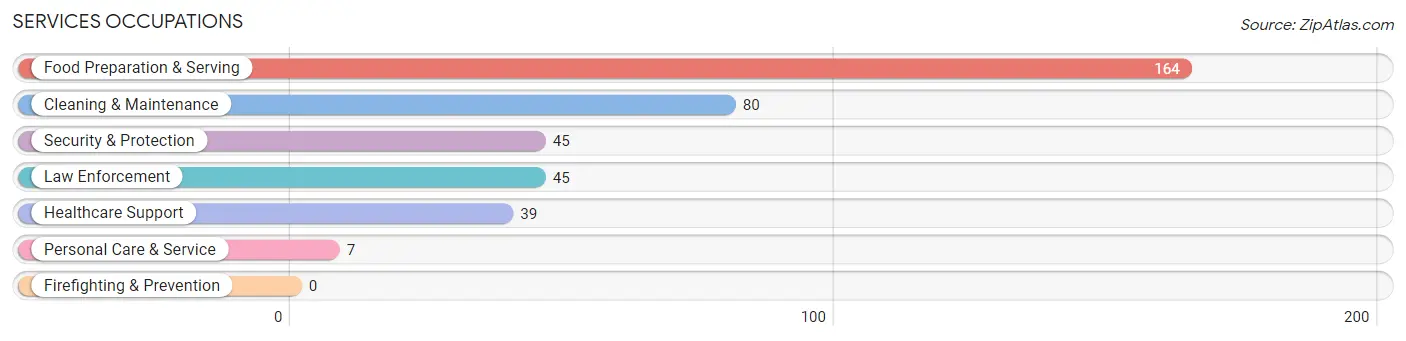
Services Occupations
The most common Services occupations in Buzzards Bay are Food Preparation & Serving (164 | 9.8%), Cleaning & Maintenance (80 | 4.8%), Security & Protection (45 | 2.7%), Law Enforcement (45 | 2.7%), and Healthcare Support (39 | 2.3%).
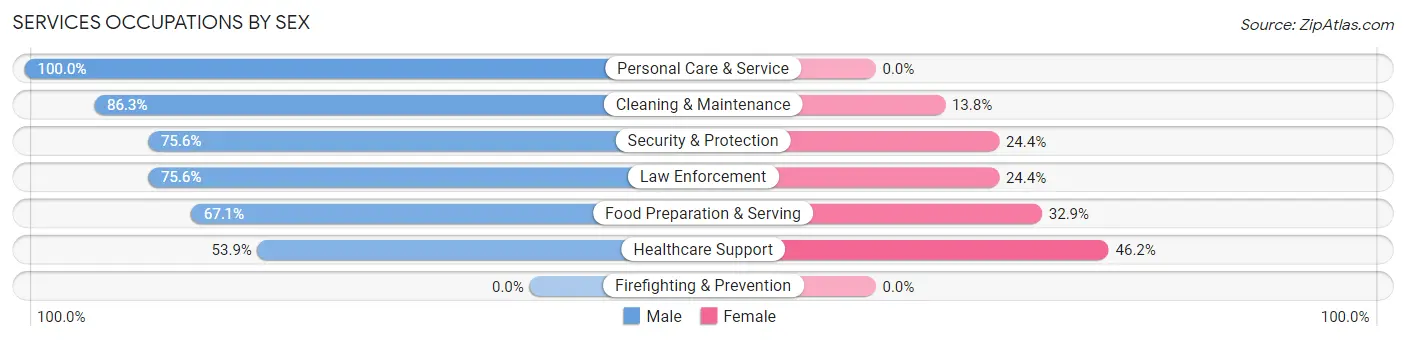
Services Occupations by Sex
Within the Services occupations in Buzzards Bay, the most male-oriented occupations are Personal Care & Service (100.0%), Cleaning & Maintenance (86.3%), and Security & Protection (75.6%), while the most female-oriented occupations are Healthcare Support (46.2%), Food Preparation & Serving (32.9%), and Security & Protection (24.4%).
| Occupation | Male | Female |
| Healthcare Support | 21 (53.8%) | 18 (46.2%) |
| Security & Protection | 34 (75.6%) | 11 (24.4%) |
| Firefighting & Prevention | 0 (0.0%) | 0 (0.0%) |
| Law Enforcement | 34 (75.6%) | 11 (24.4%) |
| Food Preparation & Serving | 110 (67.1%) | 54 (32.9%) |
| Cleaning & Maintenance | 69 (86.3%) | 11 (13.8%) |
| Personal Care & Service | 7 (100.0%) | 0 (0.0%) |
| Total (Category) | 241 (71.9%) | 94 (28.1%) |
| Total (Overall) | 951 (56.9%) | 721 (43.1%) |
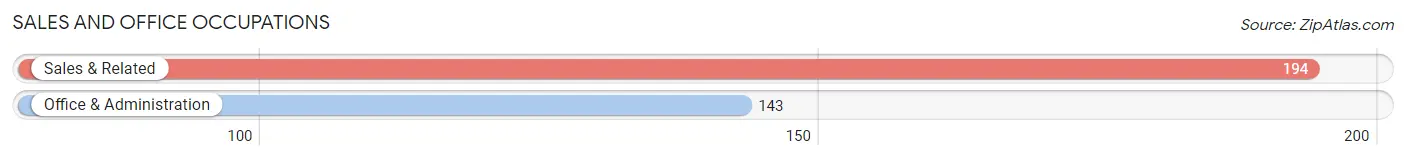
Sales and Office Occupations
The most common Sales and Office occupations in Buzzards Bay are Sales & Related (194 | 11.6%), and Office & Administration (143 | 8.6%).
Sales and Office Occupations by Sex
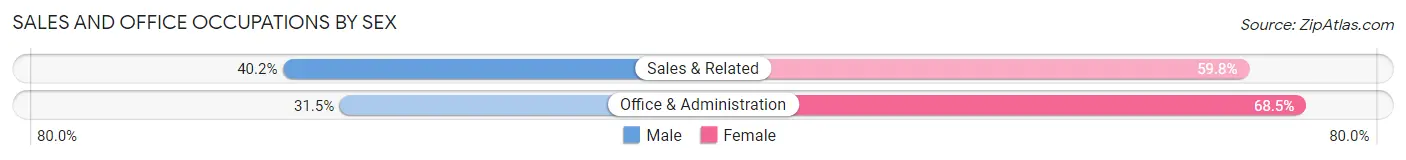
| Occupation | Male | Female |
| Sales & Related | 78 (40.2%) | 116 (59.8%) |
| Office & Administration | 45 (31.5%) | 98 (68.5%) |
| Total (Category) | 123 (36.5%) | 214 (63.5%) |
| Total (Overall) | 951 (56.9%) | 721 (43.1%) |
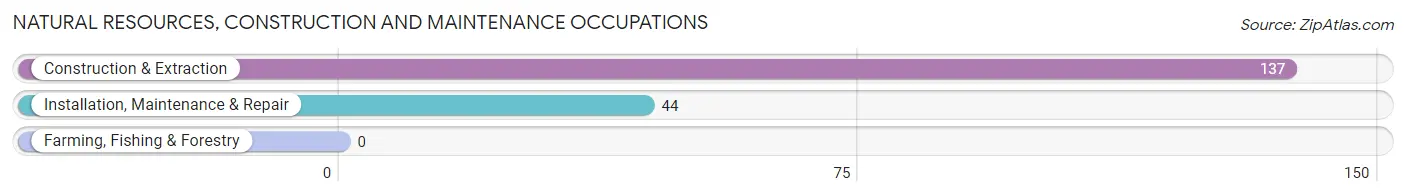
Natural Resources, Construction and Maintenance Occupations
The most common Natural Resources, Construction and Maintenance occupations in Buzzards Bay are Construction & Extraction (137 | 8.2%), and Installation, Maintenance & Repair (44 | 2.6%).
Natural Resources, Construction and Maintenance Occupations by Sex
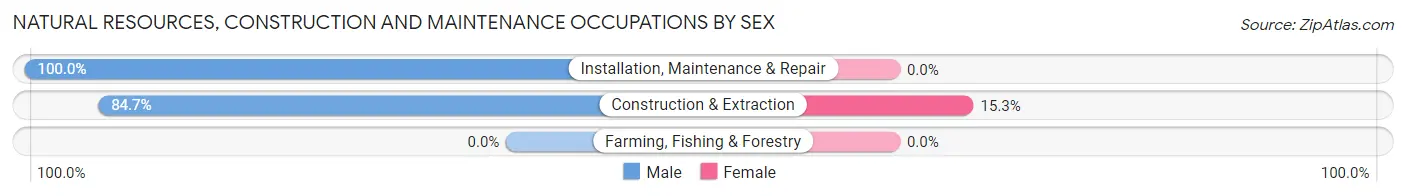
| Occupation | Male | Female |
| Farming, Fishing & Forestry | 0 (0.0%) | 0 (0.0%) |
| Construction & Extraction | 116 (84.7%) | 21 (15.3%) |
| Installation, Maintenance & Repair | 44 (100.0%) | 0 (0.0%) |
| Total (Category) | 160 (88.4%) | 21 (11.6%) |
| Total (Overall) | 951 (56.9%) | 721 (43.1%) |
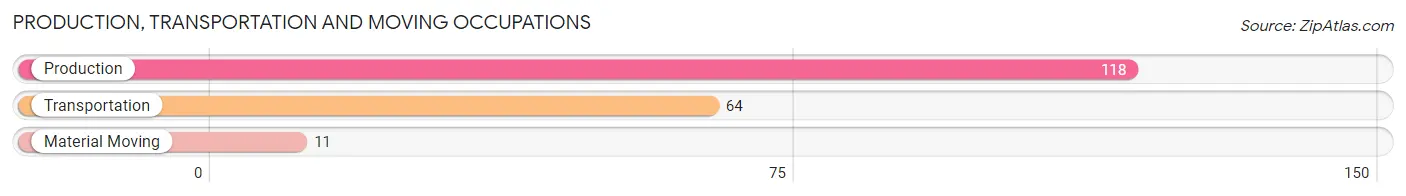
Production, Transportation and Moving Occupations
The most common Production, Transportation and Moving occupations in Buzzards Bay are Production (118 | 7.1%), Transportation (64 | 3.8%), and Material Moving (11 | 0.7%).
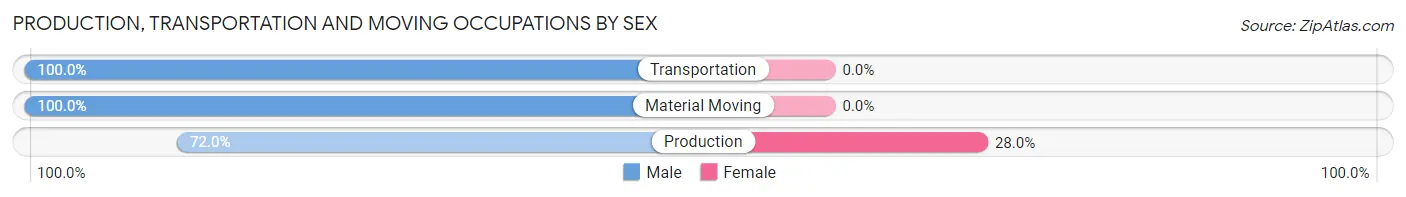
Production, Transportation and Moving Occupations by Sex
| Occupation | Male | Female |
| Production | 85 (72.0%) | 33 (28.0%) |
| Transportation | 64 (100.0%) | 0 (0.0%) |
| Material Moving | 11 (100.0%) | 0 (0.0%) |
| Total (Category) | 160 (82.9%) | 33 (17.1%) |
| Total (Overall) | 951 (56.9%) | 721 (43.1%) |
Employment Industries by Sex in Buzzards Bay
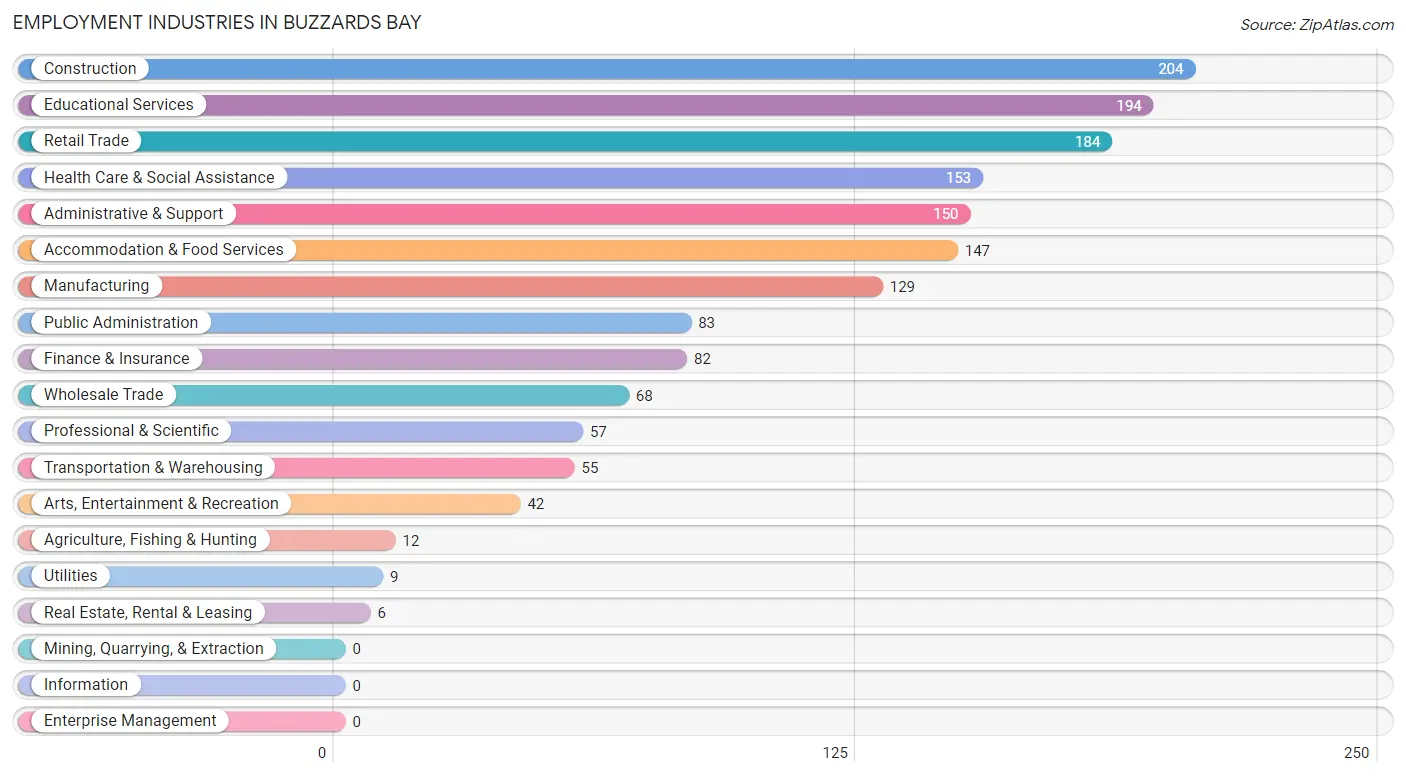
Employment Industries in Buzzards Bay
The major employment industries in Buzzards Bay include Construction (204 | 12.2%), Educational Services (194 | 11.6%), Retail Trade (184 | 11.0%), Health Care & Social Assistance (153 | 9.1%), and Administrative & Support (150 | 9.0%).
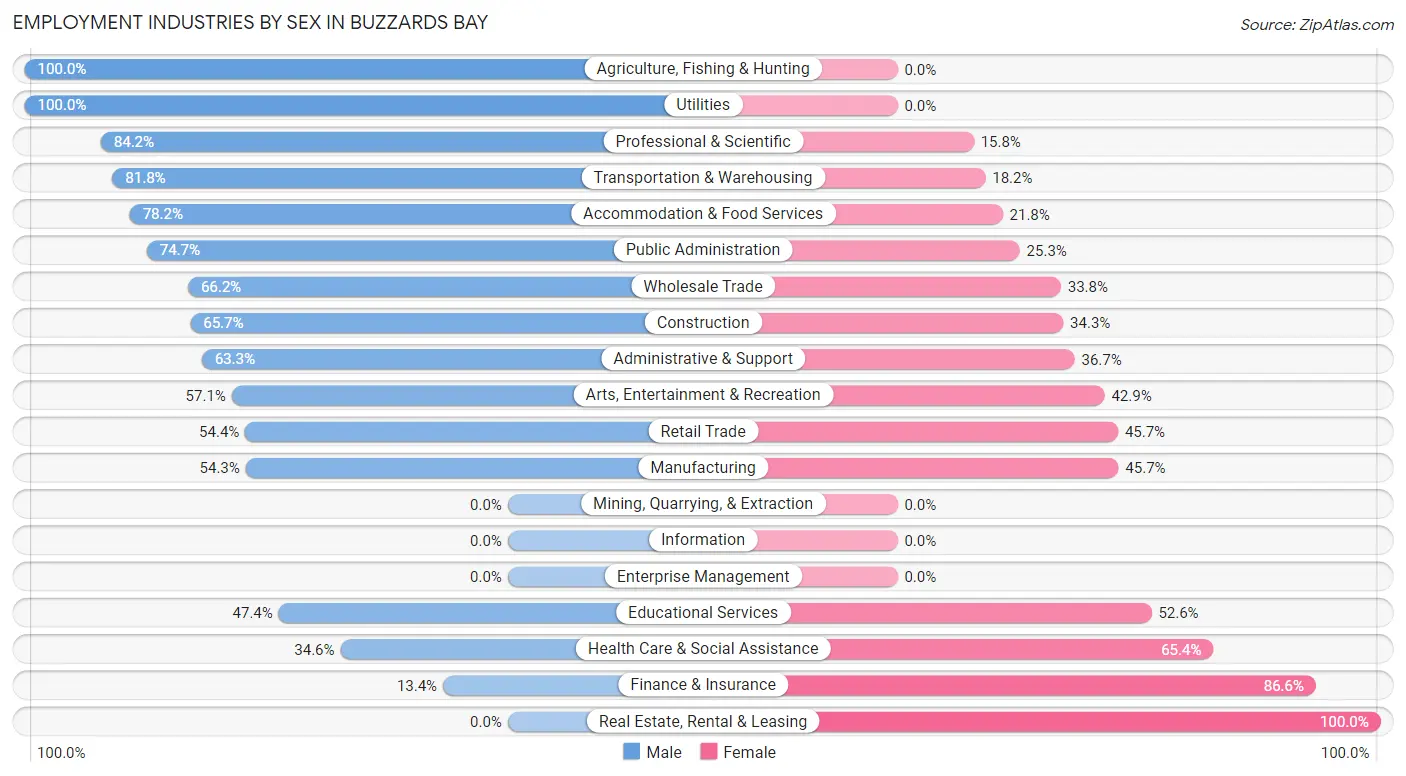
Employment Industries by Sex in Buzzards Bay
The Buzzards Bay industries that see more men than women are Agriculture, Fishing & Hunting (100.0%), Utilities (100.0%), and Professional & Scientific (84.2%), whereas the industries that tend to have a higher number of women are Real Estate, Rental & Leasing (100.0%), Finance & Insurance (86.6%), and Health Care & Social Assistance (65.4%).
| Industry | Male | Female |
| Agriculture, Fishing & Hunting | 12 (100.0%) | 0 (0.0%) |
| Mining, Quarrying, & Extraction | 0 (0.0%) | 0 (0.0%) |
| Construction | 134 (65.7%) | 70 (34.3%) |
| Manufacturing | 70 (54.3%) | 59 (45.7%) |
| Wholesale Trade | 45 (66.2%) | 23 (33.8%) |
| Retail Trade | 100 (54.3%) | 84 (45.7%) |
| Transportation & Warehousing | 45 (81.8%) | 10 (18.2%) |
| Utilities | 9 (100.0%) | 0 (0.0%) |
| Information | 0 (0.0%) | 0 (0.0%) |
| Finance & Insurance | 11 (13.4%) | 71 (86.6%) |
| Real Estate, Rental & Leasing | 0 (0.0%) | 6 (100.0%) |
| Professional & Scientific | 48 (84.2%) | 9 (15.8%) |
| Enterprise Management | 0 (0.0%) | 0 (0.0%) |
| Administrative & Support | 95 (63.3%) | 55 (36.7%) |
| Educational Services | 92 (47.4%) | 102 (52.6%) |
| Health Care & Social Assistance | 53 (34.6%) | 100 (65.4%) |
| Arts, Entertainment & Recreation | 24 (57.1%) | 18 (42.9%) |
| Accommodation & Food Services | 115 (78.2%) | 32 (21.8%) |
| Public Administration | 62 (74.7%) | 21 (25.3%) |
| Total | 951 (56.9%) | 721 (43.1%) |
Education in Buzzards Bay
School Enrollment in Buzzards Bay
The most common levels of schooling among the 480 students in Buzzards Bay are college / undergraduate (243 | 50.6%), high school (94 | 19.6%), and middle school (63 | 13.1%).
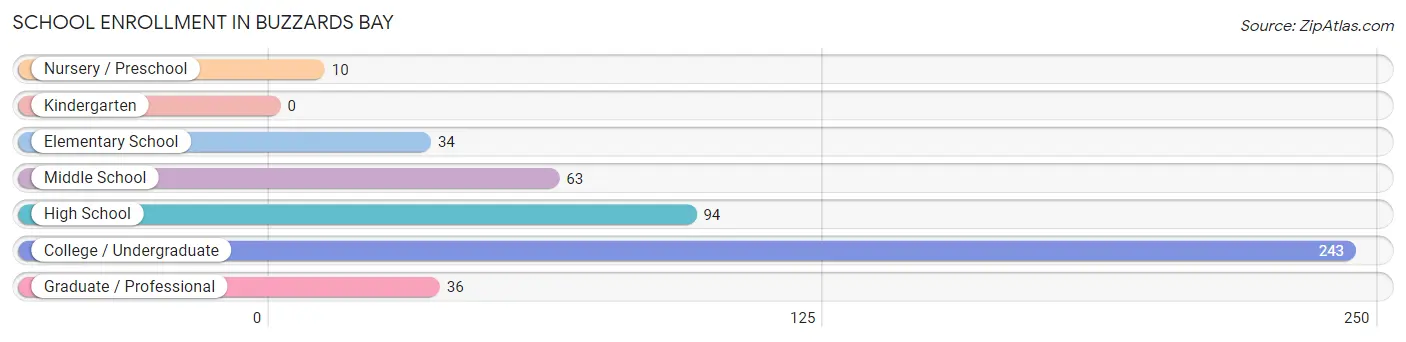
| School Level | # Students | % Students |
| Nursery / Preschool | 10 | 2.1% |
| Kindergarten | 0 | 0.0% |
| Elementary School | 34 | 7.1% |
| Middle School | 63 | 13.1% |
| High School | 94 | 19.6% |
| College / Undergraduate | 243 | 50.6% |
| Graduate / Professional | 36 | 7.5% |
| Total | 480 | 100.0% |
School Enrollment by Age by Funding Source in Buzzards Bay
Out of a total of 480 students who are enrolled in schools in Buzzards Bay, 197 (41.0%) attend a private institution, while the remaining 283 (59.0%) are enrolled in public schools. The age group of 35 years and over has the highest likelihood of being enrolled in private schools, with 20 (100.0% in the age bracket) enrolled. Conversely, the age group of 3 to 4 year olds has the lowest likelihood of being enrolled in a private school, with 10 (100.0% in the age bracket) attending a public institution.
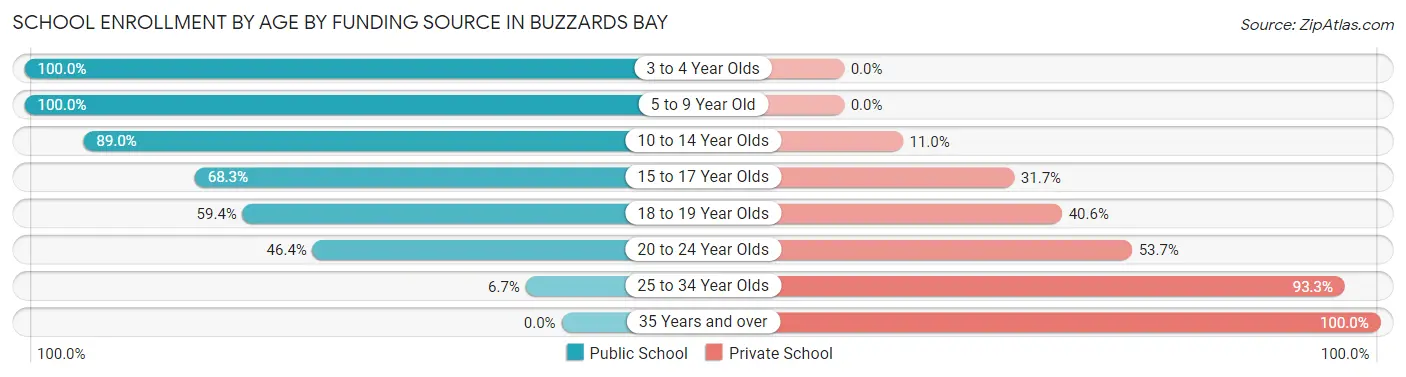
| Age Bracket | Public School | Private School |
| 3 to 4 Year Olds | 10 (100.0%) | 0 (0.0%) |
| 5 to 9 Year Old | 24 (100.0%) | 0 (0.0%) |
| 10 to 14 Year Olds | 65 (89.0%) | 8 (11.0%) |
| 15 to 17 Year Olds | 56 (68.3%) | 26 (31.7%) |
| 18 to 19 Year Olds | 38 (59.4%) | 26 (40.6%) |
| 20 to 24 Year Olds | 89 (46.4%) | 103 (53.6%) |
| 25 to 34 Year Olds | 1 (6.7%) | 14 (93.3%) |
| 35 Years and over | 0 (0.0%) | 20 (100.0%) |
| Total | 283 (59.0%) | 197 (41.0%) |
Educational Attainment by Field of Study in Buzzards Bay
Business (151 | 19.8%), education (139 | 18.2%), science & technology (73 | 9.6%), psychology (71 | 9.3%), and bio, nature & agricultural (68 | 8.9%) are the most common fields of study among 763 individuals in Buzzards Bay who have obtained a bachelor's degree or higher.
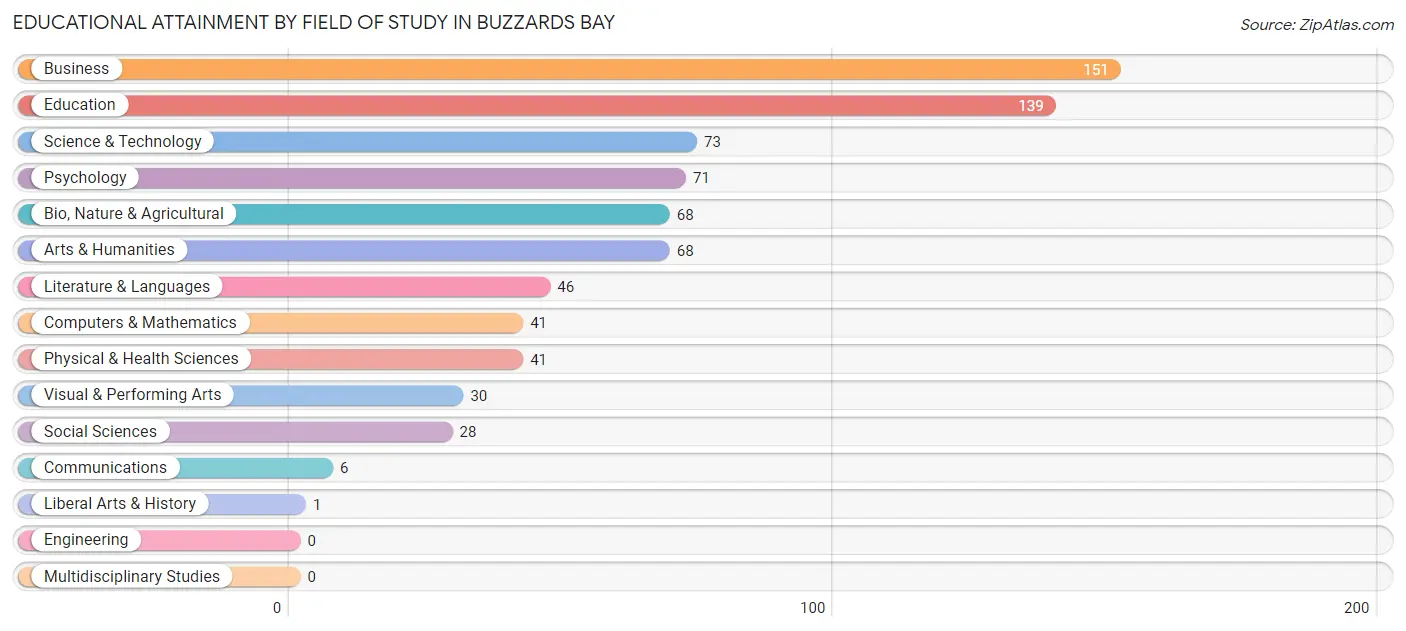
| Field of Study | # Graduates | % Graduates |
| Computers & Mathematics | 41 | 5.4% |
| Bio, Nature & Agricultural | 68 | 8.9% |
| Physical & Health Sciences | 41 | 5.4% |
| Psychology | 71 | 9.3% |
| Social Sciences | 28 | 3.7% |
| Engineering | 0 | 0.0% |
| Multidisciplinary Studies | 0 | 0.0% |
| Science & Technology | 73 | 9.6% |
| Business | 151 | 19.8% |
| Education | 139 | 18.2% |
| Literature & Languages | 46 | 6.0% |
| Liberal Arts & History | 1 | 0.1% |
| Visual & Performing Arts | 30 | 3.9% |
| Communications | 6 | 0.8% |
| Arts & Humanities | 68 | 8.9% |
| Total | 763 | 100.0% |
Transportation & Commute in Buzzards Bay
Vehicle Availability by Sex in Buzzards Bay
The most prevalent vehicle ownership categories in Buzzards Bay are males with 2 vehicles (276, accounting for 31.9%) and females with 2 vehicles (257, making up 38.3%).
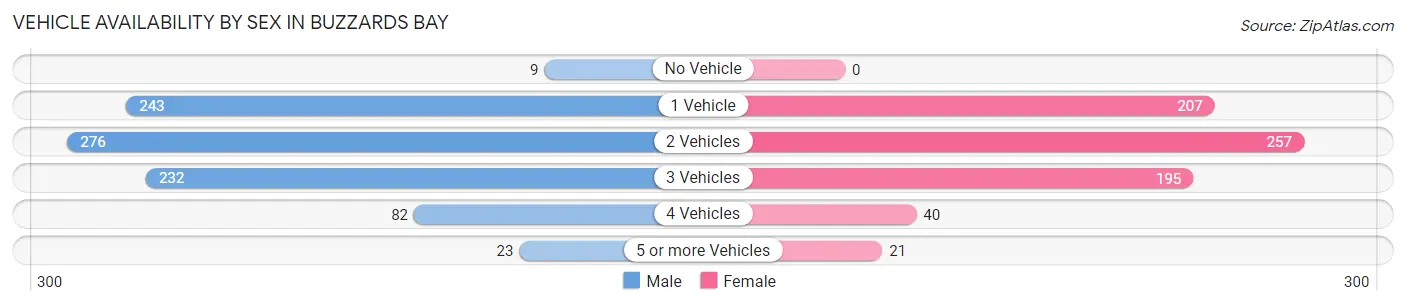
| Vehicles Available | Male | Female |
| No Vehicle | 9 (1.0%) | 0 (0.0%) |
| 1 Vehicle | 243 (28.1%) | 207 (28.7%) |
| 2 Vehicles | 276 (31.9%) | 257 (35.7%) |
| 3 Vehicles | 232 (26.8%) | 195 (27.1%) |
| 4 Vehicles | 82 (9.5%) | 40 (5.6%) |
| 5 or more Vehicles | 23 (2.7%) | 21 (2.9%) |
| Total | 865 (100.0%) | 720 (100.0%) |
Commute Time in Buzzards Bay
The most frequently occuring commute durations in Buzzards Bay are 15 to 19 minutes (273 commuters, 17.8%), 60 to 89 minutes (170 commuters, 11.1%), and 45 to 59 minutes (168 commuters, 11.0%).
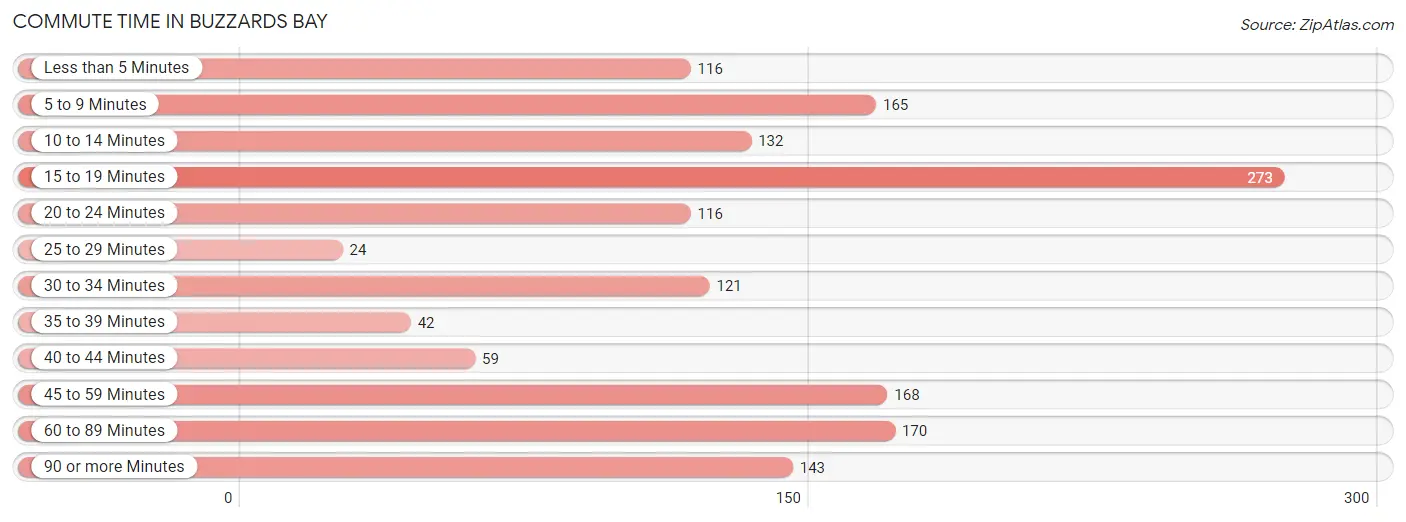
| Commute Time | # Commuters | % Commuters |
| Less than 5 Minutes | 116 | 7.6% |
| 5 to 9 Minutes | 165 | 10.8% |
| 10 to 14 Minutes | 132 | 8.6% |
| 15 to 19 Minutes | 273 | 17.8% |
| 20 to 24 Minutes | 116 | 7.6% |
| 25 to 29 Minutes | 24 | 1.6% |
| 30 to 34 Minutes | 121 | 7.9% |
| 35 to 39 Minutes | 42 | 2.8% |
| 40 to 44 Minutes | 59 | 3.9% |
| 45 to 59 Minutes | 168 | 11.0% |
| 60 to 89 Minutes | 170 | 11.1% |
| 90 or more Minutes | 143 | 9.3% |
Commute Time by Sex in Buzzards Bay
The most common commute times in Buzzards Bay are 15 to 19 minutes (219 commuters, 25.2%) for males and 5 to 9 minutes (112 commuters, 17.0%) for females.
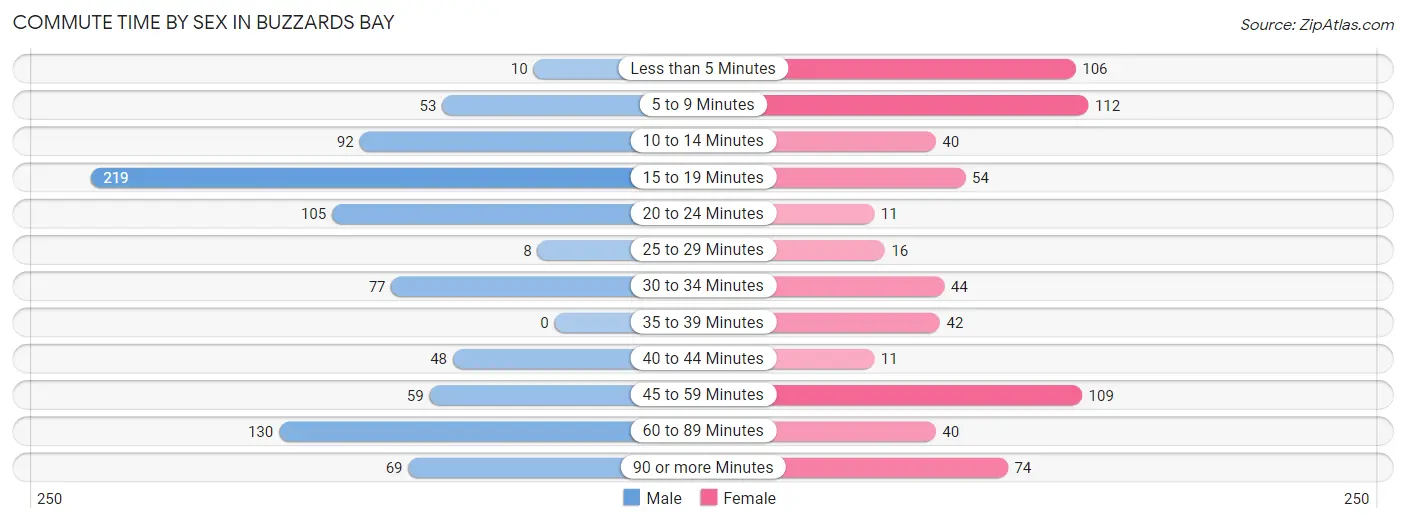
| Commute Time | Male | Female |
| Less than 5 Minutes | 10 (1.1%) | 106 (16.1%) |
| 5 to 9 Minutes | 53 (6.1%) | 112 (17.0%) |
| 10 to 14 Minutes | 92 (10.6%) | 40 (6.1%) |
| 15 to 19 Minutes | 219 (25.2%) | 54 (8.2%) |
| 20 to 24 Minutes | 105 (12.1%) | 11 (1.7%) |
| 25 to 29 Minutes | 8 (0.9%) | 16 (2.4%) |
| 30 to 34 Minutes | 77 (8.8%) | 44 (6.7%) |
| 35 to 39 Minutes | 0 (0.0%) | 42 (6.4%) |
| 40 to 44 Minutes | 48 (5.5%) | 11 (1.7%) |
| 45 to 59 Minutes | 59 (6.8%) | 109 (16.5%) |
| 60 to 89 Minutes | 130 (14.9%) | 40 (6.1%) |
| 90 or more Minutes | 69 (7.9%) | 74 (11.2%) |
Time of Departure to Work by Sex in Buzzards Bay
The most frequent times of departure to work in Buzzards Bay are 6:00 AM to 6:29 AM (150, 17.2%) for males and 6:00 AM to 6:29 AM (145, 22.0%) for females.
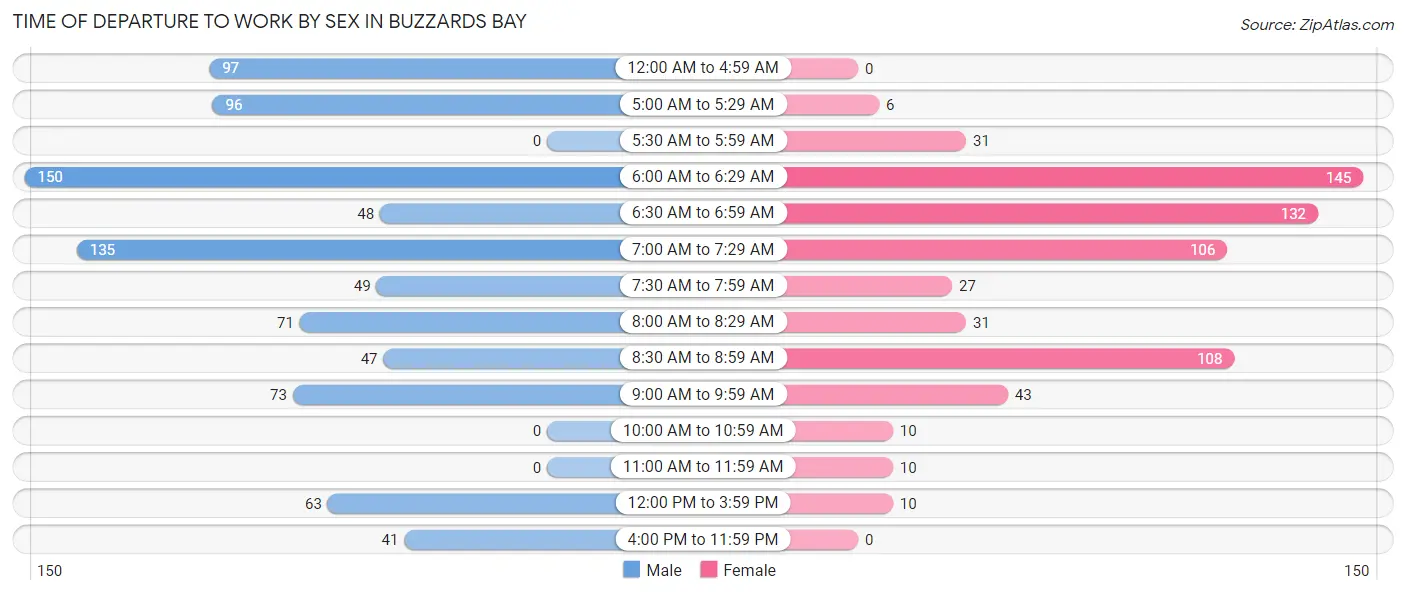
| Time of Departure | Male | Female |
| 12:00 AM to 4:59 AM | 97 (11.2%) | 0 (0.0%) |
| 5:00 AM to 5:29 AM | 96 (11.0%) | 6 (0.9%) |
| 5:30 AM to 5:59 AM | 0 (0.0%) | 31 (4.7%) |
| 6:00 AM to 6:29 AM | 150 (17.2%) | 145 (22.0%) |
| 6:30 AM to 6:59 AM | 48 (5.5%) | 132 (20.0%) |
| 7:00 AM to 7:29 AM | 135 (15.5%) | 106 (16.1%) |
| 7:30 AM to 7:59 AM | 49 (5.6%) | 27 (4.1%) |
| 8:00 AM to 8:29 AM | 71 (8.2%) | 31 (4.7%) |
| 8:30 AM to 8:59 AM | 47 (5.4%) | 108 (16.4%) |
| 9:00 AM to 9:59 AM | 73 (8.4%) | 43 (6.5%) |
| 10:00 AM to 10:59 AM | 0 (0.0%) | 10 (1.5%) |
| 11:00 AM to 11:59 AM | 0 (0.0%) | 10 (1.5%) |
| 12:00 PM to 3:59 PM | 63 (7.2%) | 10 (1.5%) |
| 4:00 PM to 11:59 PM | 41 (4.7%) | 0 (0.0%) |
| Total | 870 (100.0%) | 659 (100.0%) |
Housing Occupancy in Buzzards Bay
Occupancy by Ownership in Buzzards Bay
Of the total 1,415 dwellings in Buzzards Bay, owner-occupied units account for 1,045 (73.9%), while renter-occupied units make up 370 (26.2%).
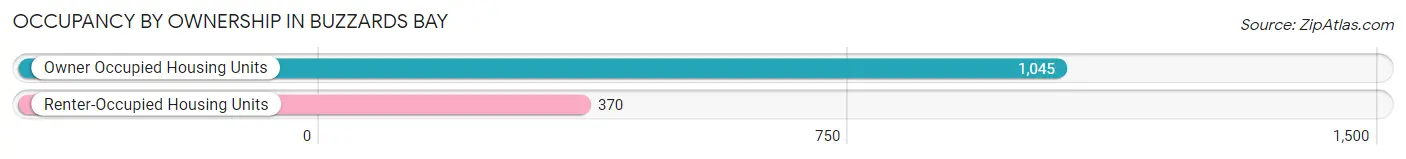
| Occupancy | # Housing Units | % Housing Units |
| Owner Occupied Housing Units | 1,045 | 73.9% |
| Renter-Occupied Housing Units | 370 | 26.2% |
| Total Occupied Housing Units | 1,415 | 100.0% |
Occupancy by Household Size in Buzzards Bay
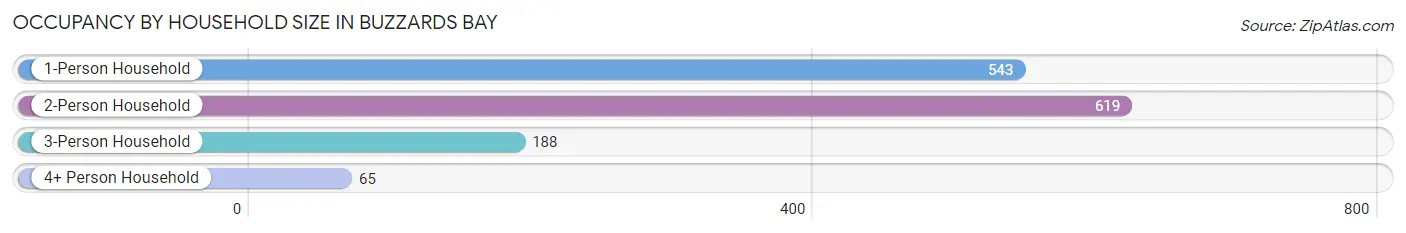
| Household Size | # Housing Units | % Housing Units |
| 1-Person Household | 543 | 38.4% |
| 2-Person Household | 619 | 43.8% |
| 3-Person Household | 188 | 13.3% |
| 4+ Person Household | 65 | 4.6% |
| Total Housing Units | 1,415 | 100.0% |
Occupancy by Ownership by Household Size in Buzzards Bay
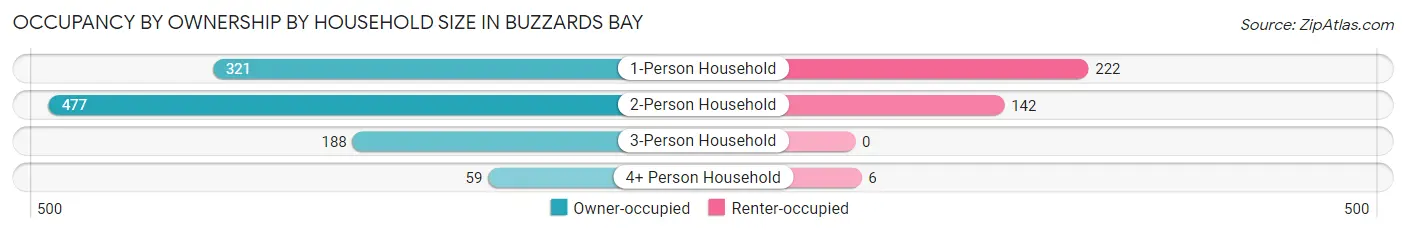
| Household Size | Owner-occupied | Renter-occupied |
| 1-Person Household | 321 (59.1%) | 222 (40.9%) |
| 2-Person Household | 477 (77.1%) | 142 (22.9%) |
| 3-Person Household | 188 (100.0%) | 0 (0.0%) |
| 4+ Person Household | 59 (90.8%) | 6 (9.2%) |
| Total Housing Units | 1,045 (73.9%) | 370 (26.2%) |
Occupancy by Educational Attainment in Buzzards Bay
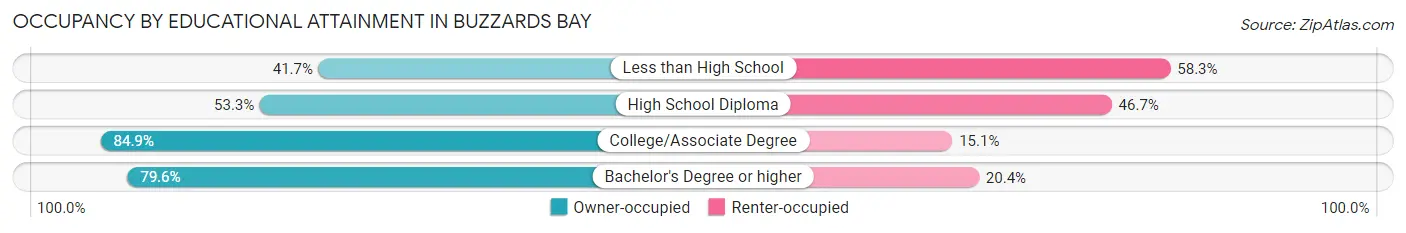
| Household Size | Owner-occupied | Renter-occupied |
| Less than High School | 25 (41.7%) | 35 (58.3%) |
| High School Diploma | 177 (53.3%) | 155 (46.7%) |
| College/Associate Degree | 456 (84.9%) | 81 (15.1%) |
| Bachelor's Degree or higher | 387 (79.6%) | 99 (20.4%) |
Occupancy by Age of Householder in Buzzards Bay
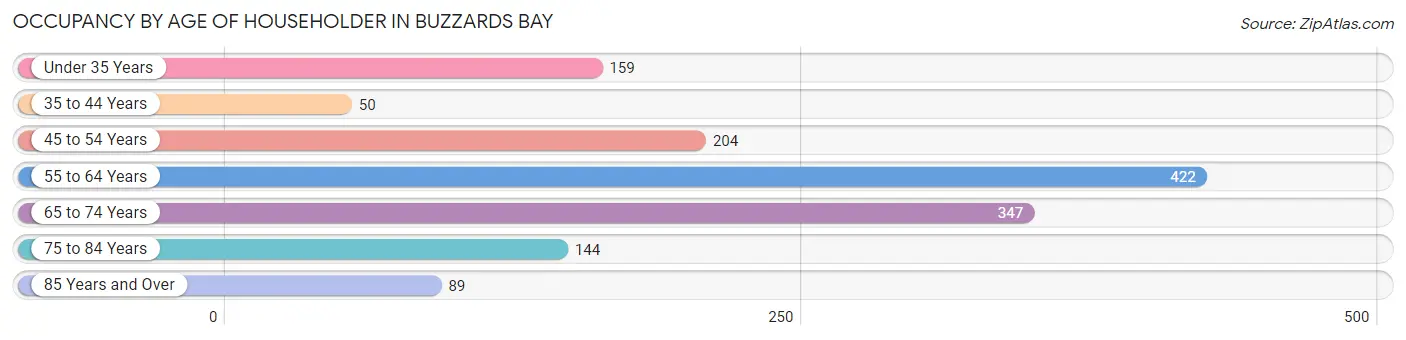
| Age Bracket | # Households | % Households |
| Under 35 Years | 159 | 11.2% |
| 35 to 44 Years | 50 | 3.5% |
| 45 to 54 Years | 204 | 14.4% |
| 55 to 64 Years | 422 | 29.8% |
| 65 to 74 Years | 347 | 24.5% |
| 75 to 84 Years | 144 | 10.2% |
| 85 Years and Over | 89 | 6.3% |
| Total | 1,415 | 100.0% |
Housing Finances in Buzzards Bay
Median Income by Occupancy in Buzzards Bay
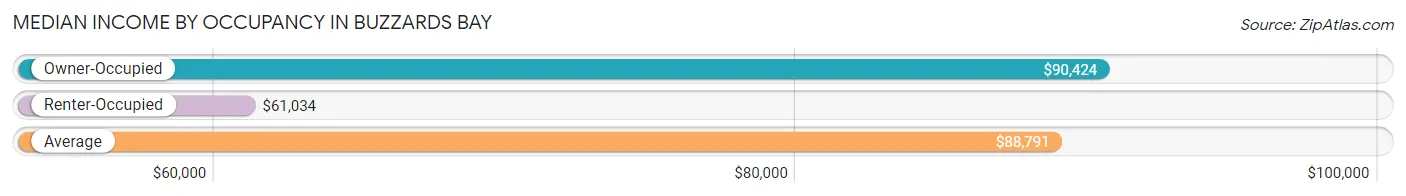
| Occupancy Type | # Households | Median Income |
| Owner-Occupied | 1,045 (73.9%) | $90,424 |
| Renter-Occupied | 370 (26.2%) | $61,034 |
| Average | 1,415 (100.0%) | $88,791 |
Occupancy by Householder Income Bracket in Buzzards Bay
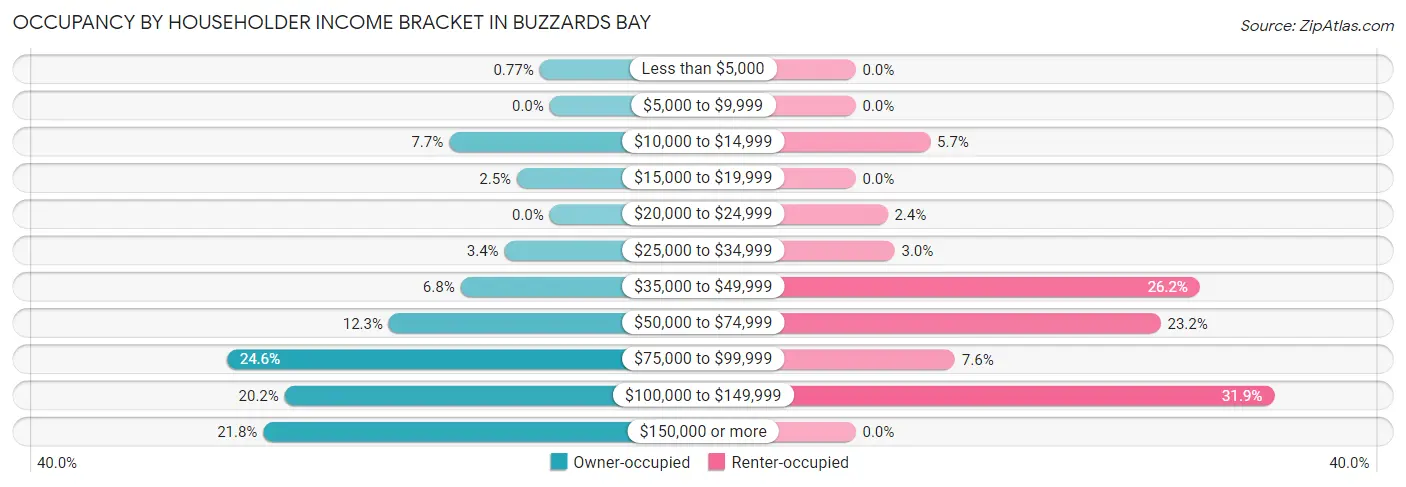
| Income Bracket | Owner-occupied | Renter-occupied |
| Less than $5,000 | 8 (0.8%) | 0 (0.0%) |
| $5,000 to $9,999 | 0 (0.0%) | 0 (0.0%) |
| $10,000 to $14,999 | 80 (7.7%) | 21 (5.7%) |
| $15,000 to $19,999 | 26 (2.5%) | 0 (0.0%) |
| $20,000 to $24,999 | 0 (0.0%) | 9 (2.4%) |
| $25,000 to $34,999 | 36 (3.4%) | 11 (3.0%) |
| $35,000 to $49,999 | 71 (6.8%) | 97 (26.2%) |
| $50,000 to $74,999 | 128 (12.2%) | 86 (23.2%) |
| $75,000 to $99,999 | 257 (24.6%) | 28 (7.6%) |
| $100,000 to $149,999 | 211 (20.2%) | 118 (31.9%) |
| $150,000 or more | 228 (21.8%) | 0 (0.0%) |
| Total | 1,045 (100.0%) | 370 (100.0%) |
Monthly Housing Cost Tiers in Buzzards Bay
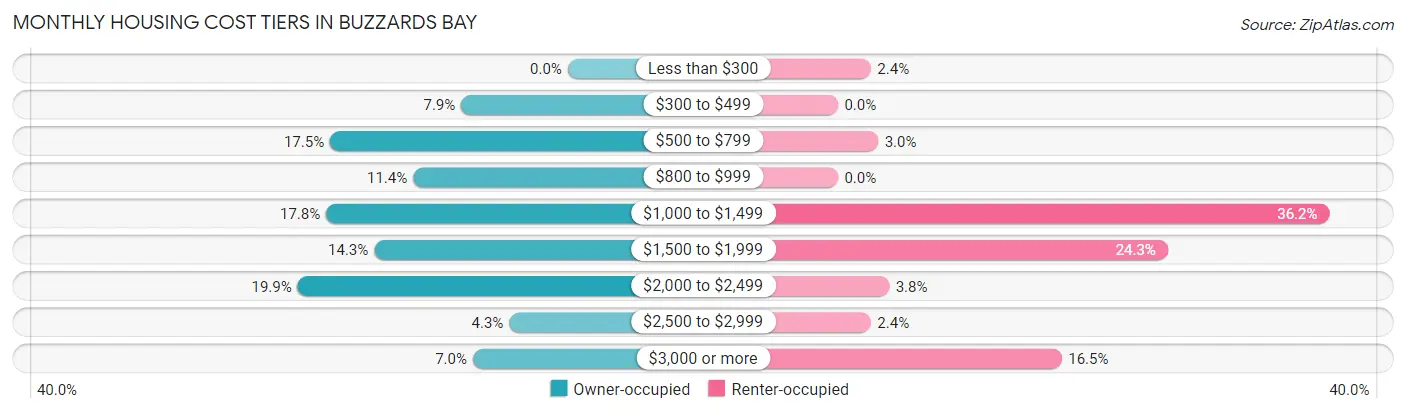
| Monthly Cost | Owner-occupied | Renter-occupied |
| Less than $300 | 0 (0.0%) | 9 (2.4%) |
| $300 to $499 | 82 (7.9%) | 0 (0.0%) |
| $500 to $799 | 183 (17.5%) | 11 (3.0%) |
| $800 to $999 | 119 (11.4%) | 0 (0.0%) |
| $1,000 to $1,499 | 186 (17.8%) | 134 (36.2%) |
| $1,500 to $1,999 | 149 (14.3%) | 90 (24.3%) |
| $2,000 to $2,499 | 208 (19.9%) | 14 (3.8%) |
| $2,500 to $2,999 | 45 (4.3%) | 9 (2.4%) |
| $3,000 or more | 73 (7.0%) | 61 (16.5%) |
| Total | 1,045 (100.0%) | 370 (100.0%) |
Physical Housing Characteristics in Buzzards Bay
Housing Structures in Buzzards Bay
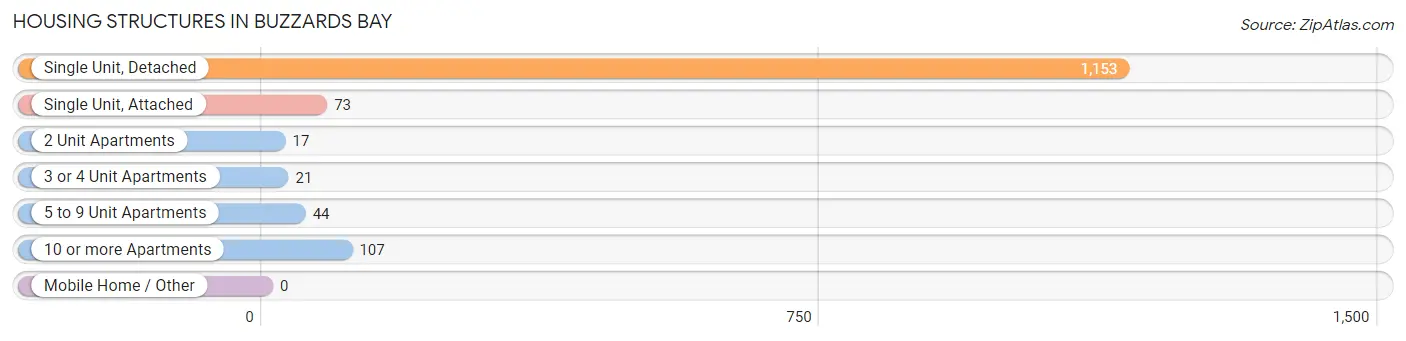
| Structure Type | # Housing Units | % Housing Units |
| Single Unit, Detached | 1,153 | 81.5% |
| Single Unit, Attached | 73 | 5.2% |
| 2 Unit Apartments | 17 | 1.2% |
| 3 or 4 Unit Apartments | 21 | 1.5% |
| 5 to 9 Unit Apartments | 44 | 3.1% |
| 10 or more Apartments | 107 | 7.6% |
| Mobile Home / Other | 0 | 0.0% |
| Total | 1,415 | 100.0% |
Housing Structures by Occupancy in Buzzards Bay
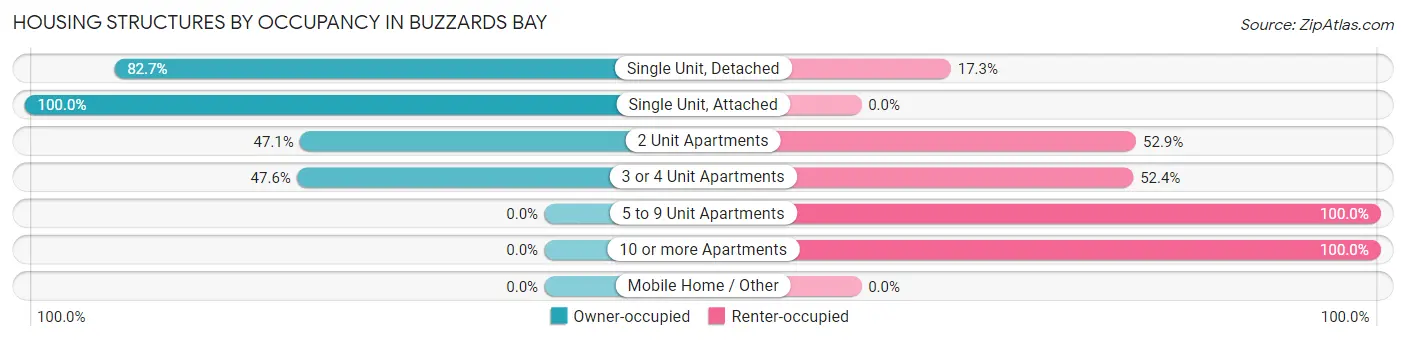
| Structure Type | Owner-occupied | Renter-occupied |
| Single Unit, Detached | 954 (82.7%) | 199 (17.3%) |
| Single Unit, Attached | 73 (100.0%) | 0 (0.0%) |
| 2 Unit Apartments | 8 (47.1%) | 9 (52.9%) |
| 3 or 4 Unit Apartments | 10 (47.6%) | 11 (52.4%) |
| 5 to 9 Unit Apartments | 0 (0.0%) | 44 (100.0%) |
| 10 or more Apartments | 0 (0.0%) | 107 (100.0%) |
| Mobile Home / Other | 0 (0.0%) | 0 (0.0%) |
| Total | 1,045 (73.9%) | 370 (26.2%) |
Housing Structures by Number of Rooms in Buzzards Bay
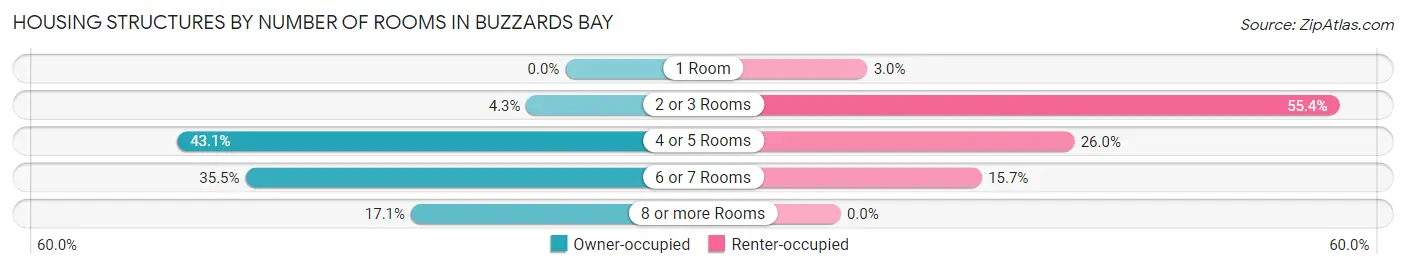
| Number of Rooms | Owner-occupied | Renter-occupied |
| 1 Room | 0 (0.0%) | 11 (3.0%) |
| 2 or 3 Rooms | 45 (4.3%) | 205 (55.4%) |
| 4 or 5 Rooms | 450 (43.1%) | 96 (26.0%) |
| 6 or 7 Rooms | 371 (35.5%) | 58 (15.7%) |
| 8 or more Rooms | 179 (17.1%) | 0 (0.0%) |
| Total | 1,045 (100.0%) | 370 (100.0%) |
Housing Structure by Heating Type in Buzzards Bay
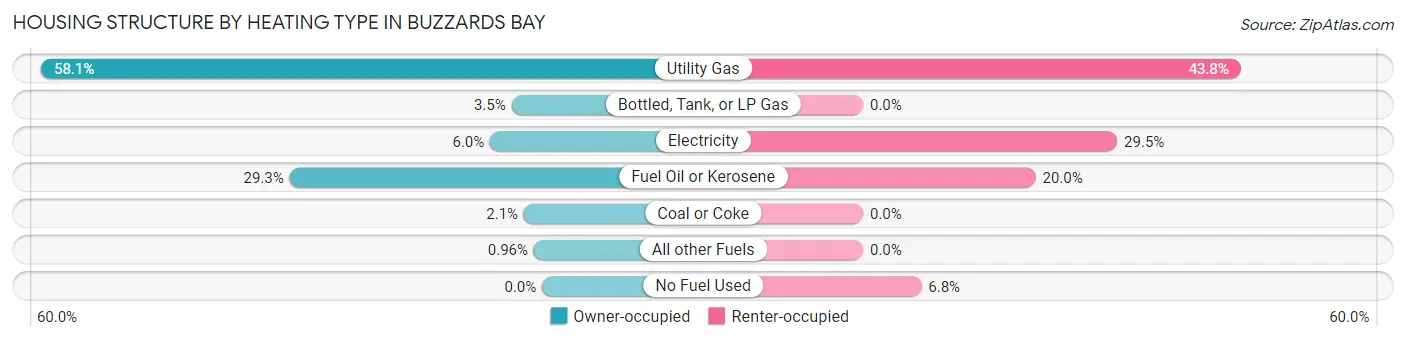
| Heating Type | Owner-occupied | Renter-occupied |
| Utility Gas | 607 (58.1%) | 162 (43.8%) |
| Bottled, Tank, or LP Gas | 37 (3.5%) | 0 (0.0%) |
| Electricity | 63 (6.0%) | 109 (29.5%) |
| Fuel Oil or Kerosene | 306 (29.3%) | 74 (20.0%) |
| Coal or Coke | 22 (2.1%) | 0 (0.0%) |
| All other Fuels | 10 (1.0%) | 0 (0.0%) |
| No Fuel Used | 0 (0.0%) | 25 (6.8%) |
| Total | 1,045 (100.0%) | 370 (100.0%) |
Household Vehicle Usage in Buzzards Bay
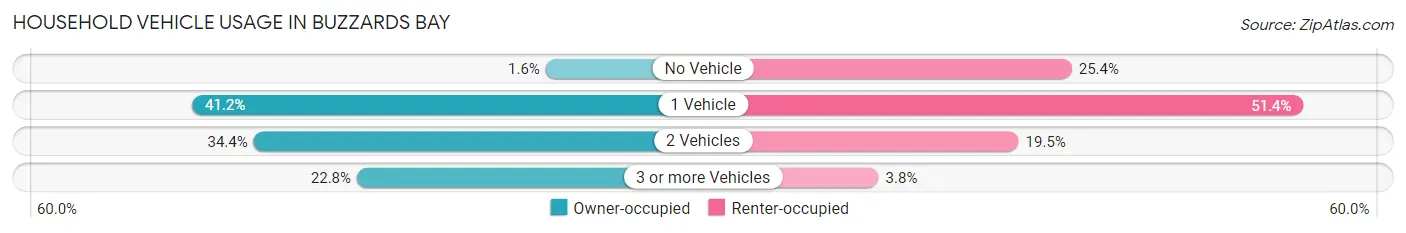
| Vehicles per Household | Owner-occupied | Renter-occupied |
| No Vehicle | 17 (1.6%) | 94 (25.4%) |
| 1 Vehicle | 431 (41.2%) | 190 (51.3%) |
| 2 Vehicles | 359 (34.4%) | 72 (19.5%) |
| 3 or more Vehicles | 238 (22.8%) | 14 (3.8%) |
| Total | 1,045 (100.0%) | 370 (100.0%) |
Real Estate & Mortgages in Buzzards Bay
Real Estate and Mortgage Overview in Buzzards Bay
| Characteristic | Without Mortgage | With Mortgage |
| Housing Units | 464 | 581 |
| Median Property Value | $390,200 | $427,900 |
| Median Household Income | $90,208 | $136 |
| Monthly Housing Costs | $742 | $64 |
| Real Estate Taxes | $3,988 | $11 |
Property Value by Mortgage Status in Buzzards Bay
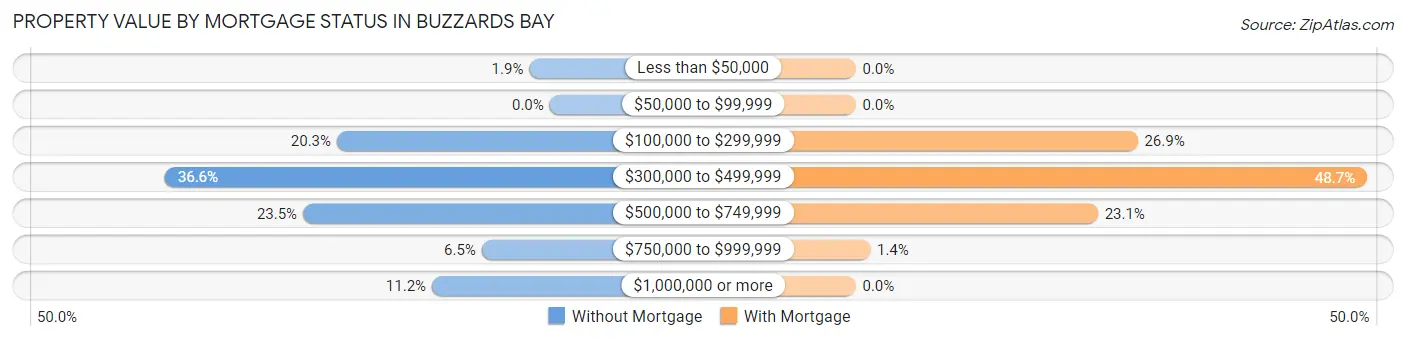
| Property Value | Without Mortgage | With Mortgage |
| Less than $50,000 | 9 (1.9%) | 0 (0.0%) |
| $50,000 to $99,999 | 0 (0.0%) | 0 (0.0%) |
| $100,000 to $299,999 | 94 (20.3%) | 156 (26.9%) |
| $300,000 to $499,999 | 170 (36.6%) | 283 (48.7%) |
| $500,000 to $749,999 | 109 (23.5%) | 134 (23.1%) |
| $750,000 to $999,999 | 30 (6.5%) | 8 (1.4%) |
| $1,000,000 or more | 52 (11.2%) | 0 (0.0%) |
| Total | 464 (100.0%) | 581 (100.0%) |
Household Income by Mortgage Status in Buzzards Bay
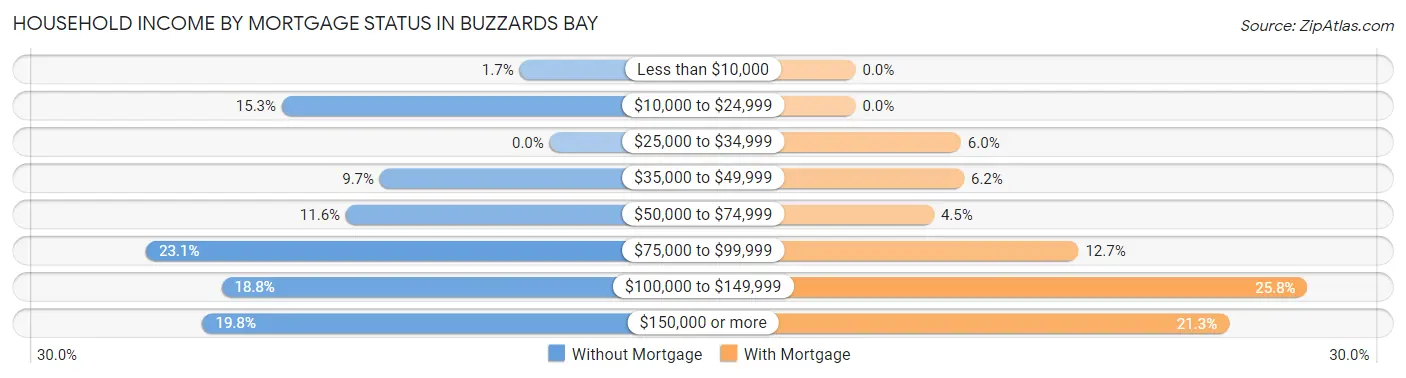
| Household Income | Without Mortgage | With Mortgage |
| Less than $10,000 | 8 (1.7%) | 0 (0.0%) |
| $10,000 to $24,999 | 71 (15.3%) | 0 (0.0%) |
| $25,000 to $34,999 | 0 (0.0%) | 35 (6.0%) |
| $35,000 to $49,999 | 45 (9.7%) | 36 (6.2%) |
| $50,000 to $74,999 | 54 (11.6%) | 26 (4.5%) |
| $75,000 to $99,999 | 107 (23.1%) | 74 (12.7%) |
| $100,000 to $149,999 | 87 (18.8%) | 150 (25.8%) |
| $150,000 or more | 92 (19.8%) | 124 (21.3%) |
| Total | 464 (100.0%) | 581 (100.0%) |
Property Value to Household Income Ratio in Buzzards Bay
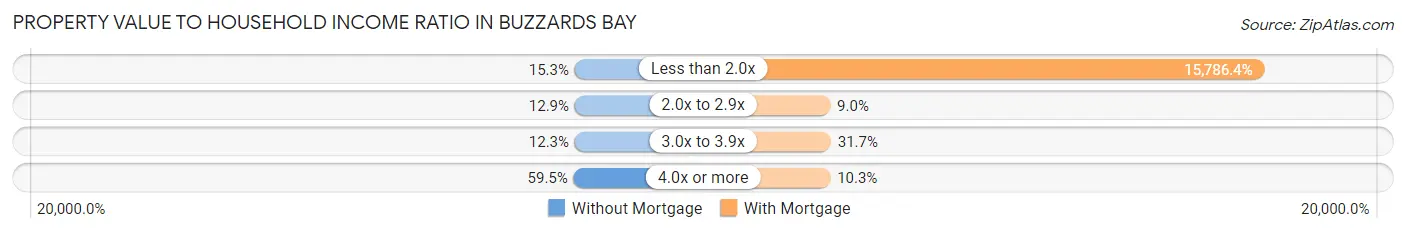
| Value-to-Income Ratio | Without Mortgage | With Mortgage |
| Less than 2.0x | 71 (15.3%) | 91,719 (15,786.4%) |
| 2.0x to 2.9x | 60 (12.9%) | 52 (8.9%) |
| 3.0x to 3.9x | 57 (12.3%) | 184 (31.7%) |
| 4.0x or more | 276 (59.5%) | 60 (10.3%) |
| Total | 464 (100.0%) | 581 (100.0%) |
Real Estate Taxes by Mortgage Status in Buzzards Bay
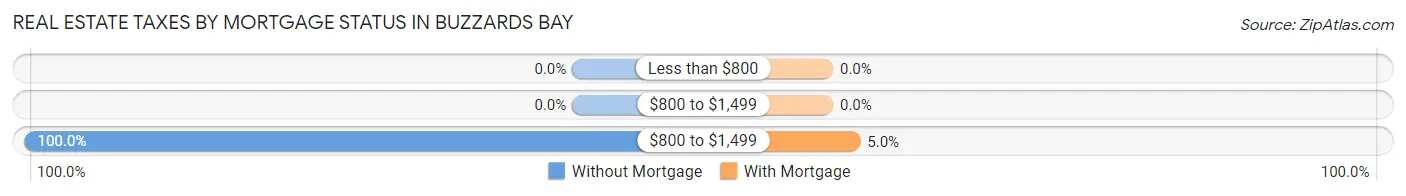
| Property Taxes | Without Mortgage | With Mortgage |
| Less than $800 | 0 (0.0%) | 0 (0.0%) |
| $800 to $1,499 | 0 (0.0%) | 0 (0.0%) |
| $800 to $1,499 | 464 (100.0%) | 29 (5.0%) |
| Total | 464 (100.0%) | 581 (100.0%) |
Health & Disability in Buzzards Bay
Health Insurance Coverage by Age in Buzzards Bay
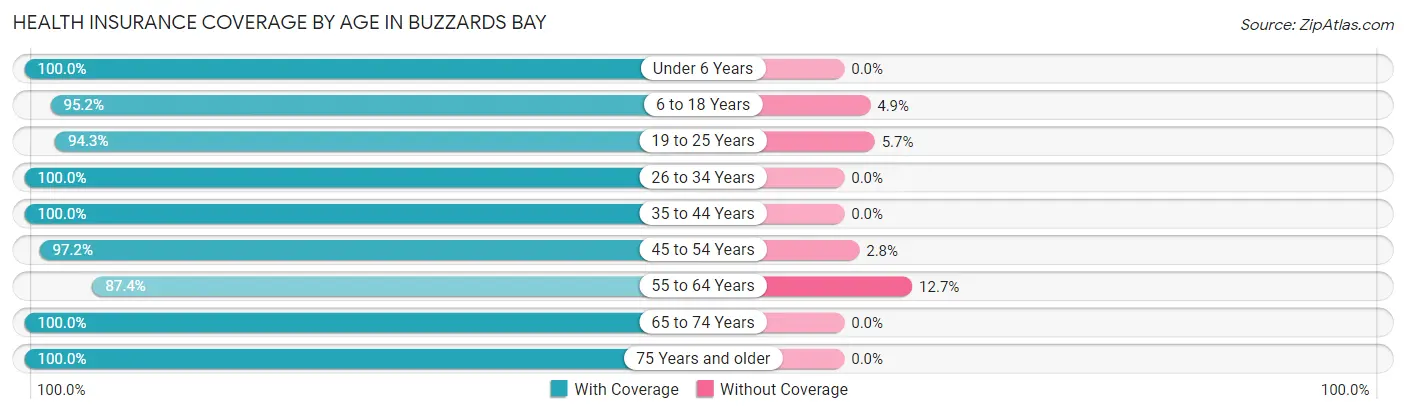
| Age Bracket | With Coverage | Without Coverage |
| Under 6 Years | 68 (100.0%) | 0 (0.0%) |
| 6 to 18 Years | 196 (95.2%) | 10 (4.9%) |
| 19 to 25 Years | 349 (94.3%) | 21 (5.7%) |
| 26 to 34 Years | 209 (100.0%) | 0 (0.0%) |
| 35 to 44 Years | 124 (100.0%) | 0 (0.0%) |
| 45 to 54 Years | 347 (97.2%) | 10 (2.8%) |
| 55 to 64 Years | 566 (87.4%) | 82 (12.7%) |
| 65 to 74 Years | 570 (100.0%) | 0 (0.0%) |
| 75 Years and older | 327 (100.0%) | 0 (0.0%) |
| Total | 2,756 (95.7%) | 123 (4.3%) |
Health Insurance Coverage by Citizenship Status in Buzzards Bay
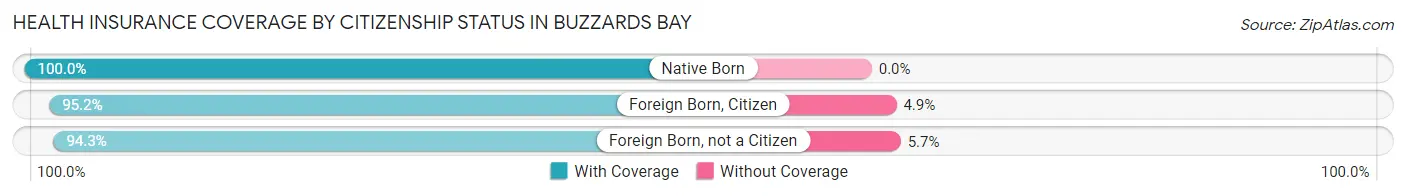
| Citizenship Status | With Coverage | Without Coverage |
| Native Born | 68 (100.0%) | 0 (0.0%) |
| Foreign Born, Citizen | 196 (95.2%) | 10 (4.9%) |
| Foreign Born, not a Citizen | 349 (94.3%) | 21 (5.7%) |
Health Insurance Coverage by Household Income in Buzzards Bay
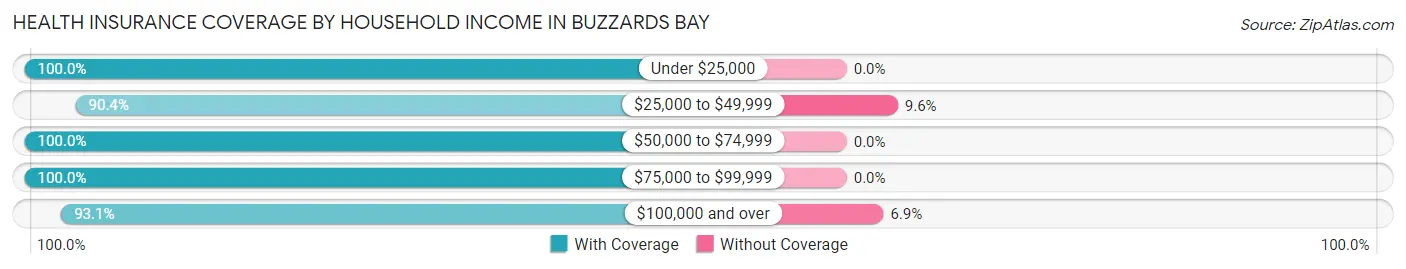
| Household Income | With Coverage | Without Coverage |
| Under $25,000 | 210 (100.0%) | 0 (0.0%) |
| $25,000 to $49,999 | 265 (90.4%) | 28 (9.6%) |
| $50,000 to $74,999 | 442 (100.0%) | 0 (0.0%) |
| $75,000 to $99,999 | 449 (100.0%) | 0 (0.0%) |
| $100,000 and over | 1,193 (93.1%) | 88 (6.9%) |
Public vs Private Health Insurance Coverage by Age in Buzzards Bay
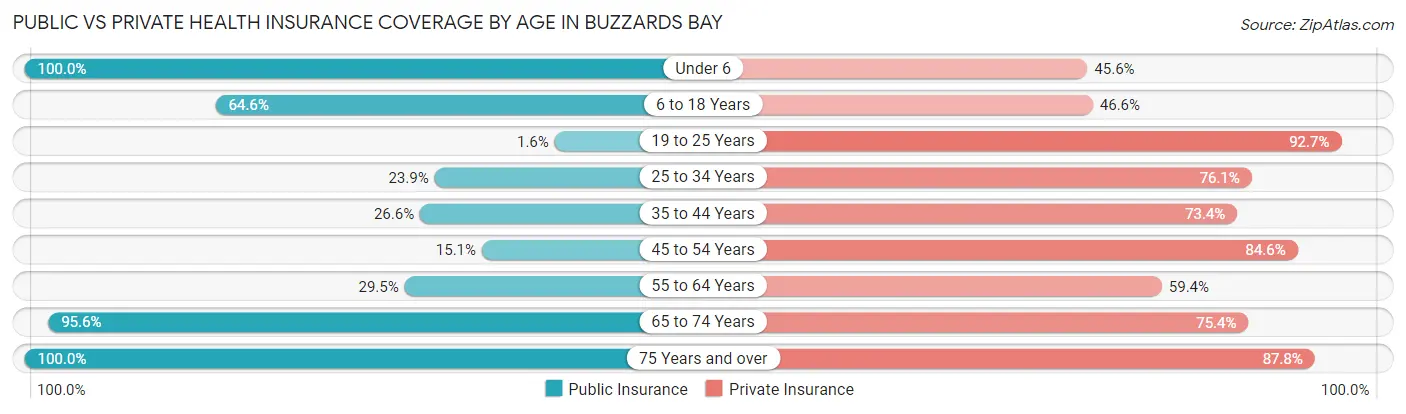
| Age Bracket | Public Insurance | Private Insurance |
| Under 6 | 68 (100.0%) | 31 (45.6%) |
| 6 to 18 Years | 133 (64.6%) | 96 (46.6%) |
| 19 to 25 Years | 6 (1.6%) | 343 (92.7%) |
| 25 to 34 Years | 50 (23.9%) | 159 (76.1%) |
| 35 to 44 Years | 33 (26.6%) | 91 (73.4%) |
| 45 to 54 Years | 54 (15.1%) | 302 (84.6%) |
| 55 to 64 Years | 191 (29.5%) | 385 (59.4%) |
| 65 to 74 Years | 545 (95.6%) | 430 (75.4%) |
| 75 Years and over | 327 (100.0%) | 287 (87.8%) |
| Total | 1,407 (48.9%) | 2,124 (73.8%) |
Disability Status by Sex by Age in Buzzards Bay
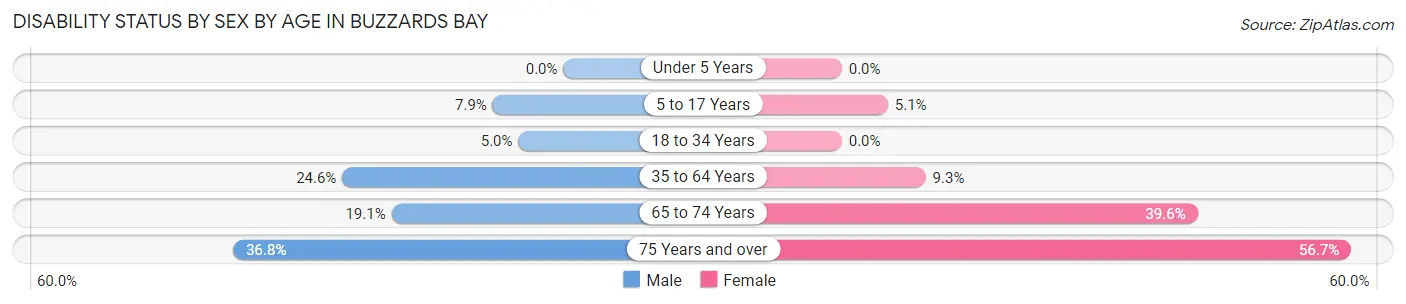
| Age Bracket | Male | Female |
| Under 5 Years | 0 (0.0%) | 0 (0.0%) |
| 5 to 17 Years | 7 (7.9%) | 6 (5.1%) |
| 18 to 34 Years | 24 (5.0%) | 0 (0.0%) |
| 35 to 64 Years | 133 (24.6%) | 55 (9.3%) |
| 65 to 74 Years | 40 (19.1%) | 143 (39.6%) |
| 75 Years and over | 71 (36.8%) | 76 (56.7%) |
Disability Class by Sex by Age in Buzzards Bay
Disability Class: Hearing Difficulty
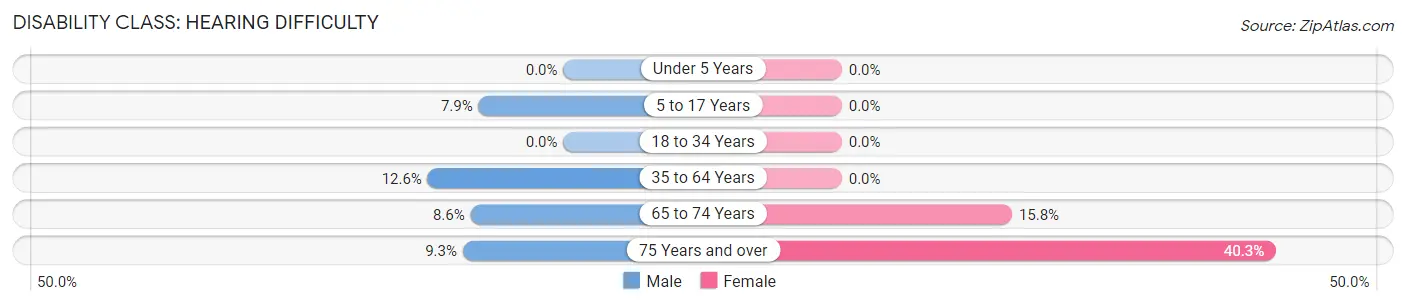
| Age Bracket | Male | Female |
| Under 5 Years | 0 (0.0%) | 0 (0.0%) |
| 5 to 17 Years | 7 (7.9%) | 0 (0.0%) |
| 18 to 34 Years | 0 (0.0%) | 0 (0.0%) |
| 35 to 64 Years | 68 (12.6%) | 0 (0.0%) |
| 65 to 74 Years | 18 (8.6%) | 57 (15.8%) |
| 75 Years and over | 18 (9.3%) | 54 (40.3%) |
Disability Class: Vision Difficulty
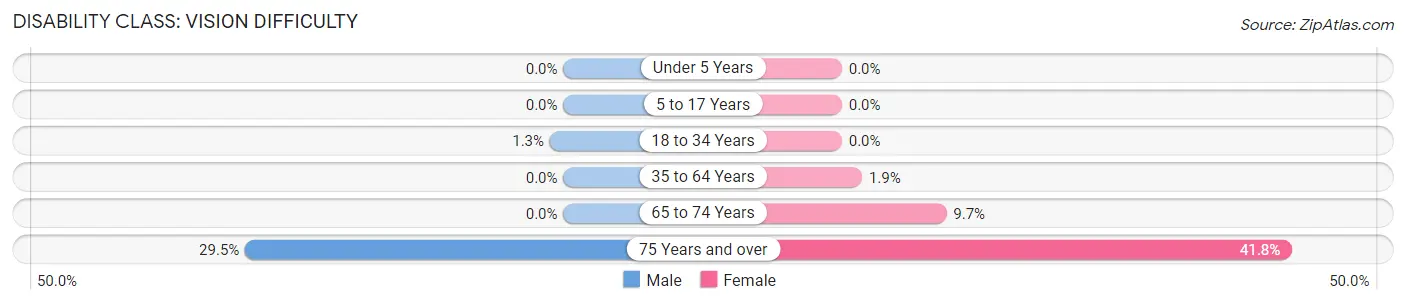
| Age Bracket | Male | Female |
| Under 5 Years | 0 (0.0%) | 0 (0.0%) |
| 5 to 17 Years | 0 (0.0%) | 0 (0.0%) |
| 18 to 34 Years | 6 (1.3%) | 0 (0.0%) |
| 35 to 64 Years | 0 (0.0%) | 11 (1.9%) |
| 65 to 74 Years | 0 (0.0%) | 35 (9.7%) |
| 75 Years and over | 57 (29.5%) | 56 (41.8%) |
Disability Class: Cognitive Difficulty
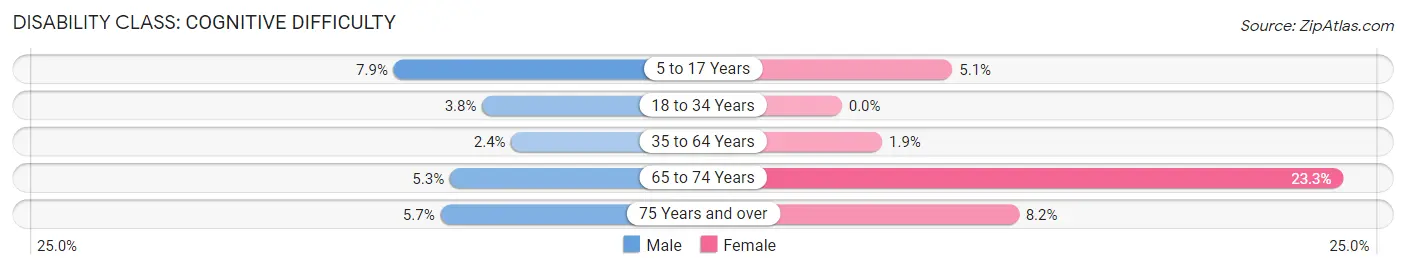
| Age Bracket | Male | Female |
| 5 to 17 Years | 7 (7.9%) | 6 (5.1%) |
| 18 to 34 Years | 18 (3.8%) | 0 (0.0%) |
| 35 to 64 Years | 13 (2.4%) | 11 (1.9%) |
| 65 to 74 Years | 11 (5.3%) | 84 (23.3%) |
| 75 Years and over | 11 (5.7%) | 11 (8.2%) |
Disability Class: Ambulatory Difficulty
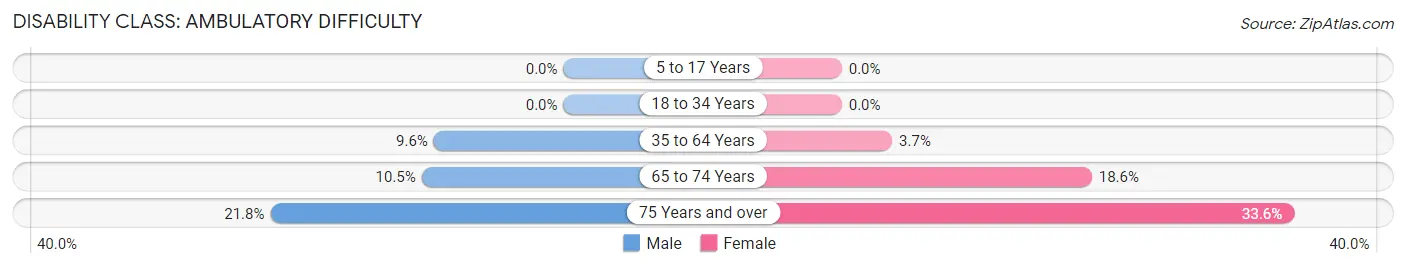
| Age Bracket | Male | Female |
| 5 to 17 Years | 0 (0.0%) | 0 (0.0%) |
| 18 to 34 Years | 0 (0.0%) | 0 (0.0%) |
| 35 to 64 Years | 52 (9.6%) | 22 (3.7%) |
| 65 to 74 Years | 22 (10.5%) | 67 (18.6%) |
| 75 Years and over | 42 (21.8%) | 45 (33.6%) |
Disability Class: Self-Care Difficulty
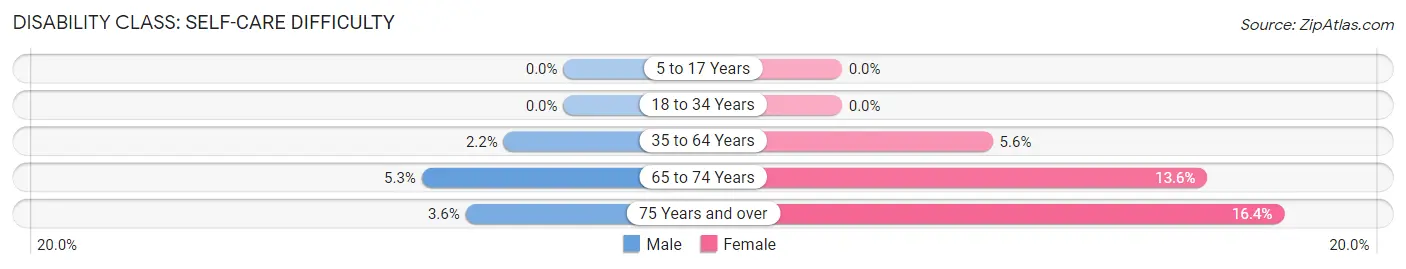
| Age Bracket | Male | Female |
| 5 to 17 Years | 0 (0.0%) | 0 (0.0%) |
| 18 to 34 Years | 0 (0.0%) | 0 (0.0%) |
| 35 to 64 Years | 12 (2.2%) | 33 (5.6%) |
| 65 to 74 Years | 11 (5.3%) | 49 (13.6%) |
| 75 Years and over | 7 (3.6%) | 22 (16.4%) |
Technology Access in Buzzards Bay
Computing Device Access in Buzzards Bay
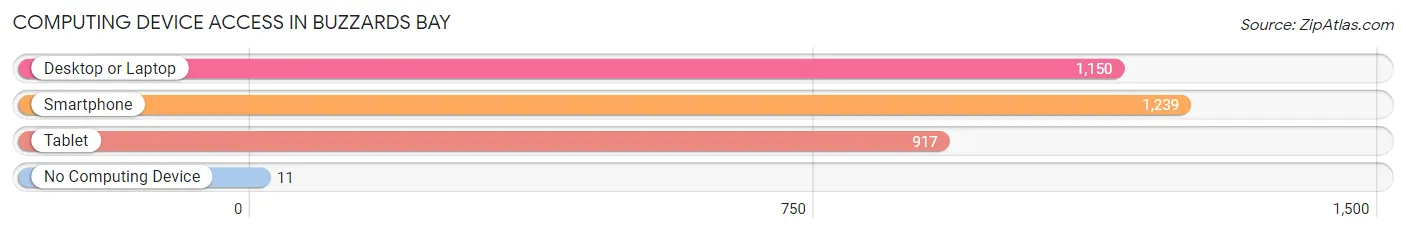
| Device Type | # Households | % Households |
| Desktop or Laptop | 1,150 | 81.3% |
| Smartphone | 1,239 | 87.6% |
| Tablet | 917 | 64.8% |
| No Computing Device | 11 | 0.8% |
| Total | 1,415 | 100.0% |
Internet Access in Buzzards Bay
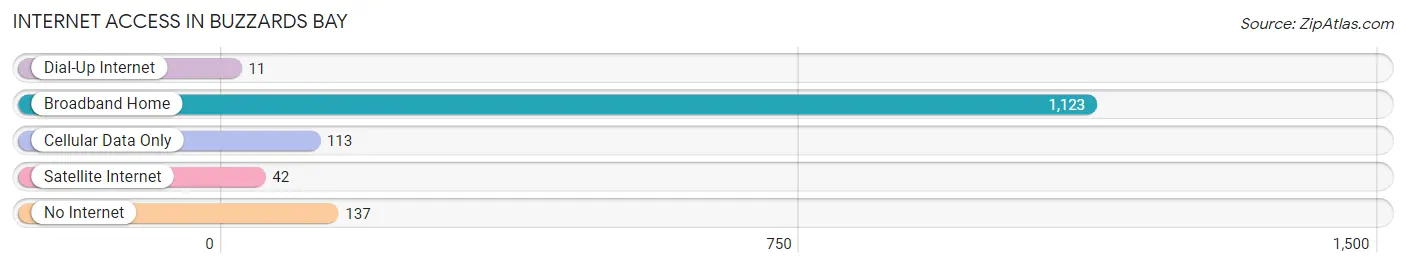
| Internet Type | # Households | % Households |
| Dial-Up Internet | 11 | 0.8% |
| Broadband Home | 1,123 | 79.4% |
| Cellular Data Only | 113 | 8.0% |
| Satellite Internet | 42 | 3.0% |
| No Internet | 137 | 9.7% |
| Total | 1,415 | 100.0% |
Buzzards Bay Summary
History
The area now known as Buzzards Bay, Massachusetts has a long and varied history. The area was first inhabited by the Wampanoag people, who lived in the area for thousands of years before the arrival of Europeans. The first Europeans to settle in the area were the English, who arrived in the 1620s. The area was initially part of the Plymouth Colony, and was later incorporated into the town of Bourne in 1640.
The area was an important port for the whaling industry in the 18th and 19th centuries, and was home to several whaling ships. The town of Bourne was officially incorporated in 1884, and the area was renamed Buzzards Bay in 1895.
The area was an important port during World War II, and was home to several military bases. The area was also home to a large number of summer resorts, which attracted tourists from all over the country.
Geography
Buzzards Bay is located in southeastern Massachusetts, on the western side of Cape Cod Bay. The area is bordered by the towns of Bourne, Falmouth, Wareham, and Sandwich. The area is approximately 25 miles long and 10 miles wide, and is home to several islands, including Martha's Vineyard and Nantucket.
The area is mostly flat, with some hills and valleys. The highest point in the area is the summit of Mount Wachusett, which is located in the town of Wareham. The area is home to several rivers, including the Cape Cod Canal, the Wareham River, and the Weweantic River.
Economy
The economy of Buzzards Bay is largely based on tourism and fishing. The area is home to several popular tourist attractions, including the Cape Cod Canal, the Martha's Vineyard ferry, and the Nantucket ferry. The area is also home to several marinas, which attract boaters from all over the country.
The area is also home to several commercial fishing operations, which harvest a variety of species, including cod, haddock, flounder, and lobster. The area is also home to several seafood processing plants, which process and package seafood for sale in local markets and restaurants.
Demographics
As of the 2010 census, the population of Buzzards Bay was 15,868. The population is largely white (93.3%), with small percentages of African Americans (2.2%), Asians (1.3%), and Hispanics (1.2%). The median household income in the area is $60,945, and the median home value is $346,400. The area is home to several colleges and universities, including the University of Massachusetts Dartmouth and Cape Cod Community College.
Common Questions
What is Per Capita Income in Buzzards Bay?
Per Capita income in Buzzards Bay is $48,675.
What is the Median Family Income in Buzzards Bay?
Median Family Income in Buzzards Bay is $88,068.
What is the Median Household income in Buzzards Bay?
Median Household Income in Buzzards Bay is $88,791.
What is Income or Wage Gap in Buzzards Bay?
Income or Wage Gap in Buzzards Bay is 29.6%.
Women in Buzzards Bay earn 70.4 cents for every dollar earned by a man.
What is Inequality or Gini Index in Buzzards Bay?
Inequality or Gini Index in Buzzards Bay is 0.37.
What is the Total Population of Buzzards Bay?
Total Population of Buzzards Bay is 2,993.
What is the Total Male Population of Buzzards Bay?
Total Male Population of Buzzards Bay is 1,522.
What is the Total Female Population of Buzzards Bay?
Total Female Population of Buzzards Bay is 1,471.
What is the Ratio of Males per 100 Females in Buzzards Bay?
There are 103.47 Males per 100 Females in Buzzards Bay.
What is the Ratio of Females per 100 Males in Buzzards Bay?
There are 96.65 Females per 100 Males in Buzzards Bay.
What is the Median Population Age in Buzzards Bay?
Median Population Age in Buzzards Bay is 57.2 Years.
What is the Average Family Size in Buzzards Bay
Average Family Size in Buzzards Bay is 2.4 People.
What is the Average Household Size in Buzzards Bay
Average Household Size in Buzzards Bay is 1.9 People.
How Large is the Labor Force in Buzzards Bay?
There are 1,752 People in the Labor Forcein in Buzzards Bay.
What is the Percentage of People in the Labor Force in Buzzards Bay?
62.5% of People are in the Labor Force in Buzzards Bay.
What is the Unemployment Rate in Buzzards Bay?
Unemployment Rate in Buzzards Bay is 2.4%.