Taunton, MA Map & Demographics
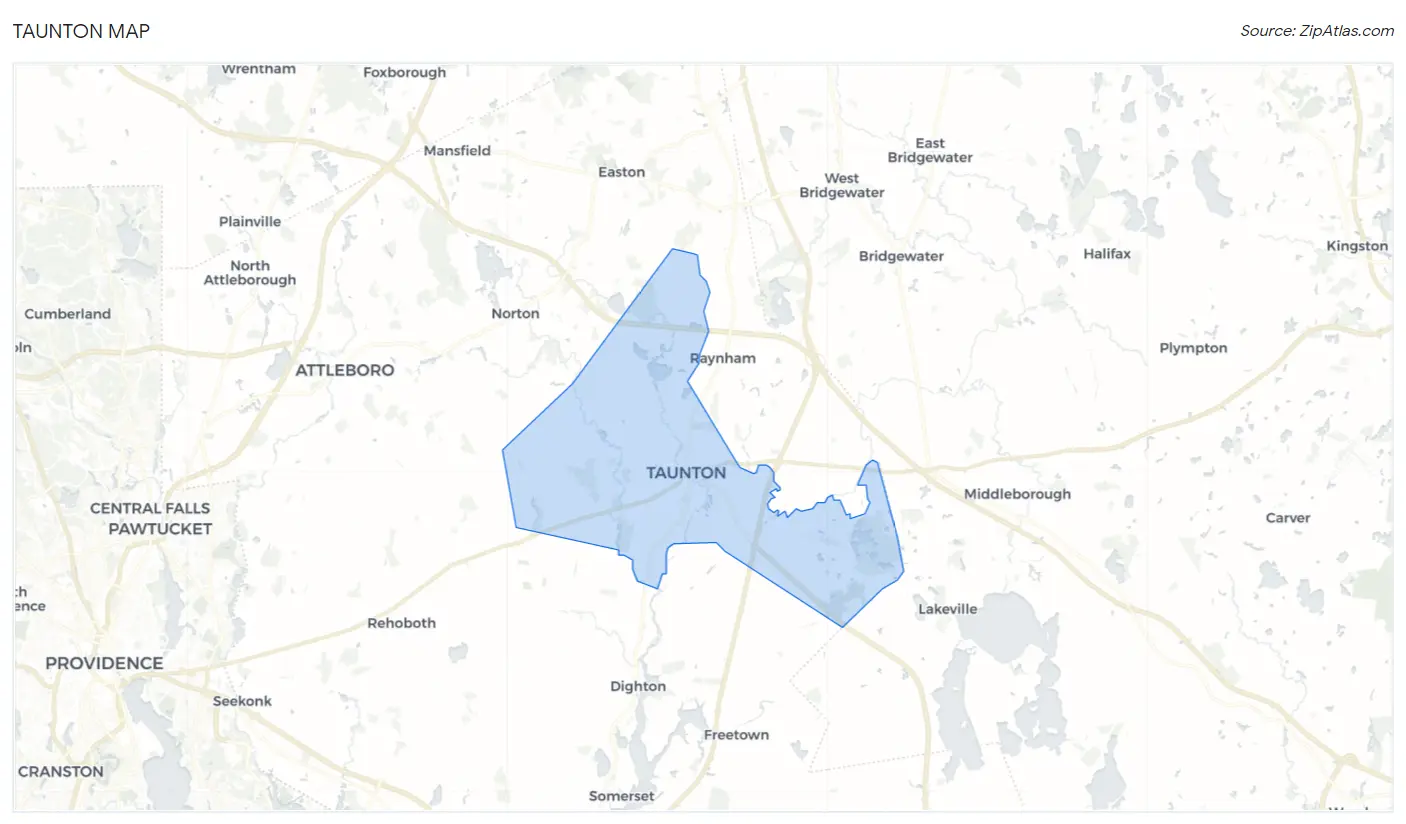
Taunton Map
Taunton Overview
$36,349
PER CAPITA INCOME
$94,646
AVG FAMILY INCOME
$72,782
AVG HOUSEHOLD INCOME
27.5%
WAGE / INCOME GAP [ % ]
72.5¢/ $1
WAGE / INCOME GAP [ $ ]
0.43
INEQUALITY / GINI INDEX
59,436
TOTAL POPULATION
28,654
MALE POPULATION
30,782
FEMALE POPULATION
93.09
MALES / 100 FEMALES
107.43
FEMALES / 100 MALES
40.2
MEDIAN AGE
3.0
AVG FAMILY SIZE
2.5
AVG HOUSEHOLD SIZE
32,093
LABOR FORCE [ PEOPLE ]
65.9%
PERCENT IN LABOR FORCE
5.5%
UNEMPLOYMENT RATE
Taunton Zip Codes
Income in Taunton
Income Overview in Taunton
Per Capita Income in Taunton is $36,349, while median incomes of families and households are $94,646 and $72,782 respectively.
| Characteristic | Number | Measure |
| Per Capita Income | 59,436 | $36,349 |
| Median Family Income | 15,340 | $94,646 |
| Mean Family Income | 15,340 | $106,363 |
| Median Household Income | 23,835 | $72,782 |
| Mean Household Income | 23,835 | $90,540 |
| Income Deficit | 15,340 | $0 |
| Wage / Income Gap (%) | 59,436 | 27.48% |
| Wage / Income Gap ($) | 59,436 | 72.52¢ per $1 |
| Gini / Inequality Index | 59,436 | 0.43 |
Earnings by Sex in Taunton
Average Earnings in Taunton are $45,652, $53,065 for men and $38,483 for women, a difference of 27.5%.
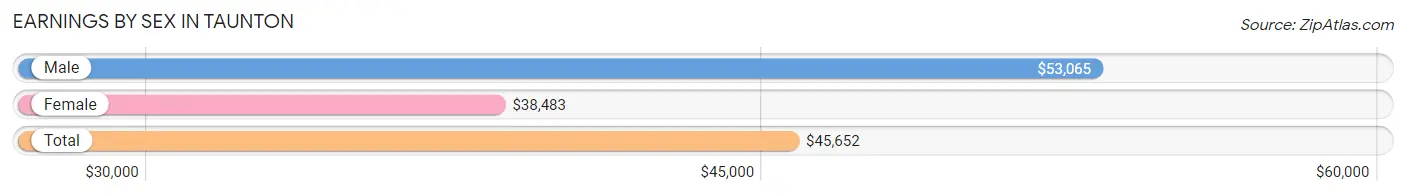
| Sex | Number | Average Earnings |
| Male | 16,384 (50.6%) | $53,065 |
| Female | 16,003 (49.4%) | $38,483 |
| Total | 32,387 (100.0%) | $45,652 |
Earnings by Sex by Income Bracket in Taunton
The most common earnings brackets in Taunton are $100,000+ for men (2,440 | 14.9%) and $75,000 to $99,999 for women (1,601 | 10.0%).
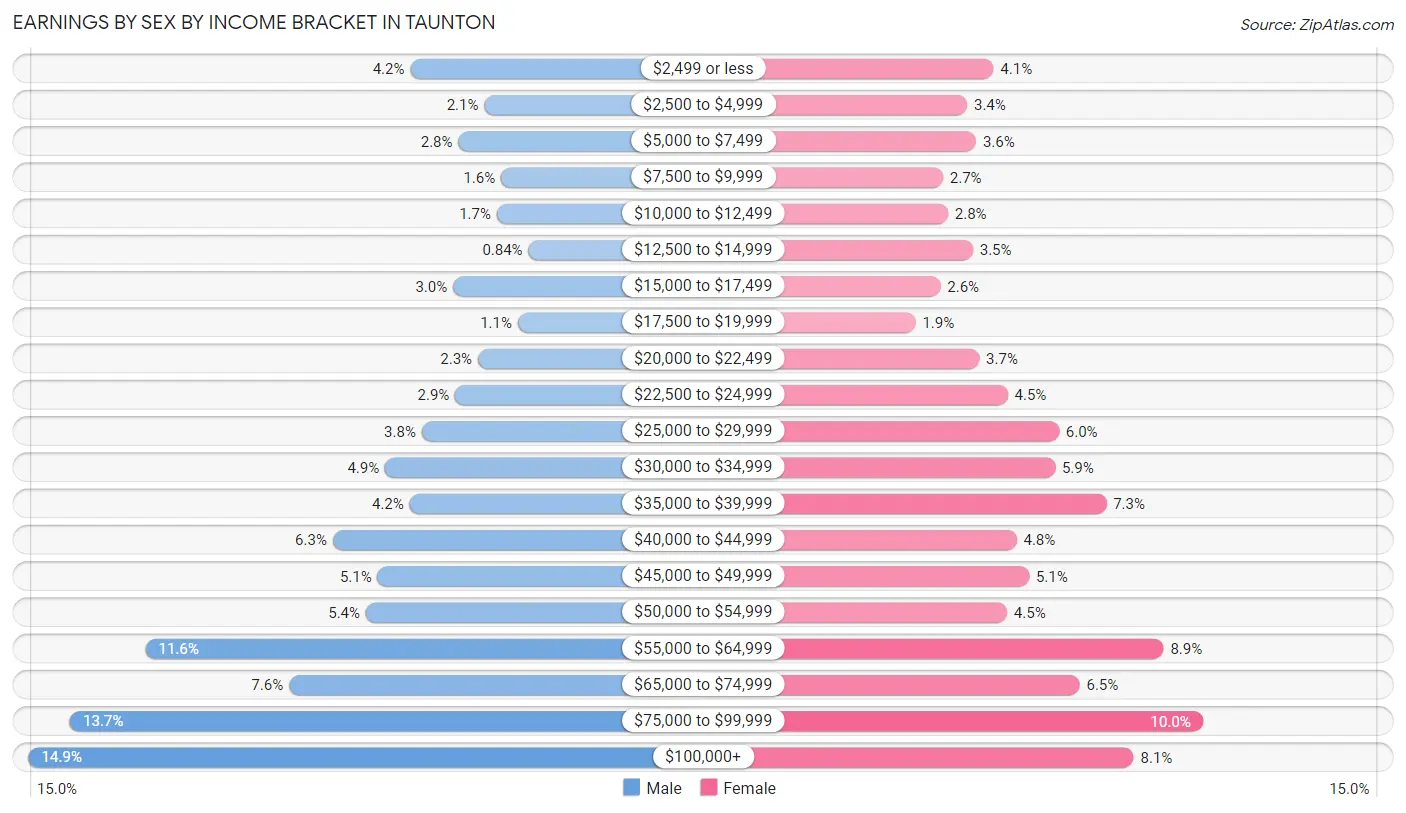
| Income | Male | Female |
| $2,499 or less | 682 (4.2%) | 659 (4.1%) |
| $2,500 to $4,999 | 340 (2.1%) | 541 (3.4%) |
| $5,000 to $7,499 | 461 (2.8%) | 581 (3.6%) |
| $7,500 to $9,999 | 264 (1.6%) | 432 (2.7%) |
| $10,000 to $12,499 | 284 (1.7%) | 454 (2.8%) |
| $12,500 to $14,999 | 137 (0.8%) | 567 (3.5%) |
| $15,000 to $17,499 | 485 (3.0%) | 421 (2.6%) |
| $17,500 to $19,999 | 186 (1.1%) | 309 (1.9%) |
| $20,000 to $22,499 | 371 (2.3%) | 595 (3.7%) |
| $22,500 to $24,999 | 475 (2.9%) | 723 (4.5%) |
| $25,000 to $29,999 | 629 (3.8%) | 953 (6.0%) |
| $30,000 to $34,999 | 798 (4.9%) | 936 (5.9%) |
| $35,000 to $39,999 | 685 (4.2%) | 1,166 (7.3%) |
| $40,000 to $44,999 | 1,038 (6.3%) | 764 (4.8%) |
| $45,000 to $49,999 | 833 (5.1%) | 820 (5.1%) |
| $50,000 to $54,999 | 887 (5.4%) | 720 (4.5%) |
| $55,000 to $64,999 | 1,900 (11.6%) | 1,425 (8.9%) |
| $65,000 to $74,999 | 1,241 (7.6%) | 1,046 (6.5%) |
| $75,000 to $99,999 | 2,248 (13.7%) | 1,601 (10.0%) |
| $100,000+ | 2,440 (14.9%) | 1,290 (8.1%) |
| Total | 16,384 (100.0%) | 16,003 (100.0%) |
Earnings by Sex by Educational Attainment in Taunton
Average earnings in Taunton are $57,690 for men and $44,893 for women, a difference of 22.2%. Men with an educational attainment of graduate degree enjoy the highest average annual earnings of $80,833, while those with less than high school education earn the least with $49,792. Women with an educational attainment of graduate degree earn the most with the average annual earnings of $74,936, while those with high school diploma education have the smallest earnings of $33,399.
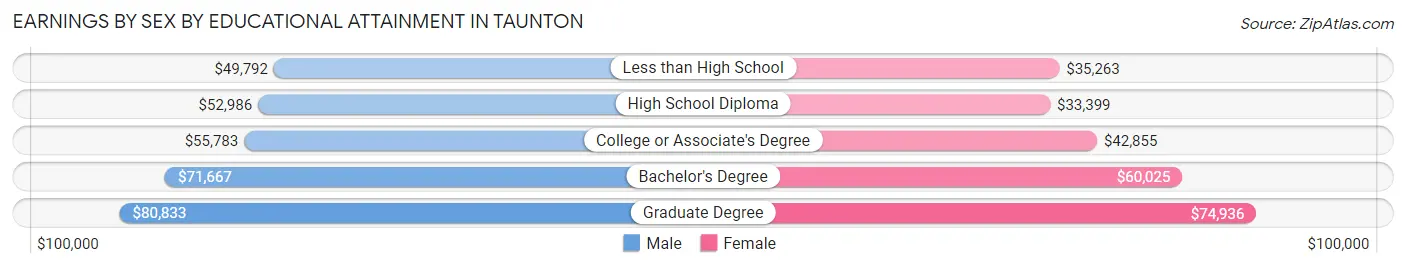
| Educational Attainment | Male Income | Female Income |
| Less than High School | $49,792 | $35,263 |
| High School Diploma | $52,986 | $33,399 |
| College or Associate's Degree | $55,783 | $42,855 |
| Bachelor's Degree | $71,667 | $60,025 |
| Graduate Degree | $80,833 | $74,936 |
| Total | $57,690 | $44,893 |
Family Income in Taunton
Family Income Brackets in Taunton
According to the Taunton family income data, there are 3,636 families falling into the $100,000 to $149,999 income range, which is the most common income bracket and makes up 23.7% of all families. Conversely, the $10,000 to $14,999 income bracket is the least frequent group with only 276 families (1.8%) belonging to this category.
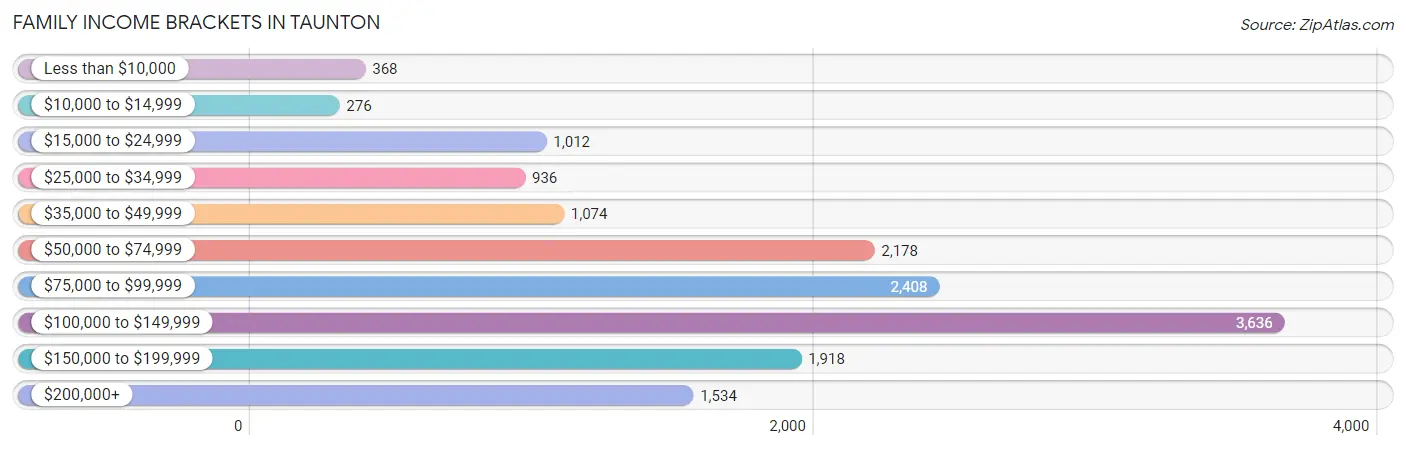
| Income Bracket | # Families | % Families |
| Less than $10,000 | 368 | 2.4% |
| $10,000 to $14,999 | 276 | 1.8% |
| $15,000 to $24,999 | 1,012 | 6.6% |
| $25,000 to $34,999 | 936 | 6.1% |
| $35,000 to $49,999 | 1,074 | 7.0% |
| $50,000 to $74,999 | 2,178 | 14.2% |
| $75,000 to $99,999 | 2,408 | 15.7% |
| $100,000 to $149,999 | 3,636 | 23.7% |
| $150,000 to $199,999 | 1,918 | 12.5% |
| $200,000+ | 1,534 | 10.0% |
Family Income by Famaliy Size in Taunton
7+ person families (180 | 1.2%) account for the highest median family income in Taunton with $163,534 per family, while 2-person families (6,493 | 42.3%) have the highest median income of $41,254 per family member.
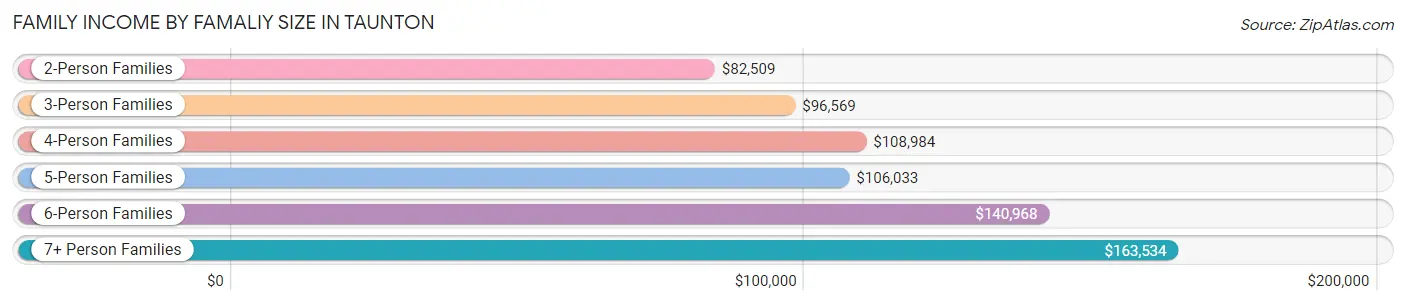
| Income Bracket | # Families | Median Income |
| 2-Person Families | 6,493 (42.3%) | $82,509 |
| 3-Person Families | 4,122 (26.9%) | $96,569 |
| 4-Person Families | 3,134 (20.4%) | $108,984 |
| 5-Person Families | 1,077 (7.0%) | $106,033 |
| 6-Person Families | 334 (2.2%) | $140,968 |
| 7+ Person Families | 180 (1.2%) | $163,534 |
| Total | 15,340 (100.0%) | $94,646 |
Family Income by Number of Earners in Taunton
The median family income in Taunton is $94,646, with families comprising 3+ earners (2,735) having the highest median family income of $157,762, while families with no earners (2,111) have the lowest median family income of $37,480, accounting for 17.8% and 13.8% of families, respectively.
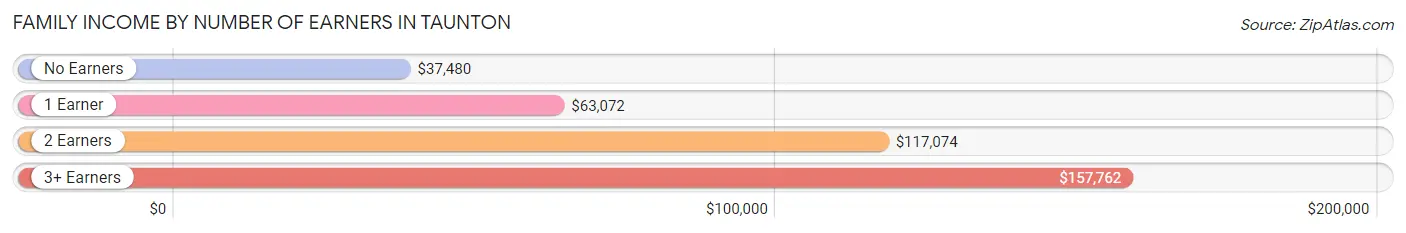
| Number of Earners | # Families | Median Income |
| No Earners | 2,111 (13.8%) | $37,480 |
| 1 Earner | 4,587 (29.9%) | $63,072 |
| 2 Earners | 5,907 (38.5%) | $117,074 |
| 3+ Earners | 2,735 (17.8%) | $157,762 |
| Total | 15,340 (100.0%) | $94,646 |
Household Income in Taunton
Household Income Brackets in Taunton
With 4,624 households falling in the category, the $100,000 to $149,999 income range is the most frequent in Taunton, accounting for 19.4% of all households. In contrast, only 1,025 households (4.3%) fall into the $10,000 to $14,999 income bracket, making it the least populous group.
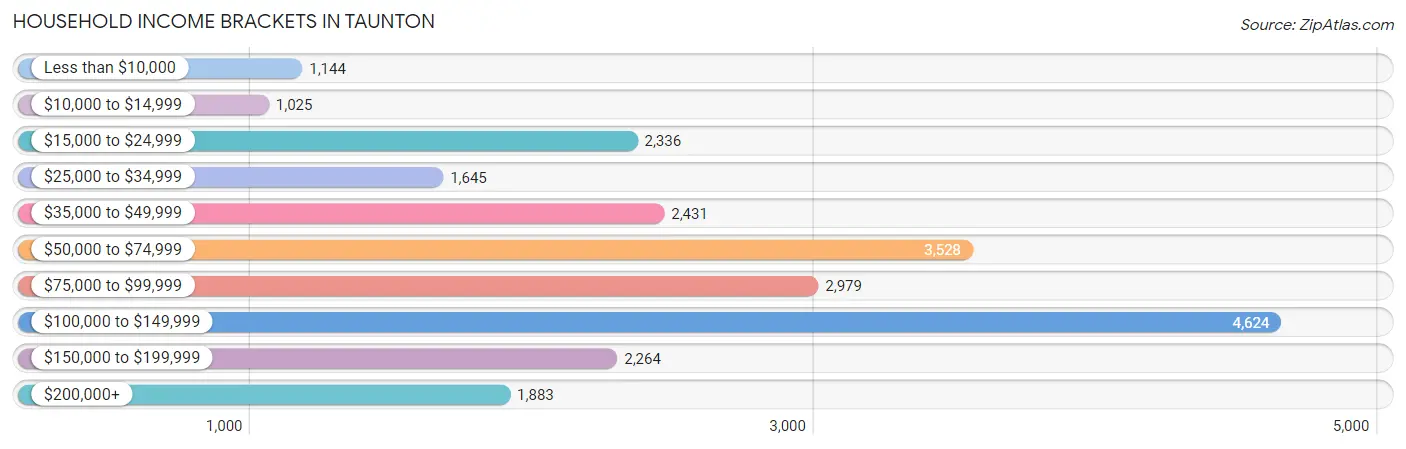
| Income Bracket | # Households | % Households |
| Less than $10,000 | 1,144 | 4.8% |
| $10,000 to $14,999 | 1,025 | 4.3% |
| $15,000 to $24,999 | 2,336 | 9.8% |
| $25,000 to $34,999 | 1,645 | 6.9% |
| $35,000 to $49,999 | 2,431 | 10.2% |
| $50,000 to $74,999 | 3,528 | 14.8% |
| $75,000 to $99,999 | 2,979 | 12.5% |
| $100,000 to $149,999 | 4,624 | 19.4% |
| $150,000 to $199,999 | 2,264 | 9.5% |
| $200,000+ | 1,883 | 7.9% |
Household Income by Householder Age in Taunton
The median household income in Taunton is $72,782, with the highest median household income of $86,189 found in the 45 to 64 years age bracket for the primary householder. A total of 10,006 households (42.0%) fall into this category. Meanwhile, the 65+ years age bracket for the primary householder has the lowest median household income of $46,796, with 5,786 households (24.3%) in this group.
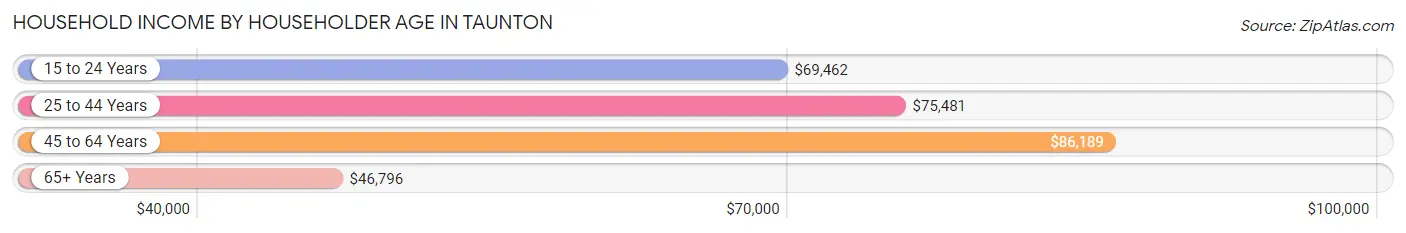
| Income Bracket | # Households | Median Income |
| 15 to 24 Years | 506 (2.1%) | $69,462 |
| 25 to 44 Years | 7,537 (31.6%) | $75,481 |
| 45 to 64 Years | 10,006 (42.0%) | $86,189 |
| 65+ Years | 5,786 (24.3%) | $46,796 |
| Total | 23,835 (100.0%) | $72,782 |
Poverty in Taunton
Income Below Poverty by Sex and Age in Taunton
With 12.5% poverty level for males and 13.0% for females among the residents of Taunton, 16 and 17 year old males and 12 to 14 year old females are the most vulnerable to poverty, with 267 males (30.1%) and 323 females (28.9%) in their respective age groups living below the poverty level.
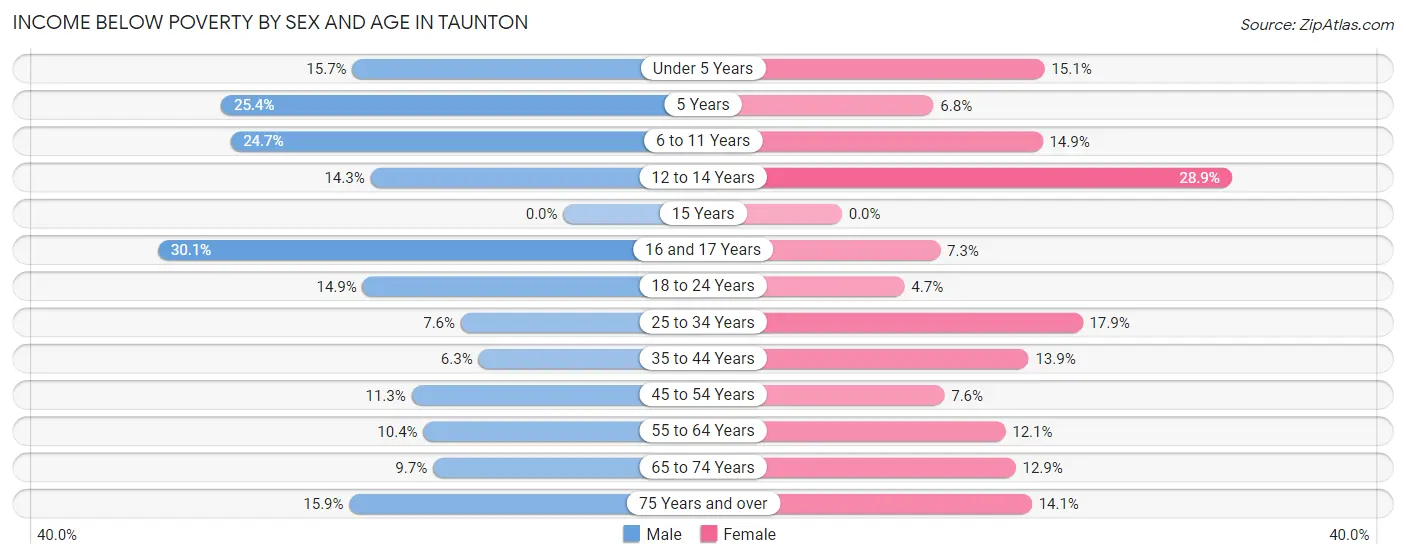
| Age Bracket | Male | Female |
| Under 5 Years | 262 (15.7%) | 217 (15.0%) |
| 5 Years | 77 (25.4%) | 20 (6.8%) |
| 6 to 11 Years | 530 (24.7%) | 275 (14.9%) |
| 12 to 14 Years | 178 (14.3%) | 323 (28.9%) |
| 15 Years | 0 (0.0%) | 0 (0.0%) |
| 16 and 17 Years | 267 (30.1%) | 64 (7.3%) |
| 18 to 24 Years | 384 (14.9%) | 95 (4.6%) |
| 25 to 34 Years | 303 (7.6%) | 846 (17.9%) |
| 35 to 44 Years | 228 (6.3%) | 479 (13.9%) |
| 45 to 54 Years | 395 (11.3%) | 337 (7.6%) |
| 55 to 64 Years | 466 (10.4%) | 606 (12.1%) |
| 65 to 74 Years | 237 (9.7%) | 310 (12.9%) |
| 75 Years and over | 216 (15.9%) | 356 (14.1%) |
| Total | 3,543 (12.5%) | 3,928 (13.0%) |
Income Above Poverty by Sex and Age in Taunton
According to the poverty statistics in Taunton, males aged 15 years and females aged 15 years are the age groups that are most secure financially, with 100.0% of males and 100.0% of females in these age groups living above the poverty line.
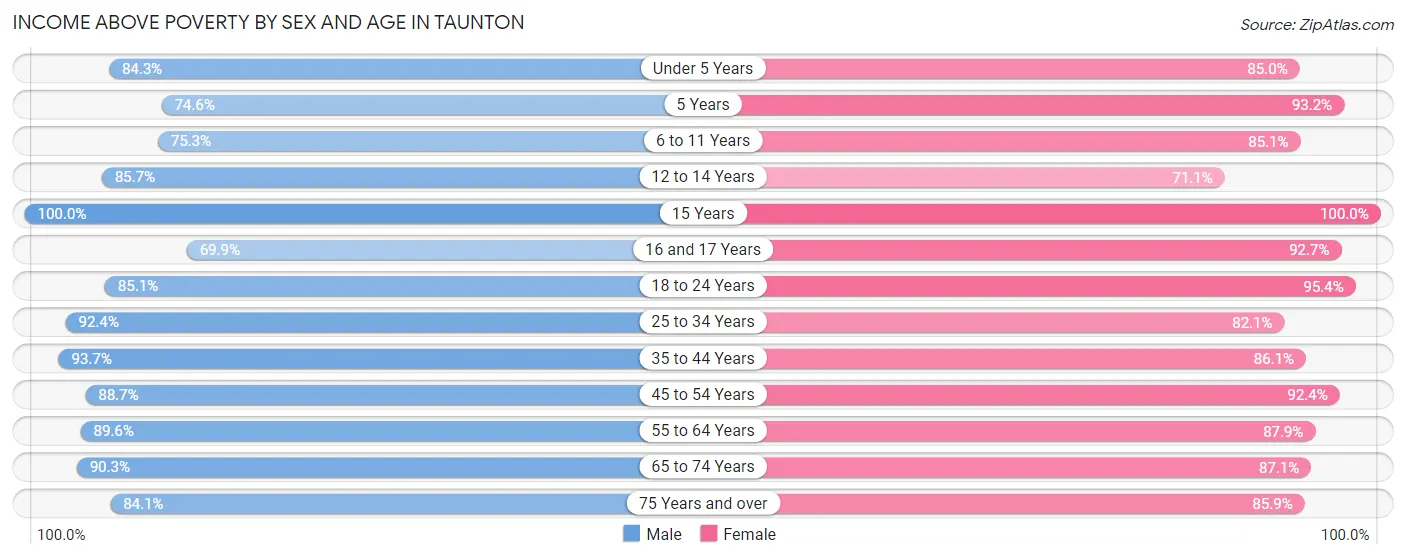
| Age Bracket | Male | Female |
| Under 5 Years | 1,411 (84.3%) | 1,225 (85.0%) |
| 5 Years | 226 (74.6%) | 274 (93.2%) |
| 6 to 11 Years | 1,613 (75.3%) | 1,571 (85.1%) |
| 12 to 14 Years | 1,065 (85.7%) | 793 (71.1%) |
| 15 Years | 173 (100.0%) | 171 (100.0%) |
| 16 and 17 Years | 620 (69.9%) | 813 (92.7%) |
| 18 to 24 Years | 2,191 (85.1%) | 1,950 (95.4%) |
| 25 to 34 Years | 3,676 (92.4%) | 3,889 (82.1%) |
| 35 to 44 Years | 3,390 (93.7%) | 2,978 (86.1%) |
| 45 to 54 Years | 3,110 (88.7%) | 4,089 (92.4%) |
| 55 to 64 Years | 4,017 (89.6%) | 4,387 (87.9%) |
| 65 to 74 Years | 2,212 (90.3%) | 2,093 (87.1%) |
| 75 Years and over | 1,143 (84.1%) | 2,169 (85.9%) |
| Total | 24,847 (87.5%) | 26,402 (87.1%) |
Income Below Poverty Among Married-Couple Families in Taunton
The poverty statistics for married-couple families in Taunton show that 4.8% or 490 of the total 10,146 families live below the poverty line. Families with no children have the highest poverty rate of 6.0%, comprising of 349 families. On the other hand, families with 1 or 2 children have the lowest poverty rate of 2.9%, which includes 112 families.
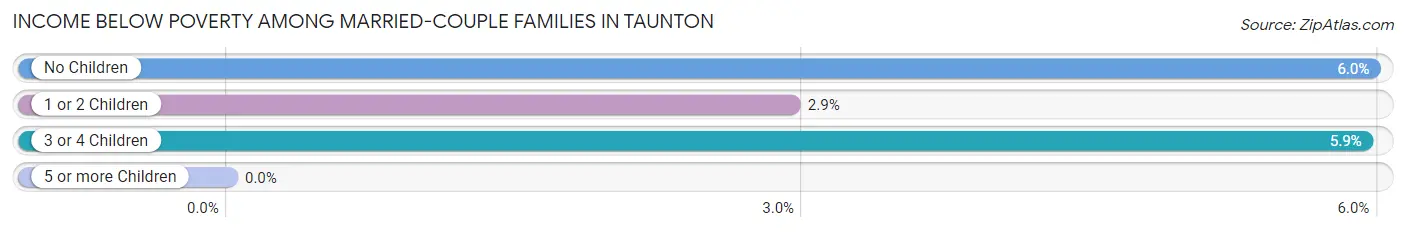
| Children | Above Poverty | Below Poverty |
| No Children | 5,499 (94.0%) | 349 (6.0%) |
| 1 or 2 Children | 3,697 (97.1%) | 112 (2.9%) |
| 3 or 4 Children | 460 (94.1%) | 29 (5.9%) |
| 5 or more Children | 0 (0.0%) | 0 (0.0%) |
| Total | 9,656 (95.2%) | 490 (4.8%) |
Income Below Poverty Among Single-Parent Households in Taunton
According to the poverty data in Taunton, 4.0% or 55 single-father households and 23.3% or 888 single-mother households are living below the poverty line. Among single-father households, those with 1 or 2 children have the highest poverty rate, with 55 households (7.0%) experiencing poverty. Likewise, among single-mother households, those with 5 or more children have the highest poverty rate, with 7 households (100.0%) falling below the poverty line.
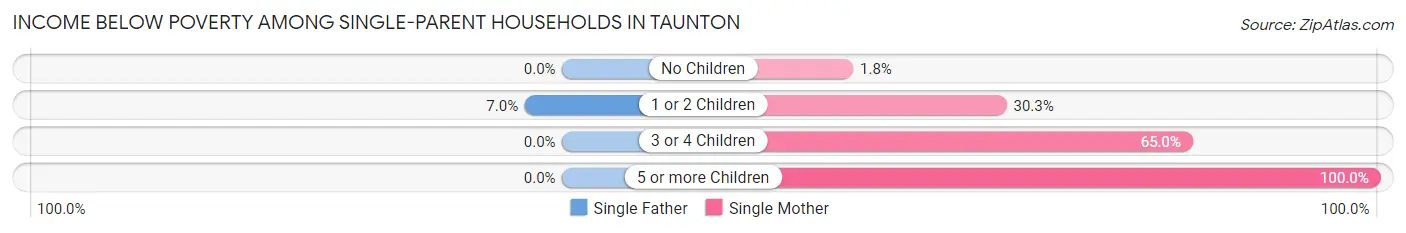
| Children | Single Father | Single Mother |
| No Children | 0 (0.0%) | 26 (1.8%) |
| 1 or 2 Children | 55 (7.0%) | 578 (30.3%) |
| 3 or 4 Children | 0 (0.0%) | 277 (65.0%) |
| 5 or more Children | 0 (0.0%) | 7 (100.0%) |
| Total | 55 (4.0%) | 888 (23.3%) |
Income Below Poverty Among Married-Couple vs Single-Parent Households in Taunton
The poverty data for Taunton shows that 490 of the married-couple family households (4.8%) and 943 of the single-parent households (18.2%) are living below the poverty level. Within the married-couple family households, those with no children have the highest poverty rate, with 349 households (6.0%) falling below the poverty line. Among the single-parent households, those with 5 or more children have the highest poverty rate, with 7 household (100.0%) living below poverty.
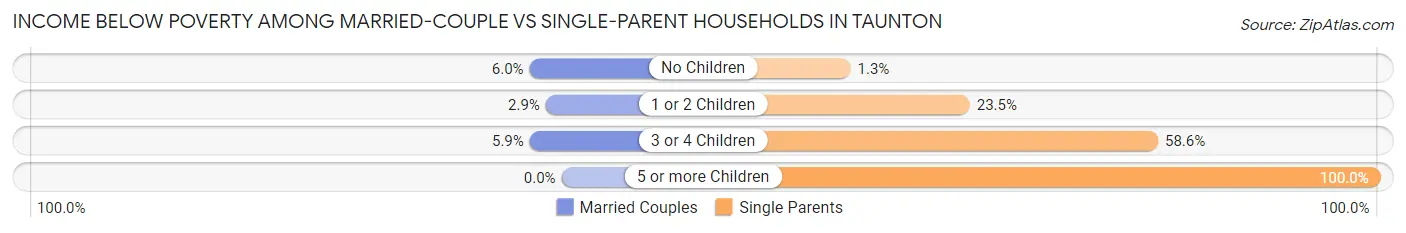
| Children | Married-Couple Families | Single-Parent Households |
| No Children | 349 (6.0%) | 26 (1.3%) |
| 1 or 2 Children | 112 (2.9%) | 633 (23.5%) |
| 3 or 4 Children | 29 (5.9%) | 277 (58.6%) |
| 5 or more Children | 0 (0.0%) | 7 (100.0%) |
| Total | 490 (4.8%) | 943 (18.2%) |
Race in Taunton
The most populous races in Taunton are White / Caucasian (45,748 | 77.0%), Two or more Races (6,315 | 10.6%), and Hispanic or Latino (4,582 | 7.7%).
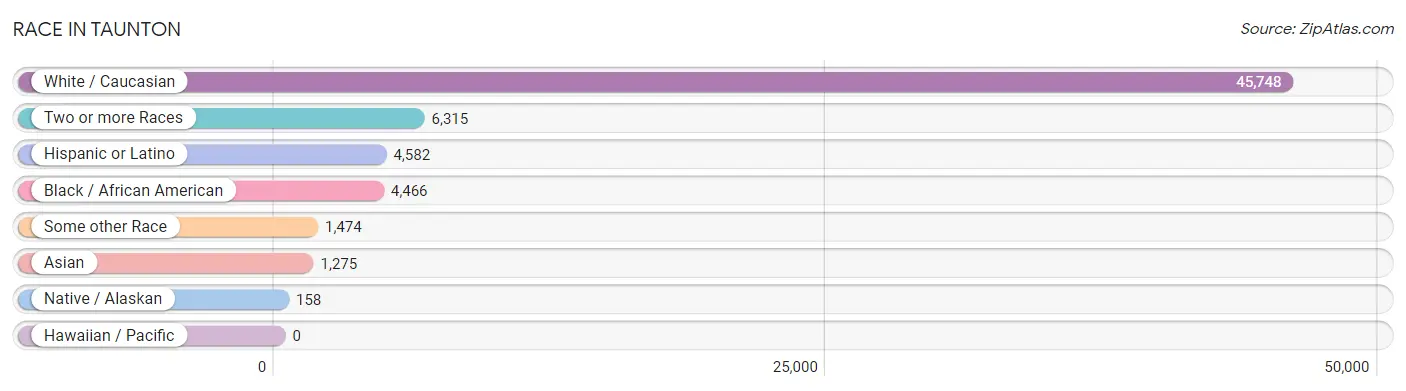
| Race | # Population | % Population |
| Asian | 1,275 | 2.1% |
| Black / African American | 4,466 | 7.5% |
| Hawaiian / Pacific | 0 | 0.0% |
| Hispanic or Latino | 4,582 | 7.7% |
| Native / Alaskan | 158 | 0.3% |
| White / Caucasian | 45,748 | 77.0% |
| Two or more Races | 6,315 | 10.6% |
| Some other Race | 1,474 | 2.5% |
| Total | 59,436 | 100.0% |
Ancestry in Taunton
The most populous ancestries reported in Taunton are Irish (11,531 | 19.4%), Portuguese (11,117 | 18.7%), Italian (5,489 | 9.2%), English (4,789 | 8.1%), and French (3,251 | 5.5%), together accounting for 60.9% of all Taunton residents.
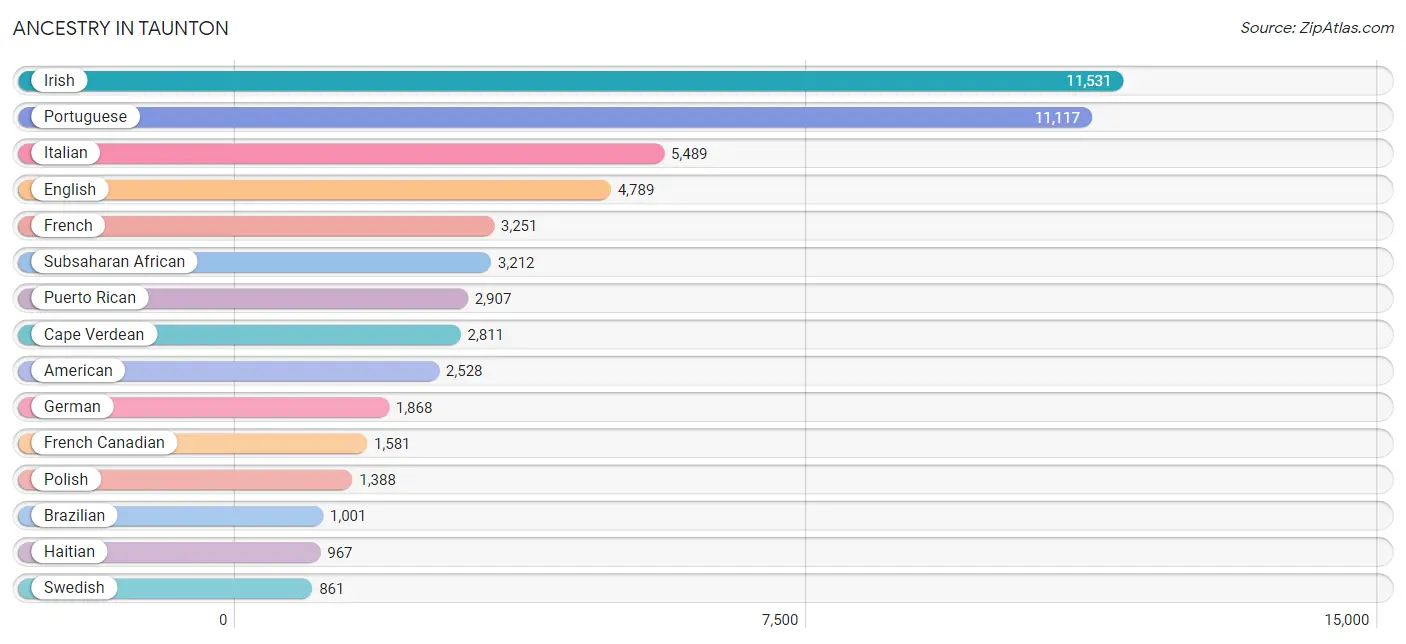
| Ancestry | # Population | % Population |
| African | 242 | 0.4% |
| Albanian | 383 | 0.6% |
| American | 2,528 | 4.3% |
| Arab | 94 | 0.2% |
| Argentinean | 16 | 0.0% |
| Armenian | 86 | 0.1% |
| Austrian | 17 | 0.0% |
| Barbadian | 34 | 0.1% |
| Belgian | 12 | 0.0% |
| Bhutanese | 36 | 0.1% |
| Brazilian | 1,001 | 1.7% |
| British | 113 | 0.2% |
| Bulgarian | 23 | 0.0% |
| Burmese | 30 | 0.1% |
| Canadian | 124 | 0.2% |
| Cape Verdean | 2,811 | 4.7% |
| Central American | 288 | 0.5% |
| Central American Indian | 149 | 0.3% |
| Cherokee | 6 | 0.0% |
| Chilean | 12 | 0.0% |
| Choctaw | 12 | 0.0% |
| Colombian | 199 | 0.3% |
| Costa Rican | 57 | 0.1% |
| Cree | 26 | 0.0% |
| Cuban | 124 | 0.2% |
| Czech | 17 | 0.0% |
| Czechoslovakian | 10 | 0.0% |
| Danish | 7 | 0.0% |
| Dominican | 446 | 0.7% |
| Dutch | 188 | 0.3% |
| Eastern European | 25 | 0.0% |
| Ecuadorian | 50 | 0.1% |
| English | 4,789 | 8.1% |
| European | 280 | 0.5% |
| Finnish | 122 | 0.2% |
| French | 3,251 | 5.5% |
| French Canadian | 1,581 | 2.7% |
| German | 1,868 | 3.1% |
| Greek | 354 | 0.6% |
| Guatemalan | 97 | 0.2% |
| Guyanese | 74 | 0.1% |
| Haitian | 967 | 1.6% |
| Honduran | 28 | 0.1% |
| Hungarian | 13 | 0.0% |
| Indian (Asian) | 621 | 1.0% |
| Irish | 11,531 | 19.4% |
| Italian | 5,489 | 9.2% |
| Jamaican | 234 | 0.4% |
| Japanese | 84 | 0.1% |
| Kenyan | 19 | 0.0% |
| Korean | 37 | 0.1% |
| Laotian | 10 | 0.0% |
| Lebanese | 50 | 0.1% |
| Lithuanian | 151 | 0.3% |
| Mexican | 104 | 0.2% |
| Nicaraguan | 10 | 0.0% |
| Nigerian | 108 | 0.2% |
| Norwegian | 321 | 0.5% |
| Pakistani | 16 | 0.0% |
| Panamanian | 96 | 0.2% |
| Peruvian | 122 | 0.2% |
| Polish | 1,388 | 2.3% |
| Portuguese | 11,117 | 18.7% |
| Puerto Rican | 2,907 | 4.9% |
| Romanian | 90 | 0.2% |
| Russian | 328 | 0.5% |
| Scandinavian | 19 | 0.0% |
| Scotch-Irish | 56 | 0.1% |
| Scottish | 790 | 1.3% |
| South American | 427 | 0.7% |
| South American Indian | 12 | 0.0% |
| Spaniard | 57 | 0.1% |
| Spanish | 193 | 0.3% |
| Sri Lankan | 394 | 0.7% |
| Subsaharan African | 3,212 | 5.4% |
| Swedish | 861 | 1.5% |
| Swiss | 31 | 0.1% |
| Syrian | 44 | 0.1% |
| Thai | 209 | 0.4% |
| Trinidadian and Tobagonian | 51 | 0.1% |
| Turkish | 35 | 0.1% |
| U.S. Virgin Islander | 44 | 0.1% |
| Ukrainian | 47 | 0.1% |
| Welsh | 117 | 0.2% |
| West Indian | 45 | 0.1% | View All 85 Rows |
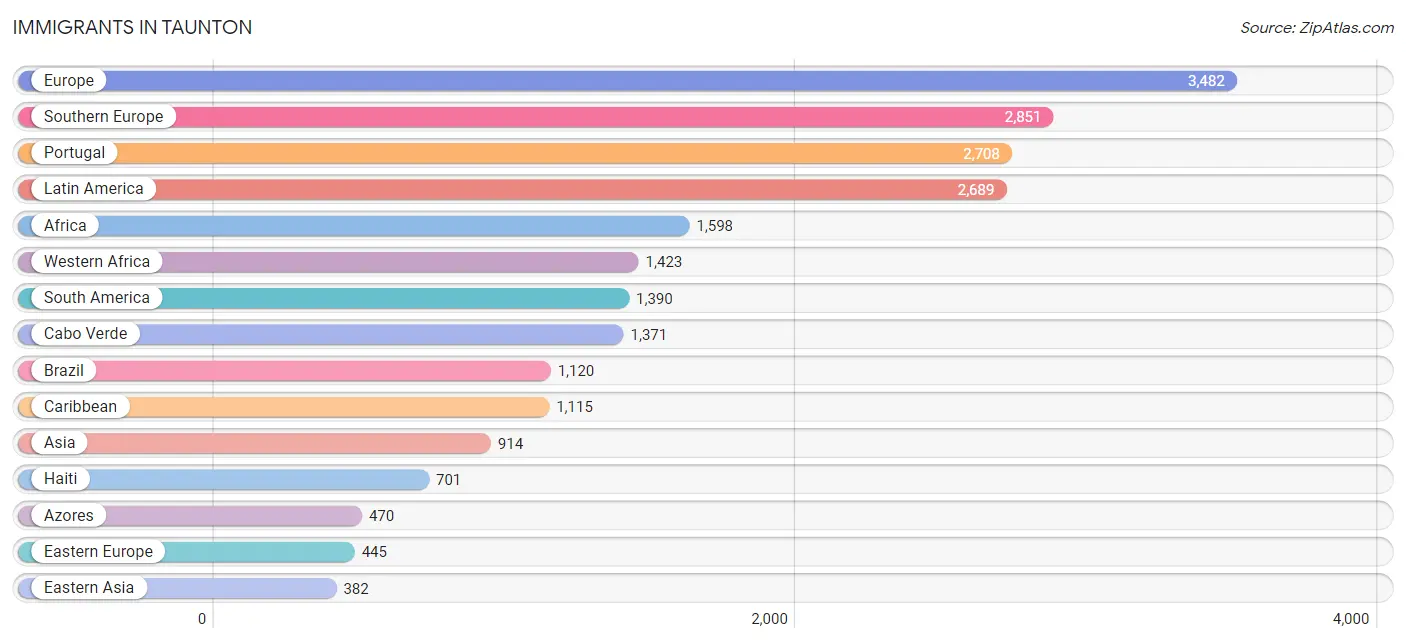
Immigrants in Taunton
The most numerous immigrant groups reported in Taunton came from Europe (3,482 | 5.9%), Southern Europe (2,851 | 4.8%), Portugal (2,708 | 4.6%), Latin America (2,689 | 4.5%), and Africa (1,598 | 2.7%), together accounting for 22.4% of all Taunton residents.
| Immigration Origin | # Population | % Population |
| Africa | 1,598 | 2.7% |
| Albania | 223 | 0.4% |
| Asia | 914 | 1.5% |
| Azores | 470 | 0.8% |
| Bahamas | 76 | 0.1% |
| Brazil | 1,120 | 1.9% |
| Bulgaria | 23 | 0.0% |
| Cabo Verde | 1,371 | 2.3% |
| Cambodia | 47 | 0.1% |
| Cameroon | 80 | 0.1% |
| Canada | 69 | 0.1% |
| Caribbean | 1,115 | 1.9% |
| Central America | 184 | 0.3% |
| Chile | 12 | 0.0% |
| China | 354 | 0.6% |
| Colombia | 92 | 0.2% |
| Costa Rica | 49 | 0.1% |
| Cuba | 23 | 0.0% |
| Dominican Republic | 242 | 0.4% |
| Eastern Africa | 39 | 0.1% |
| Eastern Asia | 382 | 0.6% |
| Eastern Europe | 445 | 0.7% |
| Ecuador | 40 | 0.1% |
| England | 10 | 0.0% |
| Europe | 3,482 | 5.9% |
| Germany | 87 | 0.2% |
| Greece | 106 | 0.2% |
| Guatemala | 97 | 0.2% |
| Guyana | 74 | 0.1% |
| Haiti | 701 | 1.2% |
| India | 180 | 0.3% |
| Indonesia | 10 | 0.0% |
| Ireland | 36 | 0.1% |
| Jamaica | 34 | 0.1% |
| Japan | 16 | 0.0% |
| Kenya | 39 | 0.1% |
| Korea | 12 | 0.0% |
| Latin America | 2,689 | 4.5% |
| Lebanon | 18 | 0.0% |
| Liberia | 18 | 0.0% |
| Middle Africa | 111 | 0.2% |
| Morocco | 25 | 0.0% |
| Netherlands | 12 | 0.0% |
| Nicaragua | 10 | 0.0% |
| Nigeria | 34 | 0.1% |
| Northern Africa | 25 | 0.0% |
| Northern Europe | 87 | 0.2% |
| Panama | 28 | 0.1% |
| Peru | 50 | 0.1% |
| Philippines | 37 | 0.1% |
| Poland | 66 | 0.1% |
| Portugal | 2,708 | 4.6% |
| Romania | 90 | 0.2% |
| Russia | 43 | 0.1% |
| South America | 1,390 | 2.3% |
| South Central Asia | 180 | 0.3% |
| South Eastern Asia | 311 | 0.5% |
| Southern Europe | 2,851 | 4.8% |
| Spain | 37 | 0.1% |
| Syria | 12 | 0.0% |
| Trinidad and Tobago | 39 | 0.1% |
| Turkey | 11 | 0.0% |
| Vietnam | 207 | 0.4% |
| Western Africa | 1,423 | 2.4% |
| Western Asia | 41 | 0.1% |
| Western Europe | 99 | 0.2% | View All 66 Rows |
Sex and Age in Taunton
Sex and Age in Taunton
The most populous age groups in Taunton are 60 to 64 Years (2,343 | 8.2%) for men and 60 to 64 Years (2,720 | 8.8%) for women.
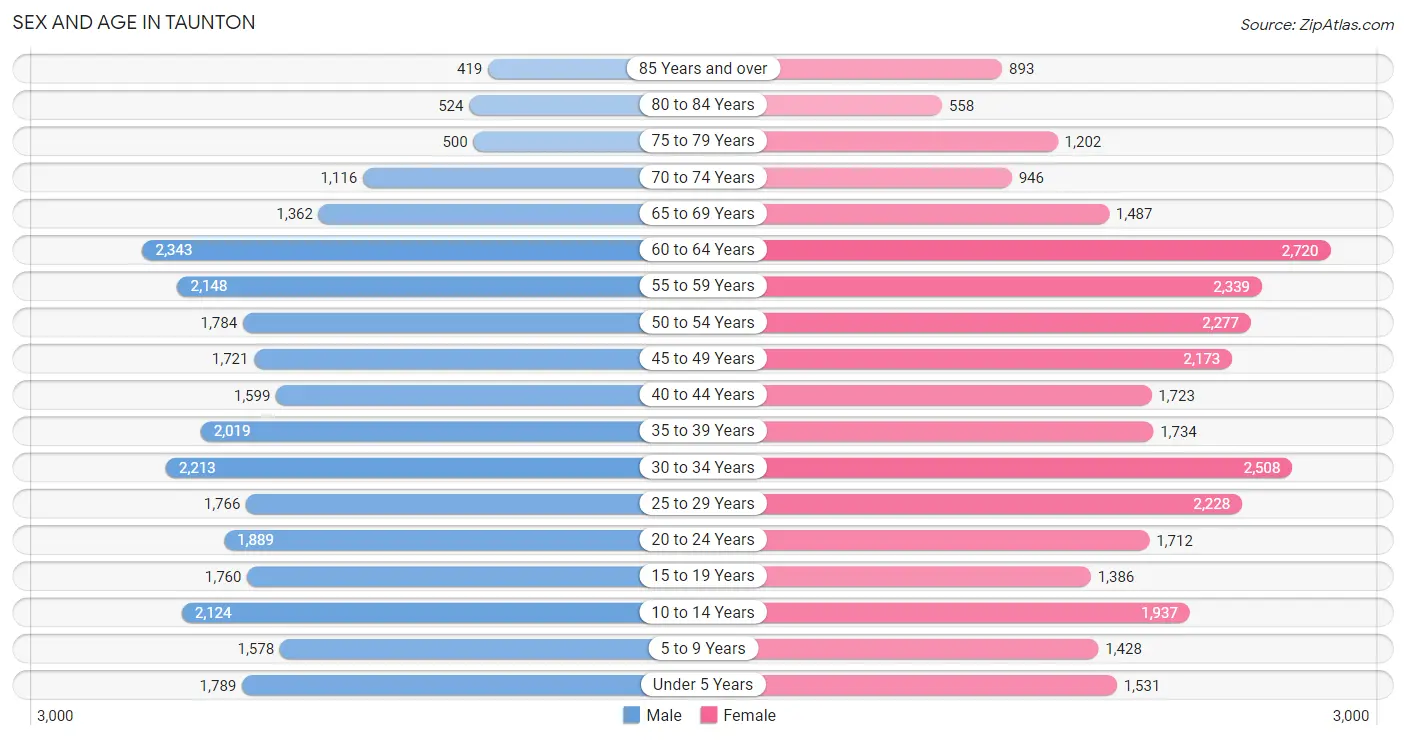
| Age Bracket | Male | Female |
| Under 5 Years | 1,789 (6.2%) | 1,531 (5.0%) |
| 5 to 9 Years | 1,578 (5.5%) | 1,428 (4.6%) |
| 10 to 14 Years | 2,124 (7.4%) | 1,937 (6.3%) |
| 15 to 19 Years | 1,760 (6.1%) | 1,386 (4.5%) |
| 20 to 24 Years | 1,889 (6.6%) | 1,712 (5.6%) |
| 25 to 29 Years | 1,766 (6.2%) | 2,228 (7.2%) |
| 30 to 34 Years | 2,213 (7.7%) | 2,508 (8.2%) |
| 35 to 39 Years | 2,019 (7.0%) | 1,734 (5.6%) |
| 40 to 44 Years | 1,599 (5.6%) | 1,723 (5.6%) |
| 45 to 49 Years | 1,721 (6.0%) | 2,173 (7.1%) |
| 50 to 54 Years | 1,784 (6.2%) | 2,277 (7.4%) |
| 55 to 59 Years | 2,148 (7.5%) | 2,339 (7.6%) |
| 60 to 64 Years | 2,343 (8.2%) | 2,720 (8.8%) |
| 65 to 69 Years | 1,362 (4.8%) | 1,487 (4.8%) |
| 70 to 74 Years | 1,116 (3.9%) | 946 (3.1%) |
| 75 to 79 Years | 500 (1.7%) | 1,202 (3.9%) |
| 80 to 84 Years | 524 (1.8%) | 558 (1.8%) |
| 85 Years and over | 419 (1.5%) | 893 (2.9%) |
| Total | 28,654 (100.0%) | 30,782 (100.0%) |
Families and Households in Taunton
Median Family Size in Taunton
The median family size in Taunton is 3.03 persons per family, with married-couple families (10,146 | 66.1%) accounting for the largest median family size of 3.18 persons per family. On the other hand, single male/father families (1,377 | 9.0%) represent the smallest median family size with 2.38 persons per family.
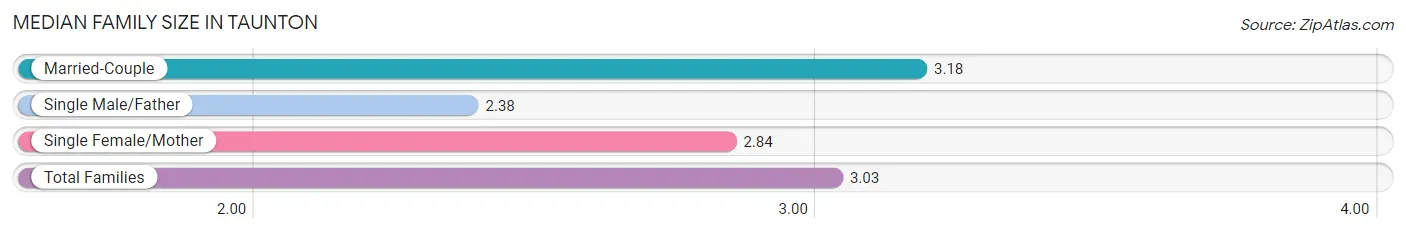
| Family Type | # Families | Family Size |
| Married-Couple | 10,146 (66.1%) | 3.18 |
| Single Male/Father | 1,377 (9.0%) | 2.38 |
| Single Female/Mother | 3,817 (24.9%) | 2.84 |
| Total Families | 15,340 (100.0%) | 3.03 |
Median Household Size in Taunton
The median household size in Taunton is 2.46 persons per household, with married-couple households (10,146 | 42.6%) accounting for the largest median household size of 3.23 persons per household. non-family households (8,495 | 35.6%) represent the smallest median household size with 1.23 persons per household.
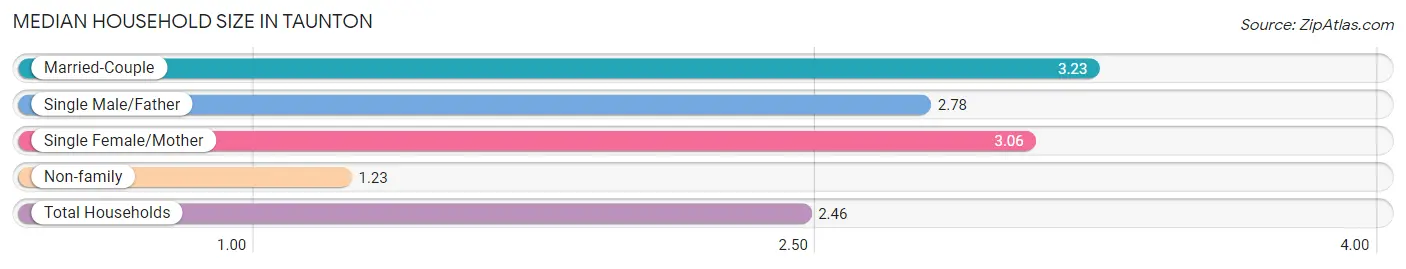
| Household Type | # Households | Household Size |
| Married-Couple | 10,146 (42.6%) | 3.23 |
| Single Male/Father | 1,377 (5.8%) | 2.78 |
| Single Female/Mother | 3,817 (16.0%) | 3.06 |
| Non-family | 8,495 (35.6%) | 1.23 |
| Total Households | 23,835 (100.0%) | 2.46 |
Household Size by Marriage Status in Taunton
Out of a total of 23,835 households in Taunton, 15,340 (64.4%) are family households, while 8,495 (35.6%) are nonfamily households. The most numerous type of family households are 2-person households, comprising 5,814, and the most common type of nonfamily households are 1-person households, comprising 6,838.
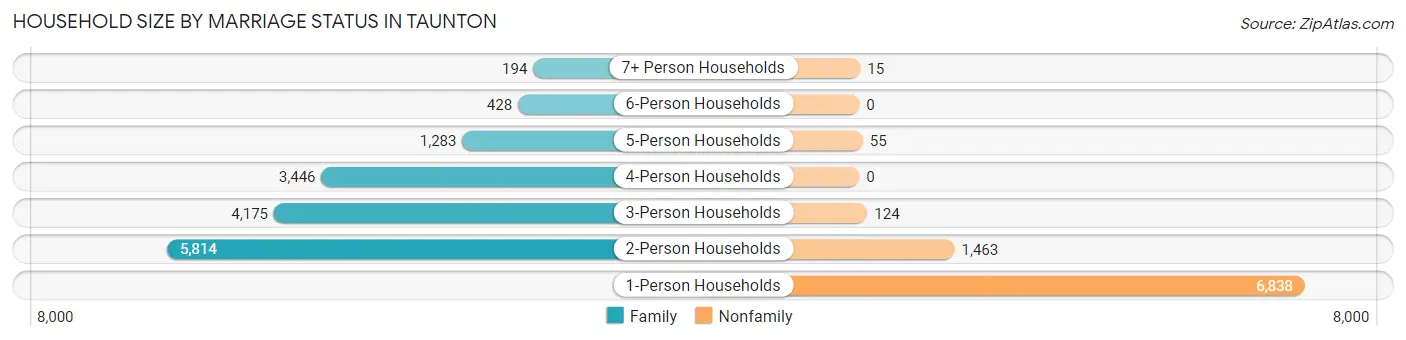
| Household Size | Family Households | Nonfamily Households |
| 1-Person Households | - | 6,838 (28.7%) |
| 2-Person Households | 5,814 (24.4%) | 1,463 (6.1%) |
| 3-Person Households | 4,175 (17.5%) | 124 (0.5%) |
| 4-Person Households | 3,446 (14.5%) | 0 (0.0%) |
| 5-Person Households | 1,283 (5.4%) | 55 (0.2%) |
| 6-Person Households | 428 (1.8%) | 0 (0.0%) |
| 7+ Person Households | 194 (0.8%) | 15 (0.1%) |
| Total | 15,340 (64.4%) | 8,495 (35.6%) |
Female Fertility in Taunton
Fertility by Age in Taunton
Average fertility rate in Taunton is 54.0 births per 1,000 women. Women in the age bracket of 20 to 34 years have the highest fertility rate with 99.0 births per 1,000 women. Women in the age bracket of 20 to 34 years acount for 85.9% of all women with births.
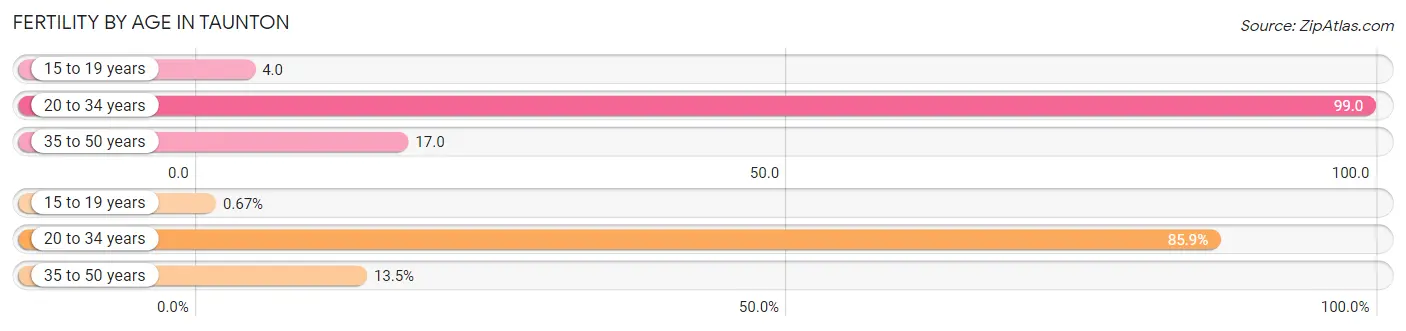
| Age Bracket | Women with Births | Births / 1,000 Women |
| 15 to 19 years | 5 (0.7%) | 4.0 |
| 20 to 34 years | 637 (85.9%) | 99.0 |
| 35 to 50 years | 100 (13.5%) | 17.0 |
| Total | 742 (100.0%) | 54.0 |
Fertility by Age by Marriage Status in Taunton
70.6% of women with births (742) in Taunton are married. The highest percentage of unmarried women with births falls into 15 to 19 years age bracket with 100.0% of them unmarried at the time of birth, while the lowest percentage of unmarried women with births belong to 35 to 50 years age bracket with 0.0% of them unmarried.
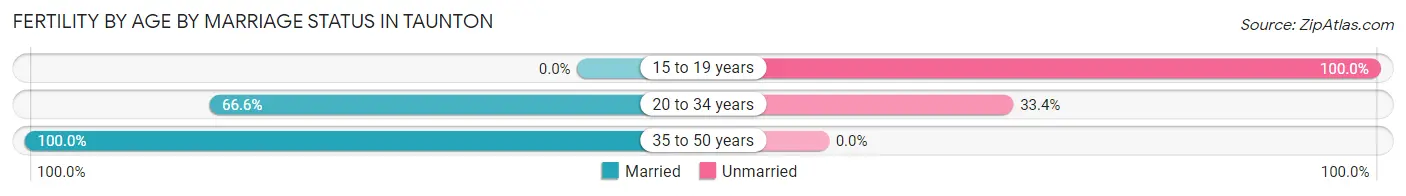
| Age Bracket | Married | Unmarried |
| 15 to 19 years | 0 (0.0%) | 5 (100.0%) |
| 20 to 34 years | 424 (66.6%) | 213 (33.4%) |
| 35 to 50 years | 100 (100.0%) | 0 (0.0%) |
| Total | 524 (70.6%) | 218 (29.4%) |
Fertility by Education in Taunton
Average fertility rate in Taunton is 54.0 births per 1,000 women. Women with the education attainment of bachelor's degree have the highest fertility rate of 137.0 births per 1,000 women, while women with the education attainment of less than high school have the lowest fertility at 15.0 births per 1,000 women. Women with the education attainment of bachelor's degree represent 53.8% of all women with births.
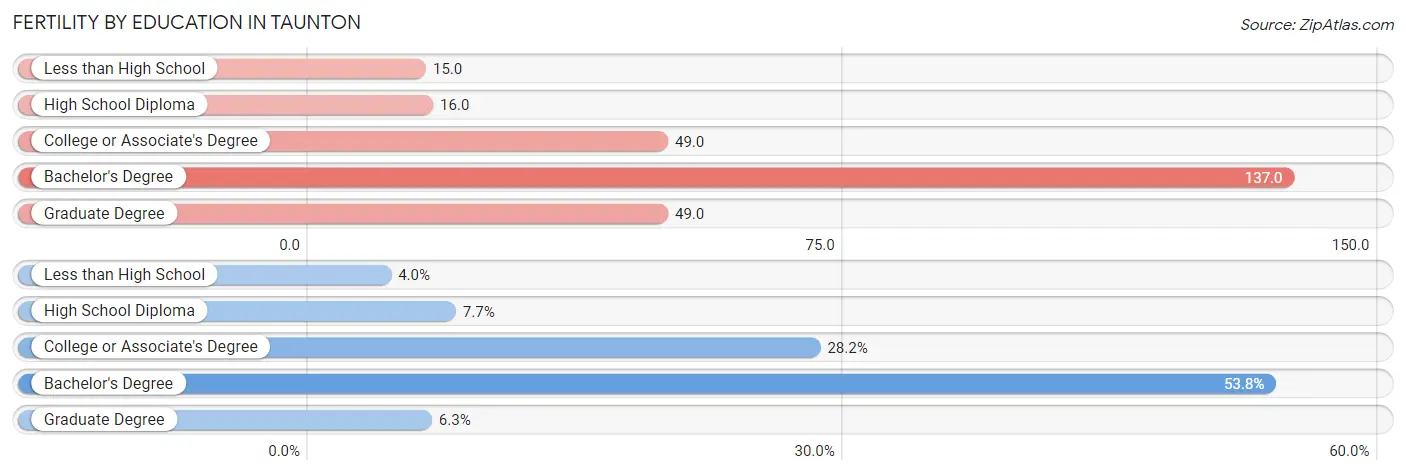
| Educational Attainment | Women with Births | Births / 1,000 Women |
| Less than High School | 30 (4.0%) | 15.0 |
| High School Diploma | 57 (7.7%) | 16.0 |
| College or Associate's Degree | 209 (28.2%) | 49.0 |
| Bachelor's Degree | 399 (53.8%) | 137.0 |
| Graduate Degree | 47 (6.3%) | 49.0 |
| Total | 742 (100.0%) | 54.0 |
Fertility by Education by Marriage Status in Taunton
29.4% of women with births in Taunton are unmarried. Women with the educational attainment of graduate degree are most likely to be married with 100.0% of them married at childbirth, while women with the educational attainment of high school diploma are least likely to be married with 75.4% of them unmarried at childbirth.
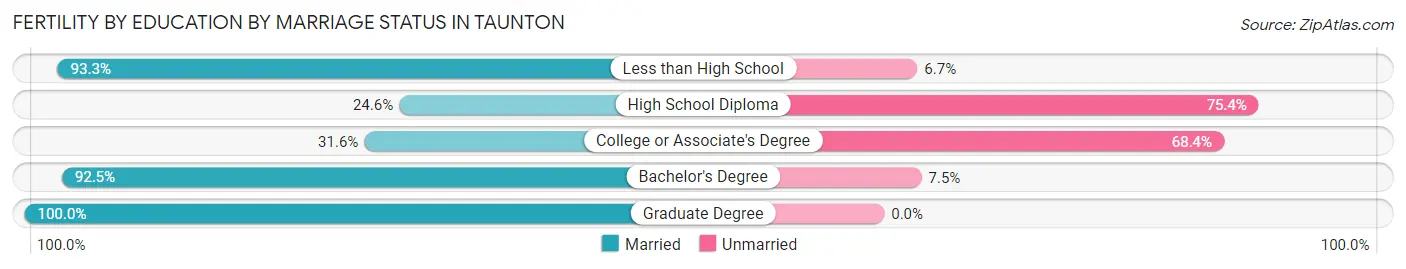
| Educational Attainment | Married | Unmarried |
| Less than High School | 28 (93.3%) | 2 (6.7%) |
| High School Diploma | 14 (24.6%) | 43 (75.4%) |
| College or Associate's Degree | 66 (31.6%) | 143 (68.4%) |
| Bachelor's Degree | 369 (92.5%) | 30 (7.5%) |
| Graduate Degree | 47 (100.0%) | 0 (0.0%) |
| Total | 524 (70.6%) | 218 (29.4%) |
Employment Characteristics in Taunton
Employment by Class of Employer in Taunton
Among the 29,608 employed individuals in Taunton, private company employees (21,119 | 71.3%), not-for-profit organizations (2,799 | 9.5%), and local government employees (1,829 | 6.2%) make up the most common classes of employment.
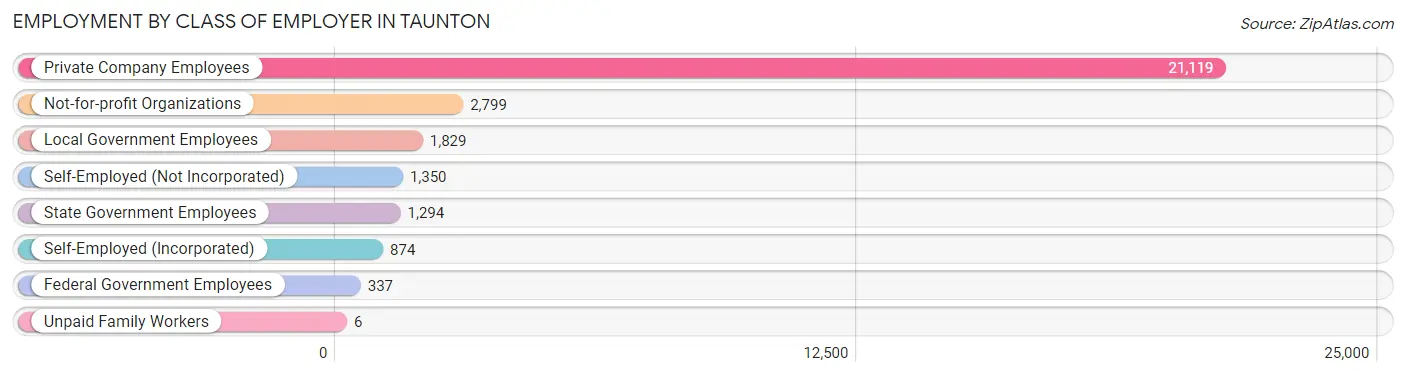
| Employer Class | # Employees | % Employees |
| Private Company Employees | 21,119 | 71.3% |
| Self-Employed (Incorporated) | 874 | 2.9% |
| Self-Employed (Not Incorporated) | 1,350 | 4.6% |
| Not-for-profit Organizations | 2,799 | 9.5% |
| Local Government Employees | 1,829 | 6.2% |
| State Government Employees | 1,294 | 4.4% |
| Federal Government Employees | 337 | 1.1% |
| Unpaid Family Workers | 6 | 0.0% |
| Total | 29,608 | 100.0% |
Employment Status by Age in Taunton
According to the labor force statistics for Taunton, out of the total population over 16 years of age (48,699), 65.9% or 32,093 individuals are in the labor force, with 5.5% or 1,765 of them unemployed. The age group with the highest labor force participation rate is 20 to 24 years, with 87.8% or 3,162 individuals in the labor force. Within the labor force, the 16 to 19 years age range has the highest percentage of unemployed individuals, with 15.8% or 258 of them being unemployed.
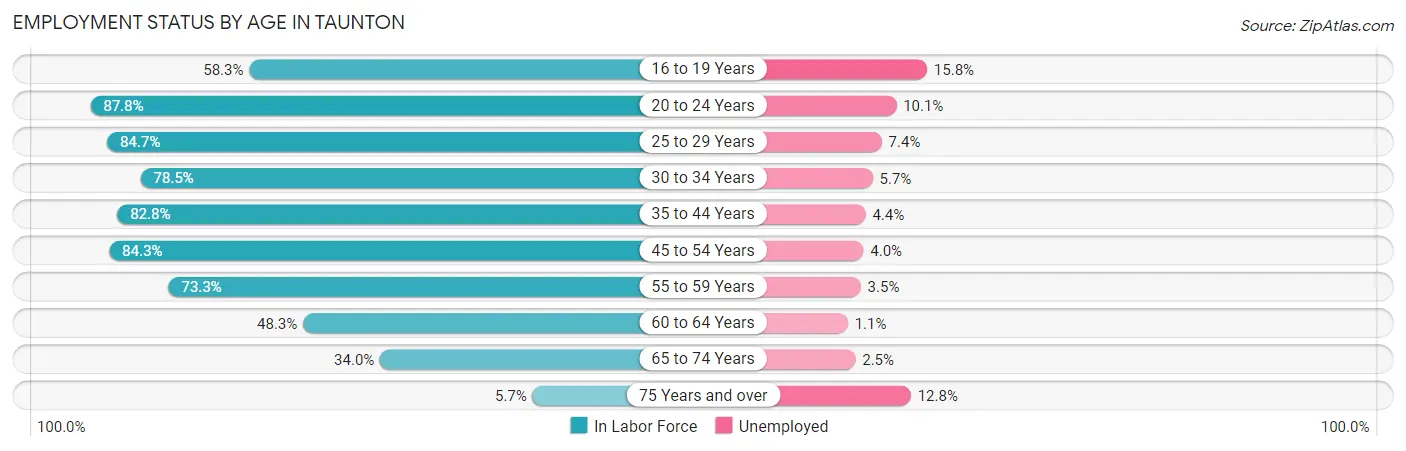
| Age Bracket | In Labor Force | Unemployed |
| 16 to 19 Years | 1,630 (58.3%) | 258 (15.8%) |
| 20 to 24 Years | 3,162 (87.8%) | 319 (10.1%) |
| 25 to 29 Years | 3,383 (84.7%) | 250 (7.4%) |
| 30 to 34 Years | 3,706 (78.5%) | 211 (5.7%) |
| 35 to 44 Years | 5,858 (82.8%) | 258 (4.4%) |
| 45 to 54 Years | 6,706 (84.3%) | 268 (4.0%) |
| 55 to 59 Years | 3,289 (73.3%) | 115 (3.5%) |
| 60 to 64 Years | 2,445 (48.3%) | 27 (1.1%) |
| 65 to 74 Years | 1,670 (34.0%) | 42 (2.5%) |
| 75 Years and over | 233 (5.7%) | 30 (12.8%) |
| Total | 32,093 (65.9%) | 1,765 (5.5%) |
Employment Status by Educational Attainment in Taunton
According to labor force statistics for Taunton, 76.3% of individuals (25,404) out of the total population between 25 and 64 years of age (33,295) are in the labor force, with 4.5% or 1,143 of them being unemployed. The group with the highest labor force participation rate are those with the educational attainment of bachelor's degree or higher, with 86.7% or 7,126 individuals in the labor force. Within the labor force, individuals with less than high school education have the highest percentage of unemployment, with 11.5% or 236 of them being unemployed.
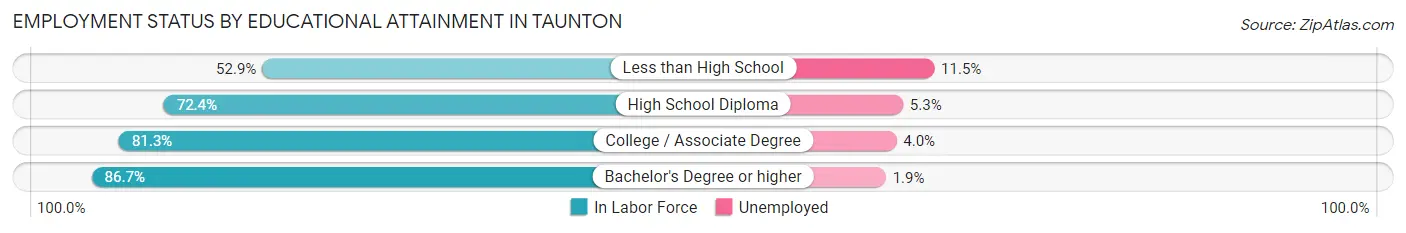
| Educational Attainment | In Labor Force | Unemployed |
| Less than High School | 2,053 (52.9%) | 446 (11.5%) |
| High School Diploma | 8,319 (72.4%) | 609 (5.3%) |
| College / Associate Degree | 7,890 (81.3%) | 388 (4.0%) |
| Bachelor's Degree or higher | 7,126 (86.7%) | 156 (1.9%) |
| Total | 25,404 (76.3%) | 1,498 (4.5%) |
Employment Occupations by Sex in Taunton
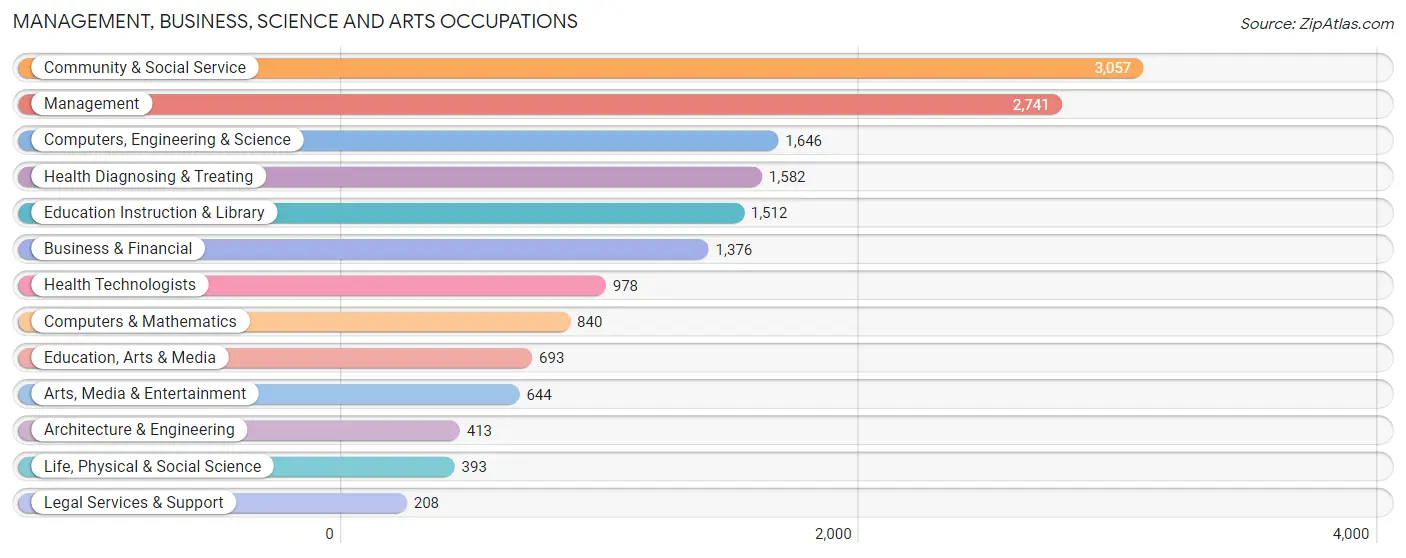
Management, Business, Science and Arts Occupations
The most common Management, Business, Science and Arts occupations in Taunton are Community & Social Service (3,057 | 10.1%), Management (2,741 | 9.0%), Computers, Engineering & Science (1,646 | 5.4%), Health Diagnosing & Treating (1,582 | 5.2%), and Education Instruction & Library (1,512 | 5.0%).
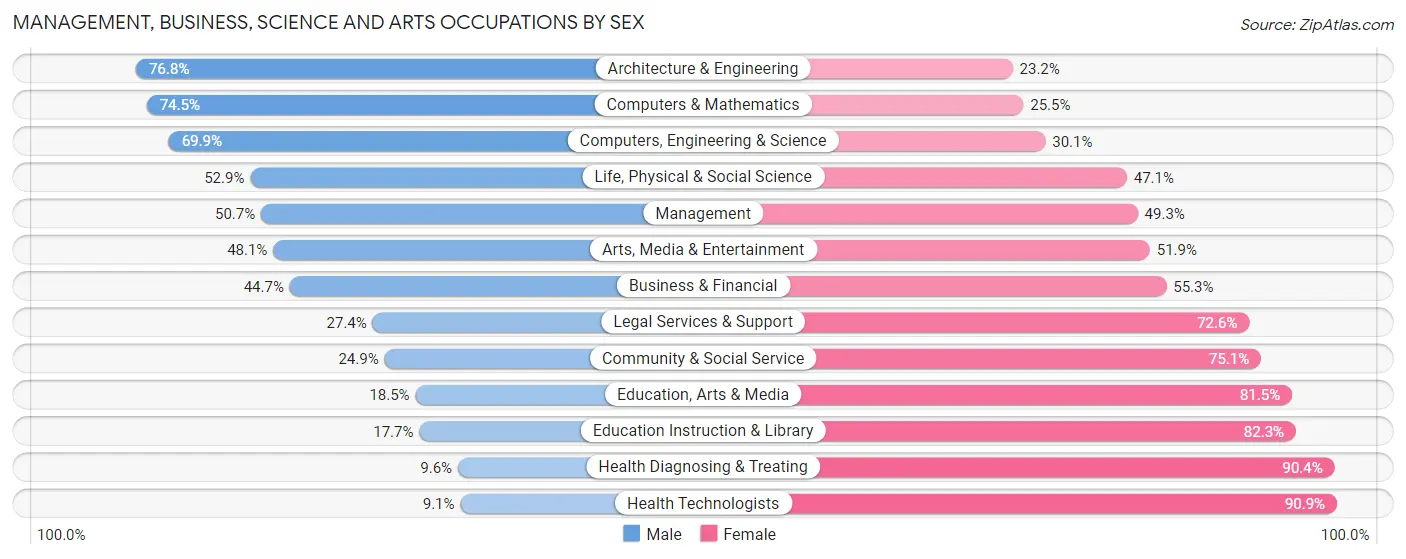
Management, Business, Science and Arts Occupations by Sex
Within the Management, Business, Science and Arts occupations in Taunton, the most male-oriented occupations are Architecture & Engineering (76.8%), Computers & Mathematics (74.5%), and Computers, Engineering & Science (69.9%), while the most female-oriented occupations are Health Technologists (90.9%), Health Diagnosing & Treating (90.4%), and Education Instruction & Library (82.3%).
| Occupation | Male | Female |
| Management | 1,389 (50.7%) | 1,352 (49.3%) |
| Business & Financial | 615 (44.7%) | 761 (55.3%) |
| Computers, Engineering & Science | 1,151 (69.9%) | 495 (30.1%) |
| Computers & Mathematics | 626 (74.5%) | 214 (25.5%) |
| Architecture & Engineering | 317 (76.8%) | 96 (23.2%) |
| Life, Physical & Social Science | 208 (52.9%) | 185 (47.1%) |
| Community & Social Service | 762 (24.9%) | 2,295 (75.1%) |
| Education, Arts & Media | 128 (18.5%) | 565 (81.5%) |
| Legal Services & Support | 57 (27.4%) | 151 (72.6%) |
| Education Instruction & Library | 267 (17.7%) | 1,245 (82.3%) |
| Arts, Media & Entertainment | 310 (48.1%) | 334 (51.9%) |
| Health Diagnosing & Treating | 152 (9.6%) | 1,430 (90.4%) |
| Health Technologists | 89 (9.1%) | 889 (90.9%) |
| Total (Category) | 4,069 (39.1%) | 6,333 (60.9%) |
| Total (Overall) | 15,316 (50.5%) | 14,987 (49.5%) |
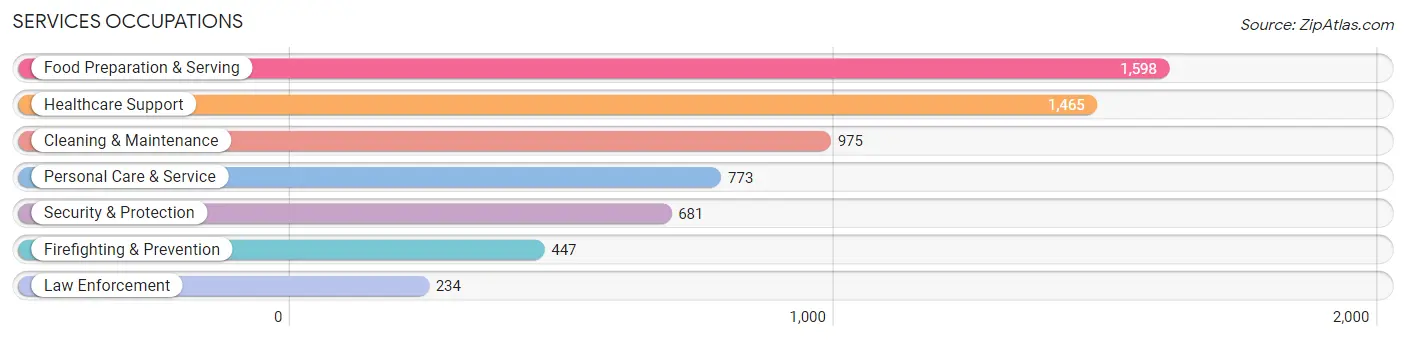
Services Occupations
The most common Services occupations in Taunton are Food Preparation & Serving (1,598 | 5.3%), Healthcare Support (1,465 | 4.8%), Cleaning & Maintenance (975 | 3.2%), Personal Care & Service (773 | 2.5%), and Security & Protection (681 | 2.2%).
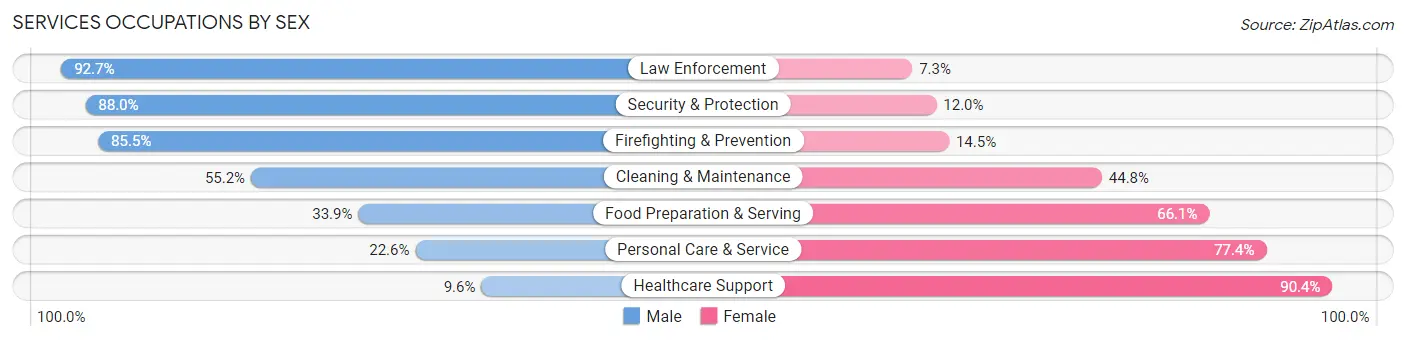
Services Occupations by Sex
Within the Services occupations in Taunton, the most male-oriented occupations are Law Enforcement (92.7%), Security & Protection (88.0%), and Firefighting & Prevention (85.5%), while the most female-oriented occupations are Healthcare Support (90.4%), Personal Care & Service (77.4%), and Food Preparation & Serving (66.1%).
| Occupation | Male | Female |
| Healthcare Support | 140 (9.6%) | 1,325 (90.4%) |
| Security & Protection | 599 (88.0%) | 82 (12.0%) |
| Firefighting & Prevention | 382 (85.5%) | 65 (14.5%) |
| Law Enforcement | 217 (92.7%) | 17 (7.3%) |
| Food Preparation & Serving | 542 (33.9%) | 1,056 (66.1%) |
| Cleaning & Maintenance | 538 (55.2%) | 437 (44.8%) |
| Personal Care & Service | 175 (22.6%) | 598 (77.4%) |
| Total (Category) | 1,994 (36.3%) | 3,498 (63.7%) |
| Total (Overall) | 15,316 (50.5%) | 14,987 (49.5%) |
Sales and Office Occupations
The most common Sales and Office occupations in Taunton are Office & Administration (3,558 | 11.7%), and Sales & Related (2,741 | 9.0%).
Sales and Office Occupations by Sex
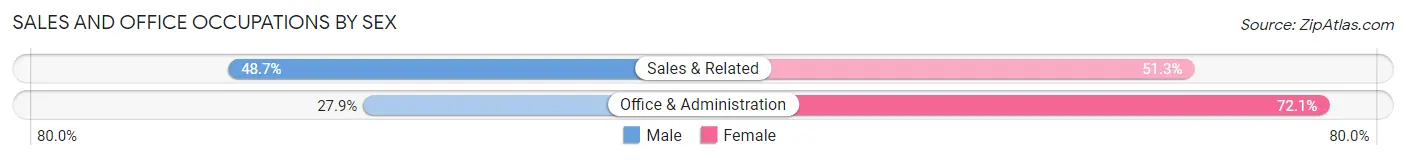
| Occupation | Male | Female |
| Sales & Related | 1,334 (48.7%) | 1,407 (51.3%) |
| Office & Administration | 993 (27.9%) | 2,565 (72.1%) |
| Total (Category) | 2,327 (36.9%) | 3,972 (63.1%) |
| Total (Overall) | 15,316 (50.5%) | 14,987 (49.5%) |
Natural Resources, Construction and Maintenance Occupations
The most common Natural Resources, Construction and Maintenance occupations in Taunton are Construction & Extraction (1,788 | 5.9%), Installation, Maintenance & Repair (1,255 | 4.1%), and Farming, Fishing & Forestry (77 | 0.3%).
Natural Resources, Construction and Maintenance Occupations by Sex
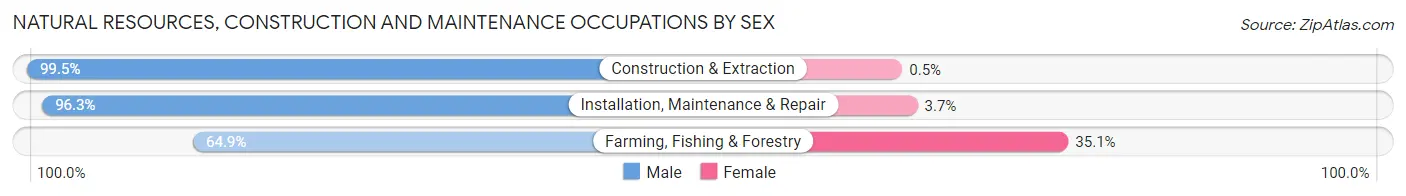
| Occupation | Male | Female |
| Farming, Fishing & Forestry | 50 (64.9%) | 27 (35.1%) |
| Construction & Extraction | 1,779 (99.5%) | 9 (0.5%) |
| Installation, Maintenance & Repair | 1,209 (96.3%) | 46 (3.7%) |
| Total (Category) | 3,038 (97.4%) | 82 (2.6%) |
| Total (Overall) | 15,316 (50.5%) | 14,987 (49.5%) |
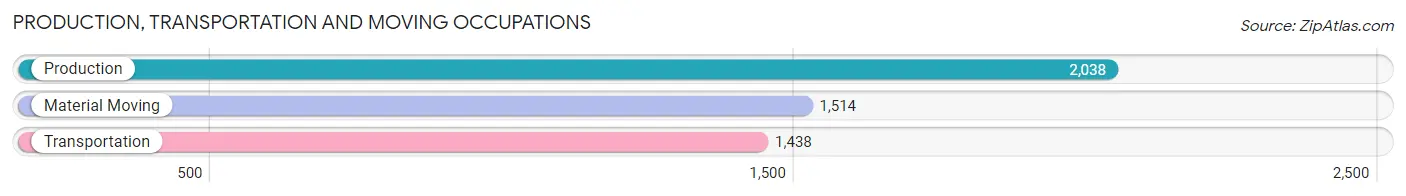
Production, Transportation and Moving Occupations
The most common Production, Transportation and Moving occupations in Taunton are Production (2,038 | 6.7%), Material Moving (1,514 | 5.0%), and Transportation (1,438 | 4.8%).
Production, Transportation and Moving Occupations by Sex
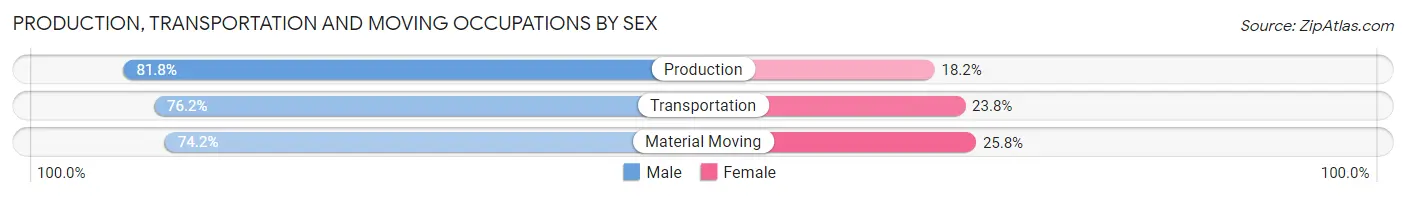
| Occupation | Male | Female |
| Production | 1,668 (81.8%) | 370 (18.2%) |
| Transportation | 1,096 (76.2%) | 342 (23.8%) |
| Material Moving | 1,124 (74.2%) | 390 (25.8%) |
| Total (Category) | 3,888 (77.9%) | 1,102 (22.1%) |
| Total (Overall) | 15,316 (50.5%) | 14,987 (49.5%) |
Employment Industries by Sex in Taunton
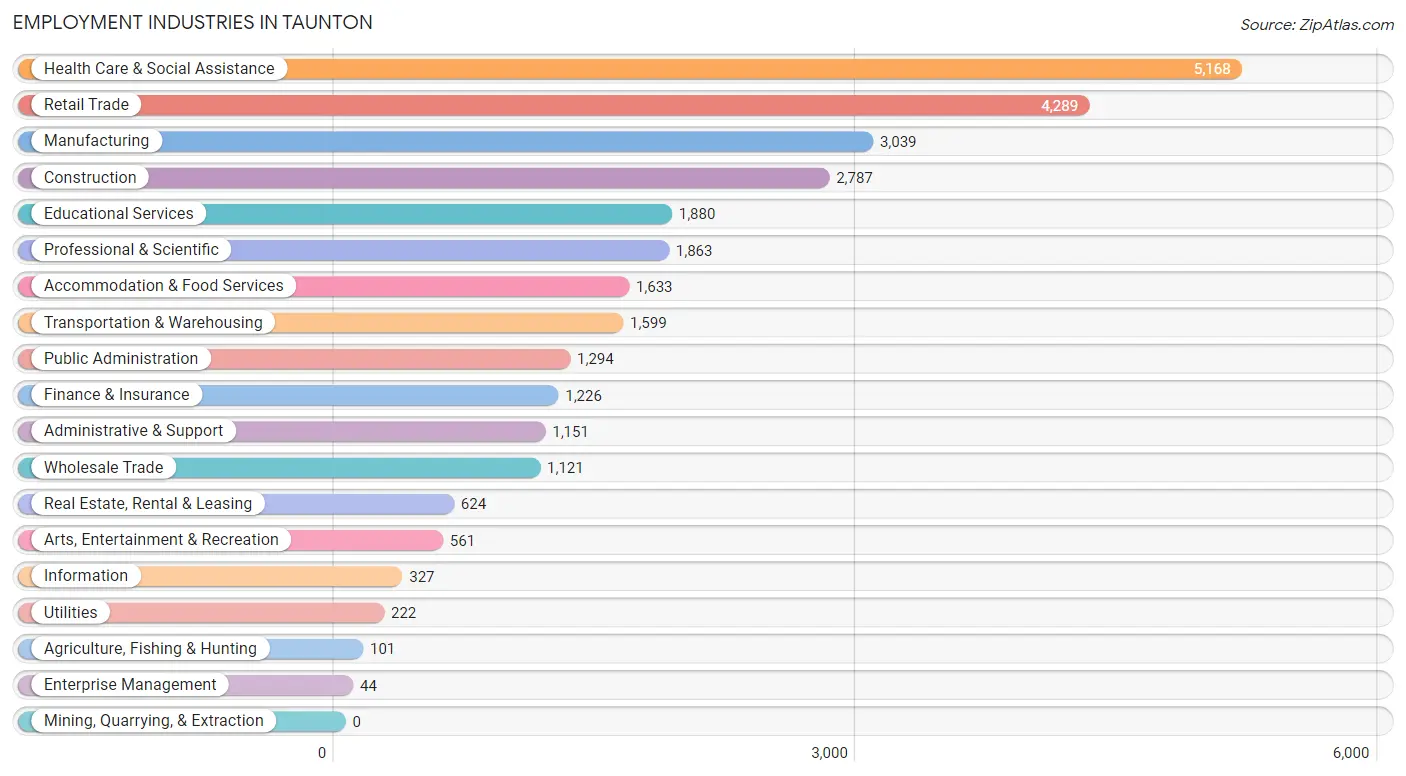
Employment Industries in Taunton
The major employment industries in Taunton include Health Care & Social Assistance (5,168 | 17.1%), Retail Trade (4,289 | 14.1%), Manufacturing (3,039 | 10.0%), Construction (2,787 | 9.2%), and Educational Services (1,880 | 6.2%).
Employment Industries by Sex in Taunton
The Taunton industries that see more men than women are Construction (94.6%), Wholesale Trade (77.6%), and Manufacturing (69.9%), whereas the industries that tend to have a higher number of women are Health Care & Social Assistance (87.4%), Educational Services (74.7%), and Agriculture, Fishing & Hunting (72.3%).
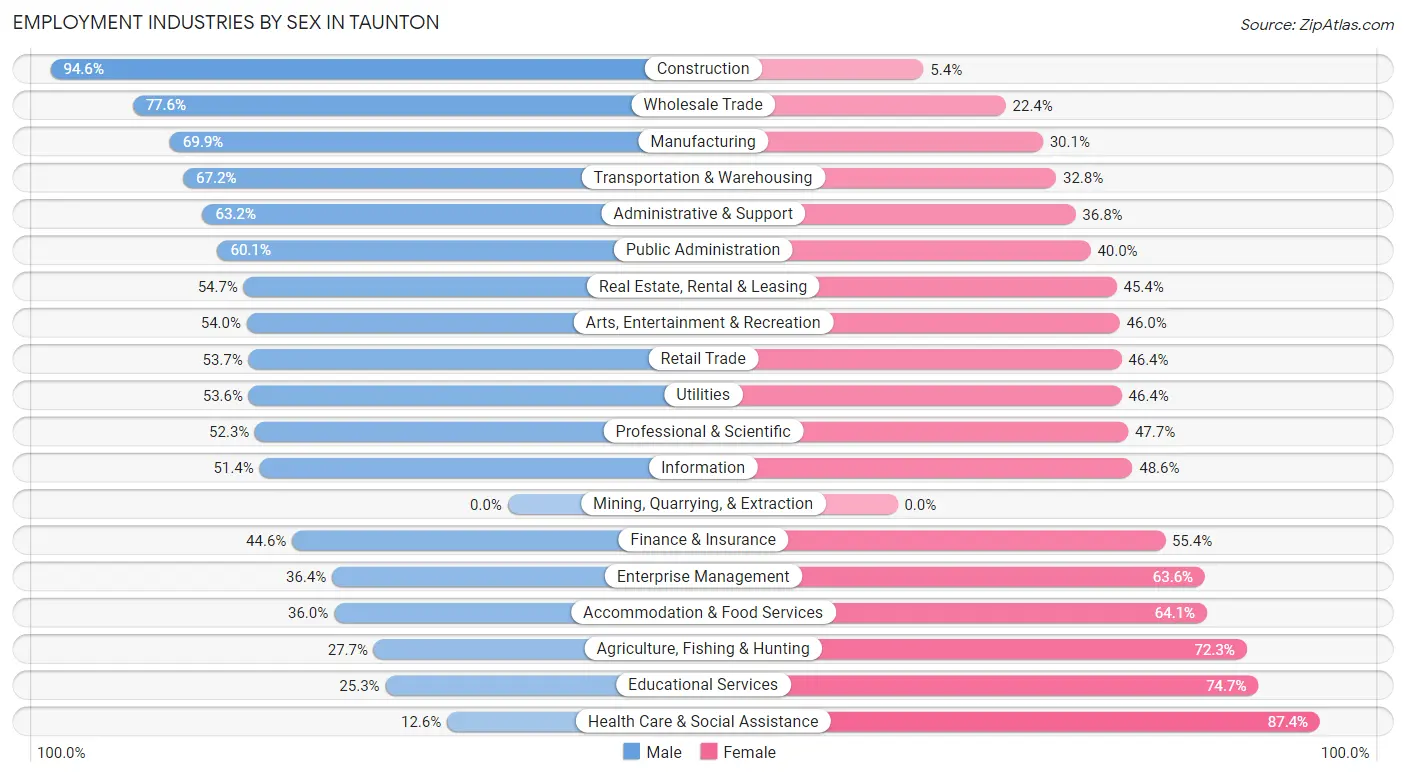
| Industry | Male | Female |
| Agriculture, Fishing & Hunting | 28 (27.7%) | 73 (72.3%) |
| Mining, Quarrying, & Extraction | 0 (0.0%) | 0 (0.0%) |
| Construction | 2,637 (94.6%) | 150 (5.4%) |
| Manufacturing | 2,125 (69.9%) | 914 (30.1%) |
| Wholesale Trade | 870 (77.6%) | 251 (22.4%) |
| Retail Trade | 2,301 (53.6%) | 1,988 (46.4%) |
| Transportation & Warehousing | 1,074 (67.2%) | 525 (32.8%) |
| Utilities | 119 (53.6%) | 103 (46.4%) |
| Information | 168 (51.4%) | 159 (48.6%) |
| Finance & Insurance | 547 (44.6%) | 679 (55.4%) |
| Real Estate, Rental & Leasing | 341 (54.6%) | 283 (45.4%) |
| Professional & Scientific | 974 (52.3%) | 889 (47.7%) |
| Enterprise Management | 16 (36.4%) | 28 (63.6%) |
| Administrative & Support | 727 (63.2%) | 424 (36.8%) |
| Educational Services | 476 (25.3%) | 1,404 (74.7%) |
| Health Care & Social Assistance | 649 (12.6%) | 4,519 (87.4%) |
| Arts, Entertainment & Recreation | 303 (54.0%) | 258 (46.0%) |
| Accommodation & Food Services | 587 (35.9%) | 1,046 (64.0%) |
| Public Administration | 777 (60.1%) | 517 (40.0%) |
| Total | 15,316 (50.5%) | 14,987 (49.5%) |
Education in Taunton
School Enrollment in Taunton
The most common levels of schooling among the 12,580 students in Taunton are middle school (3,357 | 26.7%), high school (2,748 | 21.8%), and elementary school (2,384 | 19.0%).
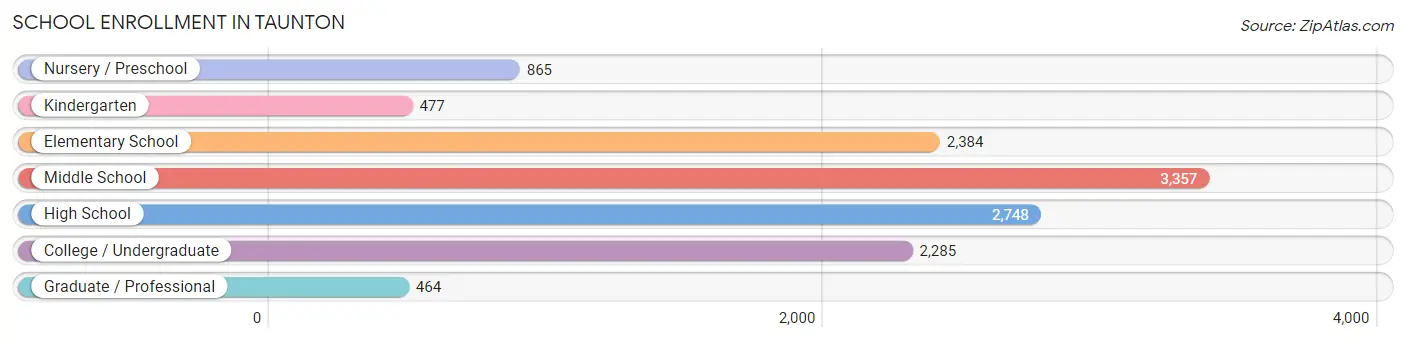
| School Level | # Students | % Students |
| Nursery / Preschool | 865 | 6.9% |
| Kindergarten | 477 | 3.8% |
| Elementary School | 2,384 | 19.0% |
| Middle School | 3,357 | 26.7% |
| High School | 2,748 | 21.8% |
| College / Undergraduate | 2,285 | 18.2% |
| Graduate / Professional | 464 | 3.7% |
| Total | 12,580 | 100.0% |
School Enrollment by Age by Funding Source in Taunton
Out of a total of 12,580 students who are enrolled in schools in Taunton, 1,610 (12.8%) attend a private institution, while the remaining 10,970 (87.2%) are enrolled in public schools. The age group of 3 to 4 year olds has the highest likelihood of being enrolled in private schools, with 289 (44.3% in the age bracket) enrolled. Conversely, the age group of 15 to 17 year olds has the lowest likelihood of being enrolled in a private school, with 1,857 (93.3% in the age bracket) attending a public institution.
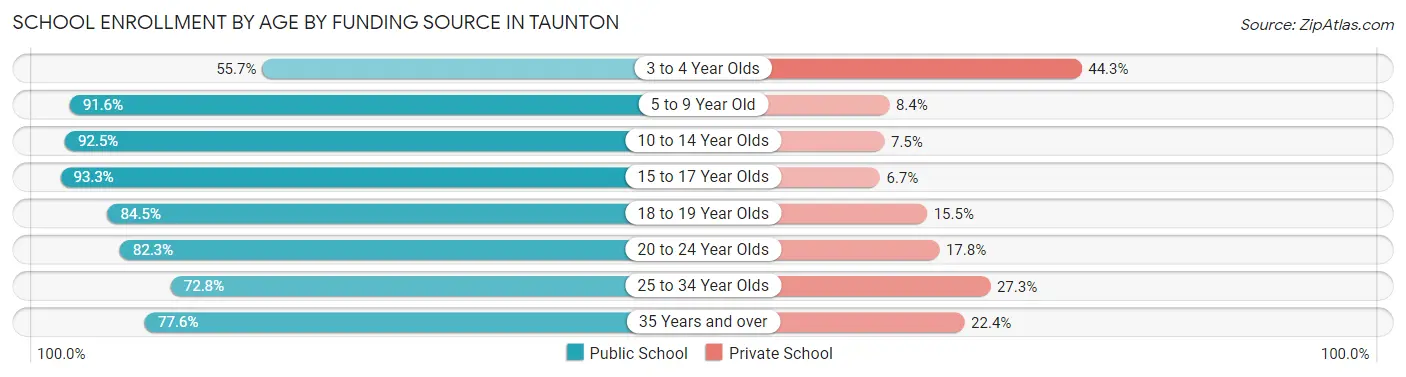
| Age Bracket | Public School | Private School |
| 3 to 4 Year Olds | 364 (55.7%) | 289 (44.3%) |
| 5 to 9 Year Old | 2,508 (91.6%) | 231 (8.4%) |
| 10 to 14 Year Olds | 3,714 (92.5%) | 302 (7.5%) |
| 15 to 17 Year Olds | 1,857 (93.3%) | 133 (6.7%) |
| 18 to 19 Year Olds | 541 (84.5%) | 99 (15.5%) |
| 20 to 24 Year Olds | 922 (82.3%) | 199 (17.7%) |
| 25 to 34 Year Olds | 622 (72.8%) | 233 (27.3%) |
| 35 Years and over | 439 (77.6%) | 127 (22.4%) |
| Total | 10,970 (87.2%) | 1,610 (12.8%) |
Educational Attainment by Field of Study in Taunton
Business (2,499 | 24.4%), education (1,140 | 11.1%), science & technology (1,118 | 10.9%), social sciences (780 | 7.6%), and arts & humanities (779 | 7.6%) are the most common fields of study among 10,235 individuals in Taunton who have obtained a bachelor's degree or higher.
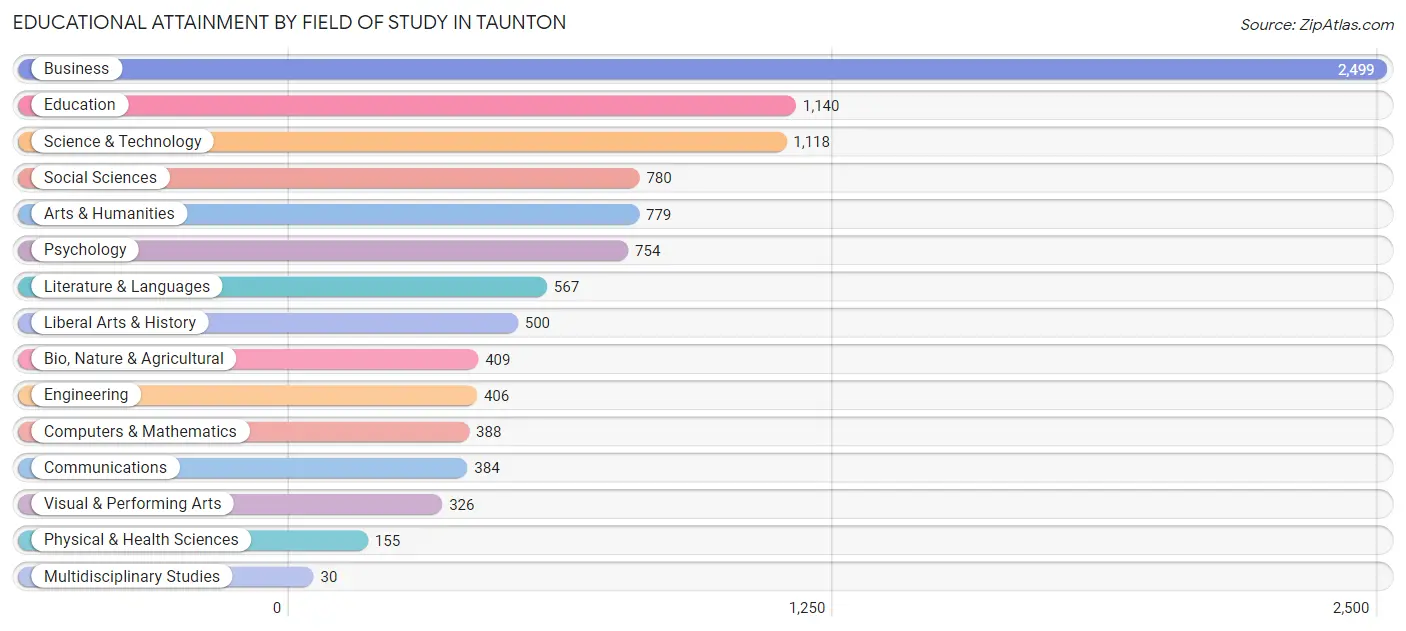
| Field of Study | # Graduates | % Graduates |
| Computers & Mathematics | 388 | 3.8% |
| Bio, Nature & Agricultural | 409 | 4.0% |
| Physical & Health Sciences | 155 | 1.5% |
| Psychology | 754 | 7.4% |
| Social Sciences | 780 | 7.6% |
| Engineering | 406 | 4.0% |
| Multidisciplinary Studies | 30 | 0.3% |
| Science & Technology | 1,118 | 10.9% |
| Business | 2,499 | 24.4% |
| Education | 1,140 | 11.1% |
| Literature & Languages | 567 | 5.5% |
| Liberal Arts & History | 500 | 4.9% |
| Visual & Performing Arts | 326 | 3.2% |
| Communications | 384 | 3.7% |
| Arts & Humanities | 779 | 7.6% |
| Total | 10,235 | 100.0% |
Transportation & Commute in Taunton
Vehicle Availability by Sex in Taunton
The most prevalent vehicle ownership categories in Taunton are males with 2 vehicles (5,532, accounting for 37.0%) and females with 2 vehicles (5,384, making up 37.9%).
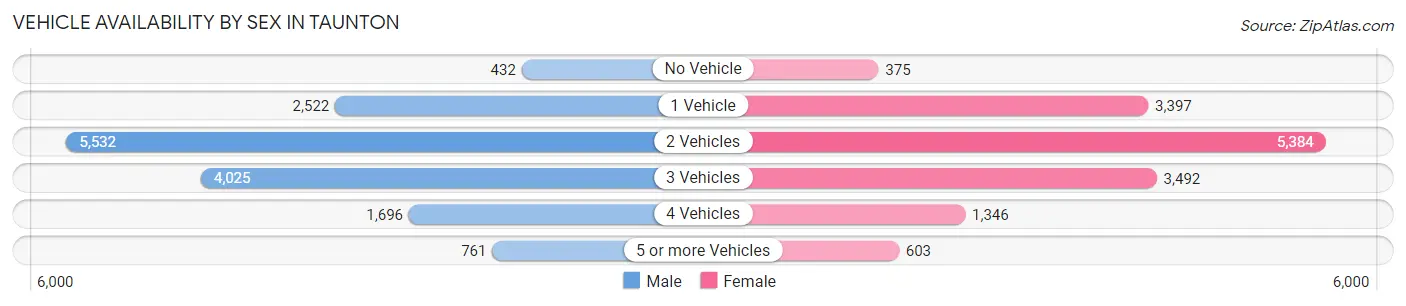
| Vehicles Available | Male | Female |
| No Vehicle | 432 (2.9%) | 375 (2.6%) |
| 1 Vehicle | 2,522 (16.9%) | 3,397 (23.3%) |
| 2 Vehicles | 5,532 (37.0%) | 5,384 (36.9%) |
| 3 Vehicles | 4,025 (26.9%) | 3,492 (23.9%) |
| 4 Vehicles | 1,696 (11.3%) | 1,346 (9.2%) |
| 5 or more Vehicles | 761 (5.1%) | 603 (4.1%) |
| Total | 14,968 (100.0%) | 14,597 (100.0%) |
Commute Time in Taunton
The most frequently occuring commute durations in Taunton are 30 to 34 minutes (4,304 commuters, 15.3%), 15 to 19 minutes (4,087 commuters, 14.6%), and 10 to 14 minutes (3,714 commuters, 13.3%).
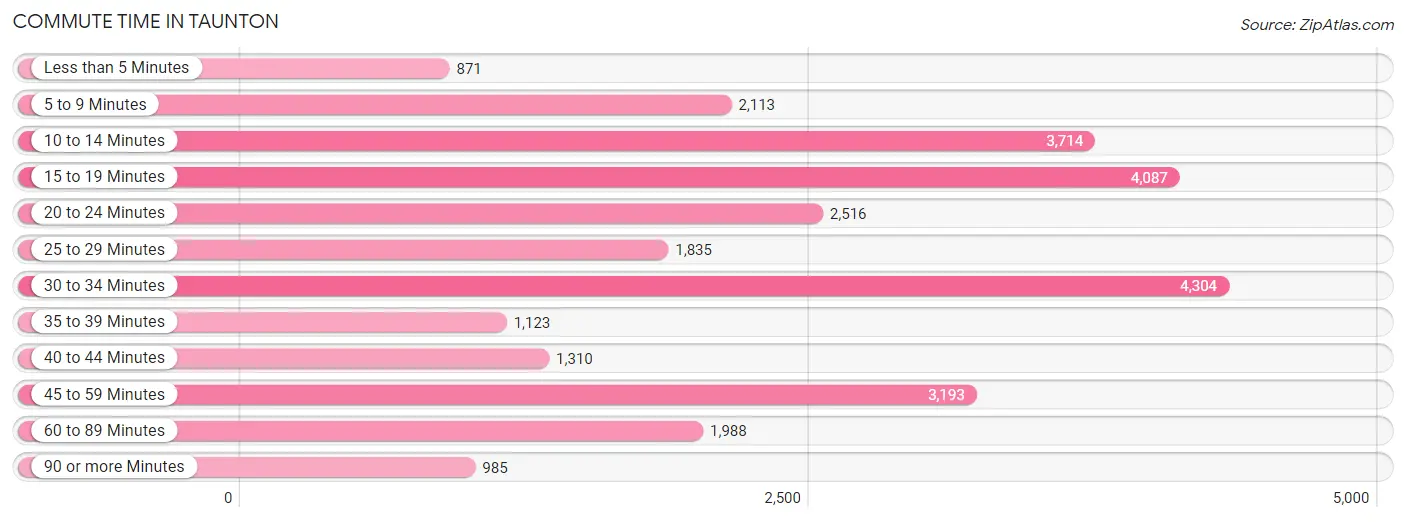
| Commute Time | # Commuters | % Commuters |
| Less than 5 Minutes | 871 | 3.1% |
| 5 to 9 Minutes | 2,113 | 7.5% |
| 10 to 14 Minutes | 3,714 | 13.3% |
| 15 to 19 Minutes | 4,087 | 14.6% |
| 20 to 24 Minutes | 2,516 | 9.0% |
| 25 to 29 Minutes | 1,835 | 6.5% |
| 30 to 34 Minutes | 4,304 | 15.3% |
| 35 to 39 Minutes | 1,123 | 4.0% |
| 40 to 44 Minutes | 1,310 | 4.7% |
| 45 to 59 Minutes | 3,193 | 11.4% |
| 60 to 89 Minutes | 1,988 | 7.1% |
| 90 or more Minutes | 985 | 3.5% |
Commute Time by Sex in Taunton
The most common commute times in Taunton are 30 to 34 minutes (2,428 commuters, 16.9%) for males and 15 to 19 minutes (2,035 commuters, 14.9%) for females.
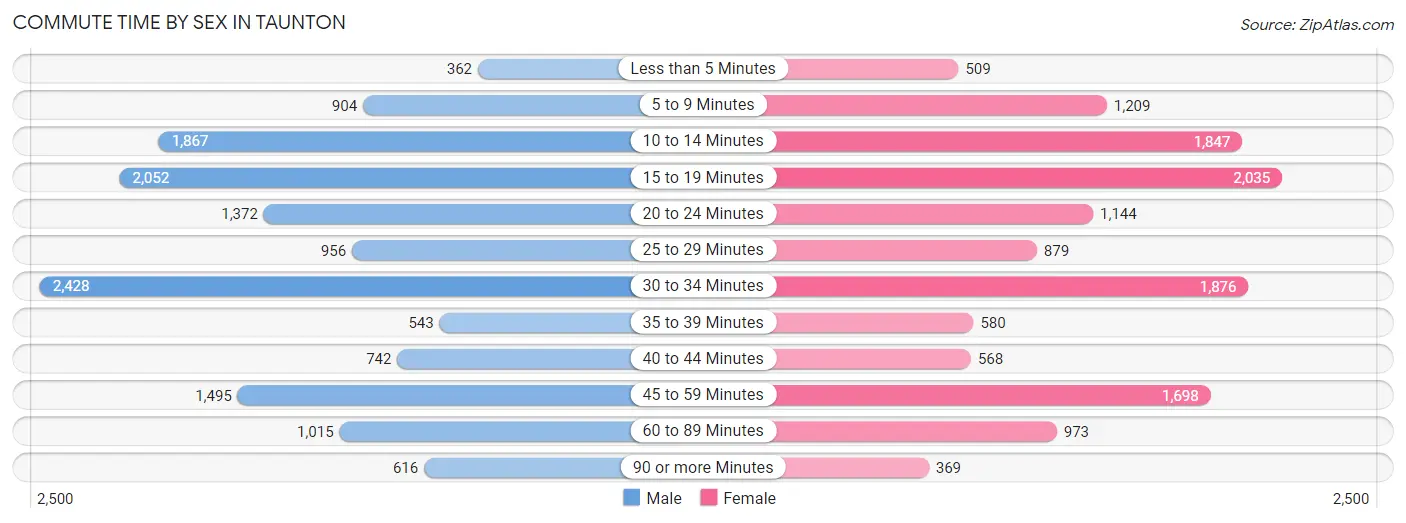
| Commute Time | Male | Female |
| Less than 5 Minutes | 362 (2.5%) | 509 (3.7%) |
| 5 to 9 Minutes | 904 (6.3%) | 1,209 (8.8%) |
| 10 to 14 Minutes | 1,867 (13.0%) | 1,847 (13.5%) |
| 15 to 19 Minutes | 2,052 (14.3%) | 2,035 (14.9%) |
| 20 to 24 Minutes | 1,372 (9.6%) | 1,144 (8.4%) |
| 25 to 29 Minutes | 956 (6.7%) | 879 (6.4%) |
| 30 to 34 Minutes | 2,428 (16.9%) | 1,876 (13.7%) |
| 35 to 39 Minutes | 543 (3.8%) | 580 (4.2%) |
| 40 to 44 Minutes | 742 (5.2%) | 568 (4.2%) |
| 45 to 59 Minutes | 1,495 (10.4%) | 1,698 (12.4%) |
| 60 to 89 Minutes | 1,015 (7.1%) | 973 (7.1%) |
| 90 or more Minutes | 616 (4.3%) | 369 (2.7%) |
Time of Departure to Work by Sex in Taunton
The most frequent times of departure to work in Taunton are 6:30 AM to 6:59 AM (1,644, 11.5%) for males and 7:00 AM to 7:29 AM (2,016, 14.7%) for females.
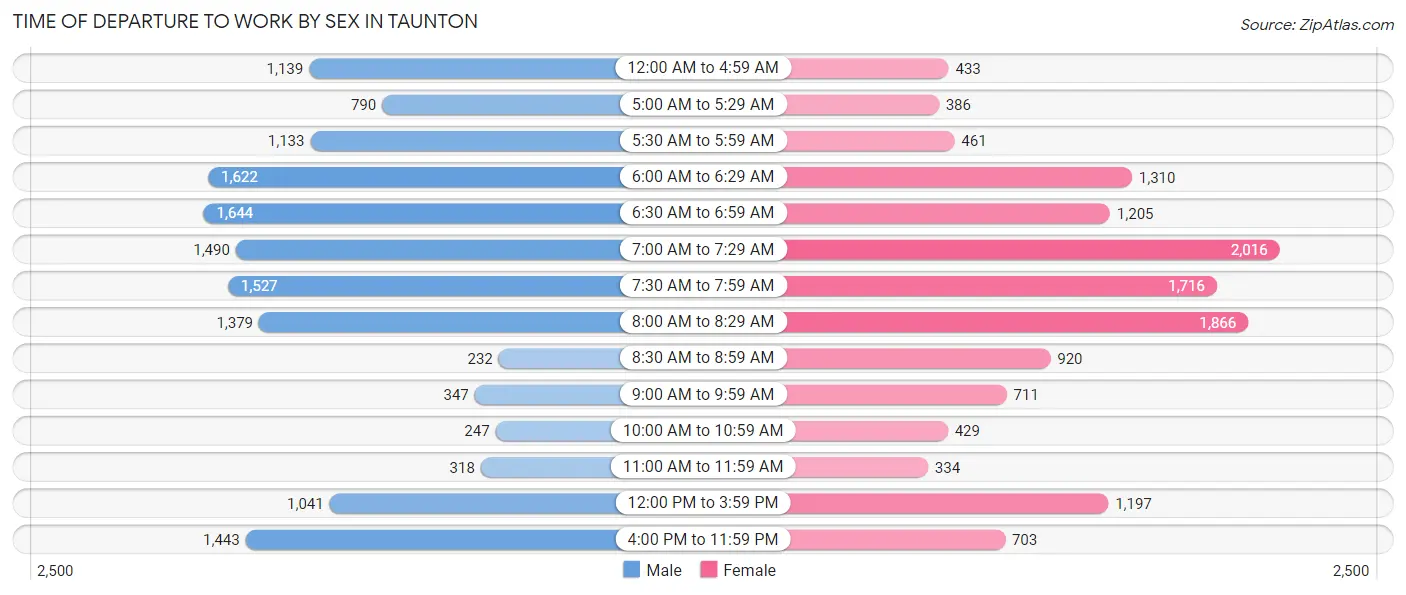
| Time of Departure | Male | Female |
| 12:00 AM to 4:59 AM | 1,139 (7.9%) | 433 (3.2%) |
| 5:00 AM to 5:29 AM | 790 (5.5%) | 386 (2.8%) |
| 5:30 AM to 5:59 AM | 1,133 (7.9%) | 461 (3.4%) |
| 6:00 AM to 6:29 AM | 1,622 (11.3%) | 1,310 (9.6%) |
| 6:30 AM to 6:59 AM | 1,644 (11.5%) | 1,205 (8.8%) |
| 7:00 AM to 7:29 AM | 1,490 (10.4%) | 2,016 (14.7%) |
| 7:30 AM to 7:59 AM | 1,527 (10.6%) | 1,716 (12.5%) |
| 8:00 AM to 8:29 AM | 1,379 (9.6%) | 1,866 (13.6%) |
| 8:30 AM to 8:59 AM | 232 (1.6%) | 920 (6.7%) |
| 9:00 AM to 9:59 AM | 347 (2.4%) | 711 (5.2%) |
| 10:00 AM to 10:59 AM | 247 (1.7%) | 429 (3.1%) |
| 11:00 AM to 11:59 AM | 318 (2.2%) | 334 (2.4%) |
| 12:00 PM to 3:59 PM | 1,041 (7.2%) | 1,197 (8.7%) |
| 4:00 PM to 11:59 PM | 1,443 (10.1%) | 703 (5.1%) |
| Total | 14,352 (100.0%) | 13,687 (100.0%) |
Housing Occupancy in Taunton
Occupancy by Ownership in Taunton
Of the total 23,835 dwellings in Taunton, owner-occupied units account for 14,719 (61.8%), while renter-occupied units make up 9,116 (38.3%).
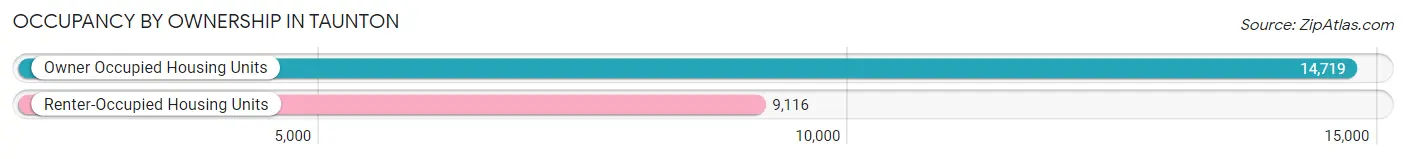
| Occupancy | # Housing Units | % Housing Units |
| Owner Occupied Housing Units | 14,719 | 61.8% |
| Renter-Occupied Housing Units | 9,116 | 38.3% |
| Total Occupied Housing Units | 23,835 | 100.0% |
Occupancy by Household Size in Taunton
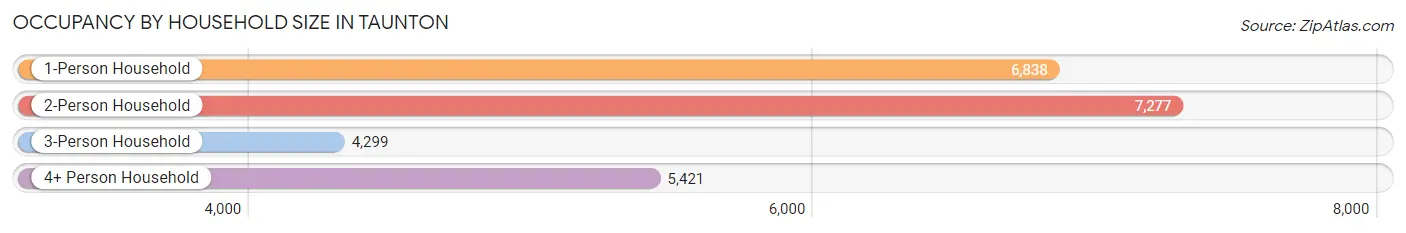
| Household Size | # Housing Units | % Housing Units |
| 1-Person Household | 6,838 | 28.7% |
| 2-Person Household | 7,277 | 30.5% |
| 3-Person Household | 4,299 | 18.0% |
| 4+ Person Household | 5,421 | 22.7% |
| Total Housing Units | 23,835 | 100.0% |
Occupancy by Ownership by Household Size in Taunton
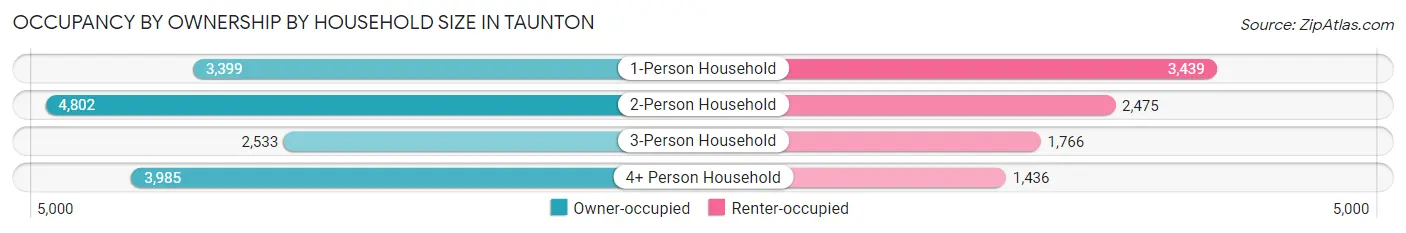
| Household Size | Owner-occupied | Renter-occupied |
| 1-Person Household | 3,399 (49.7%) | 3,439 (50.3%) |
| 2-Person Household | 4,802 (66.0%) | 2,475 (34.0%) |
| 3-Person Household | 2,533 (58.9%) | 1,766 (41.1%) |
| 4+ Person Household | 3,985 (73.5%) | 1,436 (26.5%) |
| Total Housing Units | 14,719 (61.8%) | 9,116 (38.3%) |
Occupancy by Educational Attainment in Taunton
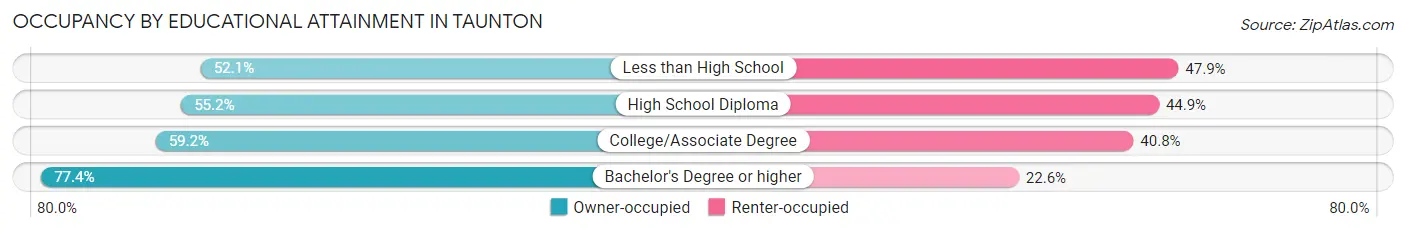
| Household Size | Owner-occupied | Renter-occupied |
| Less than High School | 1,639 (52.1%) | 1,509 (47.9%) |
| High School Diploma | 3,944 (55.1%) | 3,208 (44.9%) |
| College/Associate Degree | 4,350 (59.2%) | 2,998 (40.8%) |
| Bachelor's Degree or higher | 4,786 (77.4%) | 1,401 (22.6%) |
Occupancy by Age of Householder in Taunton
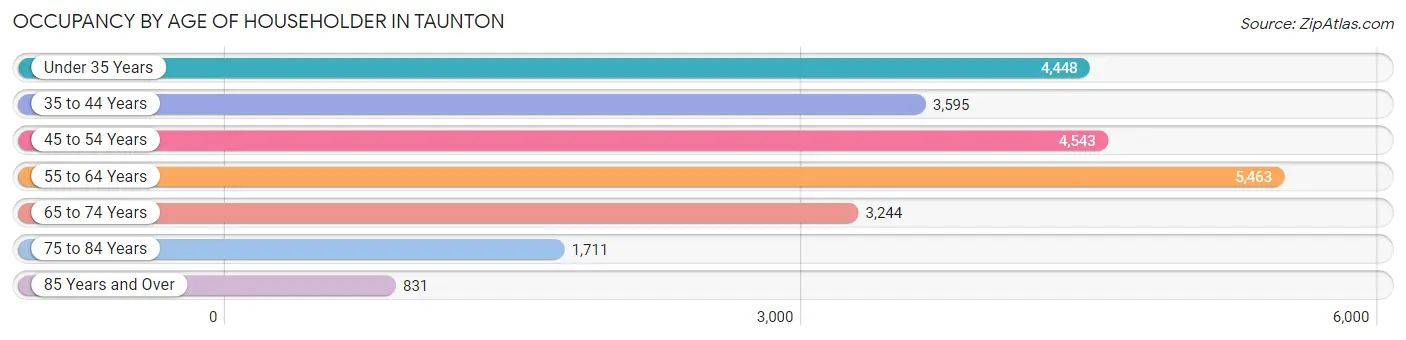
| Age Bracket | # Households | % Households |
| Under 35 Years | 4,448 | 18.7% |
| 35 to 44 Years | 3,595 | 15.1% |
| 45 to 54 Years | 4,543 | 19.1% |
| 55 to 64 Years | 5,463 | 22.9% |
| 65 to 74 Years | 3,244 | 13.6% |
| 75 to 84 Years | 1,711 | 7.2% |
| 85 Years and Over | 831 | 3.5% |
| Total | 23,835 | 100.0% |
Housing Finances in Taunton
Median Income by Occupancy in Taunton
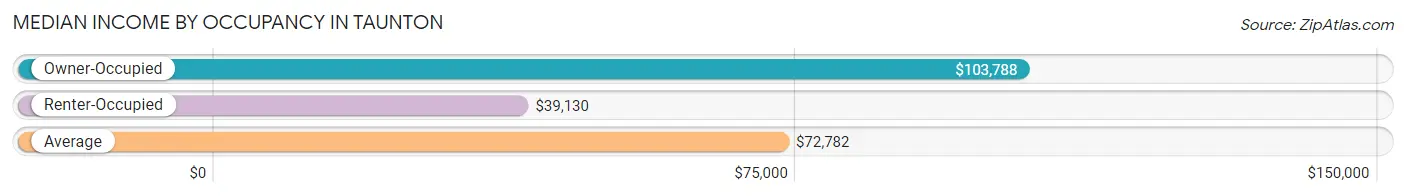
| Occupancy Type | # Households | Median Income |
| Owner-Occupied | 14,719 (61.8%) | $103,788 |
| Renter-Occupied | 9,116 (38.3%) | $39,130 |
| Average | 23,835 (100.0%) | $72,782 |
Occupancy by Householder Income Bracket in Taunton
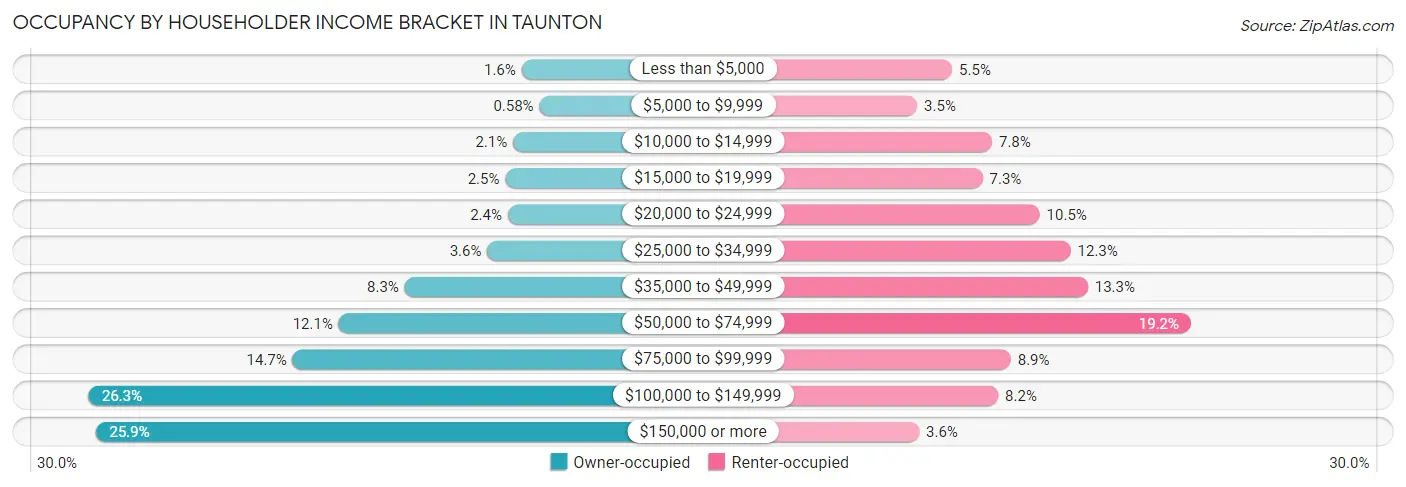
| Income Bracket | Owner-occupied | Renter-occupied |
| Less than $5,000 | 236 (1.6%) | 503 (5.5%) |
| $5,000 to $9,999 | 86 (0.6%) | 321 (3.5%) |
| $10,000 to $14,999 | 308 (2.1%) | 711 (7.8%) |
| $15,000 to $19,999 | 372 (2.5%) | 662 (7.3%) |
| $20,000 to $24,999 | 352 (2.4%) | 959 (10.5%) |
| $25,000 to $34,999 | 524 (3.6%) | 1,120 (12.3%) |
| $35,000 to $49,999 | 1,218 (8.3%) | 1,210 (13.3%) |
| $50,000 to $74,999 | 1,773 (12.0%) | 1,747 (19.2%) |
| $75,000 to $99,999 | 2,162 (14.7%) | 809 (8.9%) |
| $100,000 to $149,999 | 3,876 (26.3%) | 743 (8.2%) |
| $150,000 or more | 3,812 (25.9%) | 331 (3.6%) |
| Total | 14,719 (100.0%) | 9,116 (100.0%) |
Monthly Housing Cost Tiers in Taunton
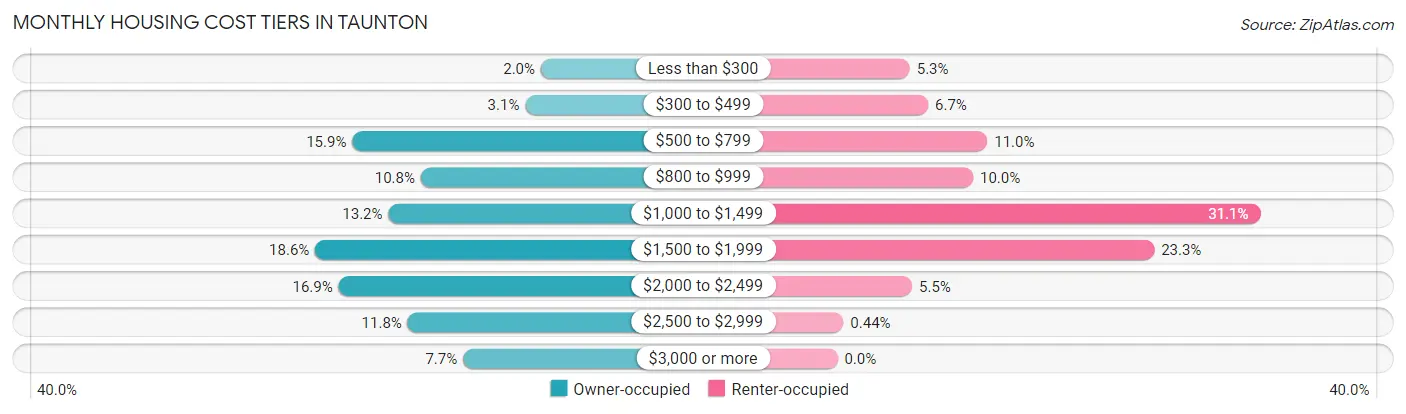
| Monthly Cost | Owner-occupied | Renter-occupied |
| Less than $300 | 292 (2.0%) | 486 (5.3%) |
| $300 to $499 | 461 (3.1%) | 609 (6.7%) |
| $500 to $799 | 2,336 (15.9%) | 1,006 (11.0%) |
| $800 to $999 | 1,592 (10.8%) | 911 (10.0%) |
| $1,000 to $1,499 | 1,945 (13.2%) | 2,839 (31.1%) |
| $1,500 to $1,999 | 2,738 (18.6%) | 2,127 (23.3%) |
| $2,000 to $2,499 | 2,484 (16.9%) | 501 (5.5%) |
| $2,500 to $2,999 | 1,736 (11.8%) | 40 (0.4%) |
| $3,000 or more | 1,135 (7.7%) | 0 (0.0%) |
| Total | 14,719 (100.0%) | 9,116 (100.0%) |
Physical Housing Characteristics in Taunton
Housing Structures in Taunton
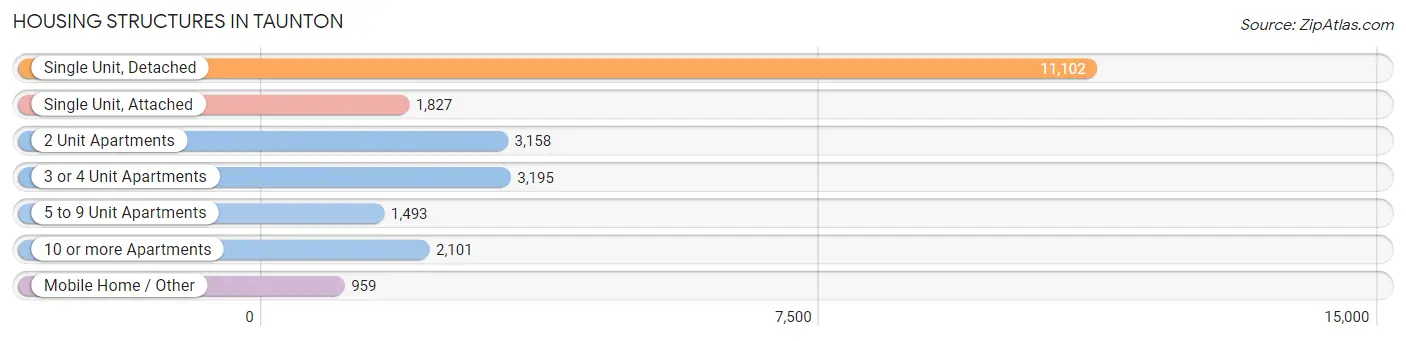
| Structure Type | # Housing Units | % Housing Units |
| Single Unit, Detached | 11,102 | 46.6% |
| Single Unit, Attached | 1,827 | 7.7% |
| 2 Unit Apartments | 3,158 | 13.3% |
| 3 or 4 Unit Apartments | 3,195 | 13.4% |
| 5 to 9 Unit Apartments | 1,493 | 6.3% |
| 10 or more Apartments | 2,101 | 8.8% |
| Mobile Home / Other | 959 | 4.0% |
| Total | 23,835 | 100.0% |
Housing Structures by Occupancy in Taunton
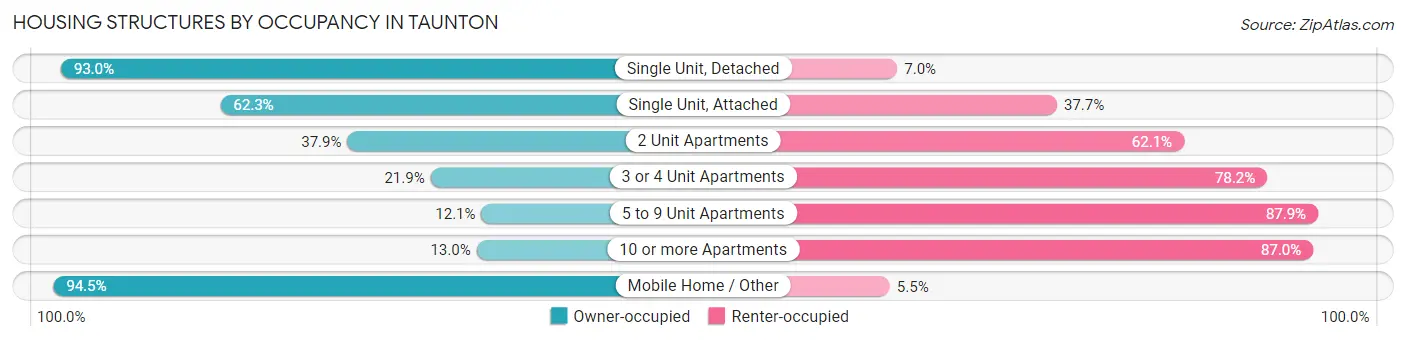
| Structure Type | Owner-occupied | Renter-occupied |
| Single Unit, Detached | 10,328 (93.0%) | 774 (7.0%) |
| Single Unit, Attached | 1,138 (62.3%) | 689 (37.7%) |
| 2 Unit Apartments | 1,196 (37.9%) | 1,962 (62.1%) |
| 3 or 4 Unit Apartments | 698 (21.8%) | 2,497 (78.1%) |
| 5 to 9 Unit Apartments | 180 (12.1%) | 1,313 (87.9%) |
| 10 or more Apartments | 273 (13.0%) | 1,828 (87.0%) |
| Mobile Home / Other | 906 (94.5%) | 53 (5.5%) |
| Total | 14,719 (61.8%) | 9,116 (38.3%) |
Housing Structures by Number of Rooms in Taunton
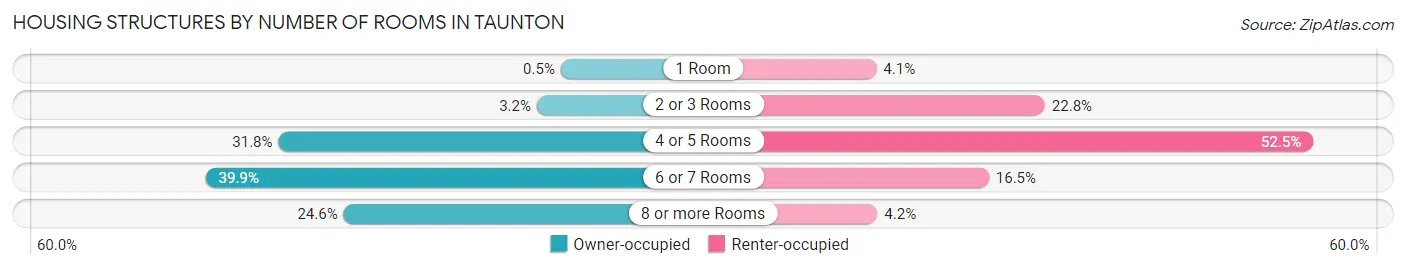
| Number of Rooms | Owner-occupied | Renter-occupied |
| 1 Room | 73 (0.5%) | 369 (4.1%) |
| 2 or 3 Rooms | 463 (3.2%) | 2,074 (22.8%) |
| 4 or 5 Rooms | 4,686 (31.8%) | 4,787 (52.5%) |
| 6 or 7 Rooms | 5,875 (39.9%) | 1,507 (16.5%) |
| 8 or more Rooms | 3,622 (24.6%) | 379 (4.2%) |
| Total | 14,719 (100.0%) | 9,116 (100.0%) |
Housing Structure by Heating Type in Taunton
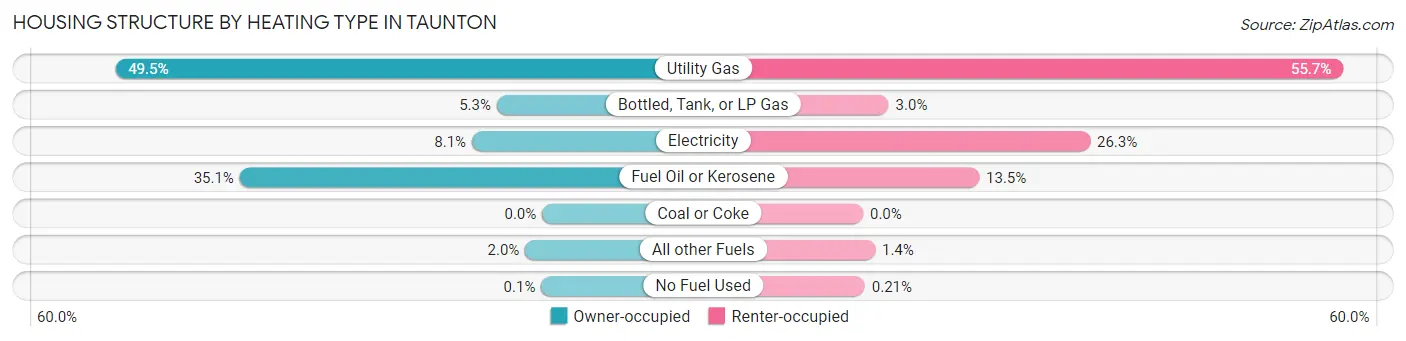
| Heating Type | Owner-occupied | Renter-occupied |
| Utility Gas | 7,284 (49.5%) | 5,073 (55.6%) |
| Bottled, Tank, or LP Gas | 773 (5.2%) | 271 (3.0%) |
| Electricity | 1,198 (8.1%) | 2,399 (26.3%) |
| Fuel Oil or Kerosene | 5,160 (35.1%) | 1,227 (13.5%) |
| Coal or Coke | 0 (0.0%) | 0 (0.0%) |
| All other Fuels | 289 (2.0%) | 127 (1.4%) |
| No Fuel Used | 15 (0.1%) | 19 (0.2%) |
| Total | 14,719 (100.0%) | 9,116 (100.0%) |
Household Vehicle Usage in Taunton
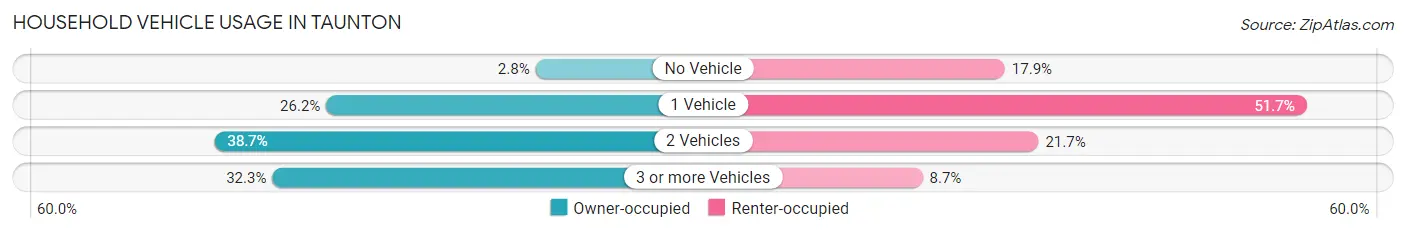
| Vehicles per Household | Owner-occupied | Renter-occupied |
| No Vehicle | 408 (2.8%) | 1,634 (17.9%) |
| 1 Vehicle | 3,860 (26.2%) | 4,713 (51.7%) |
| 2 Vehicles | 5,702 (38.7%) | 1,976 (21.7%) |
| 3 or more Vehicles | 4,749 (32.3%) | 793 (8.7%) |
| Total | 14,719 (100.0%) | 9,116 (100.0%) |
Real Estate & Mortgages in Taunton
Real Estate and Mortgage Overview in Taunton
| Characteristic | Without Mortgage | With Mortgage |
| Housing Units | 5,574 | 9,145 |
| Median Property Value | $339,600 | $372,300 |
| Median Household Income | $76,100 | $2,863 |
| Monthly Housing Costs | $789 | $1,106 |
| Real Estate Taxes | $4,120 | $362 |
Property Value by Mortgage Status in Taunton
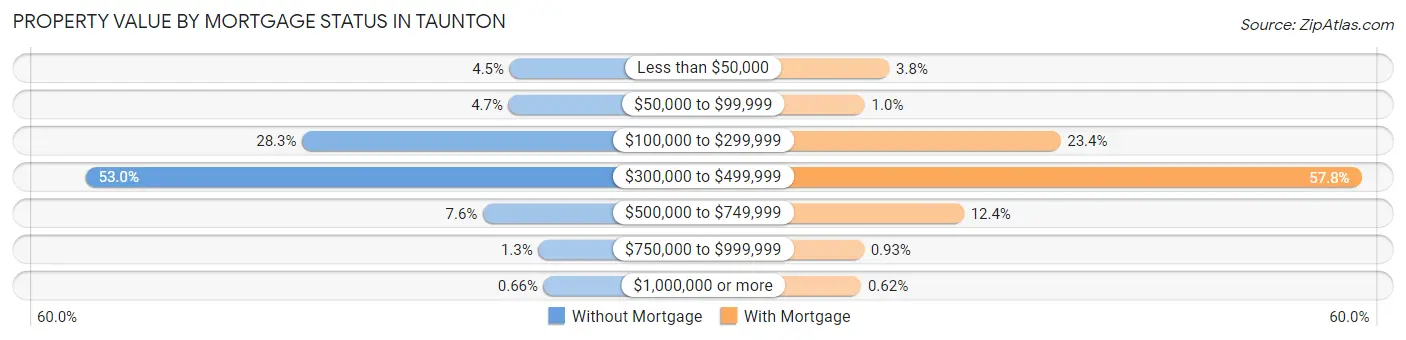
| Property Value | Without Mortgage | With Mortgage |
| Less than $50,000 | 253 (4.5%) | 351 (3.8%) |
| $50,000 to $99,999 | 260 (4.7%) | 95 (1.0%) |
| $100,000 to $299,999 | 1,575 (28.3%) | 2,140 (23.4%) |
| $300,000 to $499,999 | 2,956 (53.0%) | 5,287 (57.8%) |
| $500,000 to $749,999 | 423 (7.6%) | 1,130 (12.4%) |
| $750,000 to $999,999 | 70 (1.3%) | 85 (0.9%) |
| $1,000,000 or more | 37 (0.7%) | 57 (0.6%) |
| Total | 5,574 (100.0%) | 9,145 (100.0%) |
Household Income by Mortgage Status in Taunton
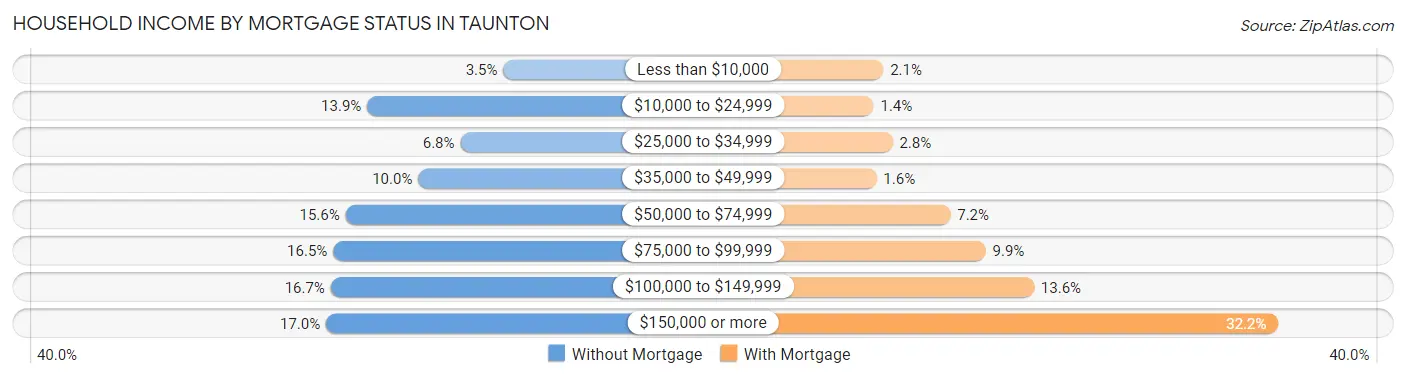
| Household Income | Without Mortgage | With Mortgage |
| Less than $10,000 | 197 (3.5%) | 193 (2.1%) |
| $10,000 to $24,999 | 775 (13.9%) | 125 (1.4%) |
| $25,000 to $34,999 | 379 (6.8%) | 257 (2.8%) |
| $35,000 to $49,999 | 558 (10.0%) | 145 (1.6%) |
| $50,000 to $74,999 | 867 (15.5%) | 660 (7.2%) |
| $75,000 to $99,999 | 919 (16.5%) | 906 (9.9%) |
| $100,000 to $149,999 | 930 (16.7%) | 1,243 (13.6%) |
| $150,000 or more | 949 (17.0%) | 2,946 (32.2%) |
| Total | 5,574 (100.0%) | 9,145 (100.0%) |
Property Value to Household Income Ratio in Taunton
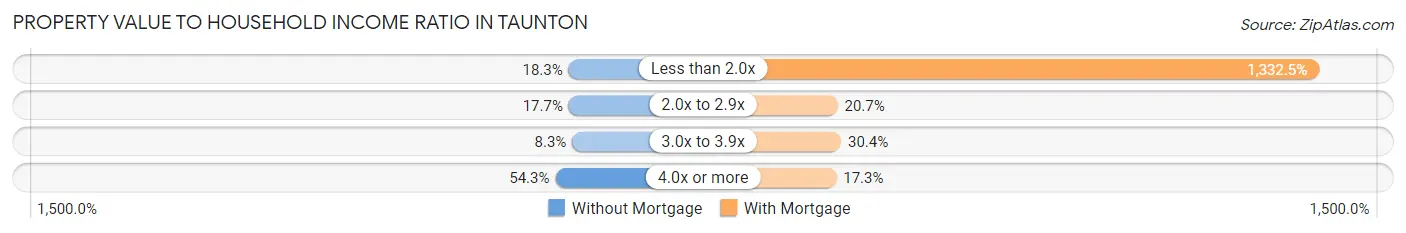
| Value-to-Income Ratio | Without Mortgage | With Mortgage |
| Less than 2.0x | 1,018 (18.3%) | 121,859 (1,332.5%) |
| 2.0x to 2.9x | 987 (17.7%) | 1,889 (20.7%) |
| 3.0x to 3.9x | 465 (8.3%) | 2,778 (30.4%) |
| 4.0x or more | 3,029 (54.3%) | 1,581 (17.3%) |
| Total | 5,574 (100.0%) | 9,145 (100.0%) |
Real Estate Taxes by Mortgage Status in Taunton
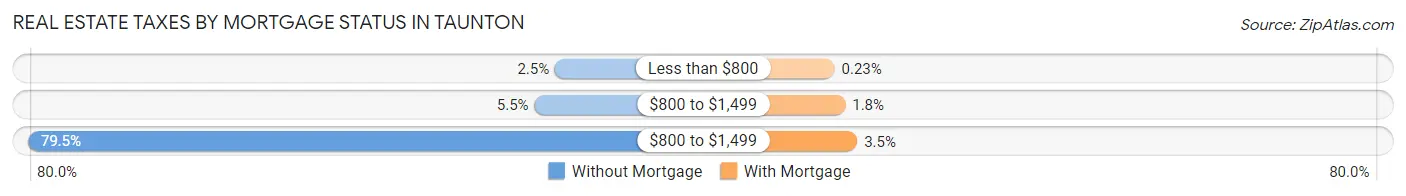
| Property Taxes | Without Mortgage | With Mortgage |
| Less than $800 | 139 (2.5%) | 21 (0.2%) |
| $800 to $1,499 | 307 (5.5%) | 164 (1.8%) |
| $800 to $1,499 | 4,433 (79.5%) | 323 (3.5%) |
| Total | 5,574 (100.0%) | 9,145 (100.0%) |
Health & Disability in Taunton
Health Insurance Coverage by Age in Taunton
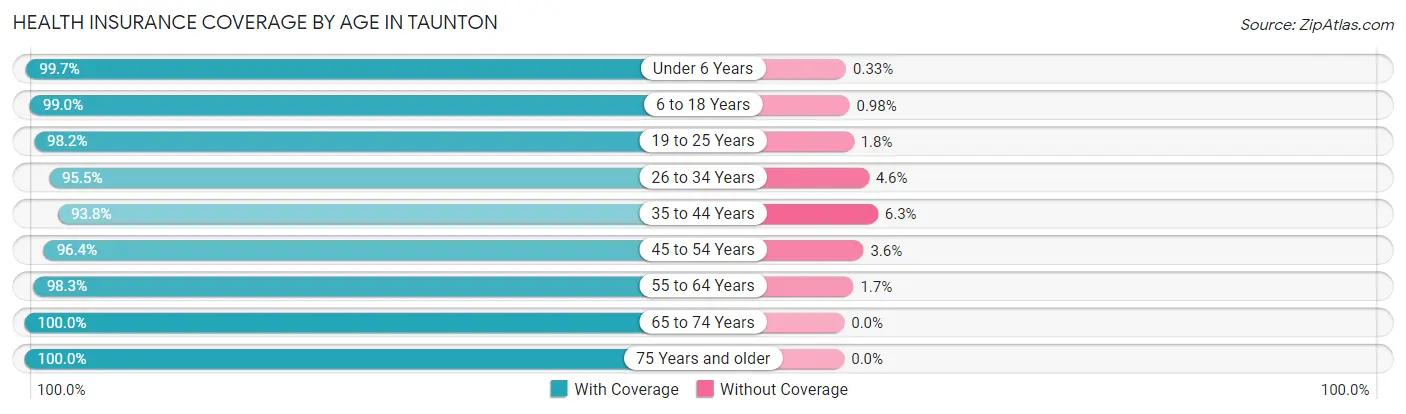
| Age Bracket | With Coverage | Without Coverage |
| Under 6 Years | 3,904 (99.7%) | 13 (0.3%) |
| 6 to 18 Years | 9,000 (99.0%) | 89 (1.0%) |
| 19 to 25 Years | 4,529 (98.2%) | 81 (1.8%) |
| 26 to 34 Years | 7,845 (95.5%) | 374 (4.5%) |
| 35 to 44 Years | 6,633 (93.8%) | 442 (6.2%) |
| 45 to 54 Years | 7,647 (96.4%) | 284 (3.6%) |
| 55 to 64 Years | 9,314 (98.3%) | 162 (1.7%) |
| 65 to 74 Years | 4,852 (100.0%) | 0 (0.0%) |
| 75 Years and older | 3,884 (100.0%) | 0 (0.0%) |
| Total | 57,608 (97.6%) | 1,445 (2.5%) |
Health Insurance Coverage by Citizenship Status in Taunton
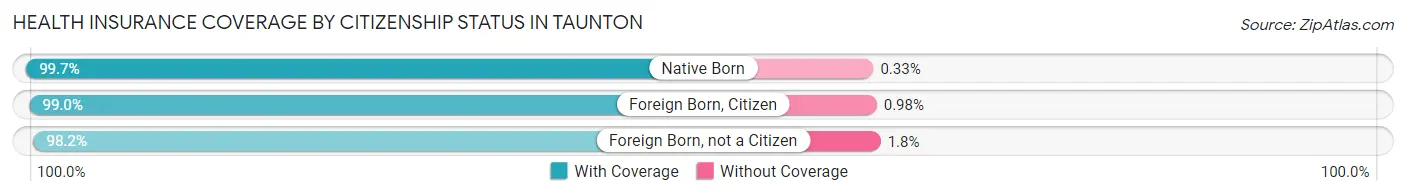
| Citizenship Status | With Coverage | Without Coverage |
| Native Born | 3,904 (99.7%) | 13 (0.3%) |
| Foreign Born, Citizen | 9,000 (99.0%) | 89 (1.0%) |
| Foreign Born, not a Citizen | 4,529 (98.2%) | 81 (1.8%) |
Health Insurance Coverage by Household Income in Taunton
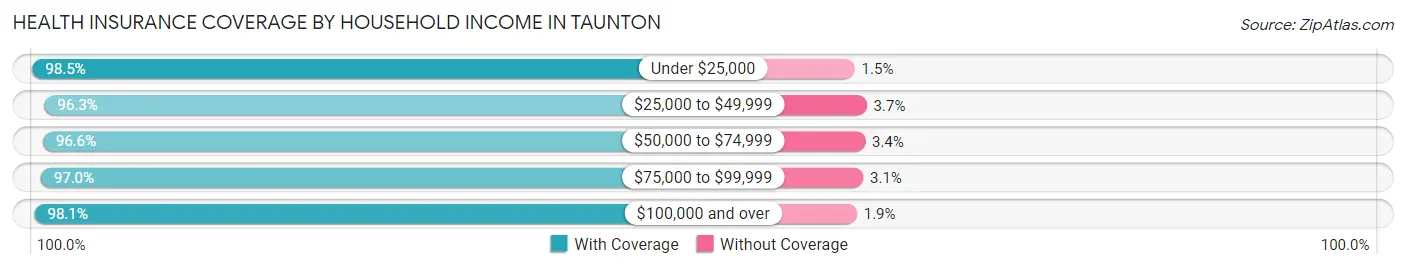
| Household Income | With Coverage | Without Coverage |
| Under $25,000 | 7,175 (98.5%) | 107 (1.5%) |
| $25,000 to $49,999 | 8,162 (96.3%) | 315 (3.7%) |
| $50,000 to $74,999 | 7,702 (96.6%) | 273 (3.4%) |
| $75,000 to $99,999 | 7,289 (97.0%) | 229 (3.0%) |
| $100,000 and over | 26,956 (98.1%) | 514 (1.9%) |
Public vs Private Health Insurance Coverage by Age in Taunton
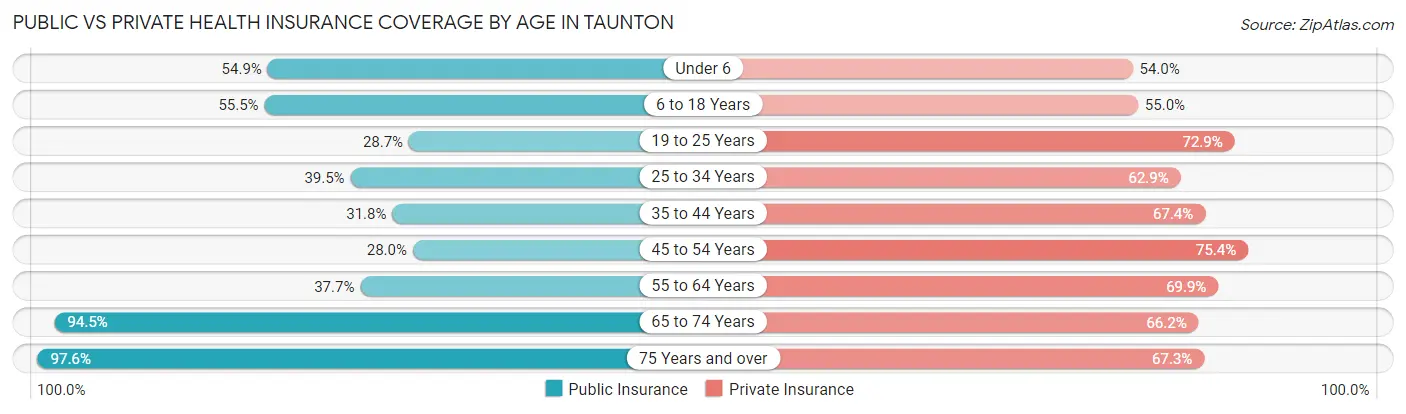
| Age Bracket | Public Insurance | Private Insurance |
| Under 6 | 2,150 (54.9%) | 2,114 (54.0%) |
| 6 to 18 Years | 5,043 (55.5%) | 4,995 (55.0%) |
| 19 to 25 Years | 1,321 (28.7%) | 3,360 (72.9%) |
| 25 to 34 Years | 3,248 (39.5%) | 5,167 (62.9%) |
| 35 to 44 Years | 2,246 (31.8%) | 4,771 (67.4%) |
| 45 to 54 Years | 2,217 (28.0%) | 5,980 (75.4%) |
| 55 to 64 Years | 3,572 (37.7%) | 6,620 (69.9%) |
| 65 to 74 Years | 4,583 (94.5%) | 3,212 (66.2%) |
| 75 Years and over | 3,790 (97.6%) | 2,612 (67.2%) |
| Total | 28,170 (47.7%) | 38,831 (65.8%) |
Disability Status by Sex by Age in Taunton
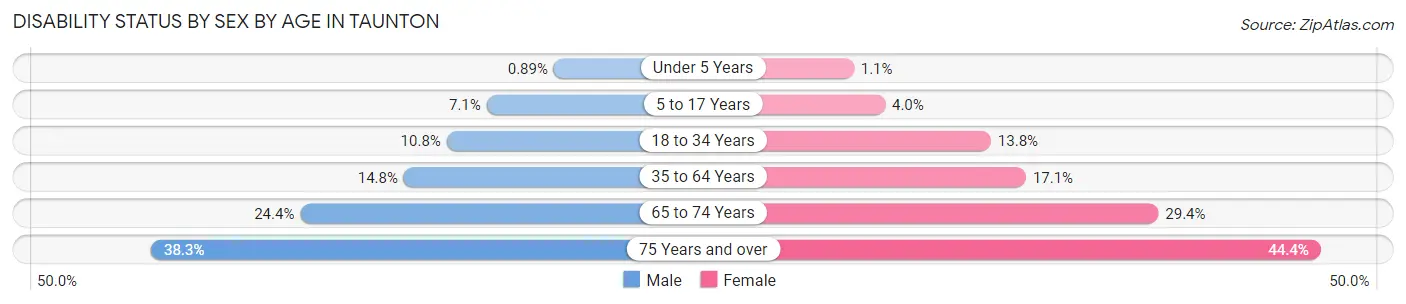
| Age Bracket | Male | Female |
| Under 5 Years | 16 (0.9%) | 17 (1.1%) |
| 5 to 17 Years | 339 (7.1%) | 177 (4.0%) |
| 18 to 34 Years | 710 (10.8%) | 939 (13.8%) |
| 35 to 64 Years | 1,719 (14.8%) | 2,201 (17.1%) |
| 65 to 74 Years | 598 (24.4%) | 706 (29.4%) |
| 75 Years and over | 520 (38.3%) | 1,122 (44.4%) |
Disability Class by Sex by Age in Taunton
Disability Class: Hearing Difficulty
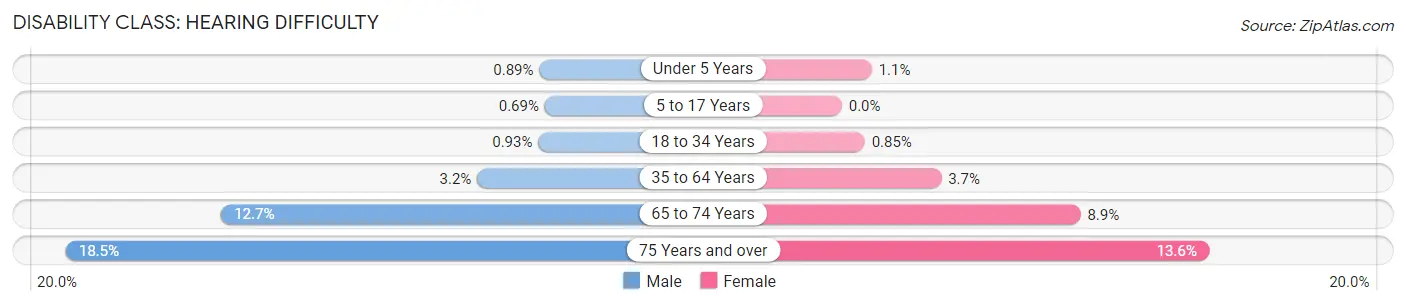
| Age Bracket | Male | Female |
| Under 5 Years | 16 (0.9%) | 17 (1.1%) |
| 5 to 17 Years | 33 (0.7%) | 0 (0.0%) |
| 18 to 34 Years | 61 (0.9%) | 58 (0.9%) |
| 35 to 64 Years | 371 (3.2%) | 475 (3.7%) |
| 65 to 74 Years | 311 (12.7%) | 213 (8.9%) |
| 75 Years and over | 251 (18.5%) | 344 (13.6%) |
Disability Class: Vision Difficulty
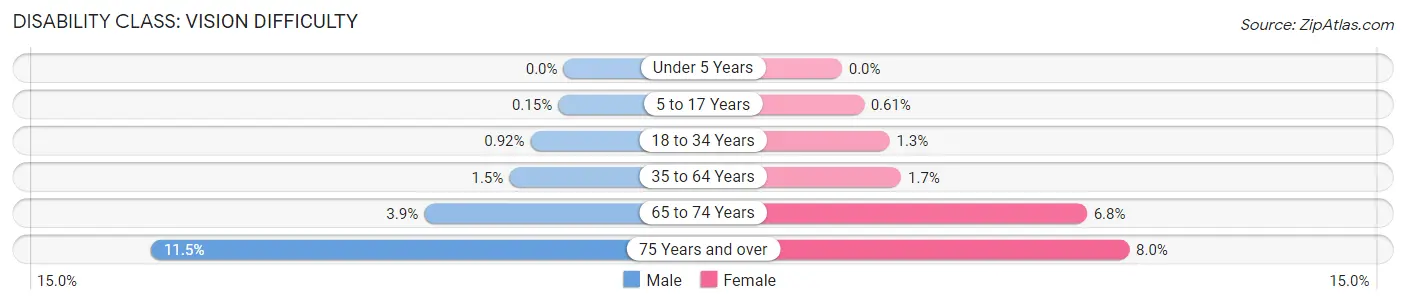
| Age Bracket | Male | Female |
| Under 5 Years | 0 (0.0%) | 0 (0.0%) |
| 5 to 17 Years | 7 (0.2%) | 27 (0.6%) |
| 18 to 34 Years | 60 (0.9%) | 90 (1.3%) |
| 35 to 64 Years | 175 (1.5%) | 213 (1.7%) |
| 65 to 74 Years | 95 (3.9%) | 164 (6.8%) |
| 75 Years and over | 156 (11.5%) | 202 (8.0%) |
Disability Class: Cognitive Difficulty
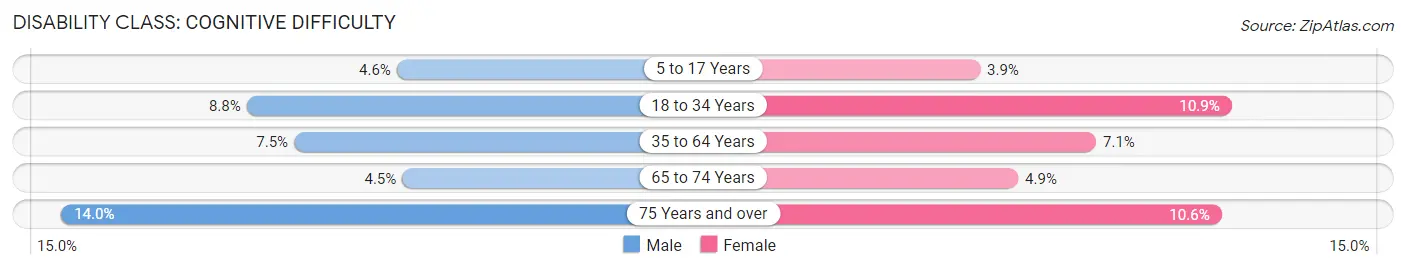
| Age Bracket | Male | Female |
| 5 to 17 Years | 221 (4.6%) | 170 (3.8%) |
| 18 to 34 Years | 578 (8.8%) | 736 (10.8%) |
| 35 to 64 Years | 870 (7.5%) | 911 (7.1%) |
| 65 to 74 Years | 110 (4.5%) | 118 (4.9%) |
| 75 Years and over | 190 (14.0%) | 267 (10.6%) |
Disability Class: Ambulatory Difficulty
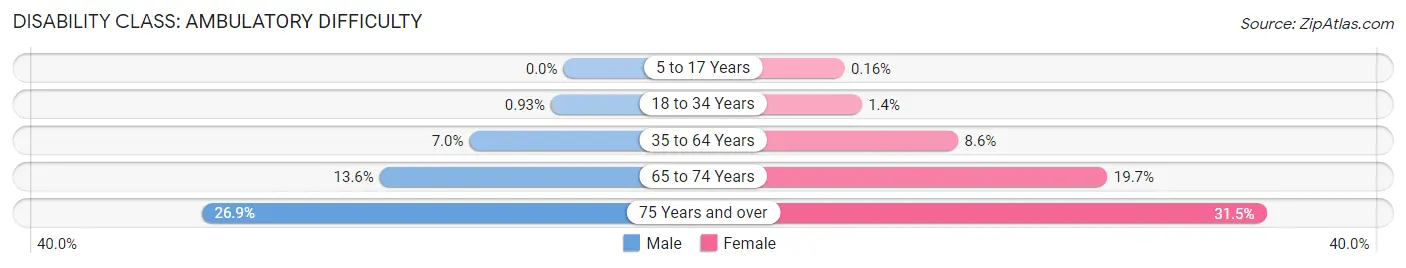
| Age Bracket | Male | Female |
| 5 to 17 Years | 0 (0.0%) | 7 (0.2%) |
| 18 to 34 Years | 61 (0.9%) | 98 (1.4%) |
| 35 to 64 Years | 810 (7.0%) | 1,107 (8.6%) |
| 65 to 74 Years | 334 (13.6%) | 473 (19.7%) |
| 75 Years and over | 365 (26.9%) | 796 (31.5%) |
Disability Class: Self-Care Difficulty
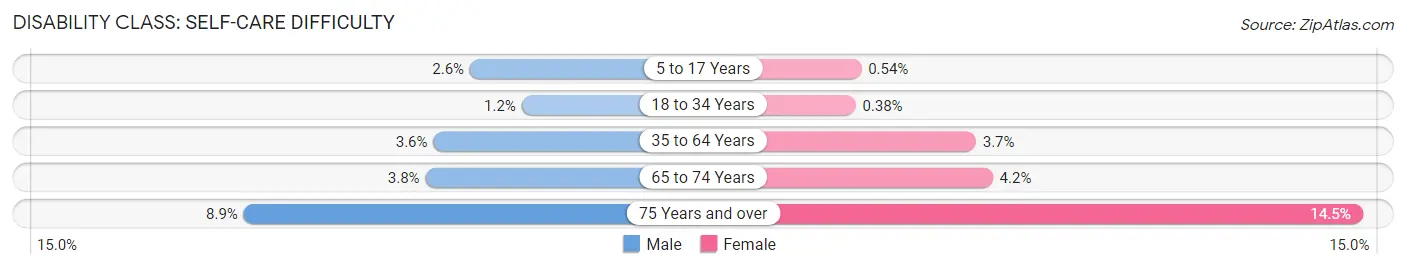
| Age Bracket | Male | Female |
| 5 to 17 Years | 124 (2.6%) | 24 (0.5%) |
| 18 to 34 Years | 76 (1.2%) | 26 (0.4%) |
| 35 to 64 Years | 420 (3.6%) | 480 (3.7%) |
| 65 to 74 Years | 94 (3.8%) | 101 (4.2%) |
| 75 Years and over | 121 (8.9%) | 366 (14.5%) |
Technology Access in Taunton
Computing Device Access in Taunton
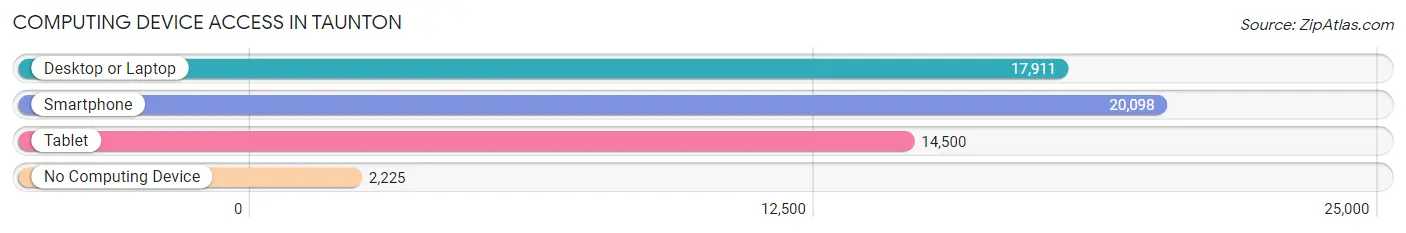
| Device Type | # Households | % Households |
| Desktop or Laptop | 17,911 | 75.1% |
| Smartphone | 20,098 | 84.3% |
| Tablet | 14,500 | 60.8% |
| No Computing Device | 2,225 | 9.3% |
| Total | 23,835 | 100.0% |
Internet Access in Taunton
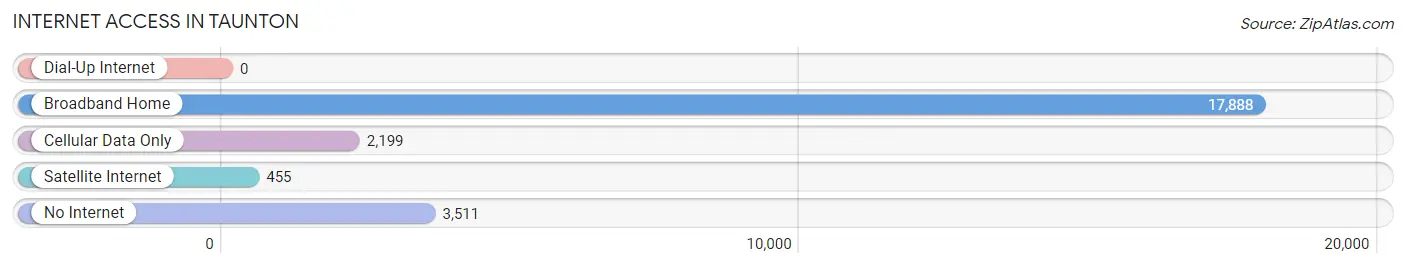
| Internet Type | # Households | % Households |
| Dial-Up Internet | 0 | 0.0% |
| Broadband Home | 17,888 | 75.0% |
| Cellular Data Only | 2,199 | 9.2% |
| Satellite Internet | 455 | 1.9% |
| No Internet | 3,511 | 14.7% |
| Total | 23,835 | 100.0% |
Taunton Summary
Taunton is a city located in Bristol County, Massachusetts, United States. It is the county seat of Bristol County and the largest city in the county. The city is situated on the Taunton River, which flows into Mount Hope Bay, approximately 10 miles (16 km) south of Providence, Rhode Island. As of the 2010 census, the city had a total population of 55,874.
History
The area now known as Taunton was first settled in 1637 by members of the Plymouth Colony. The town was officially incorporated in 1639 and was named after Taunton in Somerset, England. The town was the site of the first iron works in America, established in 1652. During the American Revolution, Taunton was the site of the Battle of Taunton, a skirmish between American and British forces.
Geography
Taunton is located at 41°54′N 71°07′W (41.9000, -71.1167). According to the United States Census Bureau, the city has a total area of 28.2 square miles (73.1 km2), of which 27.7 square miles (71.6 km2) is land and 0.5 square miles (1.3 km2) is water.
Economy
Taunton is home to a variety of businesses and industries. The city is home to the Silver City Galleria, a large shopping mall, as well as several smaller shopping centers. The city is also home to several manufacturing companies, including the Taunton Cider Company, which produces hard cider, and the Taunton Press, which publishes books and magazines.
Demographics
As of the 2010 census, there were 55,874 people, 22,845 households, and 14,845 families residing in the city. The population density was 2,019.7 people per square mile (779.2/km2). There were 24,541 housing units at an average density of 884.3 per square mile (341.9/km2). The racial makeup of the city was 81.2% White, 8.3% African American, 0.3% Native American, 2.2% Asian, 0.1% Pacific Islander, 5.7% from other races, and 2.3% from two or more races. Hispanic or Latino of any race were 11.7% of the population.
The median income for a household in the city was $45,837, and the median income for a family was $54,844. Males had a median income of $41,845 versus $30,845 for females. The per capita income for the city was $21,945. About 10.2% of families and 12.7% of the population were below the poverty line, including 17.2% of those under age 18 and 10.2% of those age 65 or over.
Common Questions
What is Per Capita Income in Taunton?
Per Capita income in Taunton is $36,349.
What is the Median Family Income in Taunton?
Median Family Income in Taunton is $94,646.
What is the Median Household income in Taunton?
Median Household Income in Taunton is $72,782.
What is Income or Wage Gap in Taunton?
Income or Wage Gap in Taunton is 27.5%.
Women in Taunton earn 72.5 cents for every dollar earned by a man.
What is Inequality or Gini Index in Taunton?
Inequality or Gini Index in Taunton is 0.43.
What is the Total Population of Taunton?
Total Population of Taunton is 59,436.
What is the Total Male Population of Taunton?
Total Male Population of Taunton is 28,654.
What is the Total Female Population of Taunton?
Total Female Population of Taunton is 30,782.
What is the Ratio of Males per 100 Females in Taunton?
There are 93.09 Males per 100 Females in Taunton.
What is the Ratio of Females per 100 Males in Taunton?
There are 107.43 Females per 100 Males in Taunton.
What is the Median Population Age in Taunton?
Median Population Age in Taunton is 40.2 Years.
What is the Average Family Size in Taunton
Average Family Size in Taunton is 3.0 People.
What is the Average Household Size in Taunton
Average Household Size in Taunton is 2.5 People.
How Large is the Labor Force in Taunton?
There are 32,093 People in the Labor Forcein in Taunton.
What is the Percentage of People in the Labor Force in Taunton?
65.9% of People are in the Labor Force in Taunton.
What is the Unemployment Rate in Taunton?
Unemployment Rate in Taunton is 5.5%.