Cities with the Highest Percentage of Population Employed in Utilities in Massachusetts
RELATED REPORTS & OPTIONS
Utilities
Massachusetts
Compare Cities
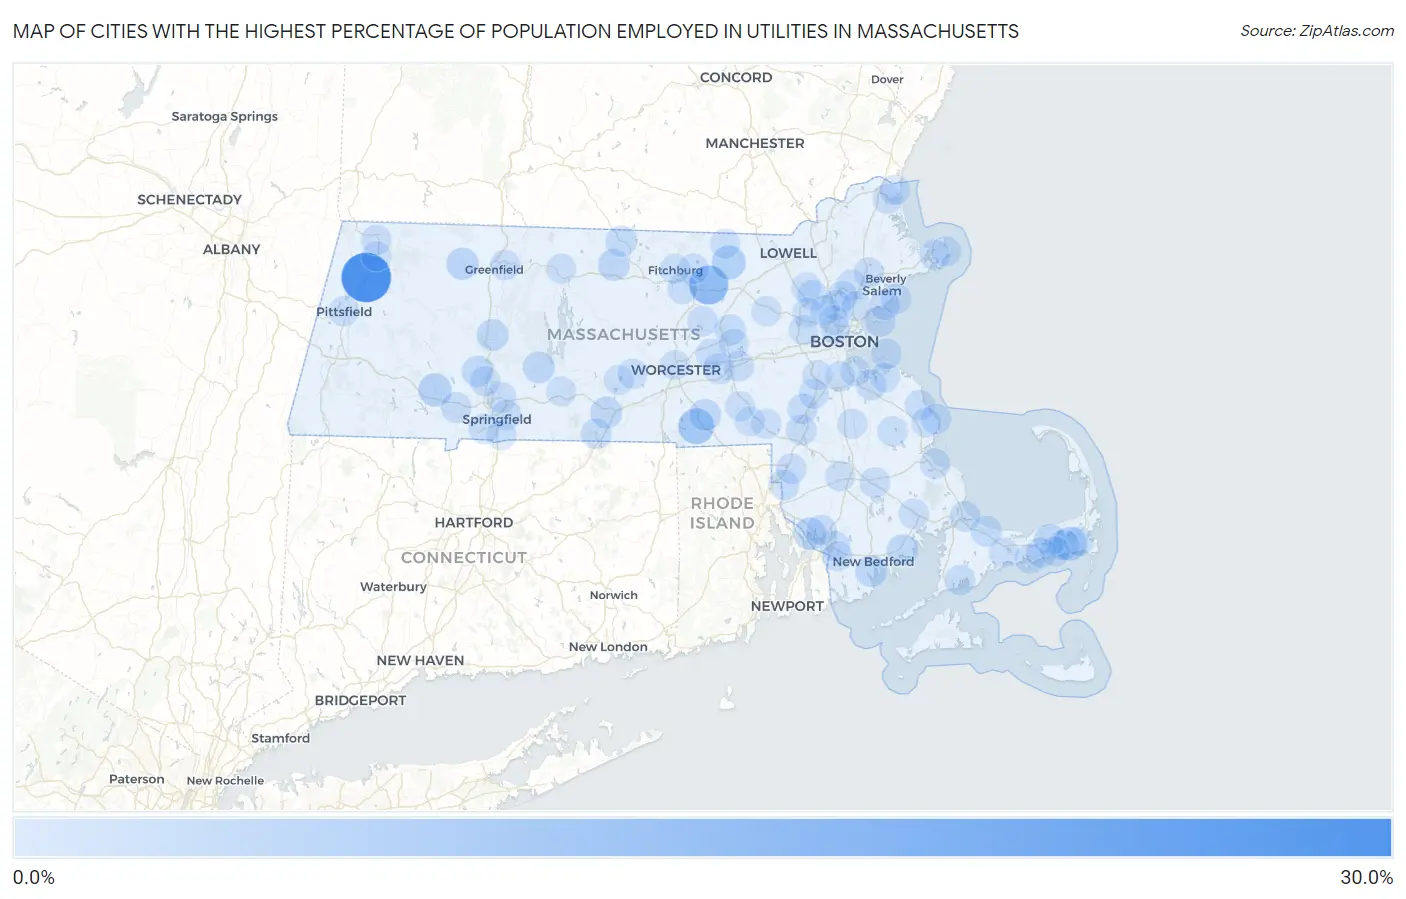
Map of Cities with the Highest Percentage of Population Employed in Utilities in Massachusetts
0.0%
30.0%
Cities with the Highest Percentage of Population Employed in Utilities in Massachusetts
| City | % Employed | vs State | vs National | |
| 1. | Cheshire | 26.7% | 0.69%(+26.0)#1 | 0.84%(+25.9)#104 |
| 2. | Shirley | 12.1% | 0.69%(+11.4)#2 | 0.84%(+11.3)#398 |
| 3. | East Douglas | 7.9% | 0.69%(+7.24)#3 | 0.84%(+7.09)#740 |
| 4. | Groton | 5.5% | 0.69%(+4.84)#4 | 0.84%(+4.69)#1,252 |
| 5. | Harwich Center | 5.4% | 0.69%(+4.75)#5 | 0.84%(+4.61)#1,275 |
| 6. | Russell | 4.6% | 0.69%(+3.90)#6 | 0.84%(+3.76)#1,667 |
| 7. | Ocean Grove | 3.5% | 0.69%(+2.83)#7 | 0.84%(+2.68)#2,430 |
| 8. | South Dennis | 3.0% | 0.69%(+2.32)#8 | 0.84%(+2.17)#2,940 |
| 9. | Shelburne Falls | 3.0% | 0.69%(+2.28)#9 | 0.84%(+2.14)#2,983 |
| 10. | Whitinsville | 2.8% | 0.69%(+2.14)#10 | 0.84%(+1.99)#3,168 |
| 11. | Fiskdale | 2.8% | 0.69%(+2.06)#11 | 0.84%(+1.92)#3,275 |
| 12. | Bliss Corner | 2.7% | 0.69%(+2.03)#12 | 0.84%(+1.88)#3,330 |
| 13. | Hatfield | 2.7% | 0.69%(+2.01)#13 | 0.84%(+1.86)#3,359 |
| 14. | Belchertown | 2.6% | 0.69%(+1.90)#14 | 0.84%(+1.75)#3,520 |
| 15. | Baldwinville | 2.5% | 0.69%(+1.86)#15 | 0.84%(+1.71)#3,580 |
| 16. | Mattapoisett Center | 2.3% | 0.69%(+1.57)#16 | 0.84%(+1.42)#4,077 |
| 17. | Easthampton Town | 2.2% | 0.69%(+1.54)#17 | 0.84%(+1.39)#4,143 |
| 18. | Hudson | 1.9% | 0.69%(+1.23)#18 | 0.84%(+1.08)#4,855 |
| 19. | East Sandwich | 1.9% | 0.69%(+1.18)#19 | 0.84%(+1.03)#4,996 |
| 20. | Winchendon | 1.8% | 0.69%(+1.06)#20 | 0.84%(+0.916)#5,303 |
| 21. | Westborough | 1.6% | 0.69%(+0.954)#21 | 0.84%(+0.807)#5,656 |
| 22. | Nahant | 1.6% | 0.69%(+0.953)#22 | 0.84%(+0.806)#5,662 |
| 23. | Sagamore | 1.5% | 0.69%(+0.824)#23 | 0.84%(+0.676)#6,118 |
| 24. | Northwest Harwich | 1.5% | 0.69%(+0.779)#24 | 0.84%(+0.631)#6,288 |
| 25. | Gloucester | 1.4% | 0.69%(+0.753)#25 | 0.84%(+0.605)#6,388 |
| 26. | Westfield | 1.4% | 0.69%(+0.746)#26 | 0.84%(+0.598)#6,413 |
| 27. | Foxborough | 1.4% | 0.69%(+0.712)#27 | 0.84%(+0.565)#6,536 |
| 28. | North Seekonk | 1.4% | 0.69%(+0.692)#28 | 0.84%(+0.544)#6,605 |
| 29. | Weymouth Town | 1.3% | 0.69%(+0.615)#29 | 0.84%(+0.468)#6,922 |
| 30. | Holland | 1.3% | 0.69%(+0.596)#30 | 0.84%(+0.448)#7,023 |
| 31. | South Yarmouth | 1.2% | 0.69%(+0.529)#31 | 0.84%(+0.382)#7,335 |
| 32. | East Falmouth | 1.2% | 0.69%(+0.527)#32 | 0.84%(+0.379)#7,339 |
| 33. | Northborough | 1.2% | 0.69%(+0.504)#33 | 0.84%(+0.357)#7,472 |
| 34. | Lynnfield | 1.1% | 0.69%(+0.444)#34 | 0.84%(+0.296)#7,768 |
| 35. | Fall River | 1.1% | 0.69%(+0.425)#35 | 0.84%(+0.277)#7,871 |
| 36. | Attleboro | 1.1% | 0.69%(+0.422)#36 | 0.84%(+0.275)#7,884 |
| 37. | Cordaville | 1.1% | 0.69%(+0.416)#37 | 0.84%(+0.269)#7,925 |
| 38. | Hull | 1.1% | 0.69%(+0.409)#38 | 0.84%(+0.262)#7,958 |
| 39. | North Adams | 1.1% | 0.69%(+0.406)#39 | 0.84%(+0.259)#7,987 |
| 40. | Danvers | 1.1% | 0.69%(+0.380)#40 | 0.84%(+0.233)#8,124 |
| 41. | Wakefield | 1.1% | 0.69%(+0.368)#41 | 0.84%(+0.221)#8,187 |
| 42. | West Yarmouth | 1.0% | 0.69%(+0.347)#42 | 0.84%(+0.199)#8,291 |
| 43. | Somerset | 1.0% | 0.69%(+0.346)#43 | 0.84%(+0.199)#8,299 |
| 44. | Lunenburg | 1.0% | 0.69%(+0.333)#44 | 0.84%(+0.185)#8,370 |
| 45. | Marblehead | 1.0% | 0.69%(+0.321)#45 | 0.84%(+0.173)#8,433 |
| 46. | Clinton | 1.0% | 0.69%(+0.321)#46 | 0.84%(+0.173)#8,434 |
| 47. | Agawam Town | 1.00% | 0.69%(+0.309)#47 | 0.84%(+0.162)#8,501 |
| 48. | Middleborough Center | 0.99% | 0.69%(+0.297)#48 | 0.84%(+0.150)#8,571 |
| 49. | Chicopee | 0.97% | 0.69%(+0.279)#49 | 0.84%(+0.132)#8,686 |
| 50. | Walpole | 0.96% | 0.69%(+0.267)#50 | 0.84%(+0.120)#8,757 |
| 51. | Springfield | 0.96% | 0.69%(+0.266)#51 | 0.84%(+0.118)#8,767 |
| 52. | Leominster | 0.95% | 0.69%(+0.256)#52 | 0.84%(+0.109)#8,830 |
| 53. | Holyoke | 0.94% | 0.69%(+0.254)#53 | 0.84%(+0.106)#8,855 |
| 54. | Plymouth | 0.94% | 0.69%(+0.250)#54 | 0.84%(+0.103)#8,874 |
| 55. | Norwood | 0.92% | 0.69%(+0.231)#55 | 0.84%(+0.083)#8,994 |
| 56. | West Wareham | 0.91% | 0.69%(+0.221)#56 | 0.84%(+0.074)#9,064 |
| 57. | Burlington | 0.91% | 0.69%(+0.221)#57 | 0.84%(+0.073)#9,068 |
| 58. | Hanson | 0.90% | 0.69%(+0.209)#58 | 0.84%(+0.061)#9,162 |
| 59. | Salisbury | 0.81% | 0.69%(+0.121)#59 | 0.84%(-0.027)#9,774 |
| 60. | Marshfield Hills | 0.81% | 0.69%(+0.119)#60 | 0.84%(-0.029)#9,797 |
| 61. | Stoneham | 0.80% | 0.69%(+0.112)#61 | 0.84%(-0.035)#9,847 |
| 62. | Swampscott | 0.80% | 0.69%(+0.111)#62 | 0.84%(-0.036)#9,855 |
| 63. | Turners Falls | 0.79% | 0.69%(+0.105)#63 | 0.84%(-0.043)#9,898 |
| 64. | Ocean Bluff Brant Rock | 0.79% | 0.69%(+0.103)#64 | 0.84%(-0.045)#9,917 |
| 65. | Brockton | 0.78% | 0.69%(+0.086)#65 | 0.84%(-0.061)#10,025 |
| 66. | Milton | 0.77% | 0.69%(+0.079)#66 | 0.84%(-0.068)#10,077 |
| 67. | Marlborough | 0.77% | 0.69%(+0.078)#67 | 0.84%(-0.070)#10,088 |
| 68. | Barnstable Town | 0.75% | 0.69%(+0.065)#68 | 0.84%(-0.082)#10,178 |
| 69. | Taunton | 0.73% | 0.69%(+0.043)#69 | 0.84%(-0.104)#10,345 |
| 70. | Pepperell | 0.72% | 0.69%(+0.034)#70 | 0.84%(-0.113)#10,410 |
| 71. | Pinehurst | 0.70% | 0.69%(+0.006)#71 | 0.84%(-0.141)#10,627 |
| 72. | North Westport | 0.70% | 0.69%(+0.006)#72 | 0.84%(-0.141)#10,631 |
| 73. | Adams | 0.69% | 0.69%(-0.000)#73 | 0.84%(-0.148)#10,693 |
| 74. | Worcester | 0.68% | 0.69%(-0.008)#74 | 0.84%(-0.156)#10,762 |
| 75. | East Brookfield | 0.68% | 0.69%(-0.014)#75 | 0.84%(-0.161)#10,812 |
| 76. | East Harwich | 0.67% | 0.69%(-0.015)#76 | 0.84%(-0.162)#10,821 |
| 77. | Spencer | 0.67% | 0.69%(-0.020)#77 | 0.84%(-0.168)#10,867 |
| 78. | Lexington | 0.66% | 0.69%(-0.029)#78 | 0.84%(-0.177)#10,955 |
| 79. | Dennis Port | 0.66% | 0.69%(-0.030)#79 | 0.84%(-0.177)#10,965 |
| 80. | Longmeadow | 0.66% | 0.69%(-0.033)#80 | 0.84%(-0.180)#10,992 |
| 81. | Somerville | 0.66% | 0.69%(-0.034)#81 | 0.84%(-0.182)#11,004 |
| 82. | Franklin Town | 0.65% | 0.69%(-0.036)#82 | 0.84%(-0.184)#11,023 |
| 83. | Waltham | 0.65% | 0.69%(-0.038)#83 | 0.84%(-0.186)#11,034 |
| 84. | Pittsfield | 0.65% | 0.69%(-0.039)#84 | 0.84%(-0.186)#11,037 |
| 85. | Quincy | 0.64% | 0.69%(-0.049)#85 | 0.84%(-0.196)#11,124 |
| 86. | Rockport | 0.64% | 0.69%(-0.055)#86 | 0.84%(-0.202)#11,179 |
| 87. | Palmer Town | 0.63% | 0.69%(-0.061)#87 | 0.84%(-0.208)#11,240 |
| 88. | Orange | 0.63% | 0.69%(-0.061)#88 | 0.84%(-0.209)#11,243 |
| 89. | West Concord | 0.62% | 0.69%(-0.066)#89 | 0.84%(-0.214)#11,279 |
| 90. | Marshfield | 0.61% | 0.69%(-0.079)#90 | 0.84%(-0.227)#11,402 |
| 91. | Winchester | 0.61% | 0.69%(-0.081)#91 | 0.84%(-0.228)#11,419 |
| 92. | Newburyport | 0.60% | 0.69%(-0.087)#92 | 0.84%(-0.234)#11,479 |
| 93. | Fitchburg | 0.60% | 0.69%(-0.092)#93 | 0.84%(-0.239)#11,535 |
| 94. | Greenfield | 0.59% | 0.69%(-0.098)#94 | 0.84%(-0.246)#11,593 |
| 95. | Hingham | 0.59% | 0.69%(-0.098)#95 | 0.84%(-0.246)#11,595 |
| 96. | Milford | 0.59% | 0.69%(-0.100)#96 | 0.84%(-0.248)#11,608 |
| 97. | Saugus | 0.59% | 0.69%(-0.102)#97 | 0.84%(-0.249)#11,624 |
| 98. | Bellingham | 0.58% | 0.69%(-0.107)#98 | 0.84%(-0.254)#11,668 |
| 99. | Medford | 0.56% | 0.69%(-0.127)#99 | 0.84%(-0.275)#11,846 |
| 100. | Dedham | 0.56% | 0.69%(-0.130)#100 | 0.84%(-0.277)#11,876 |
Common Questions
What are the Top 10 Cities with the Highest Percentage of Population Employed in Utilities in Massachusetts?
Top 10 Cities with the Highest Percentage of Population Employed in Utilities in Massachusetts are:
#1
26.7%
#2
12.1%
#3
7.9%
#4
5.5%
#5
5.4%
#6
4.6%
#7
3.5%
#8
3.0%
#9
3.0%
#10
2.8%
What city has the Highest Percentage of Population Employed in Utilities in Massachusetts?
Cheshire has the Highest Percentage of Population Employed in Utilities in Massachusetts with 26.7%.
What is the Percentage of Population Employed in Utilities in the State of Massachusetts?
Percentage of Population Employed in Utilities in Massachusetts is 0.69%.
What is the Percentage of Population Employed in Utilities in the United States?
Percentage of Population Employed in Utilities in the United States is 0.84%.