Milton, MA Map & Demographics
Milton Map
Milton Overview
$71,516
PER CAPITA INCOME
$203,557
AVG FAMILY INCOME
$170,531
AVG HOUSEHOLD INCOME
28.1%
WAGE / INCOME GAP [ % ]
71.9¢/ $1
WAGE / INCOME GAP [ $ ]
0.47
INEQUALITY / GINI INDEX
28,450
TOTAL POPULATION
13,414
MALE POPULATION
15,036
FEMALE POPULATION
89.21
MALES / 100 FEMALES
112.09
FEMALES / 100 MALES
40.1
MEDIAN AGE
3.3
AVG FAMILY SIZE
2.9
AVG HOUSEHOLD SIZE
15,416
LABOR FORCE [ PEOPLE ]
69.5%
PERCENT IN LABOR FORCE
3.8%
UNEMPLOYMENT RATE
Milton Zip Codes
Milton Area Codes
Income in Milton
Income Overview in Milton
Per Capita Income in Milton is $71,516, while median incomes of families and households are $203,557 and $170,531 respectively.
| Characteristic | Number | Measure |
| Per Capita Income | 28,450 | $71,516 |
| Median Family Income | 7,059 | $203,557 |
| Mean Family Income | 7,059 | $246,202 |
| Median Household Income | 9,139 | $170,531 |
| Mean Household Income | 9,139 | $218,611 |
| Income Deficit | 7,059 | $0 |
| Wage / Income Gap (%) | 28,450 | 28.08% |
| Wage / Income Gap ($) | 28,450 | 71.92¢ per $1 |
| Gini / Inequality Index | 28,450 | 0.47 |
Earnings by Sex in Milton
Average Earnings in Milton are $77,216, $90,580 for men and $65,148 for women, a difference of 28.1%.
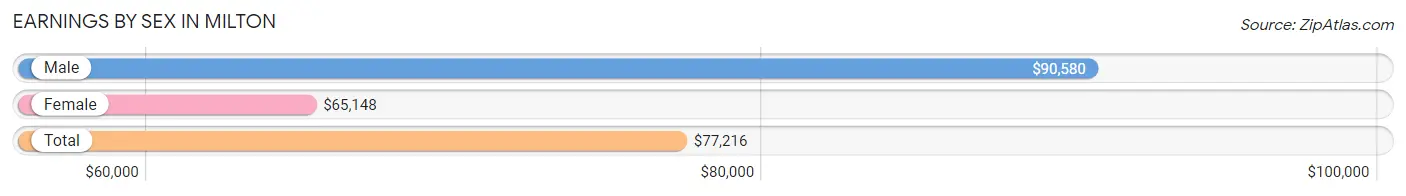
| Sex | Number | Average Earnings |
| Male | 8,124 (49.7%) | $90,580 |
| Female | 8,211 (50.3%) | $65,148 |
| Total | 16,335 (100.0%) | $77,216 |
Earnings by Sex by Income Bracket in Milton
The most common earnings brackets in Milton are $100,000+ for men (3,785 | 46.6%) and $100,000+ for women (2,721 | 33.1%).
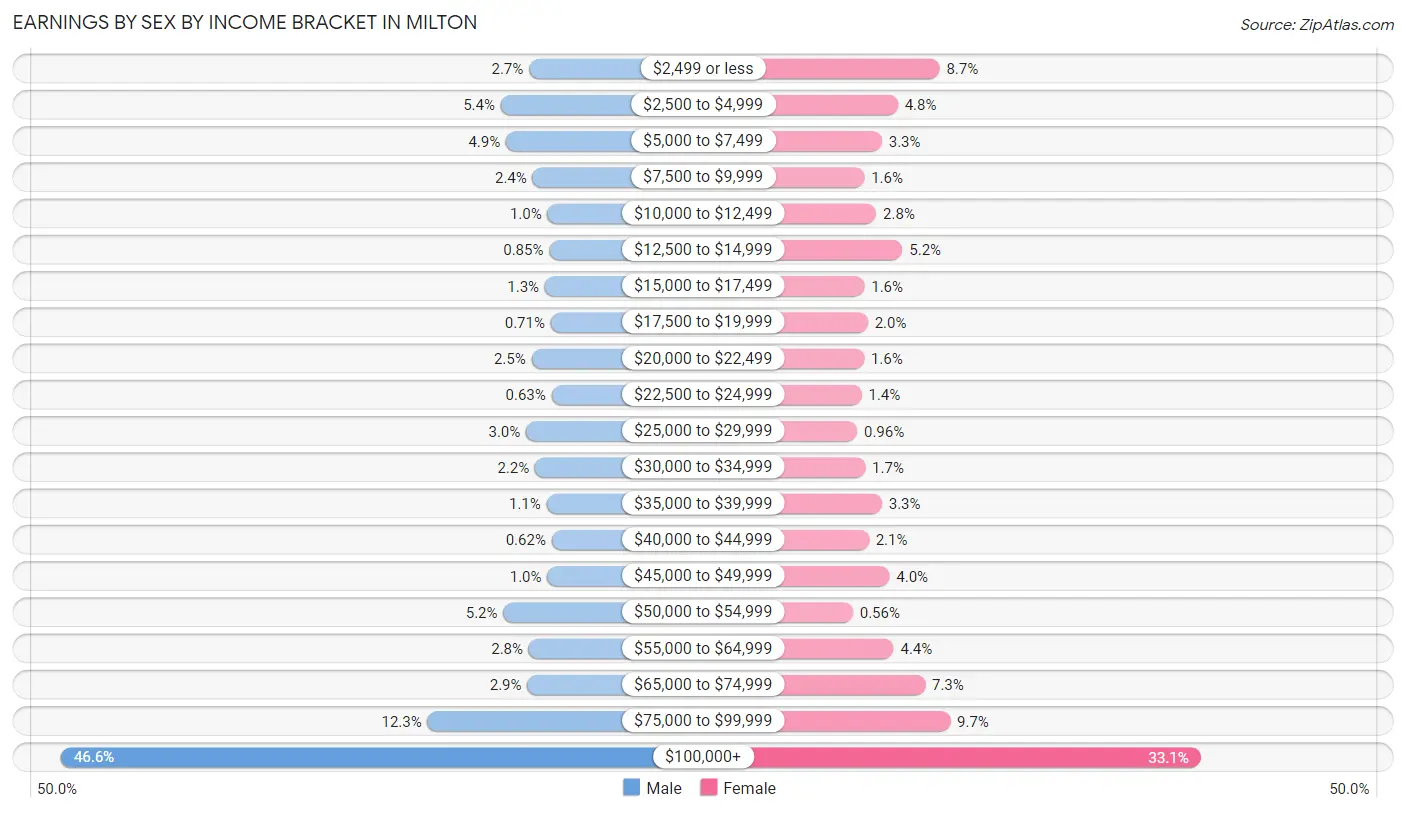
| Income | Male | Female |
| $2,499 or less | 223 (2.7%) | 713 (8.7%) |
| $2,500 to $4,999 | 438 (5.4%) | 392 (4.8%) |
| $5,000 to $7,499 | 398 (4.9%) | 269 (3.3%) |
| $7,500 to $9,999 | 196 (2.4%) | 134 (1.6%) |
| $10,000 to $12,499 | 82 (1.0%) | 226 (2.8%) |
| $12,500 to $14,999 | 69 (0.9%) | 427 (5.2%) |
| $15,000 to $17,499 | 102 (1.3%) | 135 (1.6%) |
| $17,500 to $19,999 | 58 (0.7%) | 161 (2.0%) |
| $20,000 to $22,499 | 204 (2.5%) | 132 (1.6%) |
| $22,500 to $24,999 | 51 (0.6%) | 113 (1.4%) |
| $25,000 to $29,999 | 245 (3.0%) | 79 (1.0%) |
| $30,000 to $34,999 | 177 (2.2%) | 141 (1.7%) |
| $35,000 to $39,999 | 89 (1.1%) | 269 (3.3%) |
| $40,000 to $44,999 | 50 (0.6%) | 168 (2.1%) |
| $45,000 to $49,999 | 84 (1.0%) | 328 (4.0%) |
| $50,000 to $54,999 | 418 (5.1%) | 46 (0.6%) |
| $55,000 to $64,999 | 224 (2.8%) | 360 (4.4%) |
| $65,000 to $74,999 | 236 (2.9%) | 602 (7.3%) |
| $75,000 to $99,999 | 995 (12.2%) | 795 (9.7%) |
| $100,000+ | 3,785 (46.6%) | 2,721 (33.1%) |
| Total | 8,124 (100.0%) | 8,211 (100.0%) |
Earnings by Sex by Educational Attainment in Milton
Average earnings in Milton are $110,238 for men and $80,848 for women, a difference of 26.7%. Men with an educational attainment of graduate degree enjoy the highest average annual earnings of $154,577, while those with less than high school education earn the least with $47,188. Women with an educational attainment of graduate degree earn the most with the average annual earnings of $107,951, while those with less than high school education have the smallest earnings of $22,125.
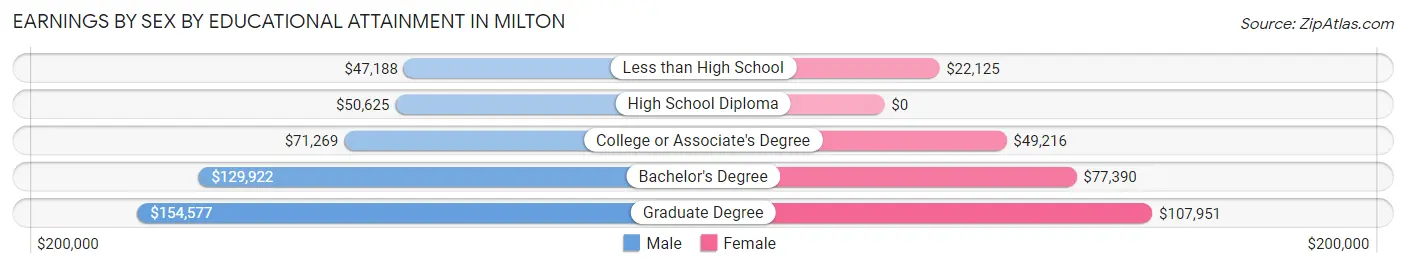
| Educational Attainment | Male Income | Female Income |
| Less than High School | $47,188 | $22,125 |
| High School Diploma | $50,625 | $0 |
| College or Associate's Degree | $71,269 | $49,216 |
| Bachelor's Degree | $129,922 | $77,390 |
| Graduate Degree | $154,577 | $107,951 |
| Total | $110,238 | $80,848 |
Family Income in Milton
Family Income Brackets in Milton
According to the Milton family income data, there are 3,621 families falling into the $200,000+ income range, which is the most common income bracket and makes up 51.3% of all families. Conversely, the $10,000 to $14,999 income bracket is the least frequent group with only 35 families (0.5%) belonging to this category.
| Income Bracket | # Families | % Families |
| Less than $10,000 | 106 | 1.5% |
| $10,000 to $14,999 | 35 | 0.5% |
| $15,000 to $24,999 | 106 | 1.5% |
| $25,000 to $34,999 | 155 | 2.2% |
| $35,000 to $49,999 | 134 | 1.9% |
| $50,000 to $74,999 | 353 | 5.0% |
| $75,000 to $99,999 | 424 | 6.0% |
| $100,000 to $149,999 | 1,101 | 15.6% |
| $150,000 to $199,999 | 1,016 | 14.4% |
| $200,000+ | 3,621 | 51.3% |
Family Income by Famaliy Size in Milton
4-person families (2,193 | 31.1%) account for the highest median family income in Milton with $250,001 per family, while 3-person families (1,639 | 23.2%) have the highest median income of $73,051 per family member.
| Income Bracket | # Families | Median Income |
| 2-Person Families | 2,317 (32.8%) | $122,383 |
| 3-Person Families | 1,639 (23.2%) | $219,152 |
| 4-Person Families | 2,193 (31.1%) | $250,001 |
| 5-Person Families | 726 (10.3%) | $194,567 |
| 6-Person Families | 170 (2.4%) | $166,220 |
| 7+ Person Families | 14 (0.2%) | $0 |
| Total | 7,059 (100.0%) | $203,557 |
Family Income by Number of Earners in Milton
The median family income in Milton is $203,557, with families comprising 2 earners (3,799) having the highest median family income of $245,592, while families with no earners (569) have the lowest median family income of $42,153, accounting for 53.8% and 8.1% of families, respectively.
| Number of Earners | # Families | Median Income |
| No Earners | 569 (8.1%) | $42,153 |
| 1 Earner | 1,565 (22.2%) | $116,815 |
| 2 Earners | 3,799 (53.8%) | $245,592 |
| 3+ Earners | 1,126 (16.0%) | $242,500 |
| Total | 7,059 (100.0%) | $203,557 |
Household Income in Milton
Household Income Brackets in Milton
With 3,875 households falling in the category, the $200,000+ income range is the most frequent in Milton, accounting for 42.4% of all households. In contrast, only 165 households (1.8%) fall into the $10,000 to $14,999 income bracket, making it the least populous group.
| Income Bracket | # Households | % Households |
| Less than $10,000 | 274 | 3.0% |
| $10,000 to $14,999 | 165 | 1.8% |
| $15,000 to $24,999 | 366 | 4.0% |
| $25,000 to $34,999 | 302 | 3.3% |
| $35,000 to $49,999 | 585 | 6.4% |
| $50,000 to $74,999 | 539 | 5.9% |
| $75,000 to $99,999 | 567 | 6.2% |
| $100,000 to $149,999 | 1,279 | 14.0% |
| $150,000 to $199,999 | 1,179 | 12.9% |
| $200,000+ | 3,875 | 42.4% |
Household Income by Householder Age in Milton
The median household income in Milton is $170,531, with the highest median household income of $228,271 found in the 25 to 44 years age bracket for the primary householder. A total of 2,629 households (28.8%) fall into this category. Meanwhile, the 15 to 24 years age bracket for the primary householder has the lowest median household income of $0, with 68 households (0.7%) in this group.
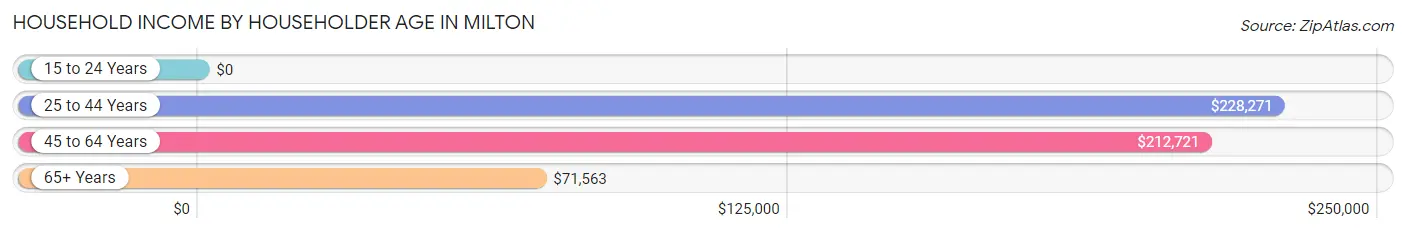
| Income Bracket | # Households | Median Income |
| 15 to 24 Years | 68 (0.7%) | $0 |
| 25 to 44 Years | 2,629 (28.8%) | $228,271 |
| 45 to 64 Years | 3,741 (40.9%) | $212,721 |
| 65+ Years | 2,701 (29.5%) | $71,563 |
| Total | 9,139 (100.0%) | $170,531 |
Poverty in Milton
Income Below Poverty by Sex and Age in Milton
With 4.1% poverty level for males and 6.7% for females among the residents of Milton, 15 year old males and 75 year old and over females are the most vulnerable to poverty, with 65 males (33.3%) and 220 females (17.9%) in their respective age groups living below the poverty level.
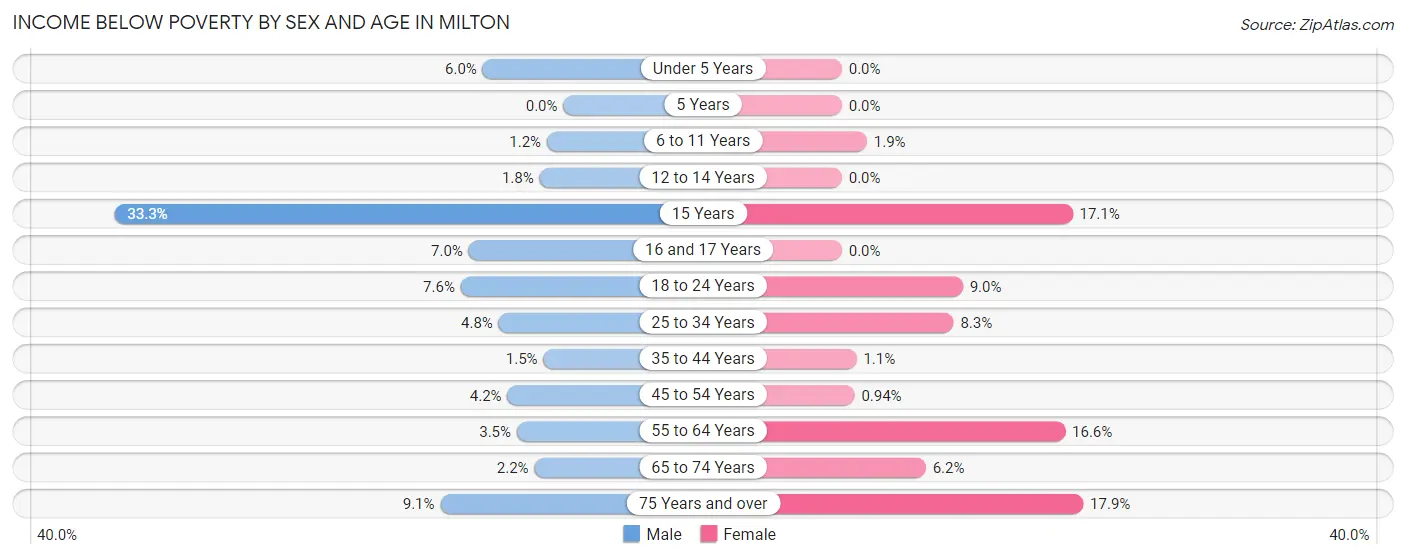
| Age Bracket | Male | Female |
| Under 5 Years | 40 (6.0%) | 0 (0.0%) |
| 5 Years | 0 (0.0%) | 0 (0.0%) |
| 6 to 11 Years | 17 (1.2%) | 30 (1.9%) |
| 12 to 14 Years | 12 (1.8%) | 0 (0.0%) |
| 15 Years | 65 (33.3%) | 43 (17.1%) |
| 16 and 17 Years | 27 (7.0%) | 0 (0.0%) |
| 18 to 24 Years | 58 (7.6%) | 81 (9.0%) |
| 25 to 34 Years | 41 (4.8%) | 104 (8.3%) |
| 35 to 44 Years | 31 (1.5%) | 21 (1.1%) |
| 45 to 54 Years | 85 (4.2%) | 17 (0.9%) |
| 55 to 64 Years | 59 (3.5%) | 337 (16.6%) |
| 65 to 74 Years | 23 (2.1%) | 90 (6.2%) |
| 75 Years and over | 67 (9.1%) | 220 (17.9%) |
| Total | 525 (4.1%) | 943 (6.7%) |
Income Above Poverty by Sex and Age in Milton
According to the poverty statistics in Milton, males aged 5 years and females aged under 5 years are the age groups that are most secure financially, with 100.0% of males and 100.0% of females in these age groups living above the poverty line.
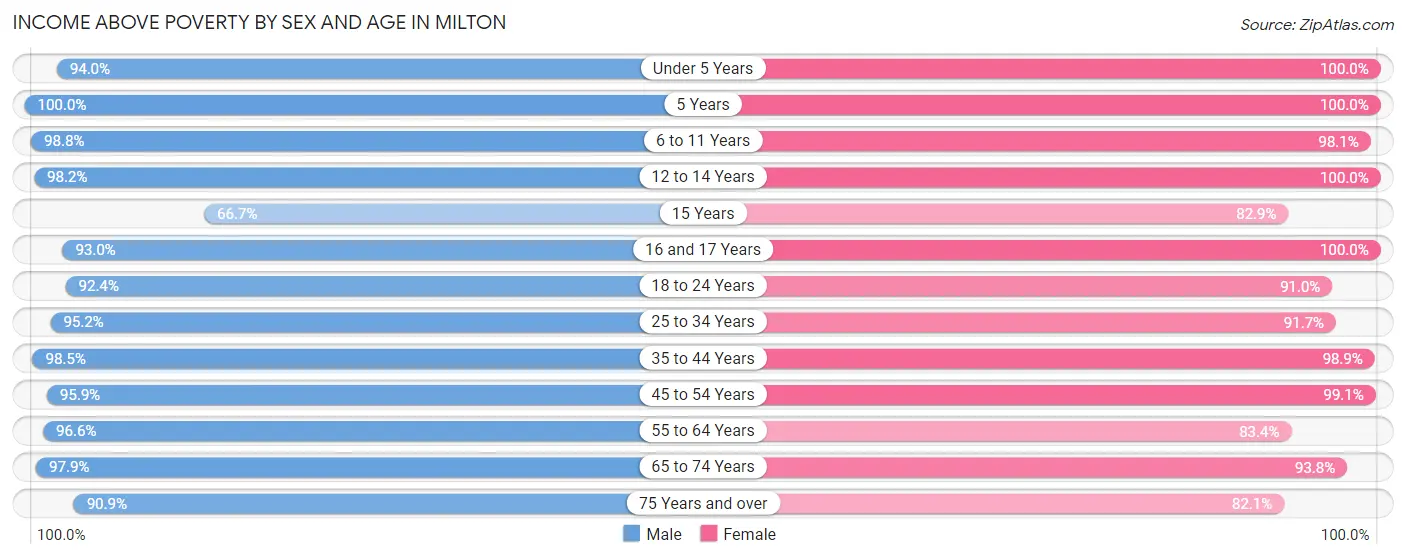
| Age Bracket | Male | Female |
| Under 5 Years | 628 (94.0%) | 586 (100.0%) |
| 5 Years | 241 (100.0%) | 48 (100.0%) |
| 6 to 11 Years | 1,374 (98.8%) | 1,579 (98.1%) |
| 12 to 14 Years | 666 (98.2%) | 479 (100.0%) |
| 15 Years | 130 (66.7%) | 208 (82.9%) |
| 16 and 17 Years | 357 (93.0%) | 514 (100.0%) |
| 18 to 24 Years | 703 (92.4%) | 821 (91.0%) |
| 25 to 34 Years | 813 (95.2%) | 1,150 (91.7%) |
| 35 to 44 Years | 2,062 (98.5%) | 1,897 (98.9%) |
| 45 to 54 Years | 1,963 (95.9%) | 1,791 (99.1%) |
| 55 to 64 Years | 1,650 (96.6%) | 1,696 (83.4%) |
| 65 to 74 Years | 1,048 (97.9%) | 1,354 (93.8%) |
| 75 Years and over | 667 (90.9%) | 1,008 (82.1%) |
| Total | 12,302 (95.9%) | 13,131 (93.3%) |
Income Below Poverty Among Married-Couple Families in Milton
The poverty statistics for married-couple families in Milton show that 0.7% or 44 of the total 5,862 families live below the poverty line. Families with no children have the highest poverty rate of 1.7%, comprising of 44 families. On the other hand, families with 1 or 2 children have the lowest poverty rate of 0.0%, which includes 0 families.
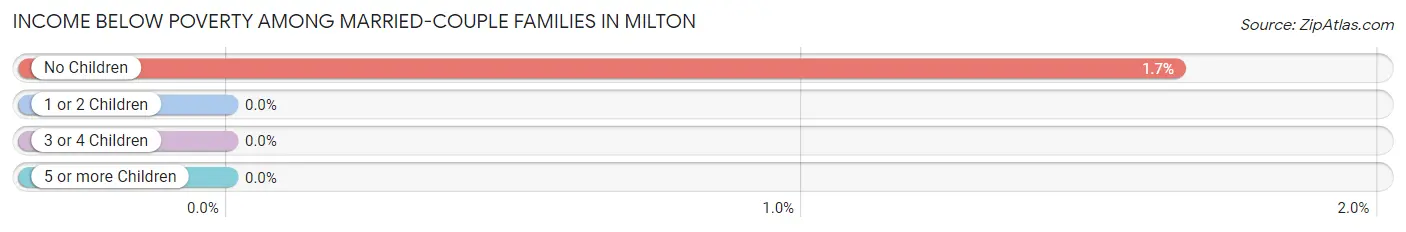
| Children | Above Poverty | Below Poverty |
| No Children | 2,615 (98.4%) | 44 (1.7%) |
| 1 or 2 Children | 2,727 (100.0%) | 0 (0.0%) |
| 3 or 4 Children | 476 (100.0%) | 0 (0.0%) |
| 5 or more Children | 0 (0.0%) | 0 (0.0%) |
| Total | 5,818 (99.3%) | 44 (0.7%) |
Income Below Poverty Among Single-Parent Households in Milton
According to the poverty data in Milton, 24.9% or 65 single-father households and 8.2% or 77 single-mother households are living below the poverty line. Among single-father households, those with 1 or 2 children have the highest poverty rate, with 65 households (62.5%) experiencing poverty. Likewise, among single-mother households, those with 1 or 2 children have the highest poverty rate, with 62 households (9.9%) falling below the poverty line.
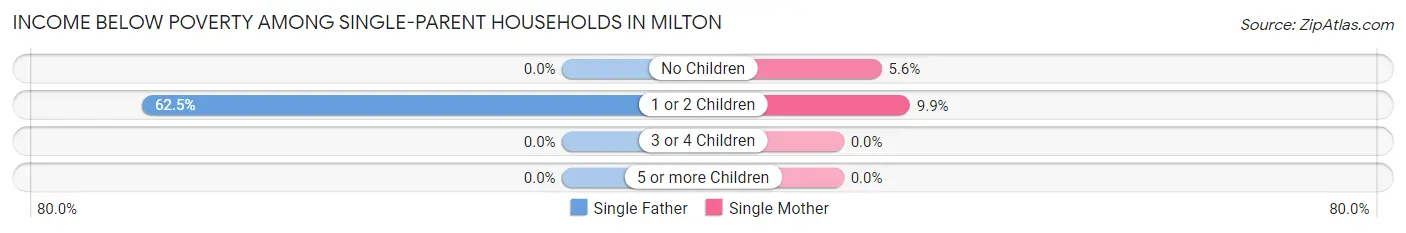
| Children | Single Father | Single Mother |
| No Children | 0 (0.0%) | 15 (5.6%) |
| 1 or 2 Children | 65 (62.5%) | 62 (9.9%) |
| 3 or 4 Children | 0 (0.0%) | 0 (0.0%) |
| 5 or more Children | 0 (0.0%) | 0 (0.0%) |
| Total | 65 (24.9%) | 77 (8.2%) |
Income Below Poverty Among Married-Couple vs Single-Parent Households in Milton
The poverty data for Milton shows that 44 of the married-couple family households (0.7%) and 142 of the single-parent households (11.9%) are living below the poverty level. Within the married-couple family households, those with no children have the highest poverty rate, with 44 households (1.7%) falling below the poverty line. Among the single-parent households, those with 1 or 2 children have the highest poverty rate, with 127 household (17.3%) living below poverty.
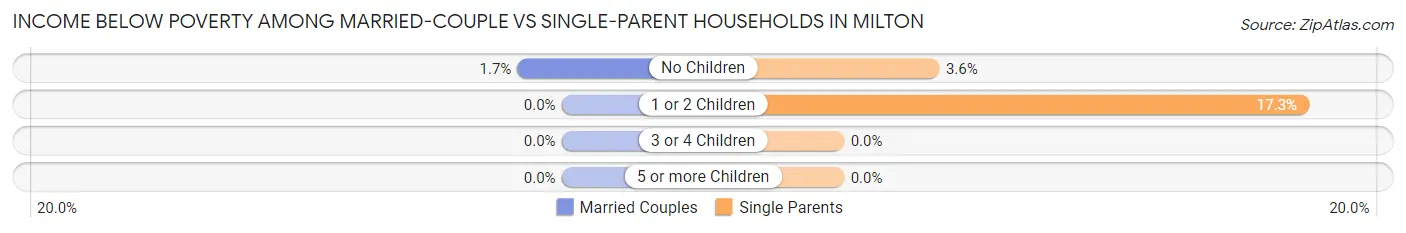
| Children | Married-Couple Families | Single-Parent Households |
| No Children | 44 (1.7%) | 15 (3.5%) |
| 1 or 2 Children | 0 (0.0%) | 127 (17.3%) |
| 3 or 4 Children | 0 (0.0%) | 0 (0.0%) |
| 5 or more Children | 0 (0.0%) | 0 (0.0%) |
| Total | 44 (0.7%) | 142 (11.9%) |
Race in Milton
The most populous races in Milton are White / Caucasian (20,003 | 70.3%), Black / African American (4,584 | 16.1%), and Two or more Races (1,797 | 6.3%).
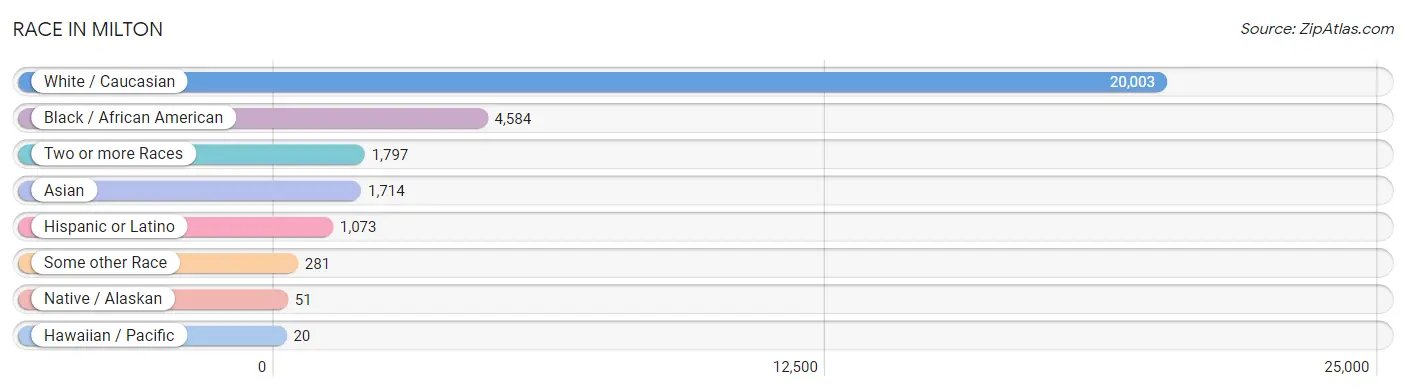
| Race | # Population | % Population |
| Asian | 1,714 | 6.0% |
| Black / African American | 4,584 | 16.1% |
| Hawaiian / Pacific | 20 | 0.1% |
| Hispanic or Latino | 1,073 | 3.8% |
| Native / Alaskan | 51 | 0.2% |
| White / Caucasian | 20,003 | 70.3% |
| Two or more Races | 1,797 | 6.3% |
| Some other Race | 281 | 1.0% |
| Total | 28,450 | 100.0% |
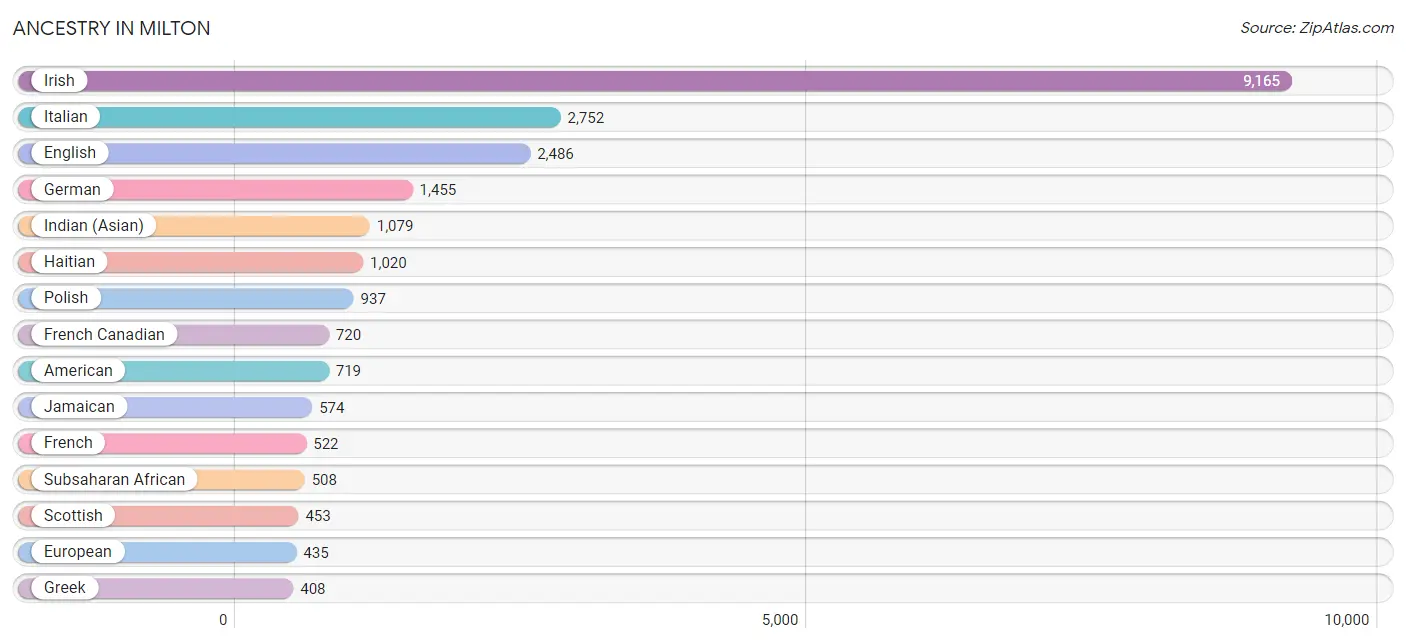
Ancestry in Milton
The most populous ancestries reported in Milton are Irish (9,165 | 32.2%), Italian (2,752 | 9.7%), English (2,486 | 8.7%), German (1,455 | 5.1%), and Indian (Asian) (1,079 | 3.8%), together accounting for 59.5% of all Milton residents.
| Ancestry | # Population | % Population |
| African | 66 | 0.2% |
| Alaska Native | 27 | 0.1% |
| American | 719 | 2.5% |
| Arab | 110 | 0.4% |
| Argentinean | 35 | 0.1% |
| Armenian | 148 | 0.5% |
| Australian | 24 | 0.1% |
| Austrian | 33 | 0.1% |
| Barbadian | 15 | 0.1% |
| Belgian | 31 | 0.1% |
| Belizean | 7 | 0.0% |
| Bhutanese | 49 | 0.2% |
| Brazilian | 12 | 0.0% |
| British | 77 | 0.3% |
| British West Indian | 4 | 0.0% |
| Bulgarian | 121 | 0.4% |
| Burmese | 216 | 0.8% |
| Cajun | 13 | 0.1% |
| Canadian | 195 | 0.7% |
| Cape Verdean | 27 | 0.1% |
| Celtic | 21 | 0.1% |
| Central American | 109 | 0.4% |
| Cherokee | 134 | 0.5% |
| Colombian | 117 | 0.4% |
| Croatian | 48 | 0.2% |
| Cuban | 56 | 0.2% |
| Czech | 185 | 0.6% |
| Czechoslovakian | 23 | 0.1% |
| Danish | 27 | 0.1% |
| Dominican | 162 | 0.6% |
| Dutch | 59 | 0.2% |
| Eastern European | 302 | 1.1% |
| Ecuadorian | 76 | 0.3% |
| English | 2,486 | 8.7% |
| Ethiopian | 15 | 0.1% |
| European | 435 | 1.5% |
| Filipino | 98 | 0.3% |
| Finnish | 50 | 0.2% |
| French | 522 | 1.8% |
| French Canadian | 720 | 2.5% |
| German | 1,455 | 5.1% |
| Ghanaian | 85 | 0.3% |
| Greek | 408 | 1.4% |
| Guamanian / Chamorro | 86 | 0.3% |
| Guatemalan | 19 | 0.1% |
| Haitian | 1,020 | 3.6% |
| Honduran | 6 | 0.0% |
| Hungarian | 73 | 0.3% |
| Indian (Asian) | 1,079 | 3.8% |
| Iranian | 28 | 0.1% |
| Irish | 9,165 | 32.2% |
| Italian | 2,752 | 9.7% |
| Jamaican | 574 | 2.0% |
| Japanese | 12 | 0.0% |
| Kenyan | 13 | 0.1% |
| Korean | 196 | 0.7% |
| Laotian | 45 | 0.2% |
| Latvian | 8 | 0.0% |
| Lebanese | 54 | 0.2% |
| Lithuanian | 183 | 0.6% |
| Mexican | 112 | 0.4% |
| Mongolian | 7 | 0.0% |
| Moroccan | 40 | 0.1% |
| Nigerian | 87 | 0.3% |
| Northern European | 78 | 0.3% |
| Norwegian | 357 | 1.3% |
| Okinawan | 7 | 0.0% |
| Panamanian | 37 | 0.1% |
| Polish | 937 | 3.3% |
| Portuguese | 282 | 1.0% |
| Puerto Rican | 349 | 1.2% |
| Romanian | 39 | 0.1% |
| Russian | 344 | 1.2% |
| Salvadoran | 47 | 0.2% |
| Scandinavian | 87 | 0.3% |
| Scotch-Irish | 93 | 0.3% |
| Scottish | 453 | 1.6% |
| Serbian | 35 | 0.1% |
| Sierra Leonean | 73 | 0.3% |
| Sioux | 25 | 0.1% |
| Slovak | 67 | 0.2% |
| Somali | 44 | 0.2% |
| South African | 20 | 0.1% |
| South American | 228 | 0.8% |
| Spaniard | 33 | 0.1% |
| Spanish | 15 | 0.1% |
| Sri Lankan | 177 | 0.6% |
| Subsaharan African | 508 | 1.8% |
| Swedish | 398 | 1.4% |
| Swiss | 17 | 0.1% |
| Syrian | 9 | 0.0% |
| Thai | 236 | 0.8% |
| Trinidadian and Tobagonian | 280 | 1.0% |
| Turkish | 5 | 0.0% |
| U.S. Virgin Islander | 23 | 0.1% |
| Ukrainian | 43 | 0.2% |
| Welsh | 103 | 0.4% |
| West Indian | 302 | 1.1% | View All 98 Rows |
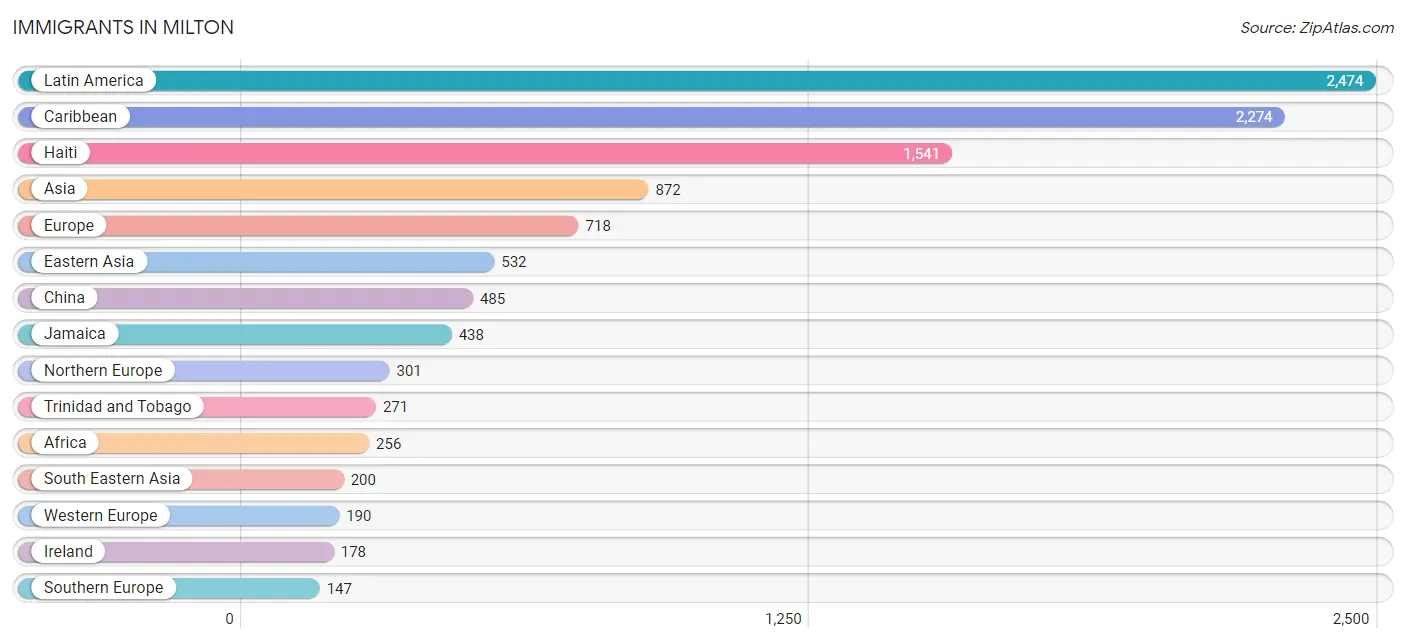
Immigrants in Milton
The most numerous immigrant groups reported in Milton came from Latin America (2,474 | 8.7%), Caribbean (2,274 | 8.0%), Haiti (1,541 | 5.4%), Asia (872 | 3.1%), and Europe (718 | 2.5%), together accounting for 27.7% of all Milton residents.
| Immigration Origin | # Population | % Population |
| Africa | 256 | 0.9% |
| Armenia | 10 | 0.0% |
| Asia | 872 | 3.1% |
| Australia | 15 | 0.1% |
| Austria | 12 | 0.0% |
| Azores | 12 | 0.0% |
| Brazil | 21 | 0.1% |
| Canada | 71 | 0.3% |
| Caribbean | 2,274 | 8.0% |
| Central America | 106 | 0.4% |
| Chile | 11 | 0.0% |
| China | 485 | 1.7% |
| Colombia | 62 | 0.2% |
| Dominican Republic | 20 | 0.1% |
| Eastern Africa | 60 | 0.2% |
| Eastern Asia | 532 | 1.9% |
| Eastern Europe | 80 | 0.3% |
| El Salvador | 65 | 0.2% |
| England | 23 | 0.1% |
| Ethiopia | 28 | 0.1% |
| Europe | 718 | 2.5% |
| France | 49 | 0.2% |
| Germany | 94 | 0.3% |
| Ghana | 32 | 0.1% |
| Greece | 85 | 0.3% |
| Guatemala | 4 | 0.0% |
| Haiti | 1,541 | 5.4% |
| Hong Kong | 126 | 0.4% |
| India | 77 | 0.3% |
| Iran | 28 | 0.1% |
| Ireland | 178 | 0.6% |
| Italy | 31 | 0.1% |
| Jamaica | 438 | 1.5% |
| Japan | 24 | 0.1% |
| Kenya | 8 | 0.0% |
| Korea | 23 | 0.1% |
| Latin America | 2,474 | 8.7% |
| Lithuania | 15 | 0.1% |
| Mexico | 37 | 0.1% |
| Morocco | 29 | 0.1% |
| Nepal | 6 | 0.0% |
| Netherlands | 35 | 0.1% |
| Northern Africa | 29 | 0.1% |
| Northern Europe | 301 | 1.1% |
| Oceania | 61 | 0.2% |
| Pakistan | 10 | 0.0% |
| Philippines | 62 | 0.2% |
| Portugal | 31 | 0.1% |
| Romania | 10 | 0.0% |
| Russia | 50 | 0.2% |
| Sierra Leone | 90 | 0.3% |
| Somalia | 11 | 0.0% |
| South Africa | 33 | 0.1% |
| South America | 94 | 0.3% |
| South Central Asia | 121 | 0.4% |
| South Eastern Asia | 200 | 0.7% |
| Southern Europe | 147 | 0.5% |
| Sweden | 10 | 0.0% |
| Taiwan | 64 | 0.2% |
| Thailand | 15 | 0.1% |
| Trinidad and Tobago | 271 | 0.9% |
| Turkey | 9 | 0.0% |
| Ukraine | 5 | 0.0% |
| Vietnam | 123 | 0.4% |
| Western Africa | 134 | 0.5% |
| Western Asia | 19 | 0.1% |
| Western Europe | 190 | 0.7% | View All 67 Rows |
Sex and Age in Milton
Sex and Age in Milton
The most populous age groups in Milton are 5 to 9 Years (1,246 | 9.3%) for men and 15 to 19 Years (1,552 | 10.3%) for women.
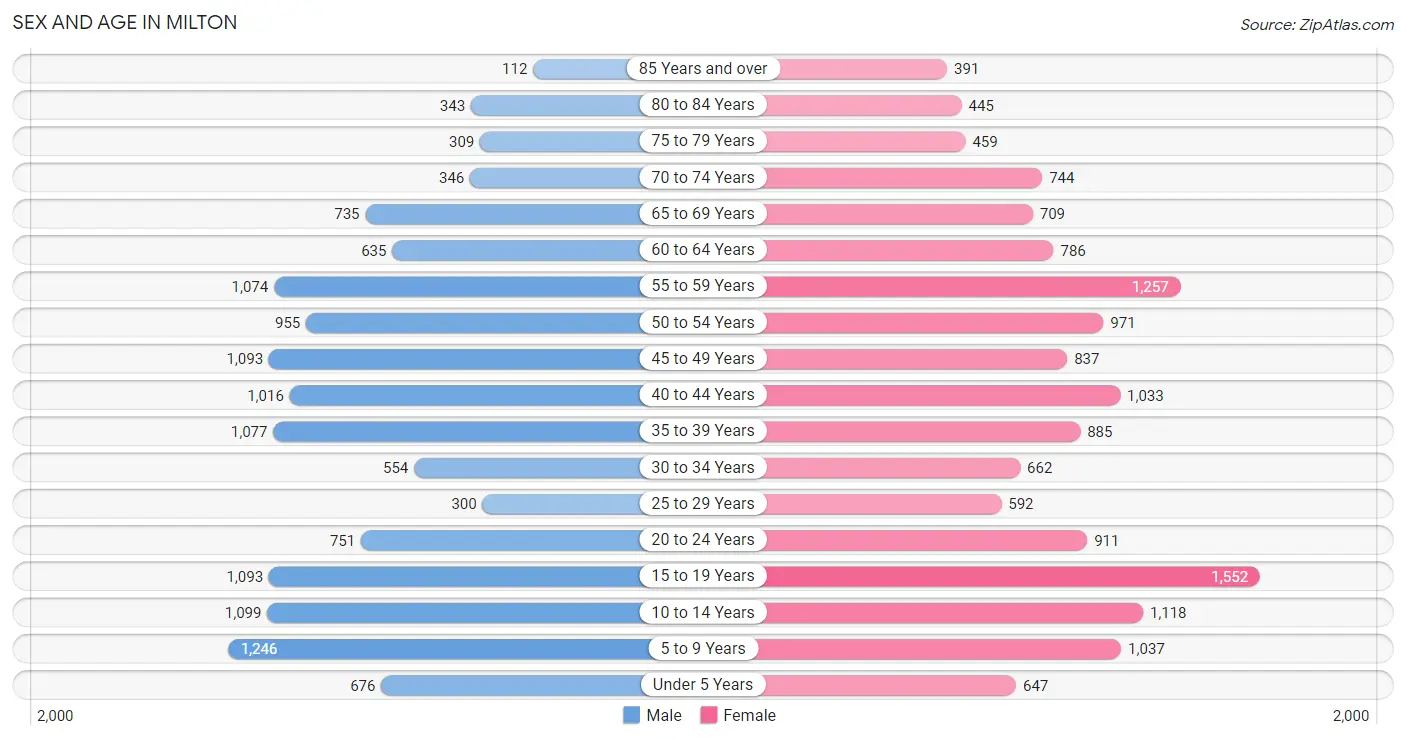
| Age Bracket | Male | Female |
| Under 5 Years | 676 (5.0%) | 647 (4.3%) |
| 5 to 9 Years | 1,246 (9.3%) | 1,037 (6.9%) |
| 10 to 14 Years | 1,099 (8.2%) | 1,118 (7.4%) |
| 15 to 19 Years | 1,093 (8.2%) | 1,552 (10.3%) |
| 20 to 24 Years | 751 (5.6%) | 911 (6.1%) |
| 25 to 29 Years | 300 (2.2%) | 592 (3.9%) |
| 30 to 34 Years | 554 (4.1%) | 662 (4.4%) |
| 35 to 39 Years | 1,077 (8.0%) | 885 (5.9%) |
| 40 to 44 Years | 1,016 (7.6%) | 1,033 (6.9%) |
| 45 to 49 Years | 1,093 (8.2%) | 837 (5.6%) |
| 50 to 54 Years | 955 (7.1%) | 971 (6.5%) |
| 55 to 59 Years | 1,074 (8.0%) | 1,257 (8.4%) |
| 60 to 64 Years | 635 (4.7%) | 786 (5.2%) |
| 65 to 69 Years | 735 (5.5%) | 709 (4.7%) |
| 70 to 74 Years | 346 (2.6%) | 744 (5.0%) |
| 75 to 79 Years | 309 (2.3%) | 459 (3.0%) |
| 80 to 84 Years | 343 (2.6%) | 445 (3.0%) |
| 85 Years and over | 112 (0.8%) | 391 (2.6%) |
| Total | 13,414 (100.0%) | 15,036 (100.0%) |
Families and Households in Milton
Median Family Size in Milton
The median family size in Milton is 3.31 persons per family, with married-couple families (5,862 | 83.0%) accounting for the largest median family size of 3.42 persons per family. On the other hand, single male/father families (261 | 3.7%) represent the smallest median family size with 2.63 persons per family.
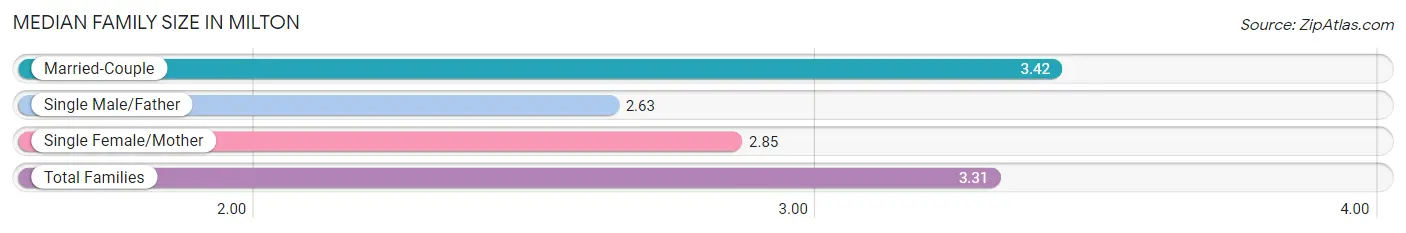
| Family Type | # Families | Family Size |
| Married-Couple | 5,862 (83.0%) | 3.42 |
| Single Male/Father | 261 (3.7%) | 2.63 |
| Single Female/Mother | 936 (13.3%) | 2.85 |
| Total Families | 7,059 (100.0%) | 3.31 |
Median Household Size in Milton
The median household size in Milton is 2.94 persons per household, with married-couple households (5,862 | 64.1%) accounting for the largest median household size of 3.49 persons per household. non-family households (2,080 | 22.8%) represent the smallest median household size with 1.25 persons per household.
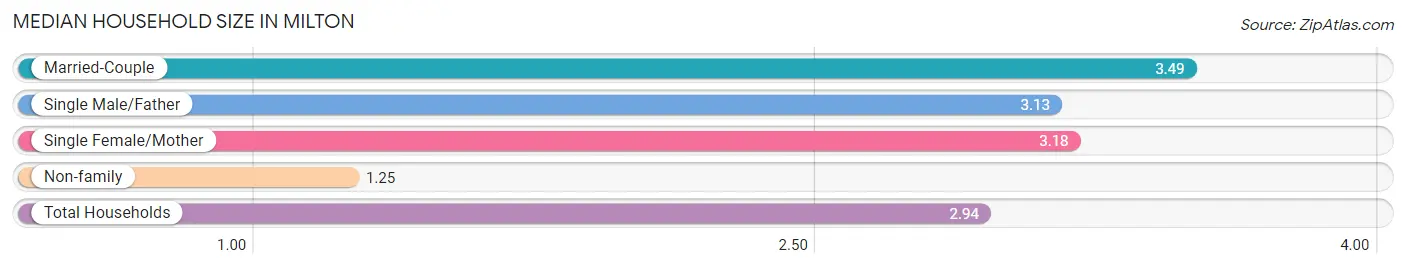
| Household Type | # Households | Household Size |
| Married-Couple | 5,862 (64.1%) | 3.49 |
| Single Male/Father | 261 (2.9%) | 3.13 |
| Single Female/Mother | 936 (10.2%) | 3.18 |
| Non-family | 2,080 (22.8%) | 1.25 |
| Total Households | 9,139 (100.0%) | 2.94 |
Household Size by Marriage Status in Milton
Out of a total of 9,139 households in Milton, 7,059 (77.2%) are family households, while 2,080 (22.8%) are nonfamily households. The most numerous type of family households are 4-person households, comprising 2,186, and the most common type of nonfamily households are 1-person households, comprising 1,670.
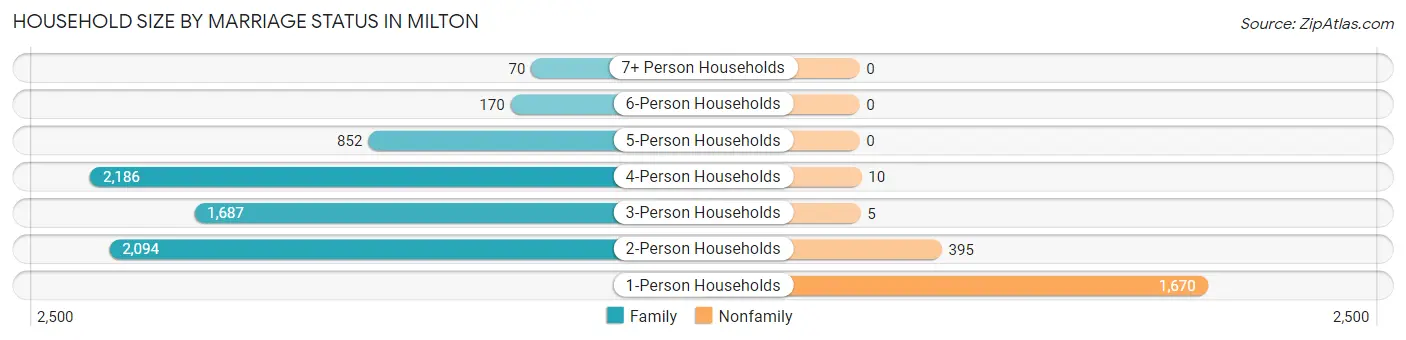
| Household Size | Family Households | Nonfamily Households |
| 1-Person Households | - | 1,670 (18.3%) |
| 2-Person Households | 2,094 (22.9%) | 395 (4.3%) |
| 3-Person Households | 1,687 (18.5%) | 5 (0.1%) |
| 4-Person Households | 2,186 (23.9%) | 10 (0.1%) |
| 5-Person Households | 852 (9.3%) | 0 (0.0%) |
| 6-Person Households | 170 (1.9%) | 0 (0.0%) |
| 7+ Person Households | 70 (0.8%) | 0 (0.0%) |
| Total | 7,059 (77.2%) | 2,080 (22.8%) |
Female Fertility in Milton
Fertility by Age in Milton
Average fertility rate in Milton is 45.0 births per 1,000 women. Women in the age bracket of 35 to 50 years have the highest fertility rate with 69.0 births per 1,000 women. Women in the age bracket of 35 to 50 years acount for 69.8% of all women with births.
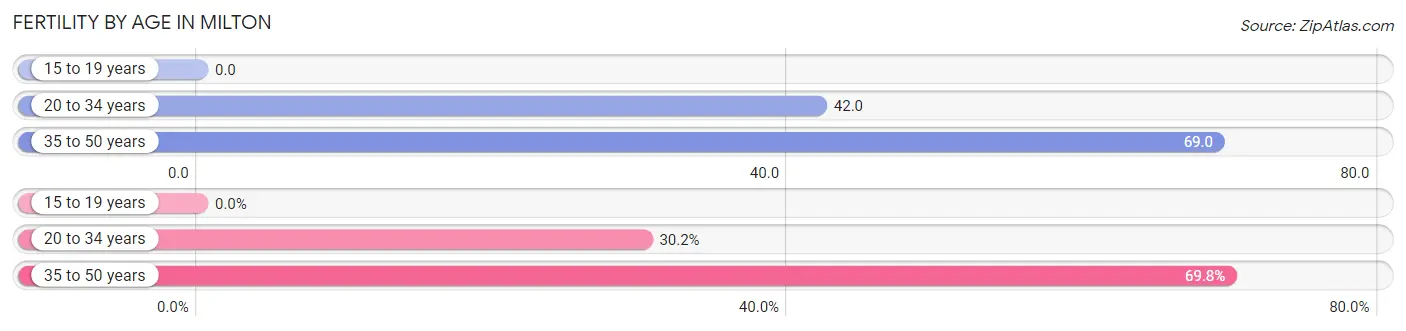
| Age Bracket | Women with Births | Births / 1,000 Women |
| 15 to 19 years | 0 (0.0%) | 0.0 |
| 20 to 34 years | 92 (30.2%) | 42.0 |
| 35 to 50 years | 213 (69.8%) | 69.0 |
| Total | 305 (100.0%) | 45.0 |
Fertility by Age by Marriage Status in Milton
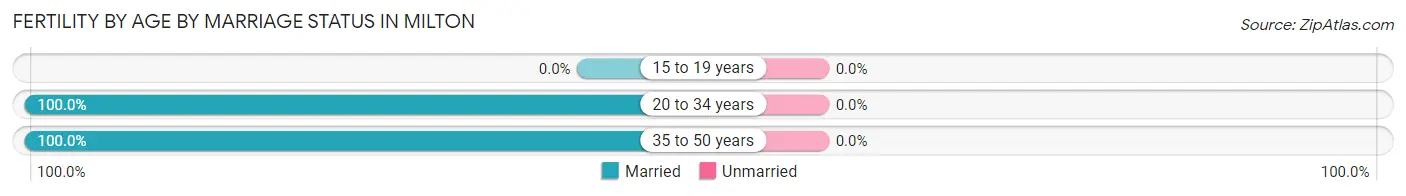
| Age Bracket | Married | Unmarried |
| 15 to 19 years | 0 (0.0%) | 0 (0.0%) |
| 20 to 34 years | 92 (100.0%) | 0 (0.0%) |
| 35 to 50 years | 213 (100.0%) | 0 (0.0%) |
| Total | 305 (100.0%) | 0 (0.0%) |
Fertility by Education in Milton
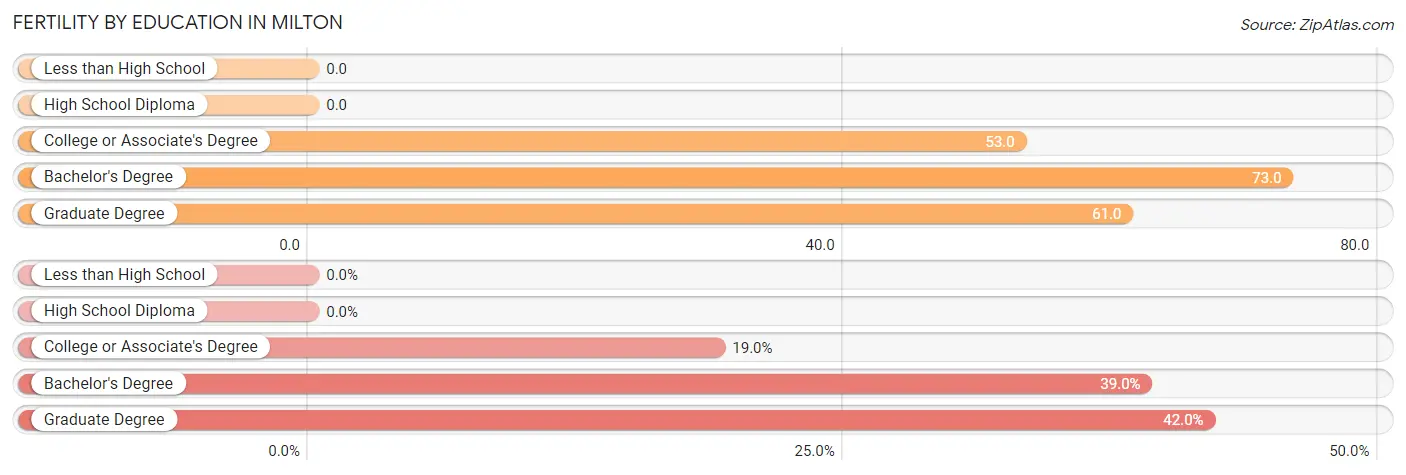
| Educational Attainment | Women with Births | Births / 1,000 Women |
| Less than High School | 0 (0.0%) | 0.0 |
| High School Diploma | 0 (0.0%) | 0.0 |
| College or Associate's Degree | 58 (19.0%) | 53.0 |
| Bachelor's Degree | 119 (39.0%) | 73.0 |
| Graduate Degree | 128 (42.0%) | 61.0 |
| Total | 305 (100.0%) | 45.0 |
Fertility by Education by Marriage Status in Milton
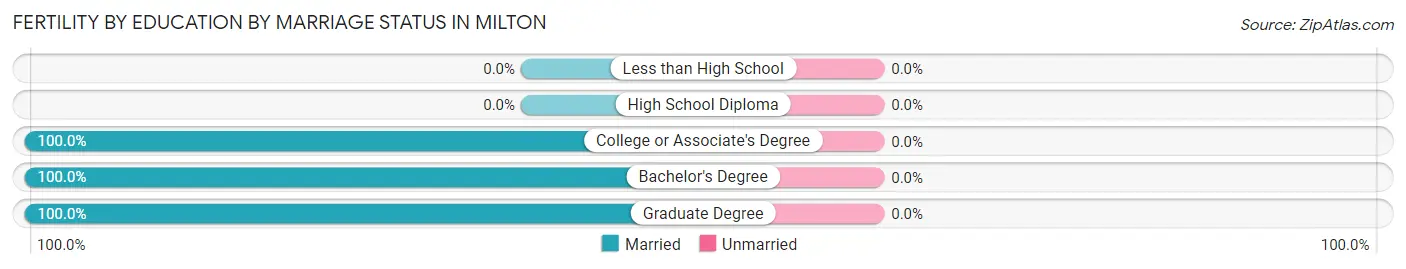
| Educational Attainment | Married | Unmarried |
| Less than High School | 0 (0.0%) | 0 (0.0%) |
| High School Diploma | 0 (0.0%) | 0 (0.0%) |
| College or Associate's Degree | 58 (100.0%) | 0 (0.0%) |
| Bachelor's Degree | 119 (100.0%) | 0 (0.0%) |
| Graduate Degree | 128 (100.0%) | 0 (0.0%) |
| Total | 305 (100.0%) | 0 (0.0%) |
Employment Characteristics in Milton
Employment by Class of Employer in Milton
Among the 14,429 employed individuals in Milton, private company employees (8,231 | 57.0%), not-for-profit organizations (2,430 | 16.8%), and state government employees (971 | 6.7%) make up the most common classes of employment.
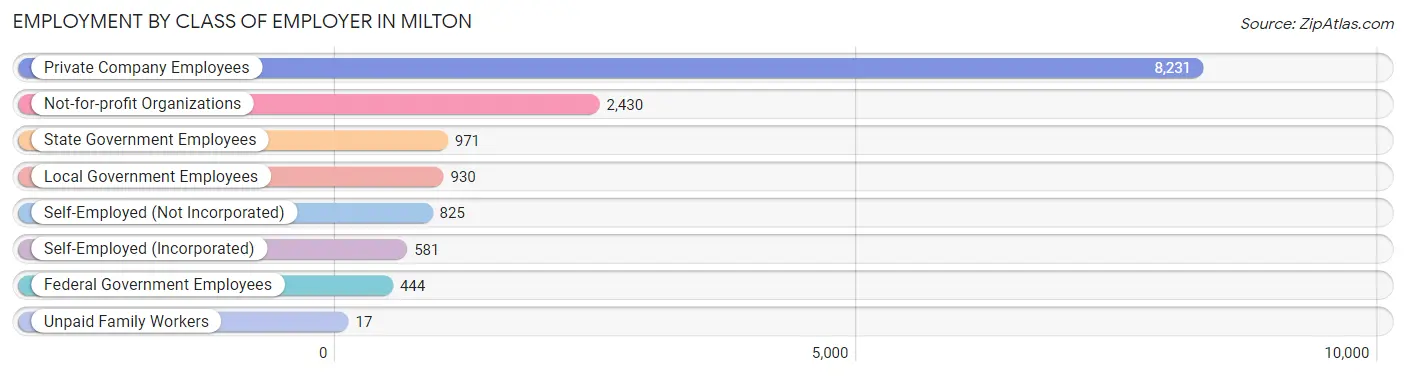
| Employer Class | # Employees | % Employees |
| Private Company Employees | 8,231 | 57.0% |
| Self-Employed (Incorporated) | 581 | 4.0% |
| Self-Employed (Not Incorporated) | 825 | 5.7% |
| Not-for-profit Organizations | 2,430 | 16.8% |
| Local Government Employees | 930 | 6.5% |
| State Government Employees | 971 | 6.7% |
| Federal Government Employees | 444 | 3.1% |
| Unpaid Family Workers | 17 | 0.1% |
| Total | 14,429 | 100.0% |
Employment Status by Age in Milton
According to the labor force statistics for Milton, out of the total population over 16 years of age (22,181), 69.5% or 15,416 individuals are in the labor force, with 3.8% or 586 of them unemployed. The age group with the highest labor force participation rate is 55 to 59 years, with 93.4% or 2,177 individuals in the labor force. Within the labor force, the 65 to 74 years age range has the highest percentage of unemployed individuals, with 14.1% or 157 of them being unemployed.
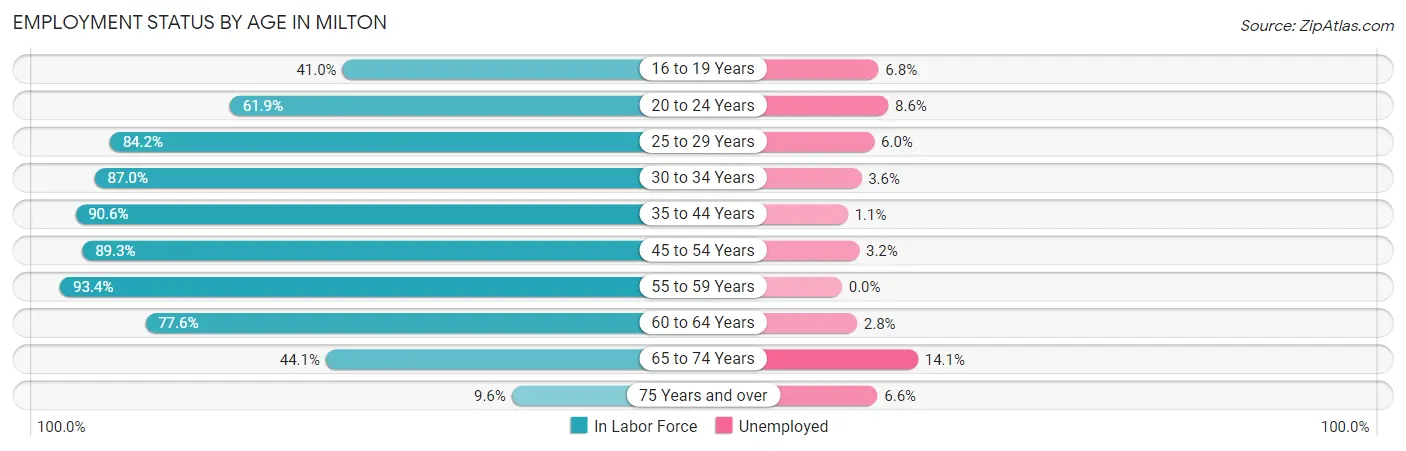
| Age Bracket | In Labor Force | Unemployed |
| 16 to 19 Years | 902 (41.0%) | 61 (6.8%) |
| 20 to 24 Years | 1,029 (61.9%) | 88 (8.6%) |
| 25 to 29 Years | 751 (84.2%) | 45 (6.0%) |
| 30 to 34 Years | 1,058 (87.0%) | 38 (3.6%) |
| 35 to 44 Years | 3,634 (90.6%) | 40 (1.1%) |
| 45 to 54 Years | 3,443 (89.3%) | 110 (3.2%) |
| 55 to 59 Years | 2,177 (93.4%) | 0 (0.0%) |
| 60 to 64 Years | 1,103 (77.6%) | 31 (2.8%) |
| 65 to 74 Years | 1,117 (44.1%) | 157 (14.1%) |
| 75 Years and over | 198 (9.6%) | 13 (6.6%) |
| Total | 15,416 (69.5%) | 586 (3.8%) |
Employment Status by Educational Attainment in Milton
According to labor force statistics for Milton, 88.6% of individuals (12,162) out of the total population between 25 and 64 years of age (13,727) are in the labor force, with 2.2% or 268 of them being unemployed. The group with the highest labor force participation rate are those with the educational attainment of high school diploma, with 91.7% or 1,454 individuals in the labor force. Within the labor force, individuals with high school diploma education have the highest percentage of unemployment, with 5.4% or 79 of them being unemployed.
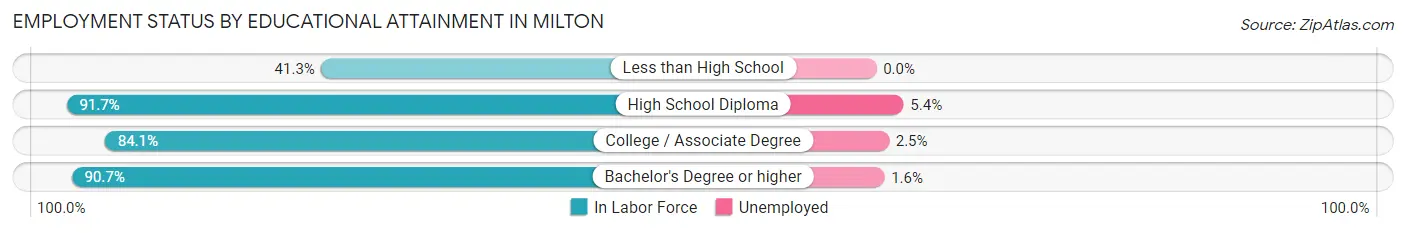
| Educational Attainment | In Labor Force | Unemployed |
| Less than High School | 159 (41.3%) | 0 (0.0%) |
| High School Diploma | 1,454 (91.7%) | 86 (5.4%) |
| College / Associate Degree | 1,374 (84.1%) | 41 (2.5%) |
| Bachelor's Degree or higher | 9,181 (90.7%) | 162 (1.6%) |
| Total | 12,162 (88.6%) | 302 (2.2%) |
Employment Occupations by Sex in Milton
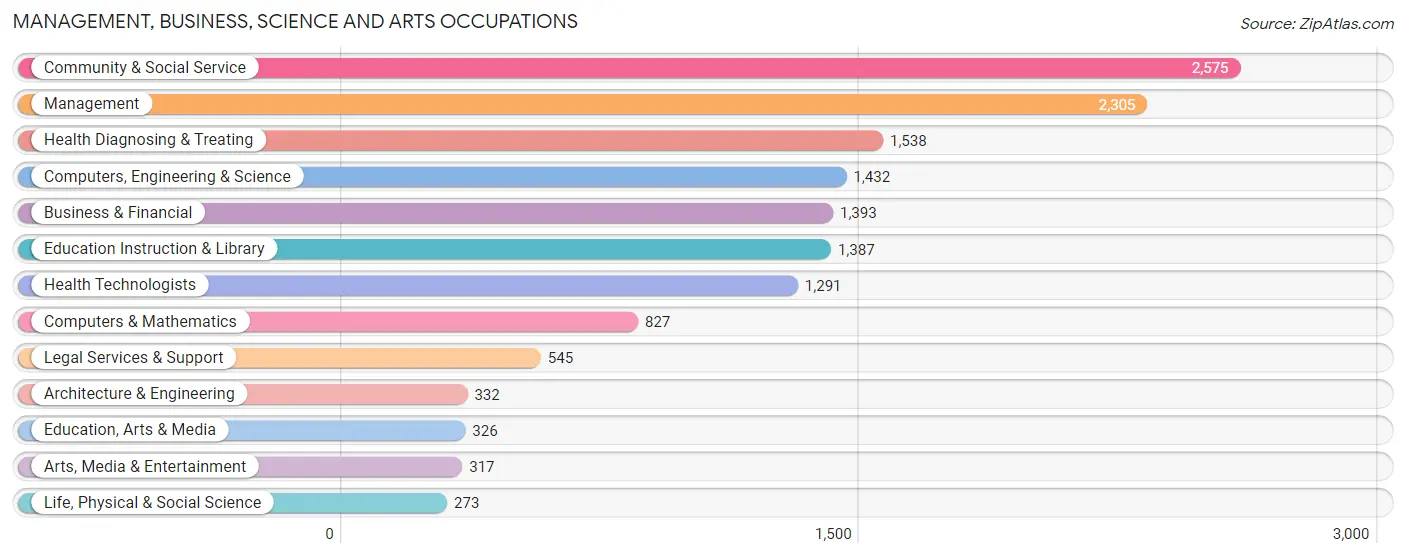
Management, Business, Science and Arts Occupations
The most common Management, Business, Science and Arts occupations in Milton are Community & Social Service (2,575 | 17.4%), Management (2,305 | 15.5%), Health Diagnosing & Treating (1,538 | 10.4%), Computers, Engineering & Science (1,432 | 9.7%), and Business & Financial (1,393 | 9.4%).
Management, Business, Science and Arts Occupations by Sex
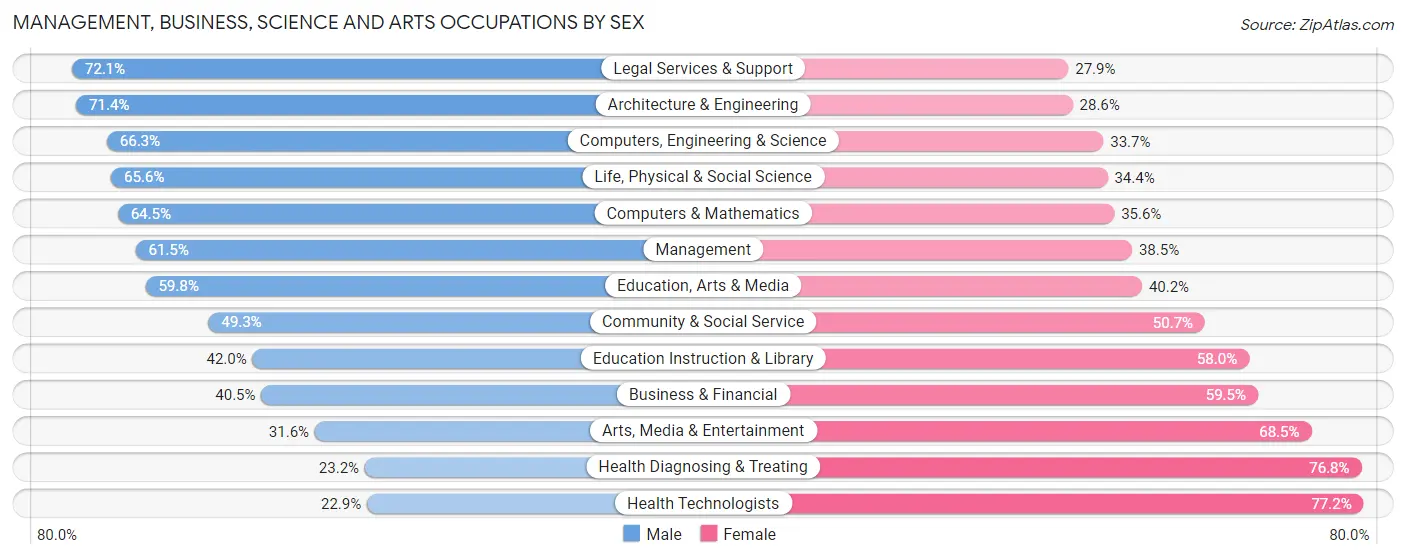
Within the Management, Business, Science and Arts occupations in Milton, the most male-oriented occupations are Legal Services & Support (72.1%), Architecture & Engineering (71.4%), and Computers, Engineering & Science (66.3%), while the most female-oriented occupations are Health Technologists (77.1%), Health Diagnosing & Treating (76.8%), and Arts, Media & Entertainment (68.4%).
| Occupation | Male | Female |
| Management | 1,417 (61.5%) | 888 (38.5%) |
| Business & Financial | 564 (40.5%) | 829 (59.5%) |
| Computers, Engineering & Science | 949 (66.3%) | 483 (33.7%) |
| Computers & Mathematics | 533 (64.4%) | 294 (35.5%) |
| Architecture & Engineering | 237 (71.4%) | 95 (28.6%) |
| Life, Physical & Social Science | 179 (65.6%) | 94 (34.4%) |
| Community & Social Service | 1,270 (49.3%) | 1,305 (50.7%) |
| Education, Arts & Media | 195 (59.8%) | 131 (40.2%) |
| Legal Services & Support | 393 (72.1%) | 152 (27.9%) |
| Education Instruction & Library | 582 (42.0%) | 805 (58.0%) |
| Arts, Media & Entertainment | 100 (31.6%) | 217 (68.4%) |
| Health Diagnosing & Treating | 357 (23.2%) | 1,181 (76.8%) |
| Health Technologists | 295 (22.9%) | 996 (77.1%) |
| Total (Category) | 4,557 (49.3%) | 4,686 (50.7%) |
| Total (Overall) | 7,441 (50.2%) | 7,386 (49.8%) |
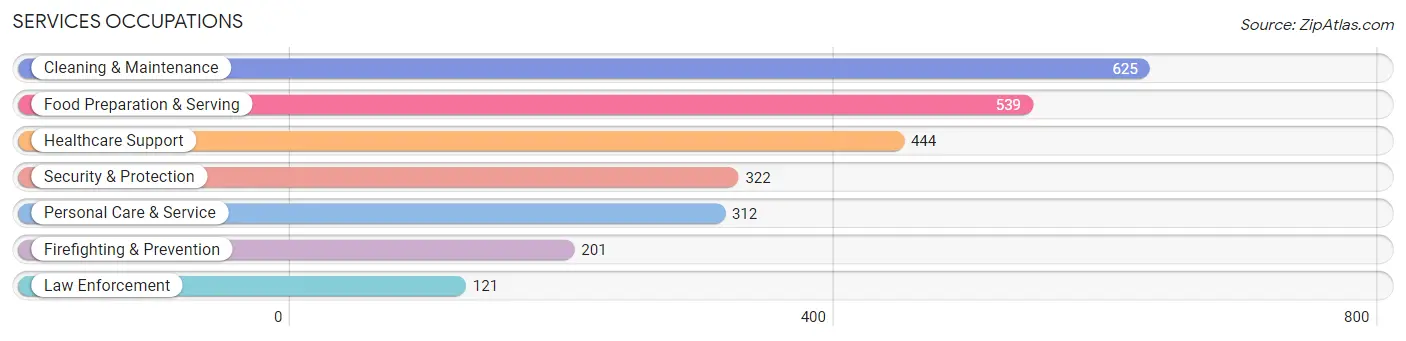
Services Occupations
The most common Services occupations in Milton are Cleaning & Maintenance (625 | 4.2%), Food Preparation & Serving (539 | 3.6%), Healthcare Support (444 | 3.0%), Security & Protection (322 | 2.2%), and Personal Care & Service (312 | 2.1%).
Services Occupations by Sex
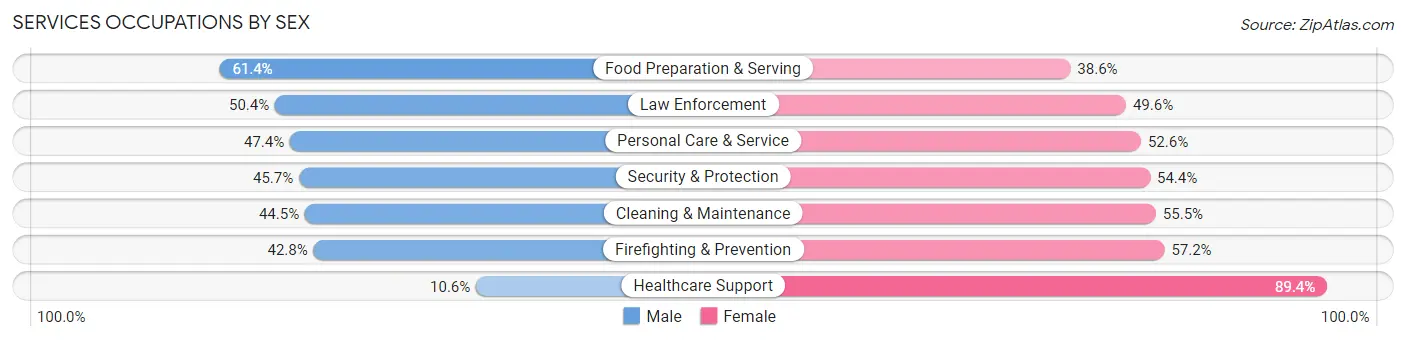
Within the Services occupations in Milton, the most male-oriented occupations are Food Preparation & Serving (61.4%), Law Enforcement (50.4%), and Personal Care & Service (47.4%), while the most female-oriented occupations are Healthcare Support (89.4%), Firefighting & Prevention (57.2%), and Cleaning & Maintenance (55.5%).
| Occupation | Male | Female |
| Healthcare Support | 47 (10.6%) | 397 (89.4%) |
| Security & Protection | 147 (45.7%) | 175 (54.3%) |
| Firefighting & Prevention | 86 (42.8%) | 115 (57.2%) |
| Law Enforcement | 61 (50.4%) | 60 (49.6%) |
| Food Preparation & Serving | 331 (61.4%) | 208 (38.6%) |
| Cleaning & Maintenance | 278 (44.5%) | 347 (55.5%) |
| Personal Care & Service | 148 (47.4%) | 164 (52.6%) |
| Total (Category) | 951 (42.4%) | 1,291 (57.6%) |
| Total (Overall) | 7,441 (50.2%) | 7,386 (49.8%) |
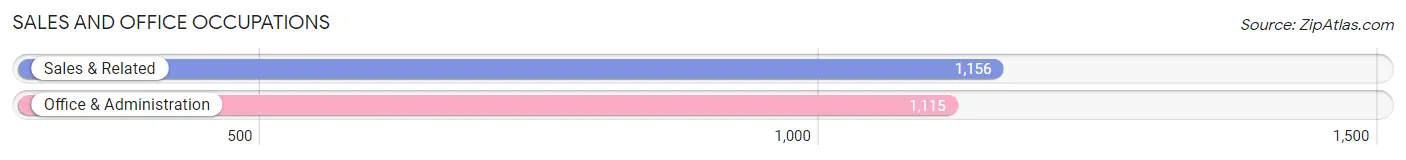
Sales and Office Occupations
The most common Sales and Office occupations in Milton are Sales & Related (1,156 | 7.8%), and Office & Administration (1,115 | 7.5%).
Sales and Office Occupations by Sex
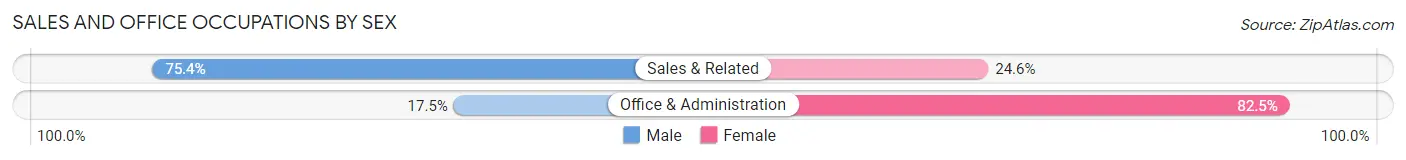
| Occupation | Male | Female |
| Sales & Related | 872 (75.4%) | 284 (24.6%) |
| Office & Administration | 195 (17.5%) | 920 (82.5%) |
| Total (Category) | 1,067 (47.0%) | 1,204 (53.0%) |
| Total (Overall) | 7,441 (50.2%) | 7,386 (49.8%) |
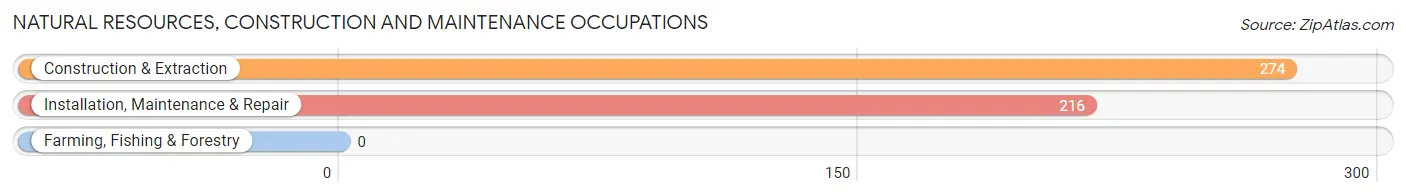
Natural Resources, Construction and Maintenance Occupations
The most common Natural Resources, Construction and Maintenance occupations in Milton are Construction & Extraction (274 | 1.8%), and Installation, Maintenance & Repair (216 | 1.5%).
Natural Resources, Construction and Maintenance Occupations by Sex
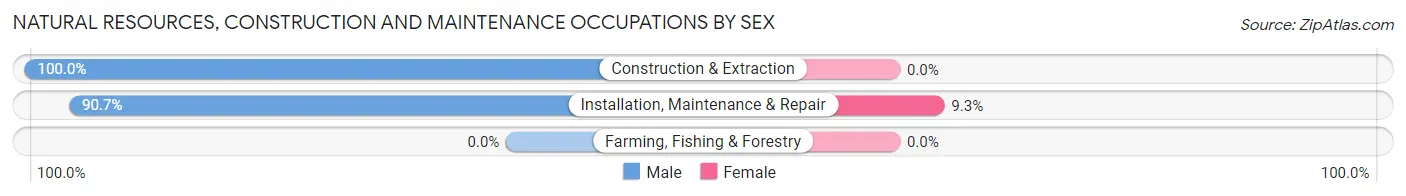
| Occupation | Male | Female |
| Farming, Fishing & Forestry | 0 (0.0%) | 0 (0.0%) |
| Construction & Extraction | 274 (100.0%) | 0 (0.0%) |
| Installation, Maintenance & Repair | 196 (90.7%) | 20 (9.3%) |
| Total (Category) | 470 (95.9%) | 20 (4.1%) |
| Total (Overall) | 7,441 (50.2%) | 7,386 (49.8%) |
Production, Transportation and Moving Occupations
The most common Production, Transportation and Moving occupations in Milton are Production (262 | 1.8%), Transportation (258 | 1.7%), and Material Moving (61 | 0.4%).
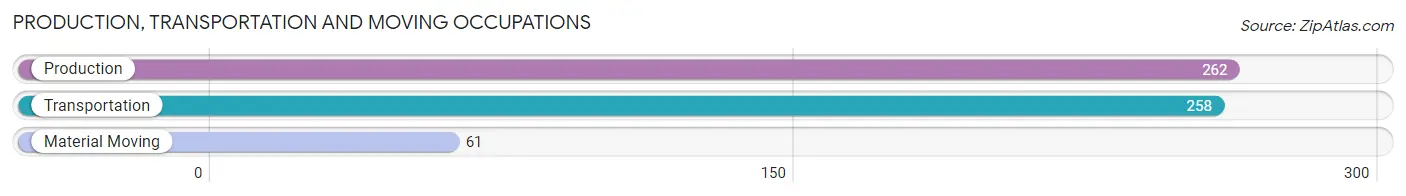
Production, Transportation and Moving Occupations by Sex
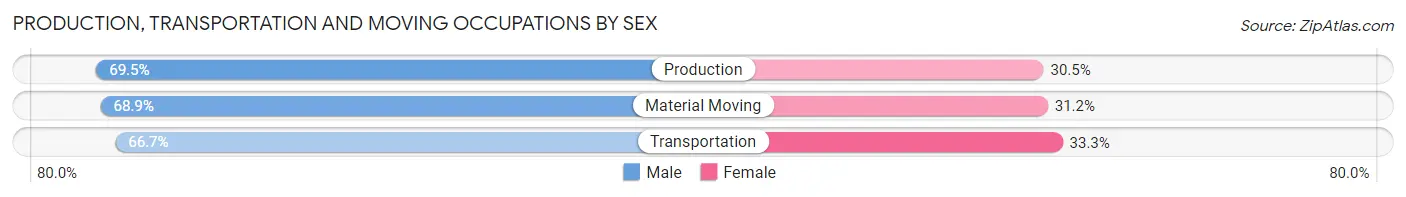
| Occupation | Male | Female |
| Production | 182 (69.5%) | 80 (30.5%) |
| Transportation | 172 (66.7%) | 86 (33.3%) |
| Material Moving | 42 (68.9%) | 19 (31.1%) |
| Total (Category) | 396 (68.2%) | 185 (31.8%) |
| Total (Overall) | 7,441 (50.2%) | 7,386 (49.8%) |
Employment Industries by Sex in Milton
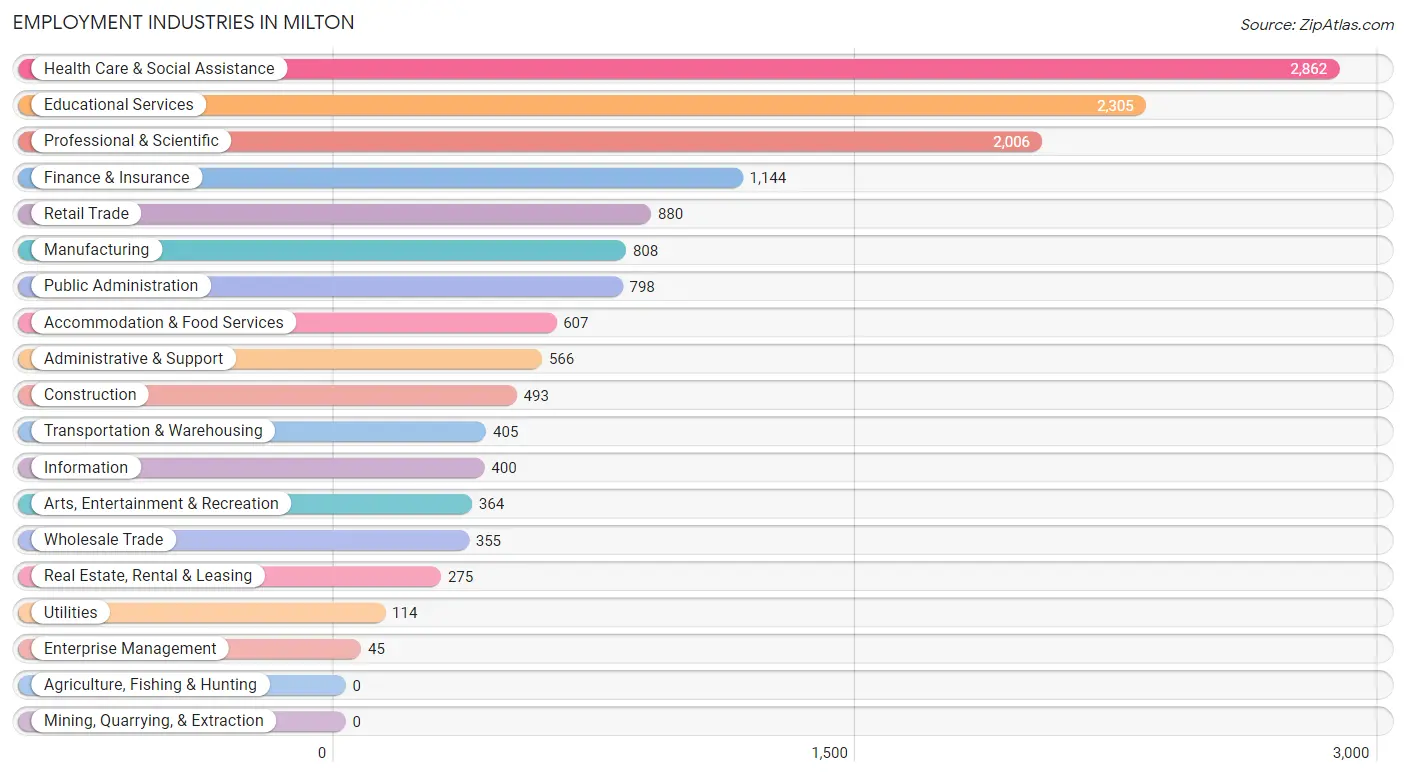
Employment Industries in Milton
The major employment industries in Milton include Health Care & Social Assistance (2,862 | 19.3%), Educational Services (2,305 | 15.5%), Professional & Scientific (2,006 | 13.5%), Finance & Insurance (1,144 | 7.7%), and Retail Trade (880 | 5.9%).
Employment Industries by Sex in Milton
The Milton industries that see more men than women are Construction (90.5%), Real Estate, Rental & Leasing (89.1%), and Utilities (77.2%), whereas the industries that tend to have a higher number of women are Administrative & Support (70.9%), Health Care & Social Assistance (69.8%), and Educational Services (55.5%).
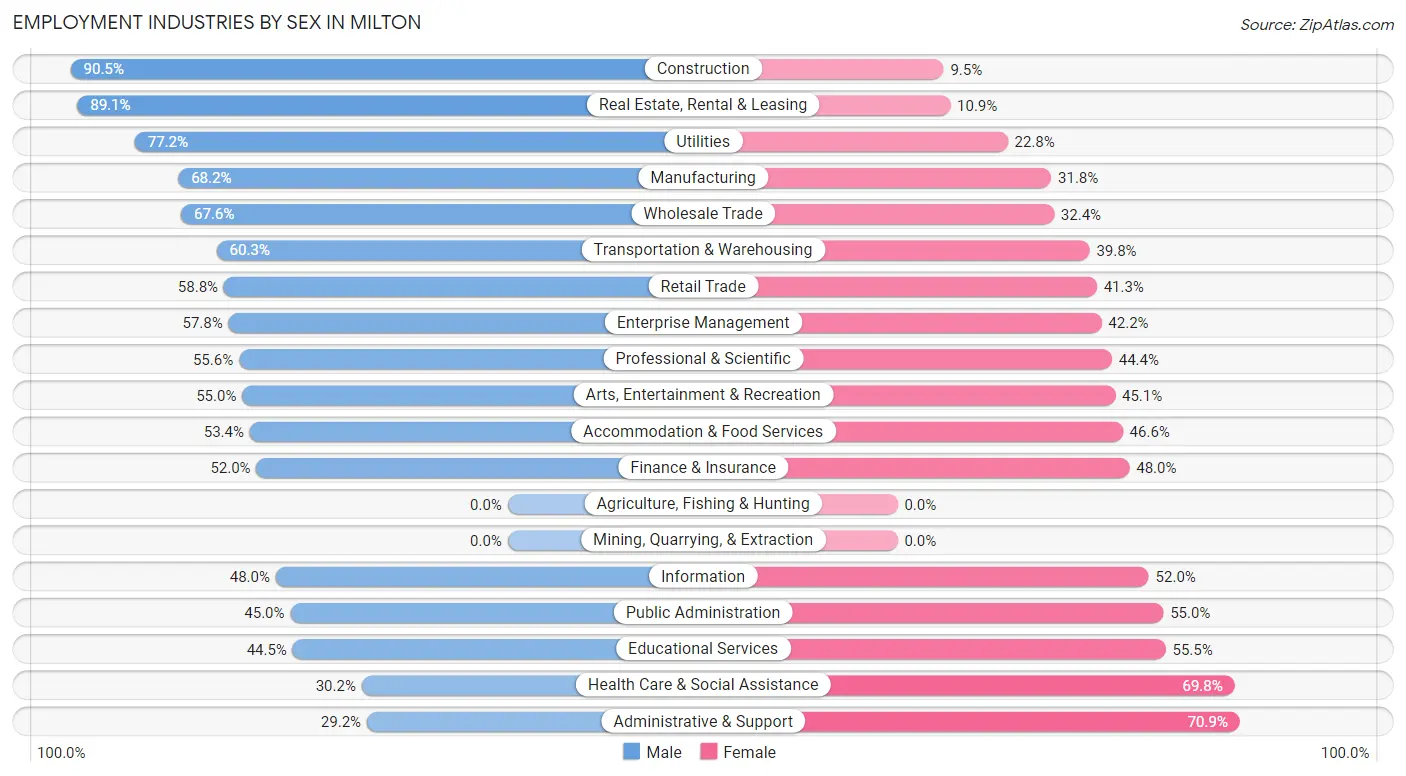
| Industry | Male | Female |
| Agriculture, Fishing & Hunting | 0 (0.0%) | 0 (0.0%) |
| Mining, Quarrying, & Extraction | 0 (0.0%) | 0 (0.0%) |
| Construction | 446 (90.5%) | 47 (9.5%) |
| Manufacturing | 551 (68.2%) | 257 (31.8%) |
| Wholesale Trade | 240 (67.6%) | 115 (32.4%) |
| Retail Trade | 517 (58.8%) | 363 (41.2%) |
| Transportation & Warehousing | 244 (60.3%) | 161 (39.8%) |
| Utilities | 88 (77.2%) | 26 (22.8%) |
| Information | 192 (48.0%) | 208 (52.0%) |
| Finance & Insurance | 595 (52.0%) | 549 (48.0%) |
| Real Estate, Rental & Leasing | 245 (89.1%) | 30 (10.9%) |
| Professional & Scientific | 1,116 (55.6%) | 890 (44.4%) |
| Enterprise Management | 26 (57.8%) | 19 (42.2%) |
| Administrative & Support | 165 (29.1%) | 401 (70.9%) |
| Educational Services | 1,026 (44.5%) | 1,279 (55.5%) |
| Health Care & Social Assistance | 865 (30.2%) | 1,997 (69.8%) |
| Arts, Entertainment & Recreation | 200 (54.9%) | 164 (45.1%) |
| Accommodation & Food Services | 324 (53.4%) | 283 (46.6%) |
| Public Administration | 359 (45.0%) | 439 (55.0%) |
| Total | 7,441 (50.2%) | 7,386 (49.8%) |
Education in Milton
School Enrollment in Milton
The most common levels of schooling among the 9,242 students in Milton are college / undergraduate (2,419 | 26.2%), middle school (1,955 | 21.1%), and high school (1,708 | 18.5%).
| School Level | # Students | % Students |
| Nursery / Preschool | 527 | 5.7% |
| Kindergarten | 418 | 4.5% |
| Elementary School | 1,707 | 18.5% |
| Middle School | 1,955 | 21.1% |
| High School | 1,708 | 18.5% |
| College / Undergraduate | 2,419 | 26.2% |
| Graduate / Professional | 508 | 5.5% |
| Total | 9,242 | 100.0% |
School Enrollment by Age by Funding Source in Milton
Out of a total of 9,242 students who are enrolled in schools in Milton, 3,447 (37.3%) attend a private institution, while the remaining 5,795 (62.7%) are enrolled in public schools. The age group of 18 to 19 year olds has the highest likelihood of being enrolled in private schools, with 1,051 (85.5% in the age bracket) enrolled. Conversely, the age group of 5 to 9 year old has the lowest likelihood of being enrolled in a private school, with 1,985 (91.4% in the age bracket) attending a public institution.
| Age Bracket | Public School | Private School |
| 3 to 4 Year Olds | 91 (28.3%) | 231 (71.7%) |
| 5 to 9 Year Old | 1,985 (91.4%) | 186 (8.6%) |
| 10 to 14 Year Olds | 1,965 (88.6%) | 252 (11.4%) |
| 15 to 17 Year Olds | 895 (65.7%) | 468 (34.3%) |
| 18 to 19 Year Olds | 179 (14.5%) | 1,051 (85.5%) |
| 20 to 24 Year Olds | 225 (20.2%) | 891 (79.8%) |
| 25 to 34 Year Olds | 230 (61.5%) | 144 (38.5%) |
| 35 Years and over | 226 (50.3%) | 223 (49.7%) |
| Total | 5,795 (62.7%) | 3,447 (37.3%) |
Educational Attainment by Field of Study in Milton
Business (2,467 | 18.3%), social sciences (1,988 | 14.7%), education (1,169 | 8.7%), literature & languages (1,070 | 7.9%), and science & technology (1,068 | 7.9%) are the most common fields of study among 13,498 individuals in Milton who have obtained a bachelor's degree or higher.
| Field of Study | # Graduates | % Graduates |
| Computers & Mathematics | 305 | 2.3% |
| Bio, Nature & Agricultural | 1,013 | 7.5% |
| Physical & Health Sciences | 404 | 3.0% |
| Psychology | 736 | 5.4% |
| Social Sciences | 1,988 | 14.7% |
| Engineering | 955 | 7.1% |
| Multidisciplinary Studies | 97 | 0.7% |
| Science & Technology | 1,068 | 7.9% |
| Business | 2,467 | 18.3% |
| Education | 1,169 | 8.7% |
| Literature & Languages | 1,070 | 7.9% |
| Liberal Arts & History | 817 | 6.0% |
| Visual & Performing Arts | 453 | 3.4% |
| Communications | 404 | 3.0% |
| Arts & Humanities | 552 | 4.1% |
| Total | 13,498 | 100.0% |
Transportation & Commute in Milton
Vehicle Availability by Sex in Milton
The most prevalent vehicle ownership categories in Milton are males with 2 vehicles (4,011, accounting for 56.7%) and females with 2 vehicles (3,645, making up 59.3%).
| Vehicles Available | Male | Female |
| No Vehicle | 268 (3.8%) | 378 (5.6%) |
| 1 Vehicle | 829 (11.7%) | 874 (12.9%) |
| 2 Vehicles | 4,011 (56.7%) | 3,645 (53.9%) |
| 3 Vehicles | 1,248 (17.6%) | 1,088 (16.1%) |
| 4 Vehicles | 642 (9.1%) | 703 (10.4%) |
| 5 or more Vehicles | 78 (1.1%) | 79 (1.2%) |
| Total | 7,076 (100.0%) | 6,767 (100.0%) |
Commute Time in Milton
The most frequently occuring commute durations in Milton are 30 to 34 minutes (1,843 commuters, 16.3%), 45 to 59 minutes (1,782 commuters, 15.7%), and 15 to 19 minutes (1,452 commuters, 12.8%).
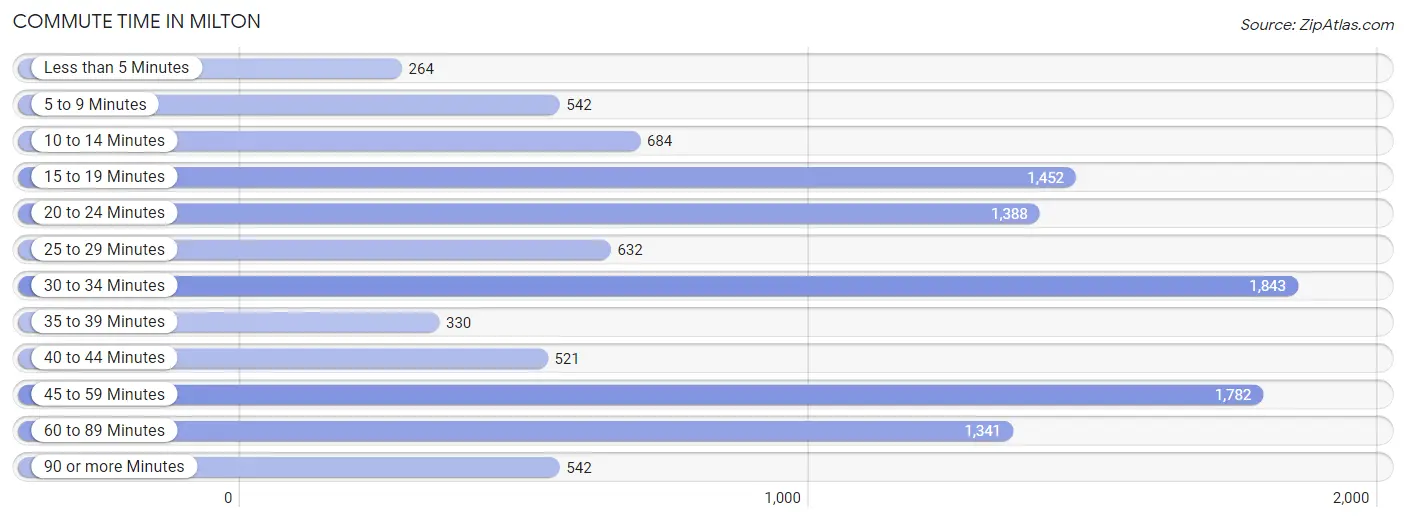
| Commute Time | # Commuters | % Commuters |
| Less than 5 Minutes | 264 | 2.3% |
| 5 to 9 Minutes | 542 | 4.8% |
| 10 to 14 Minutes | 684 | 6.0% |
| 15 to 19 Minutes | 1,452 | 12.8% |
| 20 to 24 Minutes | 1,388 | 12.3% |
| 25 to 29 Minutes | 632 | 5.6% |
| 30 to 34 Minutes | 1,843 | 16.3% |
| 35 to 39 Minutes | 330 | 2.9% |
| 40 to 44 Minutes | 521 | 4.6% |
| 45 to 59 Minutes | 1,782 | 15.7% |
| 60 to 89 Minutes | 1,341 | 11.8% |
| 90 or more Minutes | 542 | 4.8% |
Commute Time by Sex in Milton
The most common commute times in Milton are 45 to 59 minutes (1,017 commuters, 18.2%) for males and 30 to 34 minutes (910 commuters, 15.9%) for females.
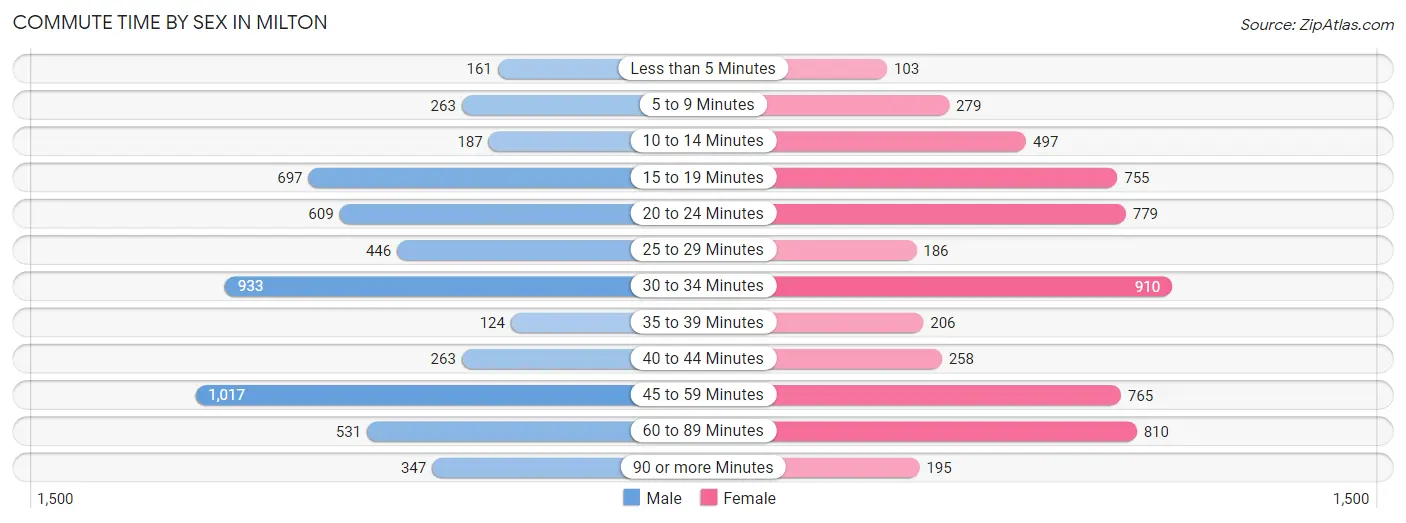
| Commute Time | Male | Female |
| Less than 5 Minutes | 161 (2.9%) | 103 (1.8%) |
| 5 to 9 Minutes | 263 (4.7%) | 279 (4.9%) |
| 10 to 14 Minutes | 187 (3.4%) | 497 (8.6%) |
| 15 to 19 Minutes | 697 (12.5%) | 755 (13.2%) |
| 20 to 24 Minutes | 609 (10.9%) | 779 (13.6%) |
| 25 to 29 Minutes | 446 (8.0%) | 186 (3.2%) |
| 30 to 34 Minutes | 933 (16.7%) | 910 (15.9%) |
| 35 to 39 Minutes | 124 (2.2%) | 206 (3.6%) |
| 40 to 44 Minutes | 263 (4.7%) | 258 (4.5%) |
| 45 to 59 Minutes | 1,017 (18.2%) | 765 (13.3%) |
| 60 to 89 Minutes | 531 (9.5%) | 810 (14.1%) |
| 90 or more Minutes | 347 (6.2%) | 195 (3.4%) |
Time of Departure to Work by Sex in Milton
The most frequent times of departure to work in Milton are 7:00 AM to 7:29 AM (1,131, 20.3%) for males and 7:00 AM to 7:29 AM (1,192, 20.8%) for females.
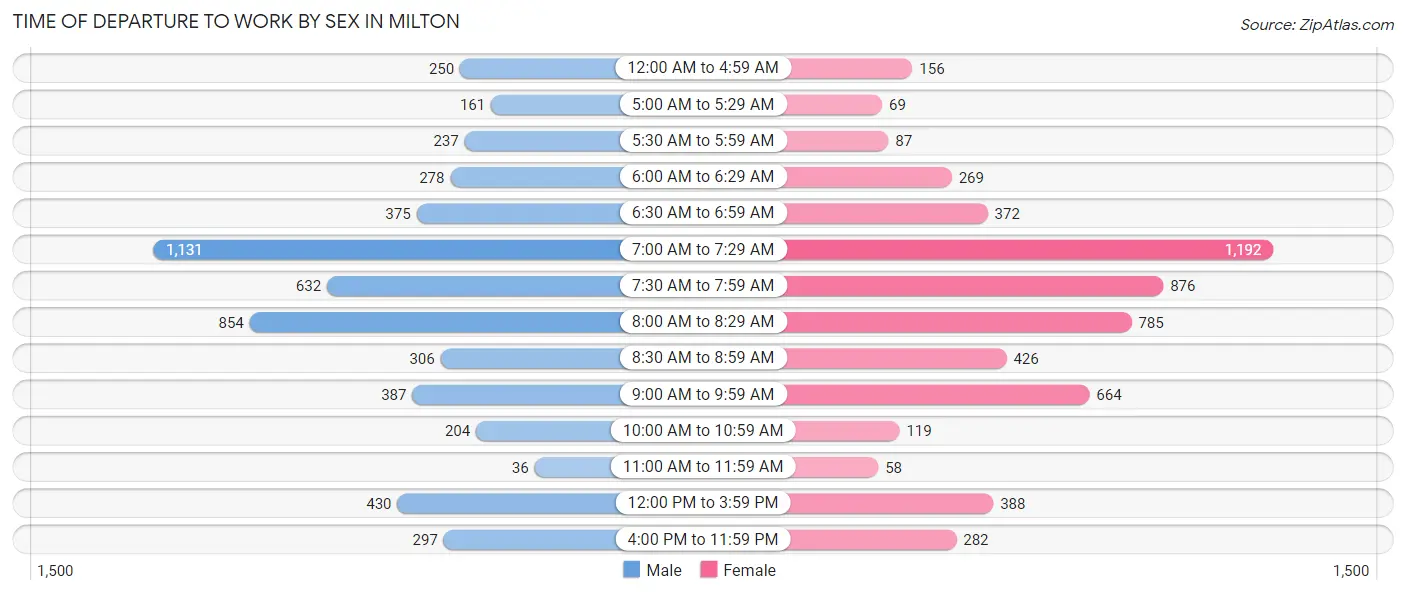
| Time of Departure | Male | Female |
| 12:00 AM to 4:59 AM | 250 (4.5%) | 156 (2.7%) |
| 5:00 AM to 5:29 AM | 161 (2.9%) | 69 (1.2%) |
| 5:30 AM to 5:59 AM | 237 (4.3%) | 87 (1.5%) |
| 6:00 AM to 6:29 AM | 278 (5.0%) | 269 (4.7%) |
| 6:30 AM to 6:59 AM | 375 (6.7%) | 372 (6.5%) |
| 7:00 AM to 7:29 AM | 1,131 (20.3%) | 1,192 (20.8%) |
| 7:30 AM to 7:59 AM | 632 (11.3%) | 876 (15.2%) |
| 8:00 AM to 8:29 AM | 854 (15.3%) | 785 (13.7%) |
| 8:30 AM to 8:59 AM | 306 (5.5%) | 426 (7.4%) |
| 9:00 AM to 9:59 AM | 387 (6.9%) | 664 (11.6%) |
| 10:00 AM to 10:59 AM | 204 (3.7%) | 119 (2.1%) |
| 11:00 AM to 11:59 AM | 36 (0.6%) | 58 (1.0%) |
| 12:00 PM to 3:59 PM | 430 (7.7%) | 388 (6.8%) |
| 4:00 PM to 11:59 PM | 297 (5.3%) | 282 (4.9%) |
| Total | 5,578 (100.0%) | 5,743 (100.0%) |
Housing Occupancy in Milton
Occupancy by Ownership in Milton
Of the total 9,139 dwellings in Milton, owner-occupied units account for 7,703 (84.3%), while renter-occupied units make up 1,436 (15.7%).
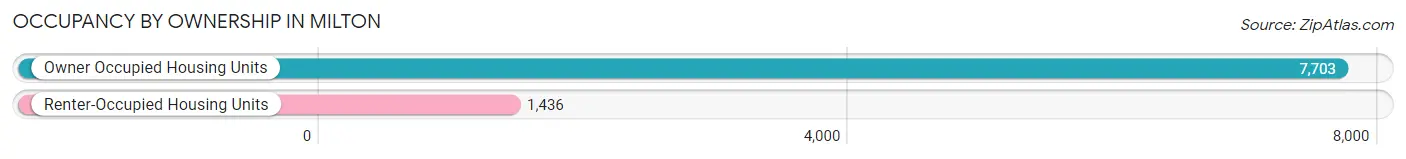
| Occupancy | # Housing Units | % Housing Units |
| Owner Occupied Housing Units | 7,703 | 84.3% |
| Renter-Occupied Housing Units | 1,436 | 15.7% |
| Total Occupied Housing Units | 9,139 | 100.0% |
Occupancy by Household Size in Milton
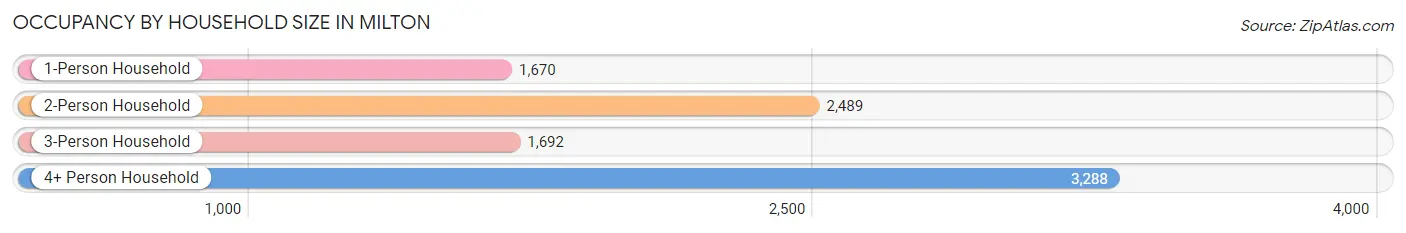
| Household Size | # Housing Units | % Housing Units |
| 1-Person Household | 1,670 | 18.3% |
| 2-Person Household | 2,489 | 27.2% |
| 3-Person Household | 1,692 | 18.5% |
| 4+ Person Household | 3,288 | 36.0% |
| Total Housing Units | 9,139 | 100.0% |
Occupancy by Ownership by Household Size in Milton
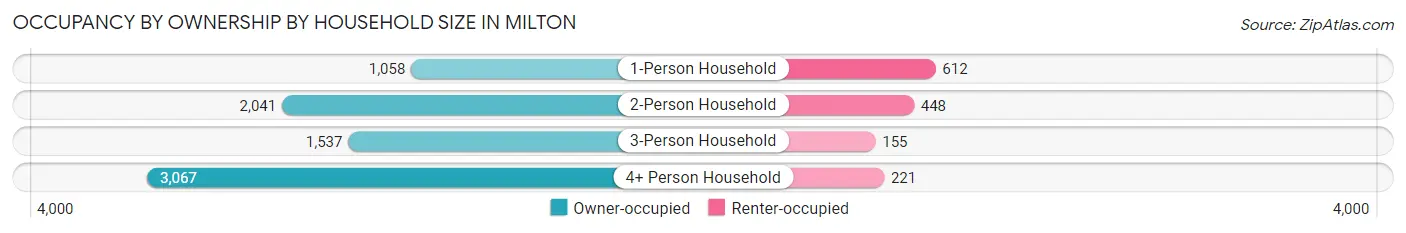
| Household Size | Owner-occupied | Renter-occupied |
| 1-Person Household | 1,058 (63.3%) | 612 (36.6%) |
| 2-Person Household | 2,041 (82.0%) | 448 (18.0%) |
| 3-Person Household | 1,537 (90.8%) | 155 (9.2%) |
| 4+ Person Household | 3,067 (93.3%) | 221 (6.7%) |
| Total Housing Units | 7,703 (84.3%) | 1,436 (15.7%) |
Occupancy by Educational Attainment in Milton
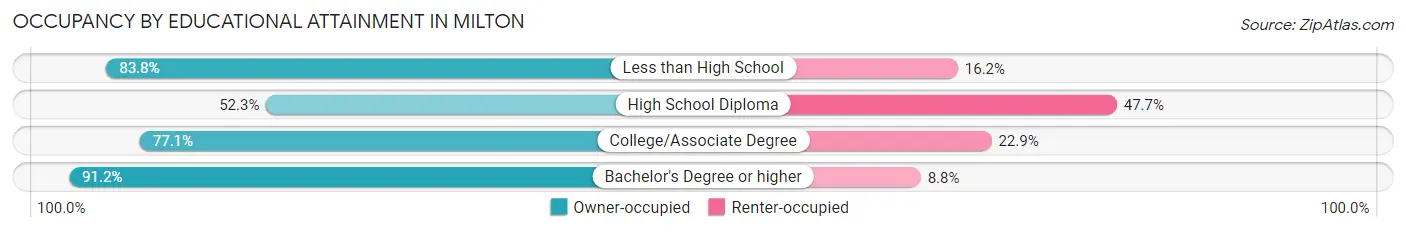
| Household Size | Owner-occupied | Renter-occupied |
| Less than High School | 150 (83.8%) | 29 (16.2%) |
| High School Diploma | 570 (52.3%) | 520 (47.7%) |
| College/Associate Degree | 1,053 (77.1%) | 312 (22.9%) |
| Bachelor's Degree or higher | 5,930 (91.2%) | 575 (8.8%) |
Occupancy by Age of Householder in Milton
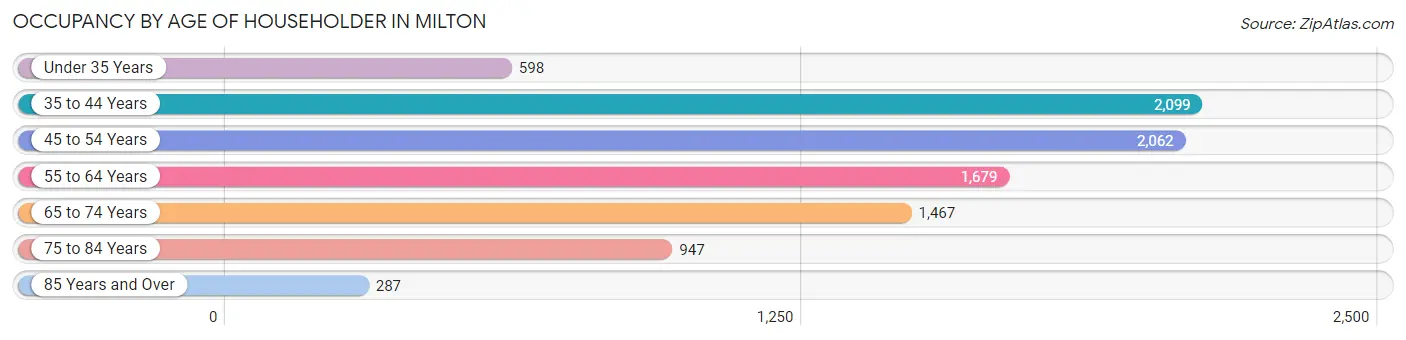
| Age Bracket | # Households | % Households |
| Under 35 Years | 598 | 6.5% |
| 35 to 44 Years | 2,099 | 23.0% |
| 45 to 54 Years | 2,062 | 22.6% |
| 55 to 64 Years | 1,679 | 18.4% |
| 65 to 74 Years | 1,467 | 16.1% |
| 75 to 84 Years | 947 | 10.4% |
| 85 Years and Over | 287 | 3.1% |
| Total | 9,139 | 100.0% |
Housing Finances in Milton
Median Income by Occupancy in Milton
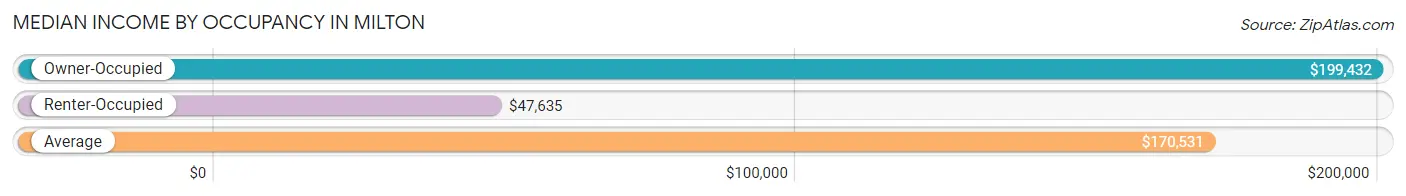
| Occupancy Type | # Households | Median Income |
| Owner-Occupied | 7,703 (84.3%) | $199,432 |
| Renter-Occupied | 1,436 (15.7%) | $47,635 |
| Average | 9,139 (100.0%) | $170,531 |
Occupancy by Householder Income Bracket in Milton
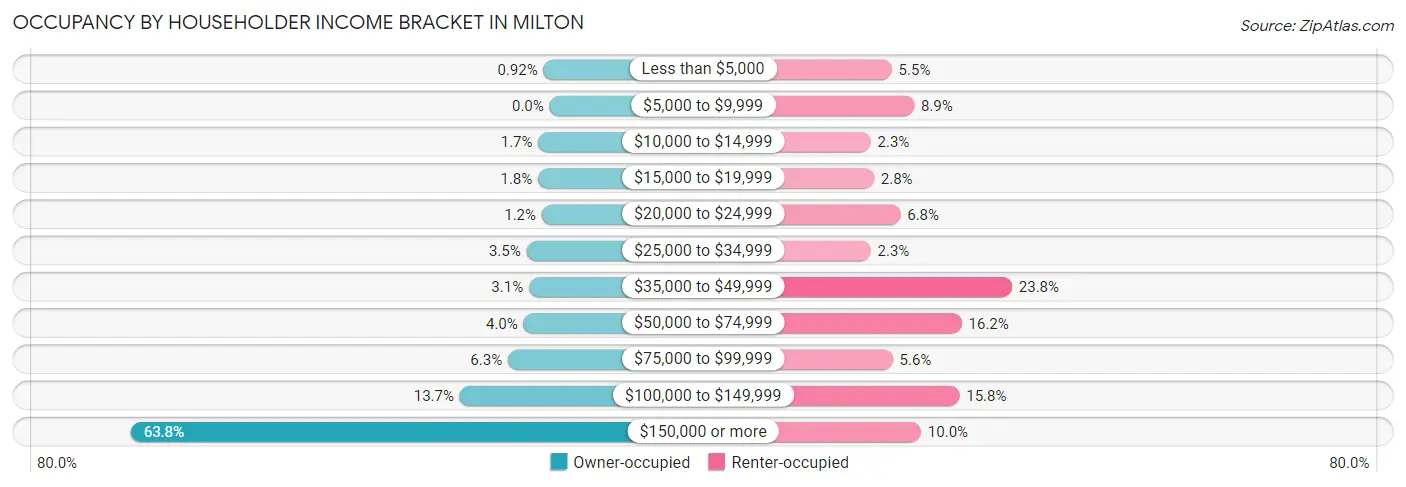
| Income Bracket | Owner-occupied | Renter-occupied |
| Less than $5,000 | 71 (0.9%) | 79 (5.5%) |
| $5,000 to $9,999 | 0 (0.0%) | 128 (8.9%) |
| $10,000 to $14,999 | 132 (1.7%) | 33 (2.3%) |
| $15,000 to $19,999 | 135 (1.8%) | 40 (2.8%) |
| $20,000 to $24,999 | 91 (1.2%) | 98 (6.8%) |
| $25,000 to $34,999 | 270 (3.5%) | 33 (2.3%) |
| $35,000 to $49,999 | 242 (3.1%) | 342 (23.8%) |
| $50,000 to $74,999 | 305 (4.0%) | 232 (16.2%) |
| $75,000 to $99,999 | 488 (6.3%) | 81 (5.6%) |
| $100,000 to $149,999 | 1,054 (13.7%) | 227 (15.8%) |
| $150,000 or more | 4,915 (63.8%) | 143 (10.0%) |
| Total | 7,703 (100.0%) | 1,436 (100.0%) |
Monthly Housing Cost Tiers in Milton
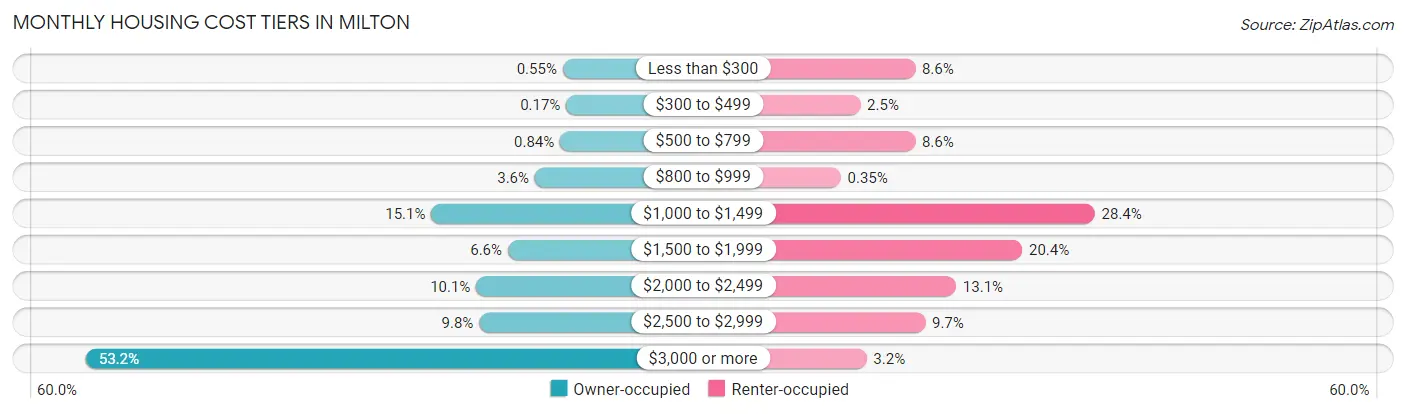
| Monthly Cost | Owner-occupied | Renter-occupied |
| Less than $300 | 42 (0.5%) | 123 (8.6%) |
| $300 to $499 | 13 (0.2%) | 36 (2.5%) |
| $500 to $799 | 65 (0.8%) | 123 (8.6%) |
| $800 to $999 | 280 (3.6%) | 5 (0.4%) |
| $1,000 to $1,499 | 1,161 (15.1%) | 408 (28.4%) |
| $1,500 to $1,999 | 509 (6.6%) | 293 (20.4%) |
| $2,000 to $2,499 | 779 (10.1%) | 188 (13.1%) |
| $2,500 to $2,999 | 753 (9.8%) | 139 (9.7%) |
| $3,000 or more | 4,101 (53.2%) | 46 (3.2%) |
| Total | 7,703 (100.0%) | 1,436 (100.0%) |
Physical Housing Characteristics in Milton
Housing Structures in Milton
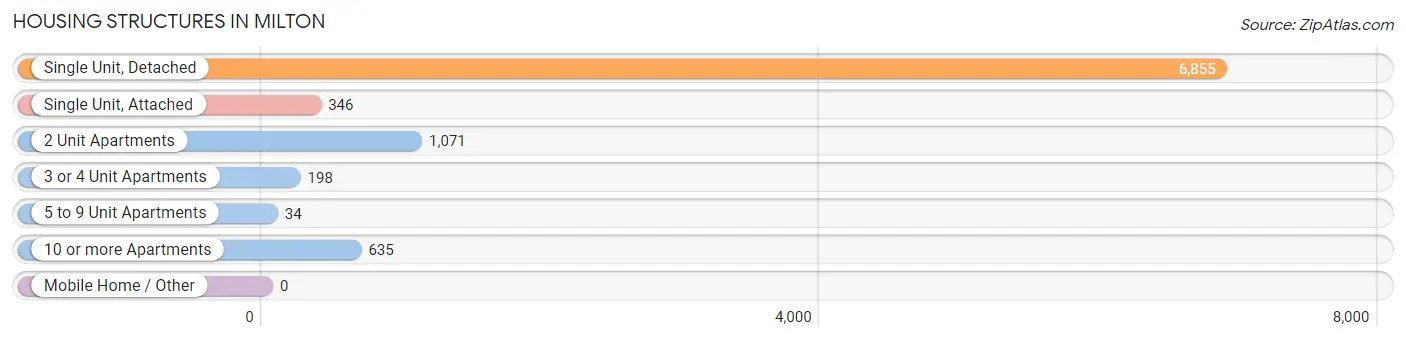
| Structure Type | # Housing Units | % Housing Units |
| Single Unit, Detached | 6,855 | 75.0% |
| Single Unit, Attached | 346 | 3.8% |
| 2 Unit Apartments | 1,071 | 11.7% |
| 3 or 4 Unit Apartments | 198 | 2.2% |
| 5 to 9 Unit Apartments | 34 | 0.4% |
| 10 or more Apartments | 635 | 7.0% |
| Mobile Home / Other | 0 | 0.0% |
| Total | 9,139 | 100.0% |
Housing Structures by Occupancy in Milton
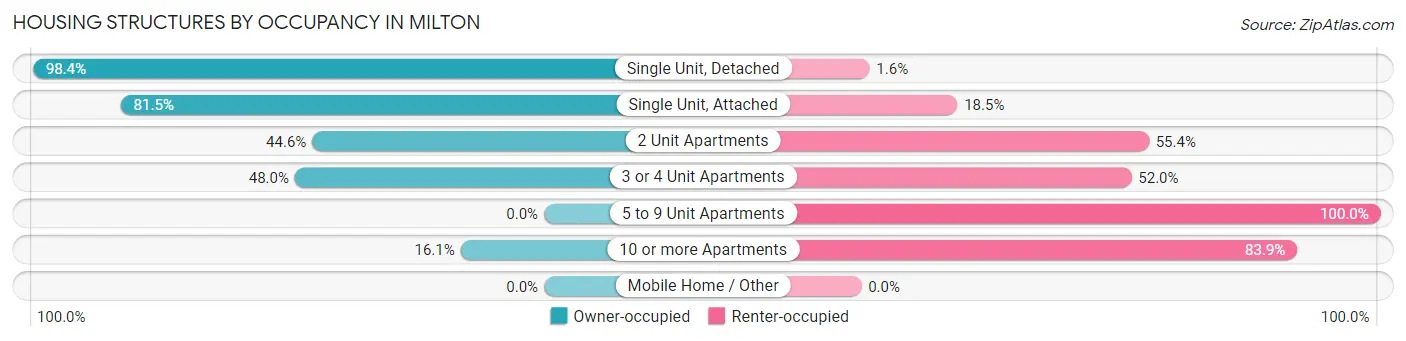
| Structure Type | Owner-occupied | Renter-occupied |
| Single Unit, Detached | 6,746 (98.4%) | 109 (1.6%) |
| Single Unit, Attached | 282 (81.5%) | 64 (18.5%) |
| 2 Unit Apartments | 478 (44.6%) | 593 (55.4%) |
| 3 or 4 Unit Apartments | 95 (48.0%) | 103 (52.0%) |
| 5 to 9 Unit Apartments | 0 (0.0%) | 34 (100.0%) |
| 10 or more Apartments | 102 (16.1%) | 533 (83.9%) |
| Mobile Home / Other | 0 (0.0%) | 0 (0.0%) |
| Total | 7,703 (84.3%) | 1,436 (15.7%) |
Housing Structures by Number of Rooms in Milton
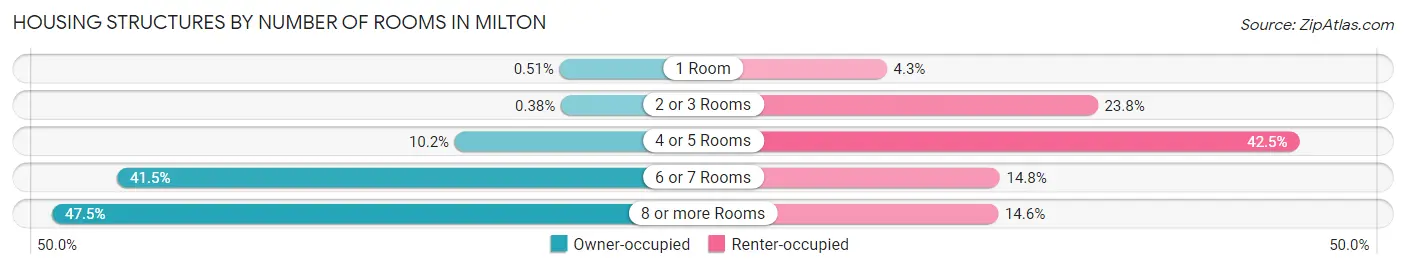
| Number of Rooms | Owner-occupied | Renter-occupied |
| 1 Room | 39 (0.5%) | 62 (4.3%) |
| 2 or 3 Rooms | 29 (0.4%) | 342 (23.8%) |
| 4 or 5 Rooms | 786 (10.2%) | 610 (42.5%) |
| 6 or 7 Rooms | 3,193 (41.4%) | 212 (14.8%) |
| 8 or more Rooms | 3,656 (47.5%) | 210 (14.6%) |
| Total | 7,703 (100.0%) | 1,436 (100.0%) |
Housing Structure by Heating Type in Milton
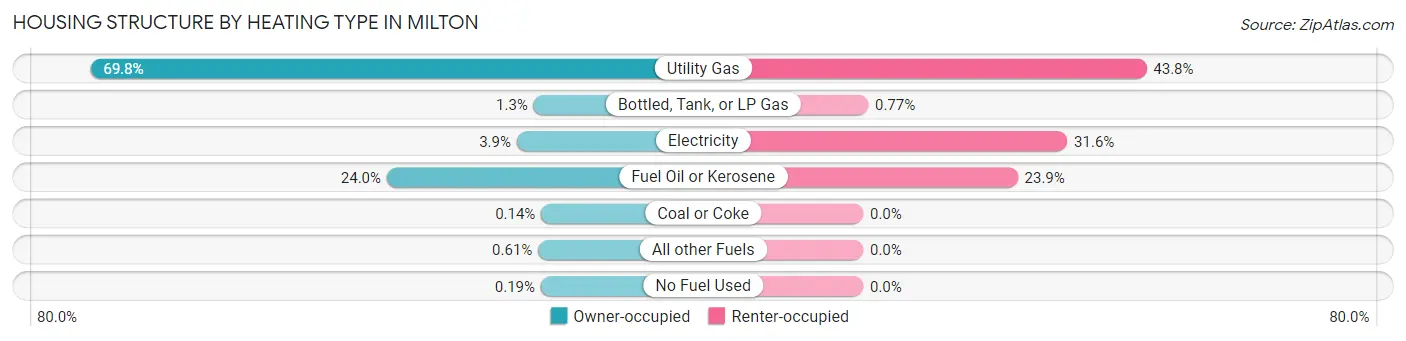
| Heating Type | Owner-occupied | Renter-occupied |
| Utility Gas | 5,380 (69.8%) | 629 (43.8%) |
| Bottled, Tank, or LP Gas | 100 (1.3%) | 11 (0.8%) |
| Electricity | 301 (3.9%) | 453 (31.6%) |
| Fuel Oil or Kerosene | 1,849 (24.0%) | 343 (23.9%) |
| Coal or Coke | 11 (0.1%) | 0 (0.0%) |
| All other Fuels | 47 (0.6%) | 0 (0.0%) |
| No Fuel Used | 15 (0.2%) | 0 (0.0%) |
| Total | 7,703 (100.0%) | 1,436 (100.0%) |
Household Vehicle Usage in Milton
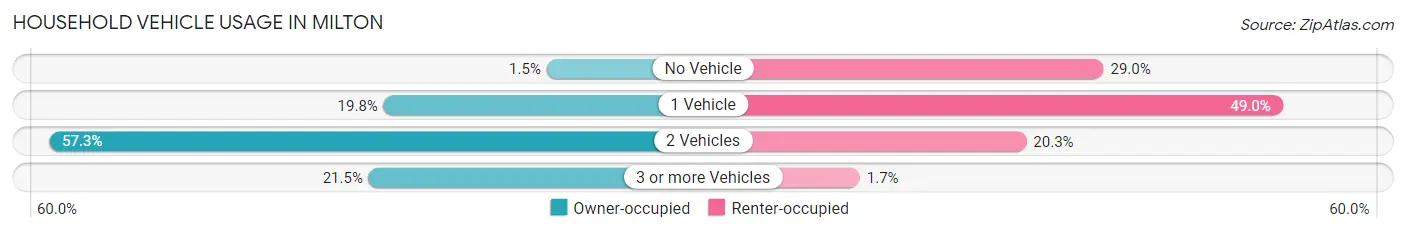
| Vehicles per Household | Owner-occupied | Renter-occupied |
| No Vehicle | 116 (1.5%) | 416 (29.0%) |
| 1 Vehicle | 1,524 (19.8%) | 704 (49.0%) |
| 2 Vehicles | 4,411 (57.3%) | 292 (20.3%) |
| 3 or more Vehicles | 1,652 (21.4%) | 24 (1.7%) |
| Total | 7,703 (100.0%) | 1,436 (100.0%) |
Real Estate & Mortgages in Milton
Real Estate and Mortgage Overview in Milton
| Characteristic | Without Mortgage | With Mortgage |
| Housing Units | 1,966 | 5,737 |
| Median Property Value | $705,200 | $879,100 |
| Median Household Income | $91,029 | $4,244 |
| Monthly Housing Costs | $1,305 | $4,041 |
| Real Estate Taxes | $9,013 | $18 |
Property Value by Mortgage Status in Milton
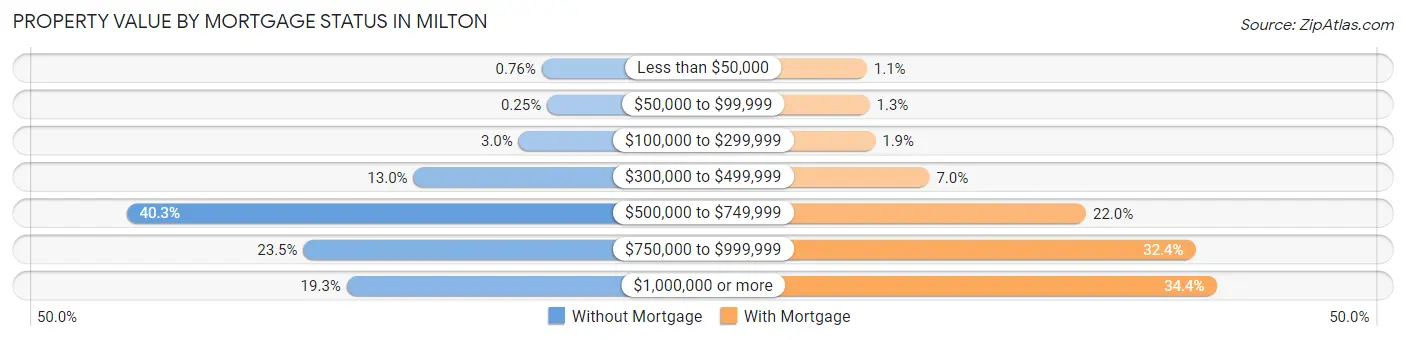
| Property Value | Without Mortgage | With Mortgage |
| Less than $50,000 | 15 (0.8%) | 62 (1.1%) |
| $50,000 to $99,999 | 5 (0.3%) | 77 (1.3%) |
| $100,000 to $299,999 | 58 (2.9%) | 108 (1.9%) |
| $300,000 to $499,999 | 255 (13.0%) | 404 (7.0%) |
| $500,000 to $749,999 | 792 (40.3%) | 1,259 (22.0%) |
| $750,000 to $999,999 | 461 (23.4%) | 1,856 (32.4%) |
| $1,000,000 or more | 380 (19.3%) | 1,971 (34.4%) |
| Total | 1,966 (100.0%) | 5,737 (100.0%) |
Household Income by Mortgage Status in Milton
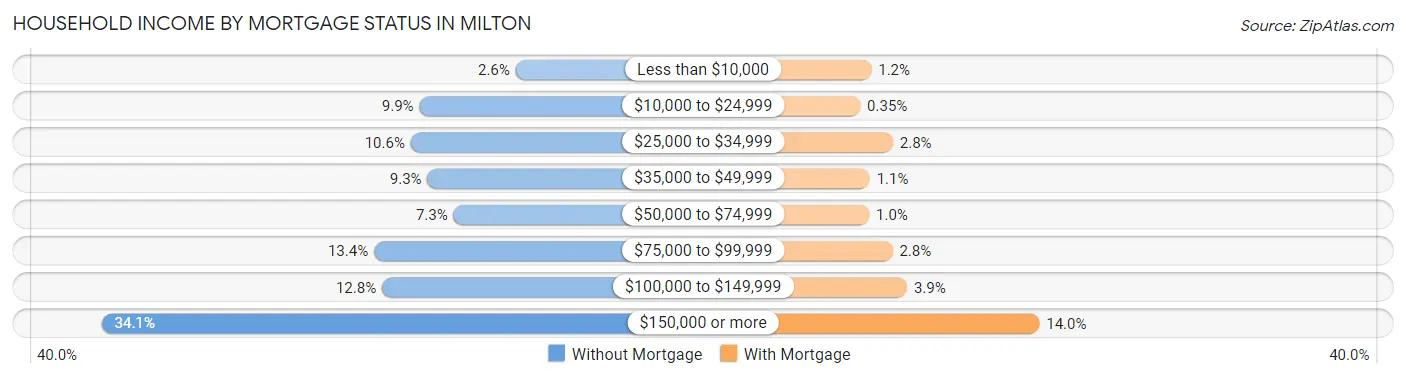
| Household Income | Without Mortgage | With Mortgage |
| Less than $10,000 | 51 (2.6%) | 69 (1.2%) |
| $10,000 to $24,999 | 195 (9.9%) | 20 (0.4%) |
| $25,000 to $34,999 | 208 (10.6%) | 163 (2.8%) |
| $35,000 to $49,999 | 183 (9.3%) | 62 (1.1%) |
| $50,000 to $74,999 | 144 (7.3%) | 59 (1.0%) |
| $75,000 to $99,999 | 263 (13.4%) | 161 (2.8%) |
| $100,000 to $149,999 | 251 (12.8%) | 225 (3.9%) |
| $150,000 or more | 671 (34.1%) | 803 (14.0%) |
| Total | 1,966 (100.0%) | 5,737 (100.0%) |
Property Value to Household Income Ratio in Milton
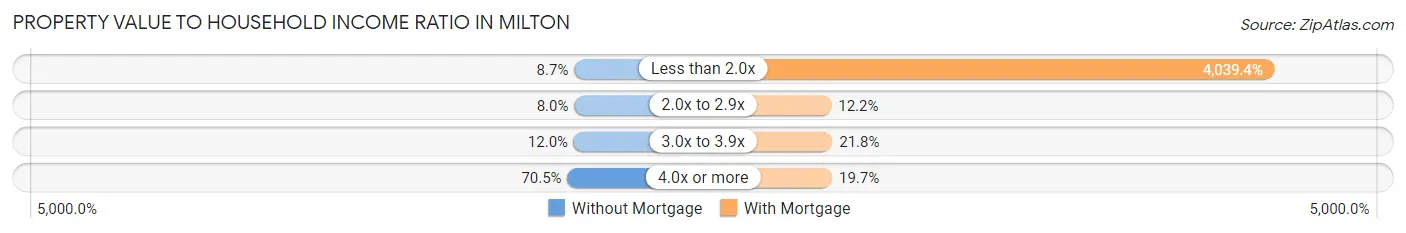
| Value-to-Income Ratio | Without Mortgage | With Mortgage |
| Less than 2.0x | 171 (8.7%) | 231,741 (4,039.4%) |
| 2.0x to 2.9x | 158 (8.0%) | 701 (12.2%) |
| 3.0x to 3.9x | 235 (11.9%) | 1,253 (21.8%) |
| 4.0x or more | 1,386 (70.5%) | 1,129 (19.7%) |
| Total | 1,966 (100.0%) | 5,737 (100.0%) |
Real Estate Taxes by Mortgage Status in Milton
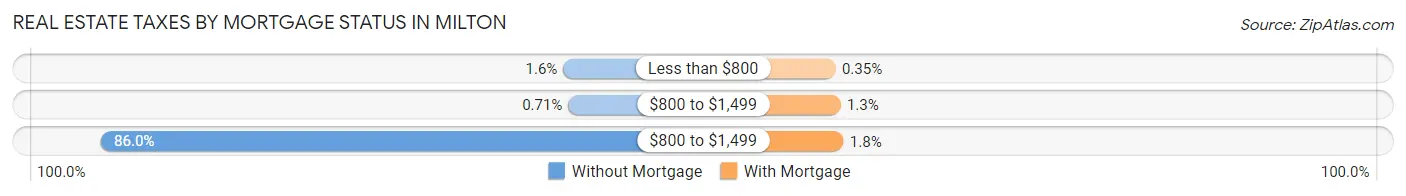
| Property Taxes | Without Mortgage | With Mortgage |
| Less than $800 | 32 (1.6%) | 20 (0.4%) |
| $800 to $1,499 | 14 (0.7%) | 72 (1.3%) |
| $800 to $1,499 | 1,691 (86.0%) | 103 (1.8%) |
| Total | 1,966 (100.0%) | 5,737 (100.0%) |
Health & Disability in Milton
Health Insurance Coverage by Age in Milton
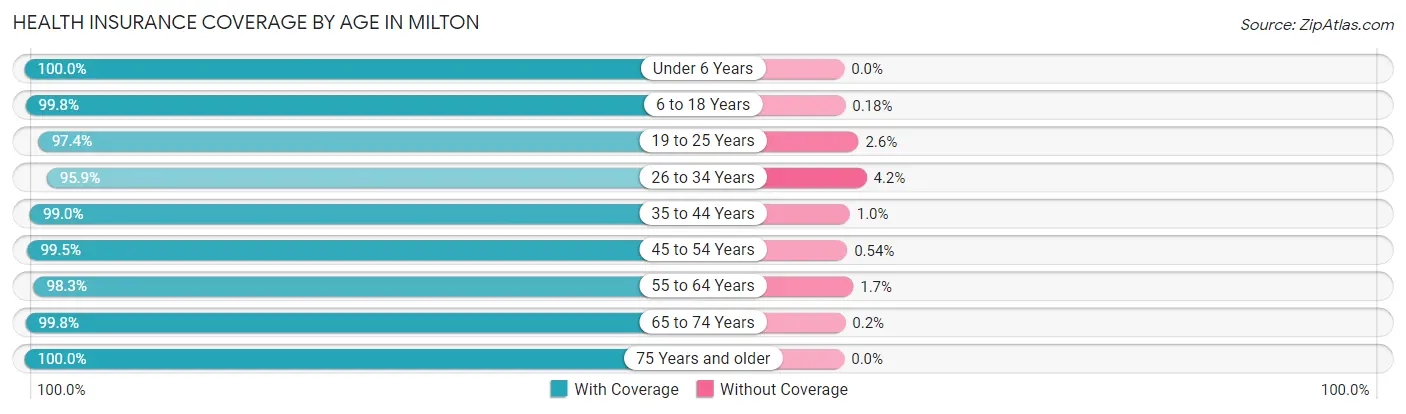
| Age Bracket | With Coverage | Without Coverage |
| Under 6 Years | 1,612 (100.0%) | 0 (0.0%) |
| 6 to 18 Years | 6,183 (99.8%) | 11 (0.2%) |
| 19 to 25 Years | 2,436 (97.4%) | 66 (2.6%) |
| 26 to 34 Years | 1,850 (95.9%) | 80 (4.2%) |
| 35 to 44 Years | 3,970 (99.0%) | 41 (1.0%) |
| 45 to 54 Years | 3,835 (99.5%) | 21 (0.5%) |
| 55 to 64 Years | 3,679 (98.3%) | 63 (1.7%) |
| 65 to 74 Years | 2,510 (99.8%) | 5 (0.2%) |
| 75 Years and older | 1,962 (100.0%) | 0 (0.0%) |
| Total | 28,037 (99.0%) | 287 (1.0%) |
Health Insurance Coverage by Citizenship Status in Milton
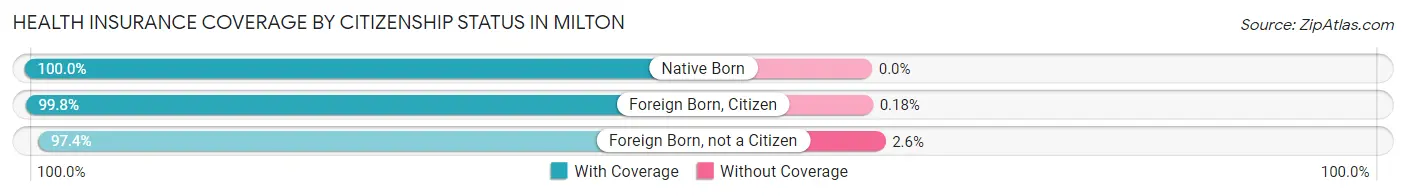
| Citizenship Status | With Coverage | Without Coverage |
| Native Born | 1,612 (100.0%) | 0 (0.0%) |
| Foreign Born, Citizen | 6,183 (99.8%) | 11 (0.2%) |
| Foreign Born, not a Citizen | 2,436 (97.4%) | 66 (2.6%) |
Health Insurance Coverage by Household Income in Milton
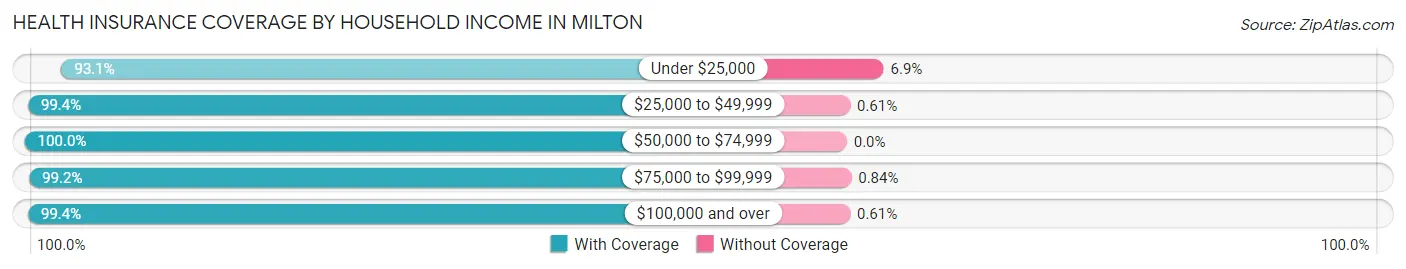
| Household Income | With Coverage | Without Coverage |
| Under $25,000 | 919 (93.1%) | 68 (6.9%) |
| $25,000 to $49,999 | 1,642 (99.4%) | 10 (0.6%) |
| $50,000 to $74,999 | 1,452 (100.0%) | 0 (0.0%) |
| $75,000 to $99,999 | 1,530 (99.2%) | 13 (0.8%) |
| $100,000 and over | 21,068 (99.4%) | 129 (0.6%) |
Public vs Private Health Insurance Coverage by Age in Milton
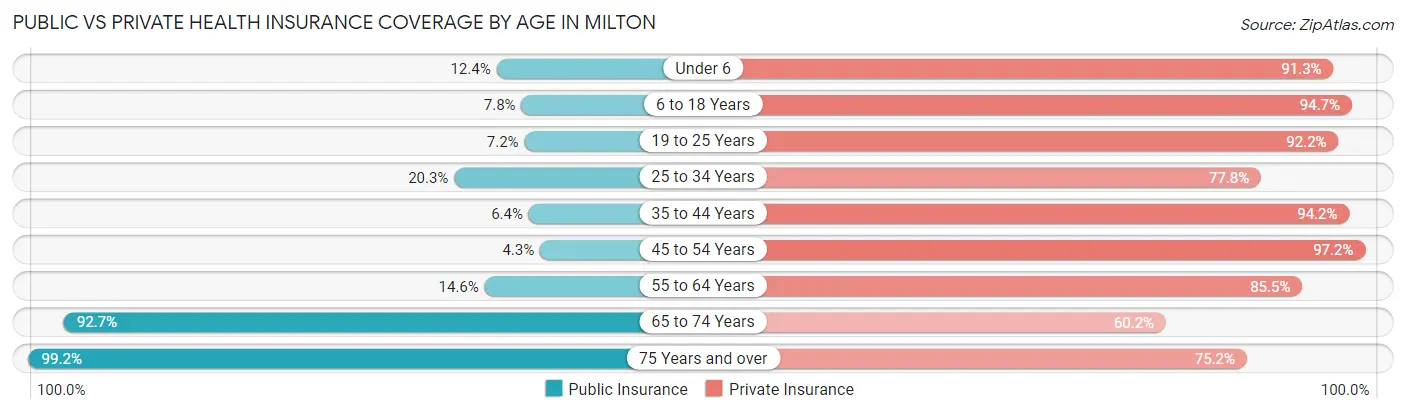
| Age Bracket | Public Insurance | Private Insurance |
| Under 6 | 200 (12.4%) | 1,471 (91.2%) |
| 6 to 18 Years | 482 (7.8%) | 5,864 (94.7%) |
| 19 to 25 Years | 181 (7.2%) | 2,306 (92.2%) |
| 25 to 34 Years | 391 (20.3%) | 1,502 (77.8%) |
| 35 to 44 Years | 257 (6.4%) | 3,778 (94.2%) |
| 45 to 54 Years | 167 (4.3%) | 3,746 (97.2%) |
| 55 to 64 Years | 547 (14.6%) | 3,198 (85.5%) |
| 65 to 74 Years | 2,332 (92.7%) | 1,513 (60.2%) |
| 75 Years and over | 1,947 (99.2%) | 1,475 (75.2%) |
| Total | 6,504 (23.0%) | 24,853 (87.7%) |
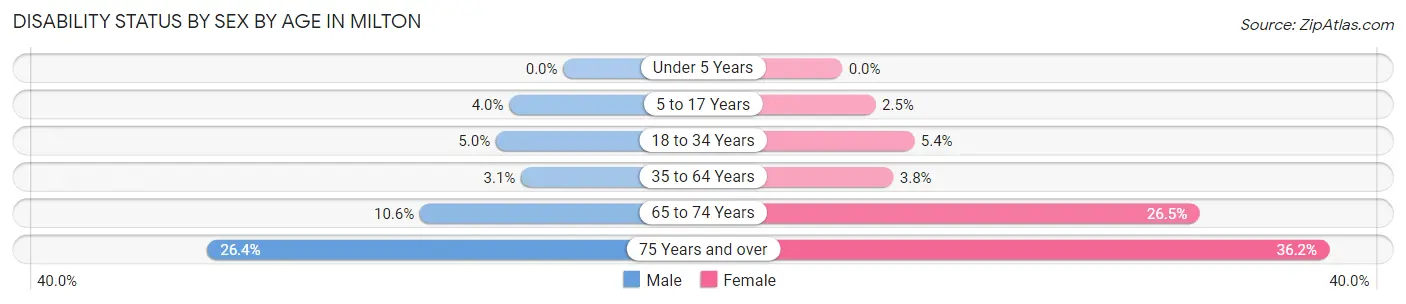
Disability Status by Sex by Age in Milton
| Age Bracket | Male | Female |
| Under 5 Years | 0 (0.0%) | 0 (0.0%) |
| 5 to 17 Years | 118 (4.0%) | 72 (2.5%) |
| 18 to 34 Years | 105 (5.0%) | 158 (5.3%) |
| 35 to 64 Years | 183 (3.1%) | 218 (3.8%) |
| 65 to 74 Years | 114 (10.6%) | 383 (26.5%) |
| 75 Years and over | 194 (26.4%) | 444 (36.2%) |
Disability Class by Sex by Age in Milton
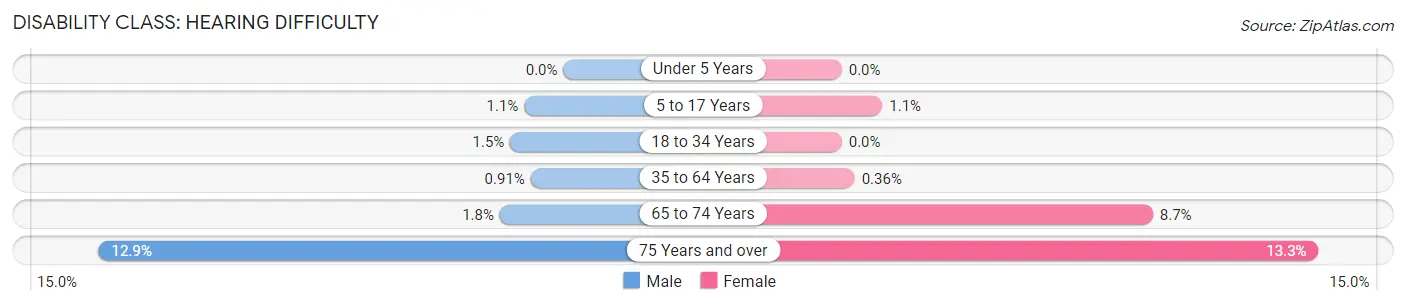
Disability Class: Hearing Difficulty
| Age Bracket | Male | Female |
| Under 5 Years | 0 (0.0%) | 0 (0.0%) |
| 5 to 17 Years | 32 (1.1%) | 33 (1.1%) |
| 18 to 34 Years | 31 (1.5%) | 0 (0.0%) |
| 35 to 64 Years | 53 (0.9%) | 21 (0.4%) |
| 65 to 74 Years | 19 (1.8%) | 125 (8.7%) |
| 75 Years and over | 95 (12.9%) | 163 (13.3%) |
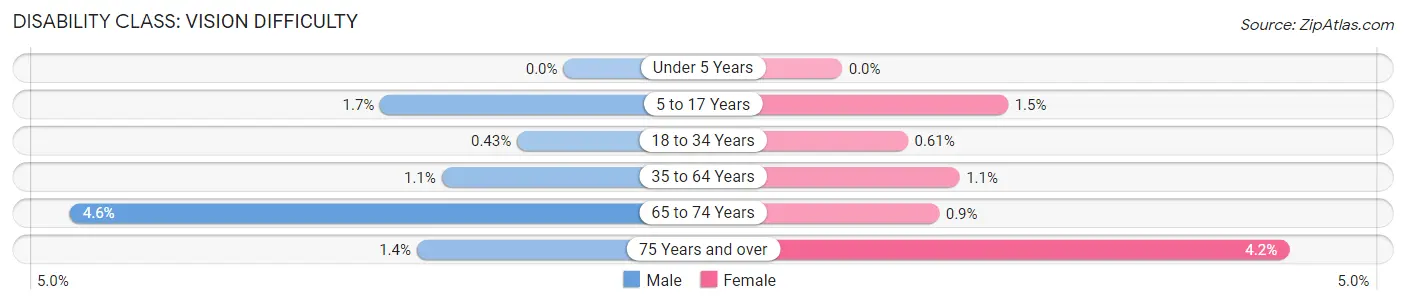
Disability Class: Vision Difficulty
| Age Bracket | Male | Female |
| Under 5 Years | 0 (0.0%) | 0 (0.0%) |
| 5 to 17 Years | 50 (1.7%) | 45 (1.5%) |
| 18 to 34 Years | 9 (0.4%) | 18 (0.6%) |
| 35 to 64 Years | 66 (1.1%) | 63 (1.1%) |
| 65 to 74 Years | 49 (4.6%) | 13 (0.9%) |
| 75 Years and over | 10 (1.4%) | 51 (4.2%) |
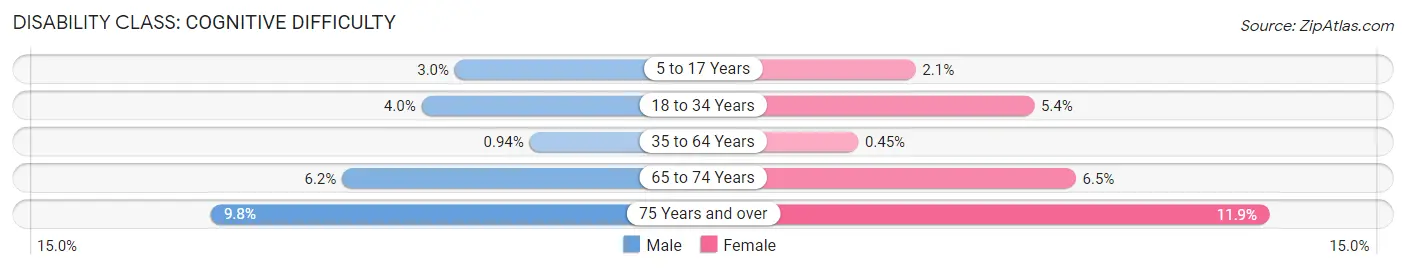
Disability Class: Cognitive Difficulty
| Age Bracket | Male | Female |
| 5 to 17 Years | 89 (3.0%) | 60 (2.1%) |
| 18 to 34 Years | 83 (4.0%) | 158 (5.3%) |
| 35 to 64 Years | 55 (0.9%) | 26 (0.4%) |
| 65 to 74 Years | 66 (6.2%) | 94 (6.5%) |
| 75 Years and over | 72 (9.8%) | 146 (11.9%) |
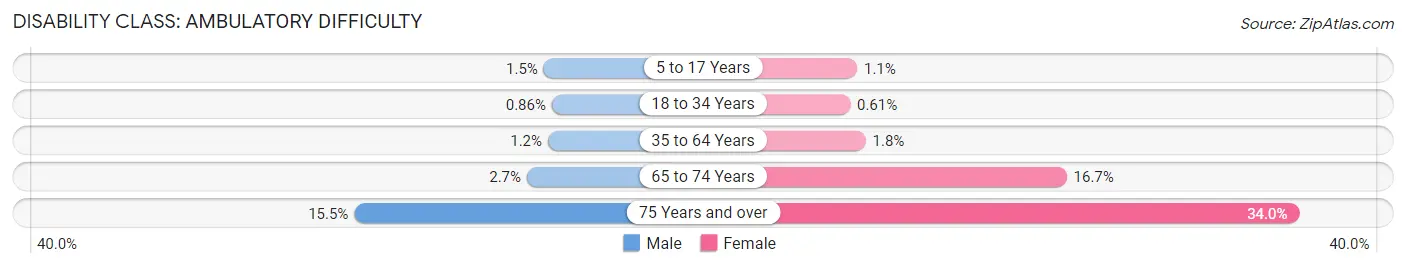
Disability Class: Ambulatory Difficulty
| Age Bracket | Male | Female |
| 5 to 17 Years | 43 (1.5%) | 33 (1.1%) |
| 18 to 34 Years | 18 (0.9%) | 18 (0.6%) |
| 35 to 64 Years | 67 (1.1%) | 102 (1.8%) |
| 65 to 74 Years | 29 (2.7%) | 241 (16.7%) |
| 75 Years and over | 114 (15.5%) | 417 (34.0%) |
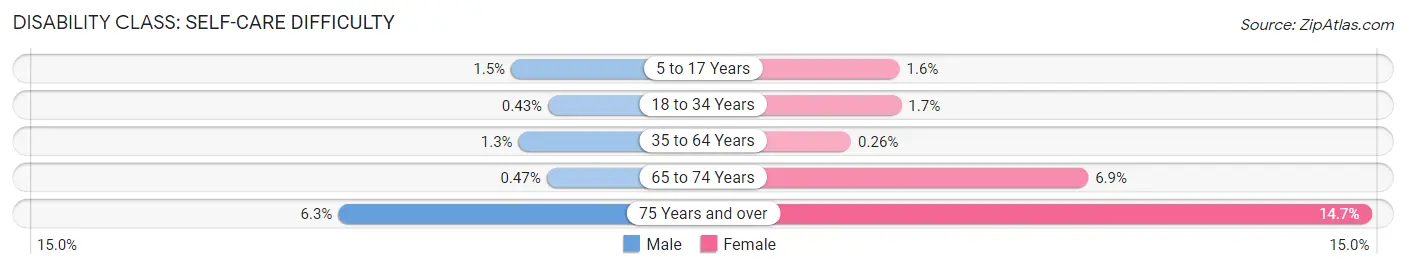
Disability Class: Self-Care Difficulty
| Age Bracket | Male | Female |
| 5 to 17 Years | 43 (1.5%) | 47 (1.6%) |
| 18 to 34 Years | 9 (0.4%) | 49 (1.7%) |
| 35 to 64 Years | 73 (1.3%) | 15 (0.3%) |
| 65 to 74 Years | 5 (0.5%) | 99 (6.9%) |
| 75 Years and over | 46 (6.3%) | 181 (14.7%) |
Technology Access in Milton
Computing Device Access in Milton
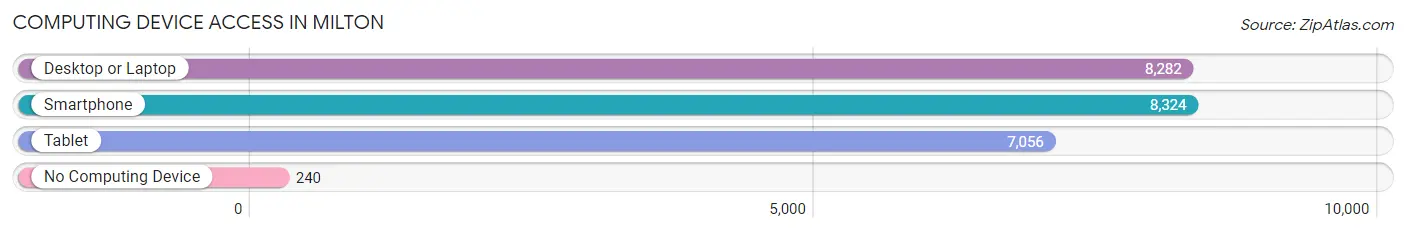
| Device Type | # Households | % Households |
| Desktop or Laptop | 8,282 | 90.6% |
| Smartphone | 8,324 | 91.1% |
| Tablet | 7,056 | 77.2% |
| No Computing Device | 240 | 2.6% |
| Total | 9,139 | 100.0% |
Internet Access in Milton
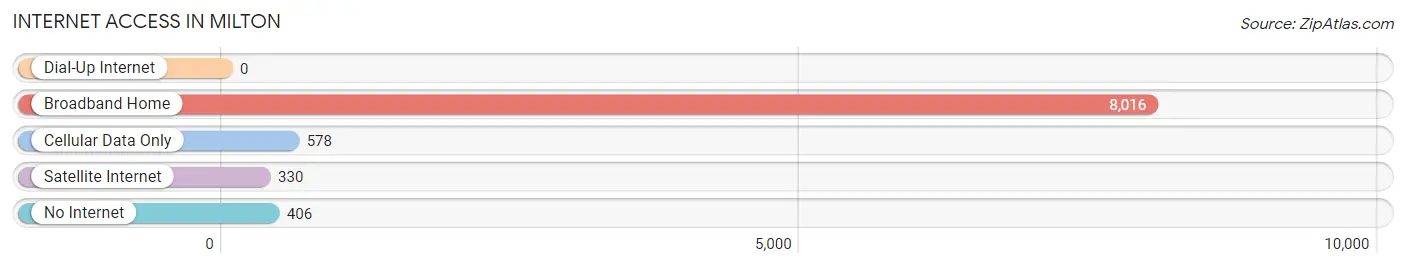
| Internet Type | # Households | % Households |
| Dial-Up Internet | 0 | 0.0% |
| Broadband Home | 8,016 | 87.7% |
| Cellular Data Only | 578 | 6.3% |
| Satellite Internet | 330 | 3.6% |
| No Internet | 406 | 4.4% |
| Total | 9,139 | 100.0% |
Milton Summary
Milton, Massachusetts is a town located in Norfolk County, Massachusetts, United States. It is located approximately 10 miles south of Boston and is part of the Greater Boston metropolitan area. The town was founded in 1640 and was originally part of Dorchester. It was later incorporated as a separate town in 1662. As of the 2010 census, the town had a population of 27,003.
Geography
Milton is located at 42°13'N 71°06'W (42.2179, -71.0986). According to the United States Census Bureau, the town has a total area of 10.2 square miles (26.4 km2), of which 10.1 square miles (26.2 km2) is land and 0.1 square miles (0.2 km2) (0.78%) is water.
Milton is bordered by the towns of Quincy, Randolph, Canton, Dedham, Needham, and Boston. The Neponset River forms the town's southern border. The town is located in the Neponset River Valley, which is part of the Charles River watershed.
Demographics
As of the 2010 census, there were 27,003 people, 10,890 households, and 7,072 families residing in the town. The population density was 2,668.2 people per square mile (1,030.2/km2). There were 11,521 housing units at an average density of 1,142.3 per square mile (441.2/km2). The racial makeup of the town was 81.2% White, 8.2% African American, 0.2% Native American, 6.9% Asian, 0.0% Pacific Islander, 1.4% from other races, and 2.1% from two or more races. Hispanic or Latino of any race were 3.5% of the population.
There were 10,890 households, out of which 32.2% had children under the age of 18 living with them, 54.2% were married couples living together, 10.2% had a female householder with no husband present, and 31.3% were non-families. 25.2% of all households were made up of individuals, and 10.2% had someone living alone who was 65 years of age or older. The average household size was 2.48 and the average family size was 3.01.
The median age in the town was 41.2 years. 22.9% of residents were under the age of 18; 7.2% were between the ages of 18 and 24; 25.2% were from 25 to 44; 30.2% were from 45 to 64; and 14.5% were 65 years of age or older. The gender makeup of the town was 48.2% male and 51.8% female.
Economy
Milton is home to several large employers, including the Milton Academy, the Milton Hospital, and the Milton Public Schools. The town is also home to several small businesses, including restaurants, retail stores, and professional services.
The town is served by the MBTA commuter rail, which provides access to Boston and other nearby towns. The town is also served by several bus routes, including the MBTA bus routes and the Milton Area Transit Authority (MATA) bus routes.
Milton is home to several parks and recreational facilities, including the Blue Hills Reservation, the Milton Public Library, and the Milton Yacht Club. The town also has several golf courses, including the Milton Country Club and the Milton Golf Course.
Conclusion
Milton, Massachusetts is a town located in Norfolk County, Massachusetts, United States. It is located approximately 10 miles south of Boston and is part of the Greater Boston metropolitan area. The town was founded in 1640 and was originally part of Dorchester. It was later incorporated as a separate town in 1662. As of the 2010 census, the town had a population of 27,003. The town is bordered by the towns of Quincy, Randolph, Canton, Dedham, Needham, and Boston. The town is served by the MBTA commuter rail, which provides access to Boston and other nearby towns. The town is also served by several bus routes, including the MBTA bus routes and the Milton Area Transit Authority (MATA) bus routes. The town is home to several large employers, including the Milton Academy, the Milton Hospital, and the Milton Public Schools. The town is also home to several parks and recreational facilities, including the Blue Hills Reservation, the Milton Public Library, and the Milton Yacht Club.
Common Questions
What is Per Capita Income in Milton?
Per Capita income in Milton is $71,516.
What is the Median Family Income in Milton?
Median Family Income in Milton is $203,557.
What is the Median Household income in Milton?
Median Household Income in Milton is $170,531.
What is Income or Wage Gap in Milton?
Income or Wage Gap in Milton is 28.1%.
Women in Milton earn 71.9 cents for every dollar earned by a man.
What is Inequality or Gini Index in Milton?
Inequality or Gini Index in Milton is 0.47.
What is the Total Population of Milton?
Total Population of Milton is 28,450.
What is the Total Male Population of Milton?
Total Male Population of Milton is 13,414.
What is the Total Female Population of Milton?
Total Female Population of Milton is 15,036.
What is the Ratio of Males per 100 Females in Milton?
There are 89.21 Males per 100 Females in Milton.
What is the Ratio of Females per 100 Males in Milton?
There are 112.09 Females per 100 Males in Milton.
What is the Median Population Age in Milton?
Median Population Age in Milton is 40.1 Years.
What is the Average Family Size in Milton
Average Family Size in Milton is 3.3 People.
What is the Average Household Size in Milton
Average Household Size in Milton is 2.9 People.
How Large is the Labor Force in Milton?
There are 15,416 People in the Labor Forcein in Milton.
What is the Percentage of People in the Labor Force in Milton?
69.5% of People are in the Labor Force in Milton.
What is the Unemployment Rate in Milton?
Unemployment Rate in Milton is 3.8%.