Franklin Town, MA Map & Demographics
Franklin Town Map
Franklin Town Overview
$61,841
PER CAPITA INCOME
$170,487
AVG FAMILY INCOME
$138,062
AVG HOUSEHOLD INCOME
42.9%
WAGE / INCOME GAP [ % ]
57.1¢/ $1
WAGE / INCOME GAP [ $ ]
0.40
INEQUALITY / GINI INDEX
32,777
TOTAL POPULATION
15,656
MALE POPULATION
17,121
FEMALE POPULATION
91.44
MALES / 100 FEMALES
109.36
FEMALES / 100 MALES
42.0
MEDIAN AGE
3.1
AVG FAMILY SIZE
2.6
AVG HOUSEHOLD SIZE
19,578
LABOR FORCE [ PEOPLE ]
71.7%
PERCENT IN LABOR FORCE
5.4%
UNEMPLOYMENT RATE
Income in Franklin Town
Income Overview in Franklin Town
Per Capita Income in Franklin Town is $61,841, while median incomes of families and households are $170,487 and $138,062 respectively.
| Characteristic | Number | Measure |
| Per Capita Income | 32,777 | $61,841 |
| Median Family Income | 8,753 | $170,487 |
| Mean Family Income | 8,753 | $195,123 |
| Median Household Income | 12,131 | $138,062 |
| Mean Household Income | 12,131 | $164,623 |
| Income Deficit | 8,753 | $0 |
| Wage / Income Gap (%) | 32,777 | 42.95% |
| Wage / Income Gap ($) | 32,777 | 57.05¢ per $1 |
| Gini / Inequality Index | 32,777 | 0.40 |
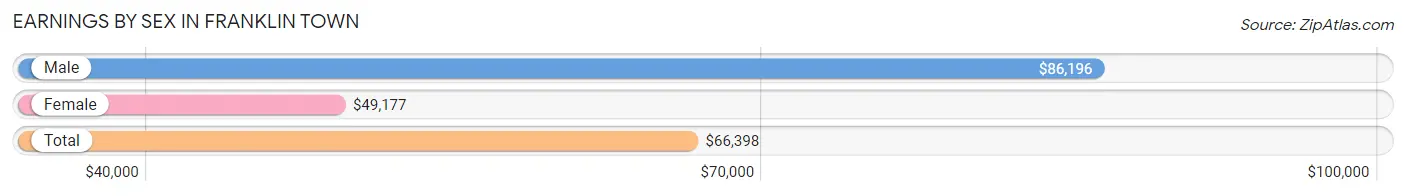
Earnings by Sex in Franklin Town
Average Earnings in Franklin Town are $66,398, $86,196 for men and $49,177 for women, a difference of 42.9%.
| Sex | Number | Average Earnings |
| Male | 10,704 (51.9%) | $86,196 |
| Female | 9,938 (48.1%) | $49,177 |
| Total | 20,642 (100.0%) | $66,398 |
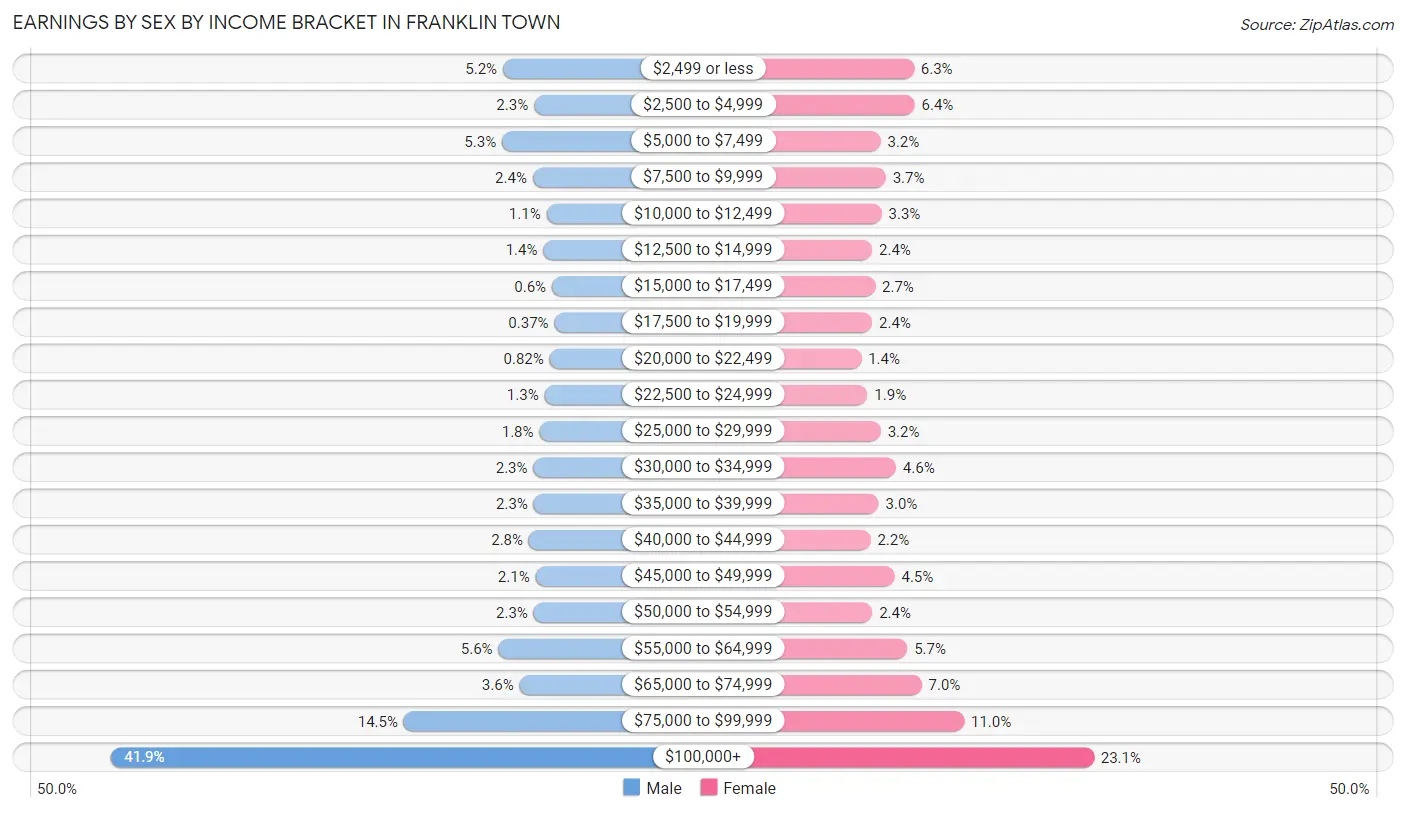
Earnings by Sex by Income Bracket in Franklin Town
The most common earnings brackets in Franklin Town are $100,000+ for men (4,482 | 41.9%) and $100,000+ for women (2,300 | 23.1%).
| Income | Male | Female |
| $2,499 or less | 556 (5.2%) | 624 (6.3%) |
| $2,500 to $4,999 | 244 (2.3%) | 631 (6.4%) |
| $5,000 to $7,499 | 565 (5.3%) | 314 (3.2%) |
| $7,500 to $9,999 | 257 (2.4%) | 363 (3.6%) |
| $10,000 to $12,499 | 119 (1.1%) | 324 (3.3%) |
| $12,500 to $14,999 | 151 (1.4%) | 236 (2.4%) |
| $15,000 to $17,499 | 64 (0.6%) | 263 (2.6%) |
| $17,500 to $19,999 | 40 (0.4%) | 236 (2.4%) |
| $20,000 to $22,499 | 88 (0.8%) | 134 (1.3%) |
| $22,500 to $24,999 | 139 (1.3%) | 192 (1.9%) |
| $25,000 to $29,999 | 191 (1.8%) | 316 (3.2%) |
| $30,000 to $34,999 | 250 (2.3%) | 457 (4.6%) |
| $35,000 to $39,999 | 247 (2.3%) | 296 (3.0%) |
| $40,000 to $44,999 | 295 (2.8%) | 221 (2.2%) |
| $45,000 to $49,999 | 229 (2.1%) | 444 (4.5%) |
| $50,000 to $54,999 | 247 (2.3%) | 237 (2.4%) |
| $55,000 to $64,999 | 600 (5.6%) | 562 (5.7%) |
| $65,000 to $74,999 | 390 (3.6%) | 697 (7.0%) |
| $75,000 to $99,999 | 1,550 (14.5%) | 1,091 (11.0%) |
| $100,000+ | 4,482 (41.9%) | 2,300 (23.1%) |
| Total | 10,704 (100.0%) | 9,938 (100.0%) |
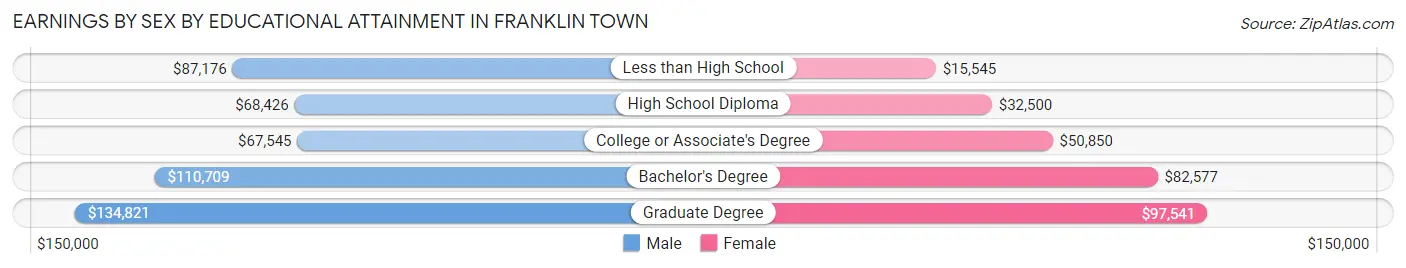
Earnings by Sex by Educational Attainment in Franklin Town
Average earnings in Franklin Town are $99,186 for men and $65,235 for women, a difference of 34.2%. Men with an educational attainment of graduate degree enjoy the highest average annual earnings of $134,821, while those with college or associate's degree education earn the least with $67,545. Women with an educational attainment of graduate degree earn the most with the average annual earnings of $97,541, while those with less than high school education have the smallest earnings of $15,545.
| Educational Attainment | Male Income | Female Income |
| Less than High School | $87,176 | $15,545 |
| High School Diploma | $68,426 | $32,500 |
| College or Associate's Degree | $67,545 | $50,850 |
| Bachelor's Degree | $110,709 | $82,577 |
| Graduate Degree | $134,821 | $97,541 |
| Total | $99,186 | $65,235 |
Family Income in Franklin Town
Family Income Brackets in Franklin Town
According to the Franklin Town family income data, there are 3,466 families falling into the $200,000+ income range, which is the most common income bracket and makes up 39.6% of all families. Conversely, the $10,000 to $14,999 income bracket is the least frequent group with only 96 families (1.1%) belonging to this category.
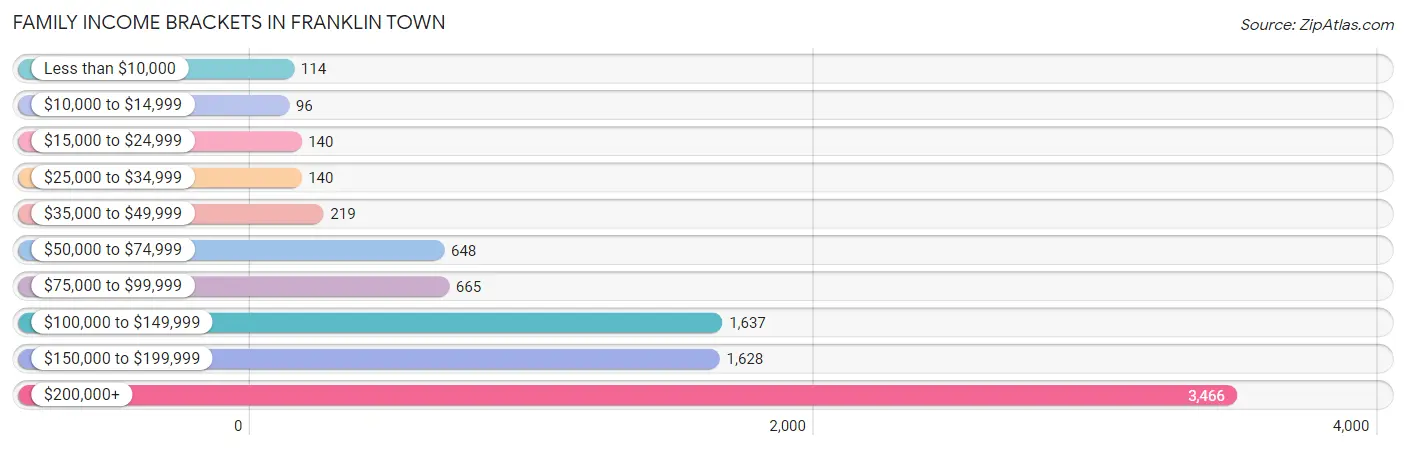
| Income Bracket | # Families | % Families |
| Less than $10,000 | 114 | 1.3% |
| $10,000 to $14,999 | 96 | 1.1% |
| $15,000 to $24,999 | 140 | 1.6% |
| $25,000 to $34,999 | 140 | 1.6% |
| $35,000 to $49,999 | 219 | 2.5% |
| $50,000 to $74,999 | 648 | 7.4% |
| $75,000 to $99,999 | 665 | 7.6% |
| $100,000 to $149,999 | 1,637 | 18.7% |
| $150,000 to $199,999 | 1,628 | 18.6% |
| $200,000+ | 3,466 | 39.6% |
Family Income by Famaliy Size in Franklin Town
6-person families (135 | 1.5%) account for the highest median family income in Franklin Town with $250,001 per family, while 3-person families (2,399 | 27.4%) have the highest median income of $65,375 per family member.
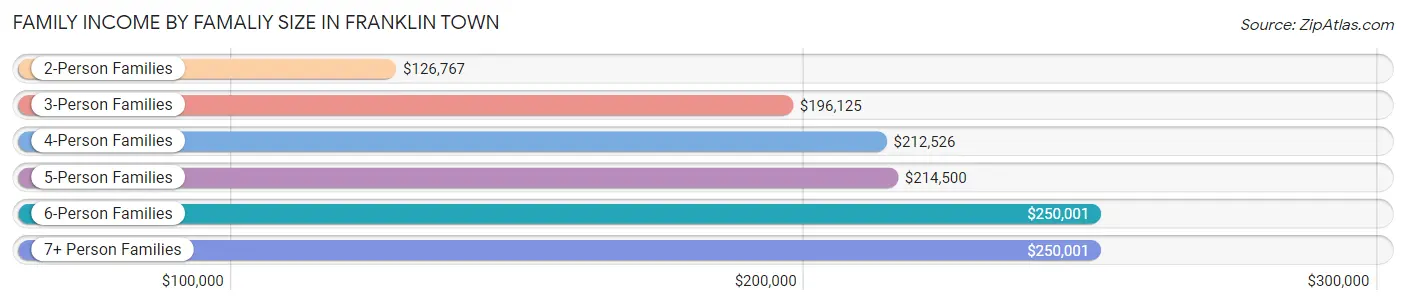
| Income Bracket | # Families | Median Income |
| 2-Person Families | 3,565 (40.7%) | $126,767 |
| 3-Person Families | 2,399 (27.4%) | $196,125 |
| 4-Person Families | 1,877 (21.4%) | $212,526 |
| 5-Person Families | 722 (8.3%) | $214,500 |
| 6-Person Families | 135 (1.5%) | $250,001 |
| 7+ Person Families | 55 (0.6%) | $250,001 |
| Total | 8,753 (100.0%) | $170,487 |
Family Income by Number of Earners in Franklin Town
The median family income in Franklin Town is $170,487, with families comprising 3+ earners (1,661) having the highest median family income of $250,001, while families with no earners (812) have the lowest median family income of $70,109, accounting for 19.0% and 9.3% of families, respectively.
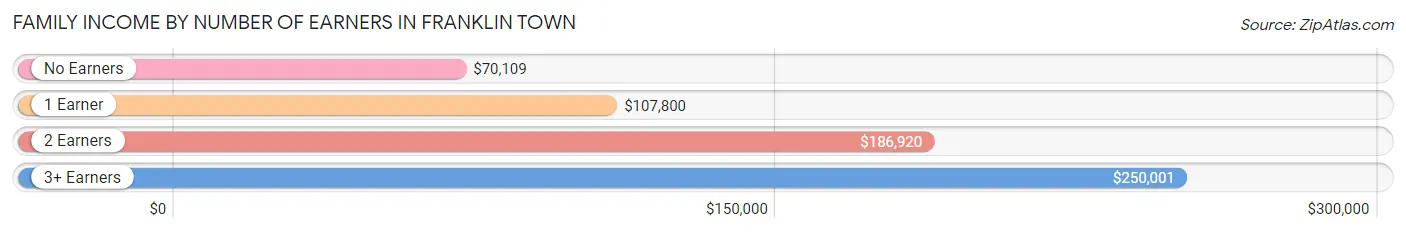
| Number of Earners | # Families | Median Income |
| No Earners | 812 (9.3%) | $70,109 |
| 1 Earner | 1,937 (22.1%) | $107,800 |
| 2 Earners | 4,343 (49.6%) | $186,920 |
| 3+ Earners | 1,661 (19.0%) | $250,001 |
| Total | 8,753 (100.0%) | $170,487 |
Household Income in Franklin Town
Household Income Brackets in Franklin Town
With 3,688 households falling in the category, the $200,000+ income range is the most frequent in Franklin Town, accounting for 30.4% of all households. In contrast, only 243 households (2.0%) fall into the $10,000 to $14,999 income bracket, making it the least populous group.
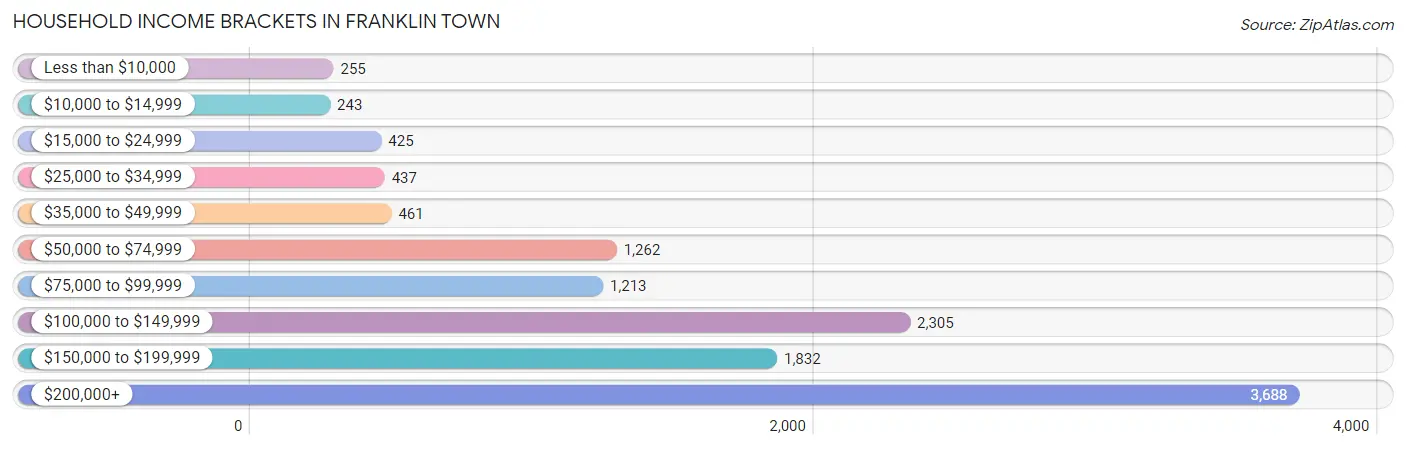
| Income Bracket | # Households | % Households |
| Less than $10,000 | 255 | 2.1% |
| $10,000 to $14,999 | 243 | 2.0% |
| $15,000 to $24,999 | 425 | 3.5% |
| $25,000 to $34,999 | 437 | 3.6% |
| $35,000 to $49,999 | 461 | 3.8% |
| $50,000 to $74,999 | 1,262 | 10.4% |
| $75,000 to $99,999 | 1,213 | 10.0% |
| $100,000 to $149,999 | 2,305 | 19.0% |
| $150,000 to $199,999 | 1,832 | 15.1% |
| $200,000+ | 3,688 | 30.4% |
Household Income by Householder Age in Franklin Town
The median household income in Franklin Town is $138,062, with the highest median household income of $173,955 found in the 45 to 64 years age bracket for the primary householder. A total of 5,808 households (47.9%) fall into this category. Meanwhile, the 15 to 24 years age bracket for the primary householder has the lowest median household income of $75,170, with 163 households (1.3%) in this group.
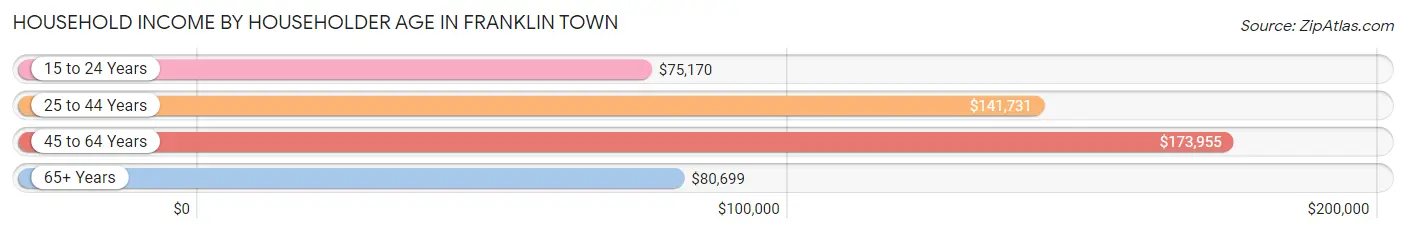
| Income Bracket | # Households | Median Income |
| 15 to 24 Years | 163 (1.3%) | $75,170 |
| 25 to 44 Years | 3,466 (28.6%) | $141,731 |
| 45 to 64 Years | 5,808 (47.9%) | $173,955 |
| 65+ Years | 2,694 (22.2%) | $80,699 |
| Total | 12,131 (100.0%) | $138,062 |
Poverty in Franklin Town
Income Below Poverty by Sex and Age in Franklin Town
With 4.3% poverty level for males and 4.9% for females among the residents of Franklin Town, 5 year old males and 15 year old females are the most vulnerable to poverty, with 23 males (24.0%) and 40 females (13.9%) in their respective age groups living below the poverty level.
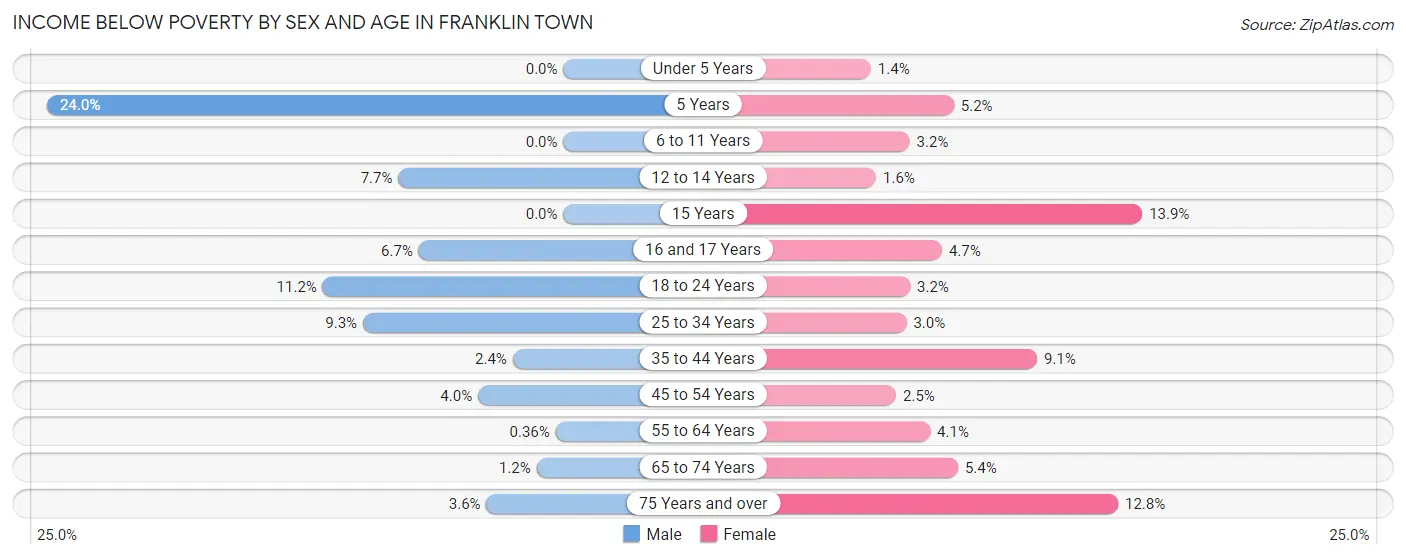
| Age Bracket | Male | Female |
| Under 5 Years | 0 (0.0%) | 9 (1.3%) |
| 5 Years | 23 (24.0%) | 9 (5.2%) |
| 6 to 11 Years | 0 (0.0%) | 34 (3.2%) |
| 12 to 14 Years | 48 (7.7%) | 12 (1.6%) |
| 15 Years | 0 (0.0%) | 40 (13.9%) |
| 16 and 17 Years | 40 (6.7%) | 28 (4.6%) |
| 18 to 24 Years | 164 (11.2%) | 46 (3.2%) |
| 25 to 34 Years | 177 (9.3%) | 48 (3.0%) |
| 35 to 44 Years | 39 (2.4%) | 192 (9.1%) |
| 45 to 54 Years | 124 (4.0%) | 68 (2.5%) |
| 55 to 64 Years | 8 (0.4%) | 102 (4.1%) |
| 65 to 74 Years | 15 (1.2%) | 83 (5.4%) |
| 75 Years and over | 21 (3.6%) | 132 (12.8%) |
| Total | 659 (4.3%) | 803 (4.9%) |
Income Above Poverty by Sex and Age in Franklin Town
According to the poverty statistics in Franklin Town, males aged under 5 years and females aged under 5 years are the age groups that are most secure financially, with 100.0% of males and 98.7% of females in these age groups living above the poverty line.
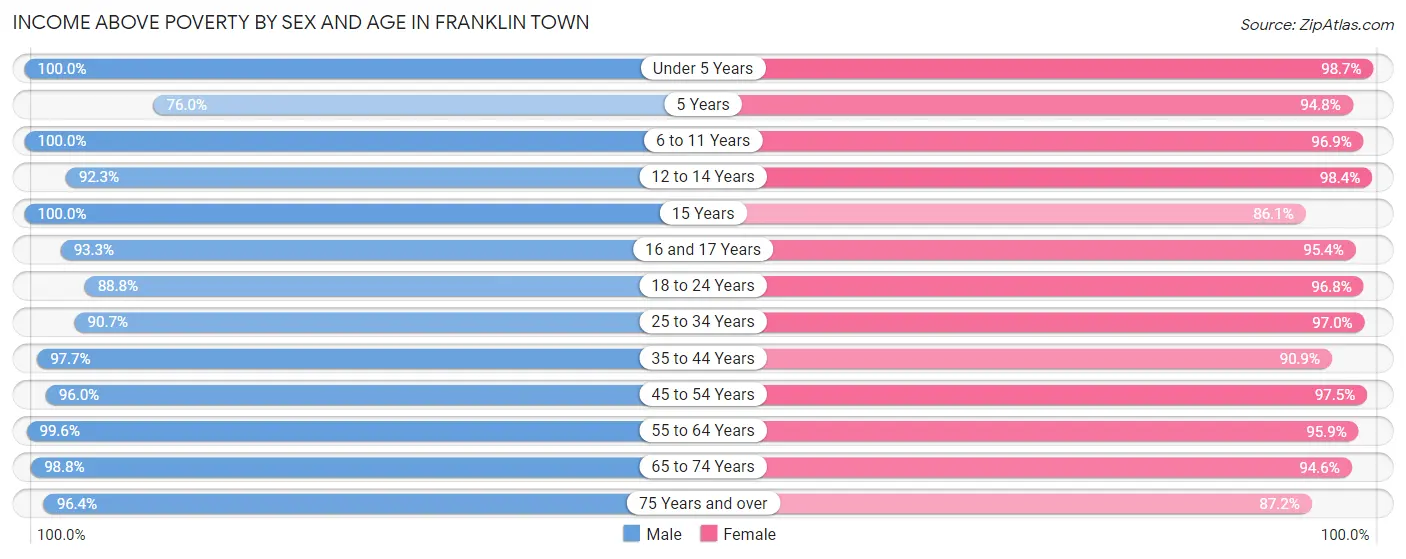
| Age Bracket | Male | Female |
| Under 5 Years | 541 (100.0%) | 659 (98.7%) |
| 5 Years | 73 (76.0%) | 164 (94.8%) |
| 6 to 11 Years | 983 (100.0%) | 1,046 (96.9%) |
| 12 to 14 Years | 579 (92.3%) | 744 (98.4%) |
| 15 Years | 240 (100.0%) | 247 (86.1%) |
| 16 and 17 Years | 556 (93.3%) | 574 (95.4%) |
| 18 to 24 Years | 1,304 (88.8%) | 1,403 (96.8%) |
| 25 to 34 Years | 1,727 (90.7%) | 1,552 (97.0%) |
| 35 to 44 Years | 1,620 (97.7%) | 1,927 (90.9%) |
| 45 to 54 Years | 3,009 (96.0%) | 2,633 (97.5%) |
| 55 to 64 Years | 2,240 (99.6%) | 2,385 (95.9%) |
| 65 to 74 Years | 1,192 (98.8%) | 1,457 (94.6%) |
| 75 Years and over | 568 (96.4%) | 898 (87.2%) |
| Total | 14,632 (95.7%) | 15,689 (95.1%) |
Income Below Poverty Among Married-Couple Families in Franklin Town
The poverty statistics for married-couple families in Franklin Town show that 0.4% or 30 of the total 7,320 families live below the poverty line. Families with no children have the highest poverty rate of 0.5%, comprising of 21 families. On the other hand, families with 3 or 4 children have the lowest poverty rate of 0.0%, which includes 0 families.
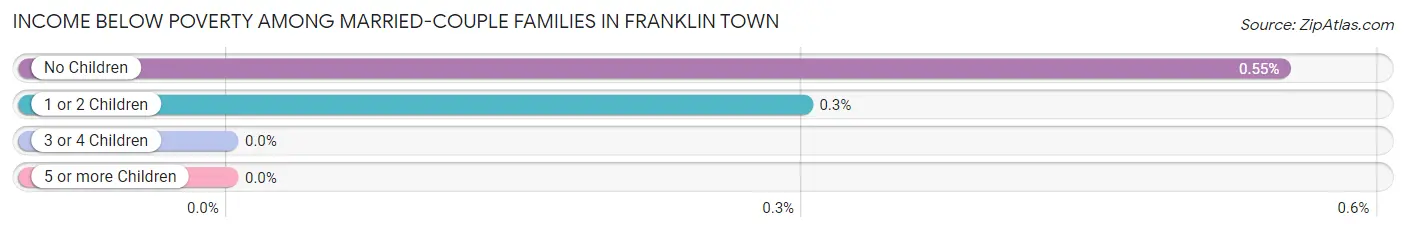
| Children | Above Poverty | Below Poverty |
| No Children | 3,806 (99.5%) | 21 (0.5%) |
| 1 or 2 Children | 2,969 (99.7%) | 9 (0.3%) |
| 3 or 4 Children | 491 (100.0%) | 0 (0.0%) |
| 5 or more Children | 24 (100.0%) | 0 (0.0%) |
| Total | 7,290 (99.6%) | 30 (0.4%) |
Income Below Poverty Among Single-Parent Households in Franklin Town
According to the poverty data in Franklin Town, 19.0% or 46 single-father households and 18.5% or 220 single-mother households are living below the poverty line. Among single-father households, those with no children have the highest poverty rate, with 46 households (26.1%) experiencing poverty. Likewise, among single-mother households, those with 3 or 4 children have the highest poverty rate, with 12 households (44.4%) falling below the poverty line.
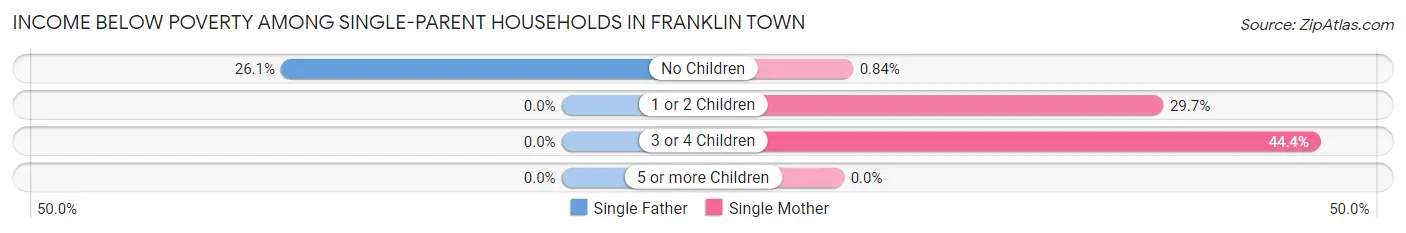
| Children | Single Father | Single Mother |
| No Children | 46 (26.1%) | 4 (0.8%) |
| 1 or 2 Children | 0 (0.0%) | 204 (29.7%) |
| 3 or 4 Children | 0 (0.0%) | 12 (44.4%) |
| 5 or more Children | 0 (0.0%) | 0 (0.0%) |
| Total | 46 (19.0%) | 220 (18.5%) |
Income Below Poverty Among Married-Couple vs Single-Parent Households in Franklin Town
The poverty data for Franklin Town shows that 30 of the married-couple family households (0.4%) and 266 of the single-parent households (18.6%) are living below the poverty level. Within the married-couple family households, those with no children have the highest poverty rate, with 21 households (0.5%) falling below the poverty line. Among the single-parent households, those with 3 or 4 children have the highest poverty rate, with 12 household (28.6%) living below poverty.
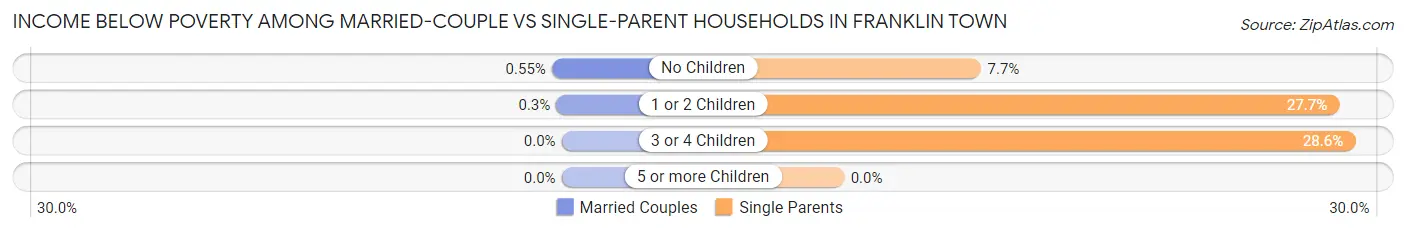
| Children | Married-Couple Families | Single-Parent Households |
| No Children | 21 (0.5%) | 50 (7.6%) |
| 1 or 2 Children | 9 (0.3%) | 204 (27.7%) |
| 3 or 4 Children | 0 (0.0%) | 12 (28.6%) |
| 5 or more Children | 0 (0.0%) | 0 (0.0%) |
| Total | 30 (0.4%) | 266 (18.6%) |
Race in Franklin Town
The most populous races in Franklin Town are White / Caucasian (28,921 | 88.2%), Asian (1,855 | 5.7%), and Two or more Races (1,409 | 4.3%).
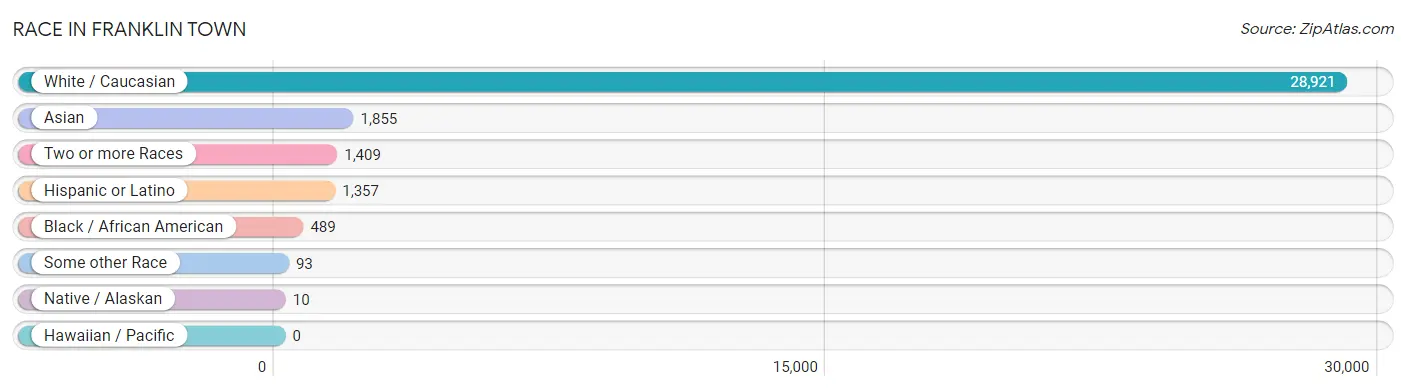
| Race | # Population | % Population |
| Asian | 1,855 | 5.7% |
| Black / African American | 489 | 1.5% |
| Hawaiian / Pacific | 0 | 0.0% |
| Hispanic or Latino | 1,357 | 4.1% |
| Native / Alaskan | 10 | 0.0% |
| White / Caucasian | 28,921 | 88.2% |
| Two or more Races | 1,409 | 4.3% |
| Some other Race | 93 | 0.3% |
| Total | 32,777 | 100.0% |
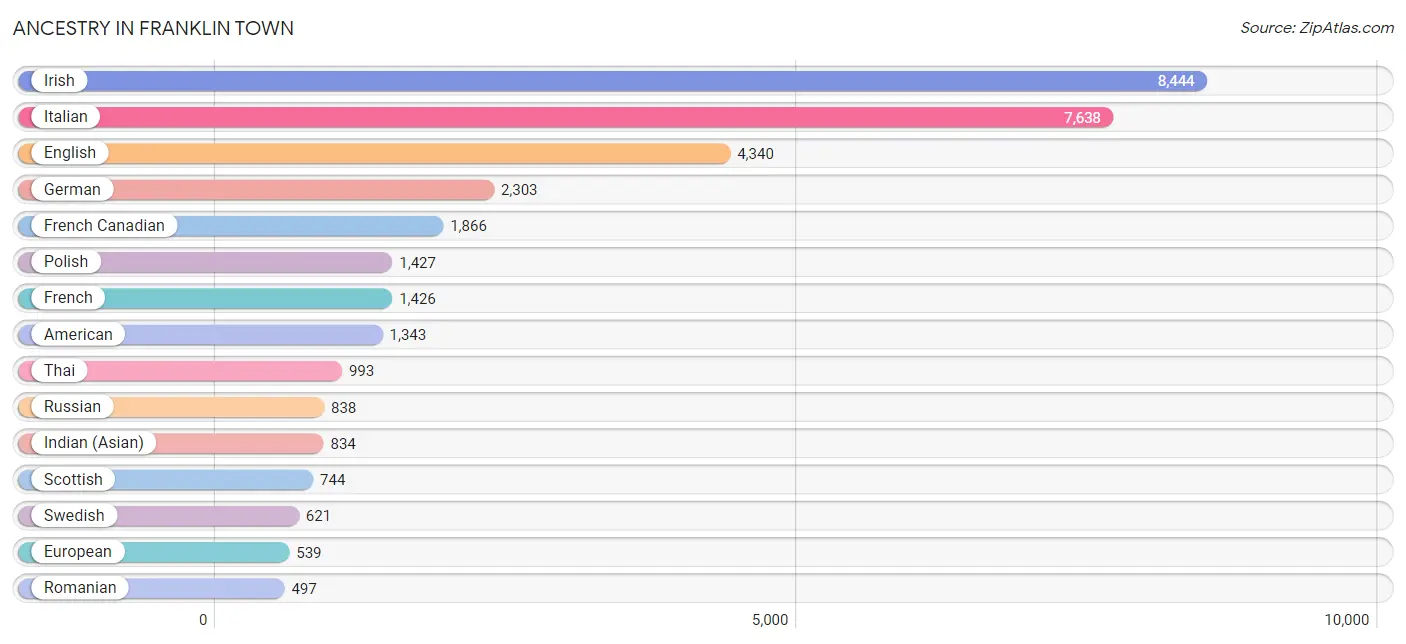
Ancestry in Franklin Town
The most populous ancestries reported in Franklin Town are Irish (8,444 | 25.8%), Italian (7,638 | 23.3%), English (4,340 | 13.2%), German (2,303 | 7.0%), and French Canadian (1,866 | 5.7%), together accounting for 75.0% of all Franklin Town residents.
| Ancestry | # Population | % Population |
| African | 7 | 0.0% |
| Albanian | 92 | 0.3% |
| American | 1,343 | 4.1% |
| Apache | 7 | 0.0% |
| Arab | 282 | 0.9% |
| Armenian | 109 | 0.3% |
| Australian | 53 | 0.2% |
| Austrian | 44 | 0.1% |
| Belizean | 6 | 0.0% |
| Bhutanese | 96 | 0.3% |
| Brazilian | 8 | 0.0% |
| British | 241 | 0.7% |
| Burmese | 217 | 0.7% |
| Canadian | 170 | 0.5% |
| Cape Verdean | 180 | 0.5% |
| Celtic | 18 | 0.1% |
| Central American | 197 | 0.6% |
| Chilean | 24 | 0.1% |
| Colombian | 200 | 0.6% |
| Cuban | 22 | 0.1% |
| Czech | 21 | 0.1% |
| Czechoslovakian | 42 | 0.1% |
| Danish | 216 | 0.7% |
| Dutch | 416 | 1.3% |
| Eastern European | 228 | 0.7% |
| Ecuadorian | 120 | 0.4% |
| Egyptian | 42 | 0.1% |
| English | 4,340 | 13.2% |
| Ethiopian | 92 | 0.3% |
| European | 539 | 1.6% |
| Filipino | 4 | 0.0% |
| Finnish | 71 | 0.2% |
| French | 1,426 | 4.3% |
| French Canadian | 1,866 | 5.7% |
| German | 2,303 | 7.0% |
| Greek | 351 | 1.1% |
| Guatemalan | 46 | 0.1% |
| Haitian | 60 | 0.2% |
| Honduran | 10 | 0.0% |
| Hungarian | 191 | 0.6% |
| Icelander | 18 | 0.1% |
| Indian (Asian) | 834 | 2.5% |
| Indonesian | 6 | 0.0% |
| Irish | 8,444 | 25.8% |
| Italian | 7,638 | 23.3% |
| Jamaican | 5 | 0.0% |
| Jordanian | 49 | 0.2% |
| Korean | 89 | 0.3% |
| Laotian | 17 | 0.1% |
| Latvian | 10 | 0.0% |
| Lebanese | 164 | 0.5% |
| Lithuanian | 170 | 0.5% |
| Luxembourger | 14 | 0.0% |
| Mexican | 203 | 0.6% |
| Mexican American Indian | 4 | 0.0% |
| Northern European | 16 | 0.1% |
| Norwegian | 177 | 0.5% |
| Panamanian | 141 | 0.4% |
| Pennsylvania German | 4 | 0.0% |
| Peruvian | 25 | 0.1% |
| Polish | 1,427 | 4.3% |
| Portuguese | 284 | 0.9% |
| Puerto Rican | 375 | 1.1% |
| Romanian | 497 | 1.5% |
| Russian | 838 | 2.6% |
| Scandinavian | 47 | 0.1% |
| Scotch-Irish | 215 | 0.7% |
| Scottish | 744 | 2.3% |
| Slovak | 124 | 0.4% |
| Slovene | 84 | 0.3% |
| Somali | 44 | 0.1% |
| South American | 369 | 1.1% |
| Spaniard | 13 | 0.0% |
| Spanish | 62 | 0.2% |
| Sri Lankan | 82 | 0.3% |
| Subsaharan African | 328 | 1.0% |
| Swedish | 621 | 1.9% |
| Swiss | 106 | 0.3% |
| Syrian | 27 | 0.1% |
| Thai | 993 | 3.0% |
| Ukrainian | 107 | 0.3% |
| Vietnamese | 4 | 0.0% |
| Welsh | 118 | 0.4% | View All 83 Rows |
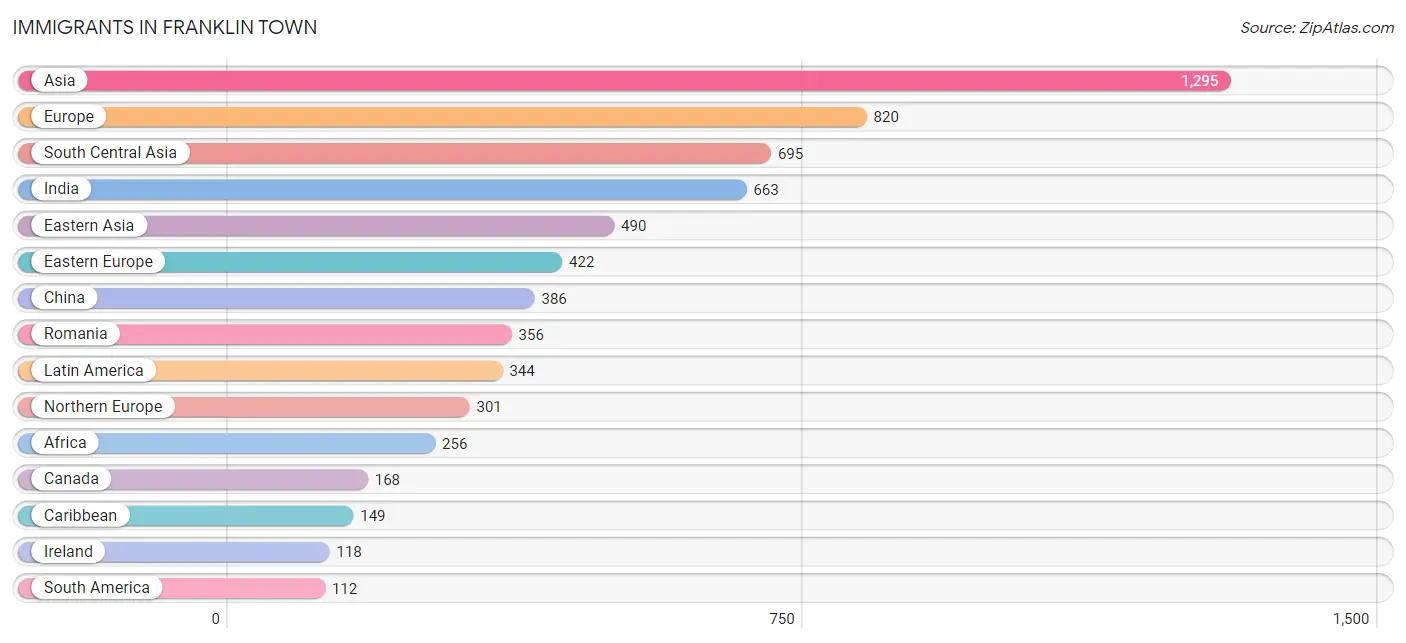
Immigrants in Franklin Town
The most numerous immigrant groups reported in Franklin Town came from Asia (1,295 | 4.0%), Europe (820 | 2.5%), South Central Asia (695 | 2.1%), India (663 | 2.0%), and Eastern Asia (490 | 1.5%), together accounting for 12.1% of all Franklin Town residents.
| Immigration Origin | # Population | % Population |
| Africa | 256 | 0.8% |
| Asia | 1,295 | 4.0% |
| Cabo Verde | 66 | 0.2% |
| Canada | 168 | 0.5% |
| Caribbean | 149 | 0.4% |
| Central America | 83 | 0.3% |
| Chile | 24 | 0.1% |
| China | 386 | 1.2% |
| Dominican Republic | 82 | 0.3% |
| Eastern Africa | 76 | 0.2% |
| Eastern Asia | 490 | 1.5% |
| Eastern Europe | 422 | 1.3% |
| Ecuador | 85 | 0.3% |
| Egypt | 42 | 0.1% |
| El Salvador | 9 | 0.0% |
| England | 41 | 0.1% |
| Ethiopia | 76 | 0.2% |
| Europe | 820 | 2.5% |
| France | 1 | 0.0% |
| Germany | 19 | 0.1% |
| Greece | 17 | 0.1% |
| Guatemala | 53 | 0.2% |
| Haiti | 60 | 0.2% |
| India | 663 | 2.0% |
| Ireland | 118 | 0.4% |
| Italy | 39 | 0.1% |
| Japan | 11 | 0.0% |
| Jordan | 49 | 0.2% |
| Korea | 93 | 0.3% |
| Latin America | 344 | 1.1% |
| Lebanon | 20 | 0.1% |
| Mexico | 21 | 0.1% |
| Middle Africa | 72 | 0.2% |
| Netherlands | 7 | 0.0% |
| Northern Africa | 42 | 0.1% |
| Northern Europe | 301 | 0.9% |
| Peru | 3 | 0.0% |
| Philippines | 8 | 0.0% |
| Poland | 6 | 0.0% |
| Romania | 356 | 1.1% |
| Russia | 30 | 0.1% |
| Scotland | 12 | 0.0% |
| South America | 112 | 0.3% |
| South Central Asia | 695 | 2.1% |
| South Eastern Asia | 41 | 0.1% |
| Southern Europe | 56 | 0.2% |
| Switzerland | 14 | 0.0% |
| Taiwan | 5 | 0.0% |
| Thailand | 18 | 0.1% |
| Trinidad and Tobago | 7 | 0.0% |
| Ukraine | 30 | 0.1% |
| Uzbekistan | 18 | 0.1% |
| Vietnam | 9 | 0.0% |
| Western Africa | 66 | 0.2% |
| Western Asia | 69 | 0.2% |
| Western Europe | 41 | 0.1% | View All 56 Rows |
Sex and Age in Franklin Town
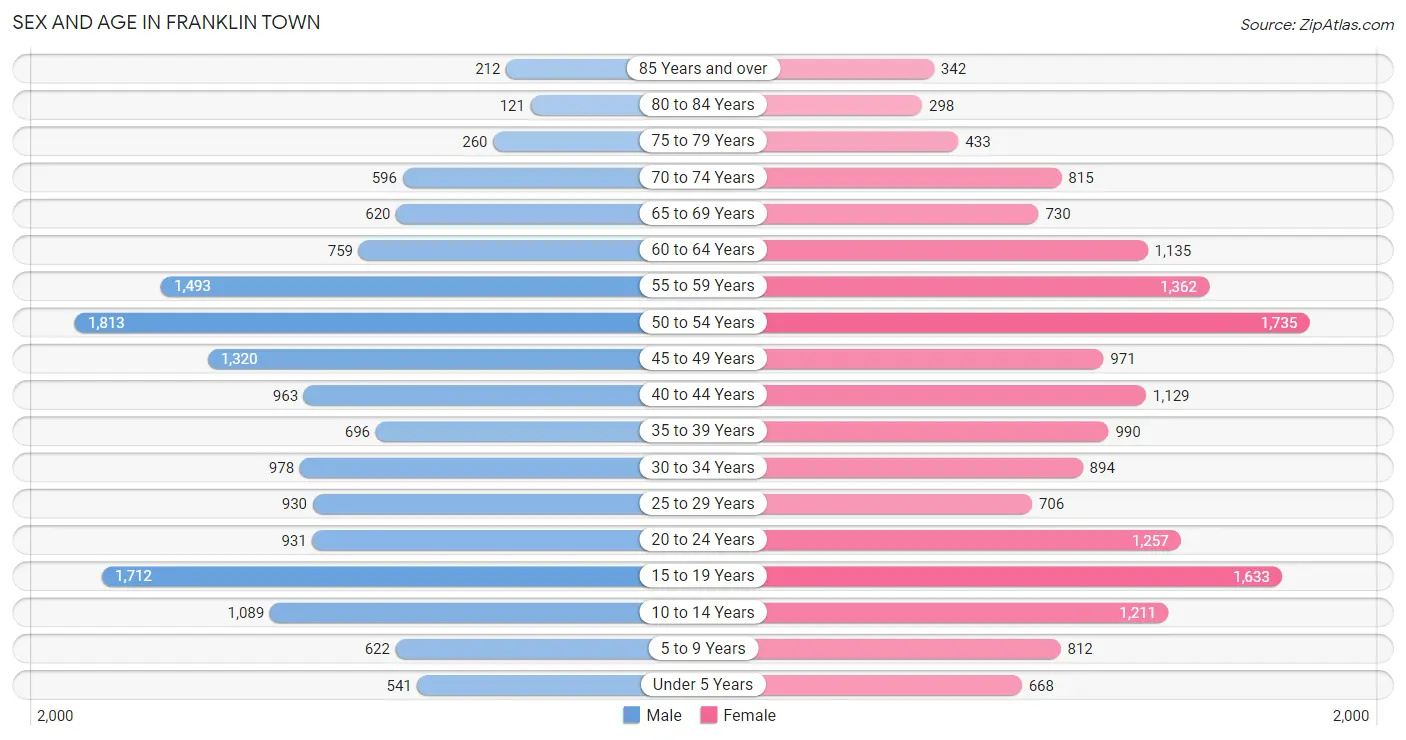
Sex and Age in Franklin Town
The most populous age groups in Franklin Town are 50 to 54 Years (1,813 | 11.6%) for men and 50 to 54 Years (1,735 | 10.1%) for women.
| Age Bracket | Male | Female |
| Under 5 Years | 541 (3.5%) | 668 (3.9%) |
| 5 to 9 Years | 622 (4.0%) | 812 (4.7%) |
| 10 to 14 Years | 1,089 (7.0%) | 1,211 (7.1%) |
| 15 to 19 Years | 1,712 (10.9%) | 1,633 (9.5%) |
| 20 to 24 Years | 931 (5.9%) | 1,257 (7.3%) |
| 25 to 29 Years | 930 (5.9%) | 706 (4.1%) |
| 30 to 34 Years | 978 (6.2%) | 894 (5.2%) |
| 35 to 39 Years | 696 (4.4%) | 990 (5.8%) |
| 40 to 44 Years | 963 (6.1%) | 1,129 (6.6%) |
| 45 to 49 Years | 1,320 (8.4%) | 971 (5.7%) |
| 50 to 54 Years | 1,813 (11.6%) | 1,735 (10.1%) |
| 55 to 59 Years | 1,493 (9.5%) | 1,362 (8.0%) |
| 60 to 64 Years | 759 (4.9%) | 1,135 (6.6%) |
| 65 to 69 Years | 620 (4.0%) | 730 (4.3%) |
| 70 to 74 Years | 596 (3.8%) | 815 (4.8%) |
| 75 to 79 Years | 260 (1.7%) | 433 (2.5%) |
| 80 to 84 Years | 121 (0.8%) | 298 (1.7%) |
| 85 Years and over | 212 (1.3%) | 342 (2.0%) |
| Total | 15,656 (100.0%) | 17,121 (100.0%) |
Families and Households in Franklin Town
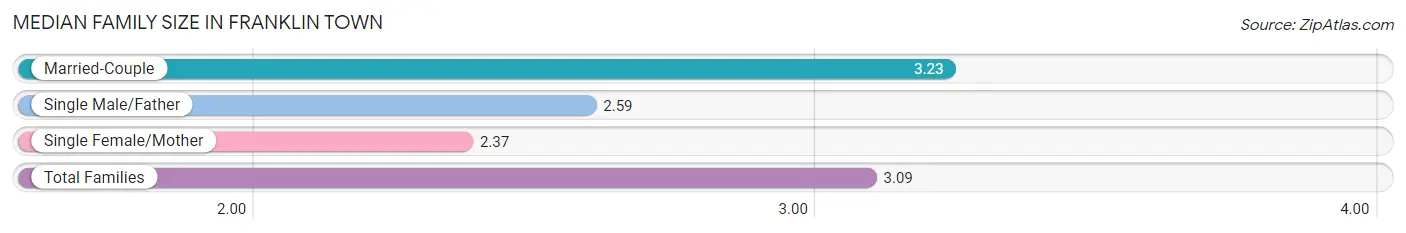
Median Family Size in Franklin Town
The median family size in Franklin Town is 3.09 persons per family, with married-couple families (7,320 | 83.6%) accounting for the largest median family size of 3.23 persons per family. On the other hand, single female/mother families (1,191 | 13.6%) represent the smallest median family size with 2.37 persons per family.
| Family Type | # Families | Family Size |
| Married-Couple | 7,320 (83.6%) | 3.23 |
| Single Male/Father | 242 (2.8%) | 2.59 |
| Single Female/Mother | 1,191 (13.6%) | 2.37 |
| Total Families | 8,753 (100.0%) | 3.09 |
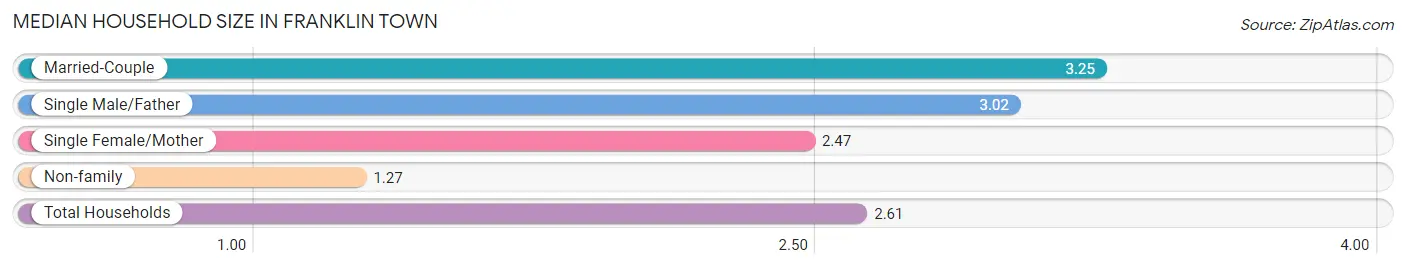
Median Household Size in Franklin Town
The median household size in Franklin Town is 2.61 persons per household, with married-couple households (7,320 | 60.3%) accounting for the largest median household size of 3.25 persons per household. non-family households (3,378 | 27.9%) represent the smallest median household size with 1.27 persons per household.
| Household Type | # Households | Household Size |
| Married-Couple | 7,320 (60.3%) | 3.25 |
| Single Male/Father | 242 (2.0%) | 3.02 |
| Single Female/Mother | 1,191 (9.8%) | 2.47 |
| Non-family | 3,378 (27.9%) | 1.27 |
| Total Households | 12,131 (100.0%) | 2.61 |
Household Size by Marriage Status in Franklin Town
Out of a total of 12,131 households in Franklin Town, 8,753 (72.2%) are family households, while 3,378 (27.9%) are nonfamily households. The most numerous type of family households are 2-person households, comprising 3,419, and the most common type of nonfamily households are 1-person households, comprising 2,503.
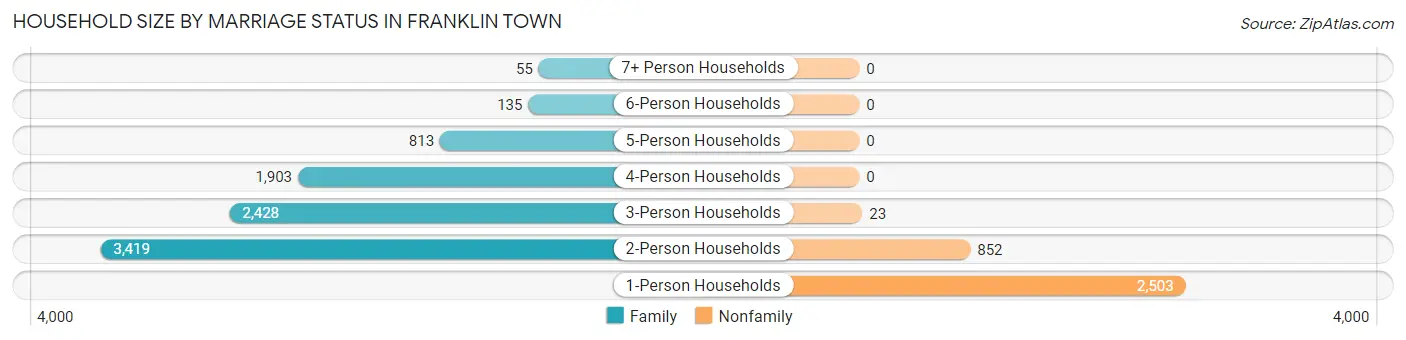
| Household Size | Family Households | Nonfamily Households |
| 1-Person Households | - | 2,503 (20.6%) |
| 2-Person Households | 3,419 (28.2%) | 852 (7.0%) |
| 3-Person Households | 2,428 (20.0%) | 23 (0.2%) |
| 4-Person Households | 1,903 (15.7%) | 0 (0.0%) |
| 5-Person Households | 813 (6.7%) | 0 (0.0%) |
| 6-Person Households | 135 (1.1%) | 0 (0.0%) |
| 7+ Person Households | 55 (0.4%) | 0 (0.0%) |
| Total | 8,753 (72.2%) | 3,378 (27.9%) |
Female Fertility in Franklin Town
Fertility by Age in Franklin Town
Average fertility rate in Franklin Town is 26.0 births per 1,000 women. Women in the age bracket of 20 to 34 years have the highest fertility rate with 35.0 births per 1,000 women. Women in the age bracket of 35 to 50 years acount for 51.5% of all women with births.
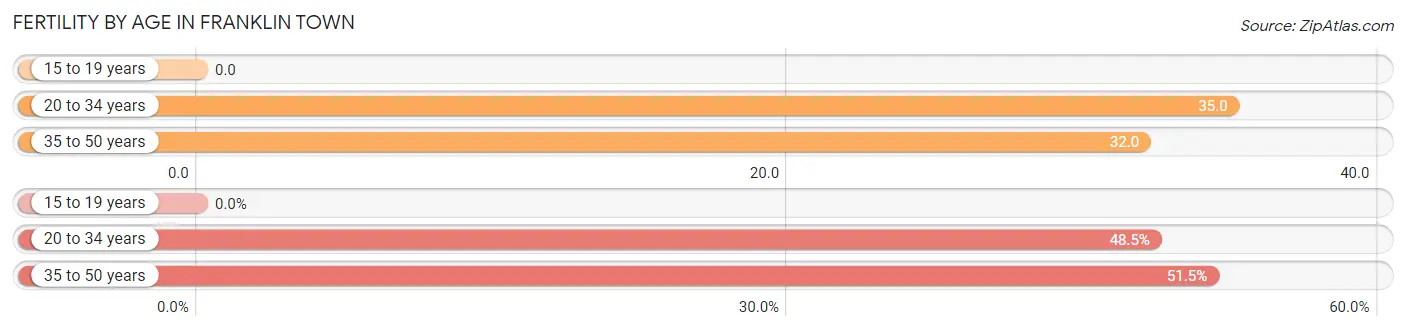
| Age Bracket | Women with Births | Births / 1,000 Women |
| 15 to 19 years | 0 (0.0%) | 0.0 |
| 20 to 34 years | 100 (48.5%) | 35.0 |
| 35 to 50 years | 106 (51.5%) | 32.0 |
| Total | 206 (100.0%) | 26.0 |
Fertility by Age by Marriage Status in Franklin Town
99.0% of women with births (206) in Franklin Town are married. The highest percentage of unmarried women with births falls into 35 to 50 years age bracket with 1.9% of them unmarried at the time of birth, while the lowest percentage of unmarried women with births belong to 20 to 34 years age bracket with 0.0% of them unmarried.
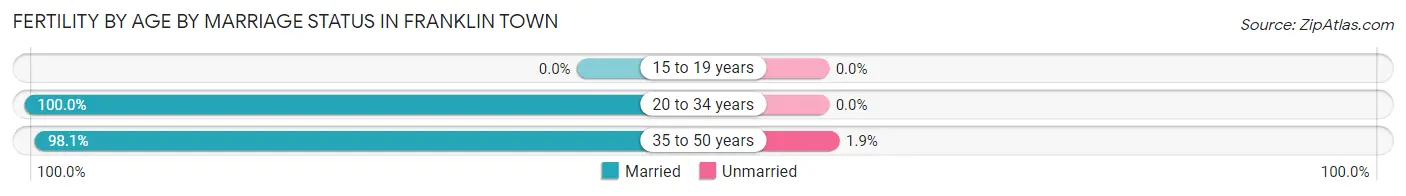
| Age Bracket | Married | Unmarried |
| 15 to 19 years | 0 (0.0%) | 0 (0.0%) |
| 20 to 34 years | 100 (100.0%) | 0 (0.0%) |
| 35 to 50 years | 104 (98.1%) | 2 (1.9%) |
| Total | 204 (99.0%) | 2 (1.0%) |
Fertility by Education in Franklin Town
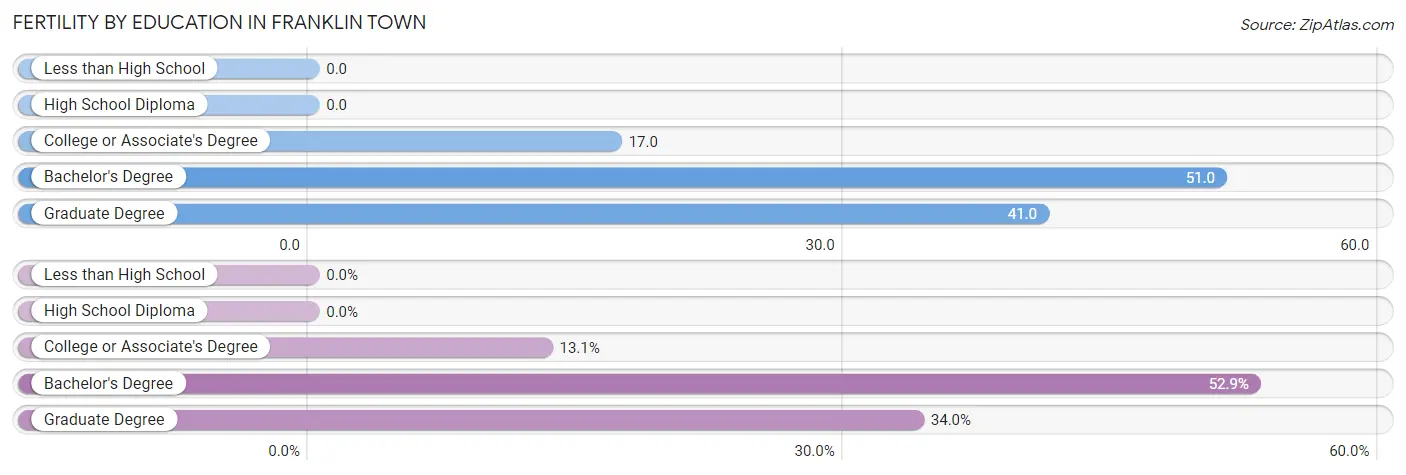
| Educational Attainment | Women with Births | Births / 1,000 Women |
| Less than High School | 0 (0.0%) | 0.0 |
| High School Diploma | 0 (0.0%) | 0.0 |
| College or Associate's Degree | 27 (13.1%) | 17.0 |
| Bachelor's Degree | 109 (52.9%) | 51.0 |
| Graduate Degree | 70 (34.0%) | 41.0 |
| Total | 206 (100.0%) | 26.0 |
Fertility by Education by Marriage Status in Franklin Town
1.0% of women with births in Franklin Town are unmarried. Women with the educational attainment of college or associate's degree are most likely to be married with 100.0% of them married at childbirth, while women with the educational attainment of bachelor's degree are least likely to be married with 1.8% of them unmarried at childbirth.
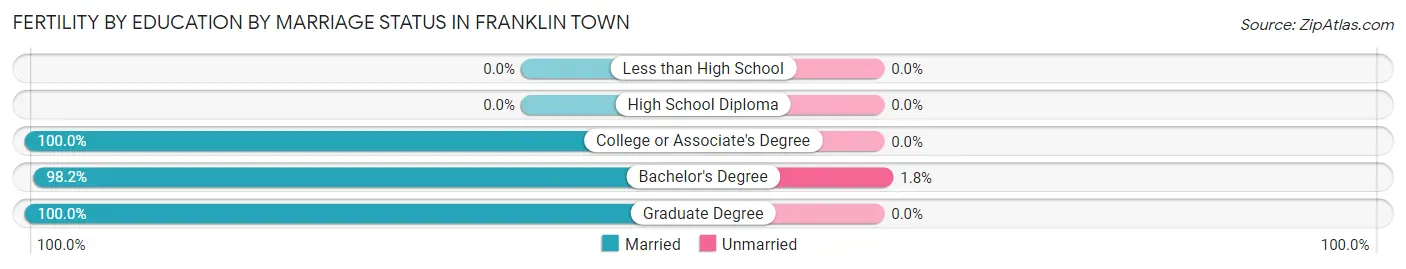
| Educational Attainment | Married | Unmarried |
| Less than High School | 0 (0.0%) | 0 (0.0%) |
| High School Diploma | 0 (0.0%) | 0 (0.0%) |
| College or Associate's Degree | 27 (100.0%) | 0 (0.0%) |
| Bachelor's Degree | 107 (98.2%) | 2 (1.8%) |
| Graduate Degree | 70 (100.0%) | 0 (0.0%) |
| Total | 204 (99.0%) | 2 (1.0%) |
Employment Characteristics in Franklin Town
Employment by Class of Employer in Franklin Town
Among the 18,113 employed individuals in Franklin Town, private company employees (12,734 | 70.3%), not-for-profit organizations (1,756 | 9.7%), and local government employees (1,628 | 9.0%) make up the most common classes of employment.
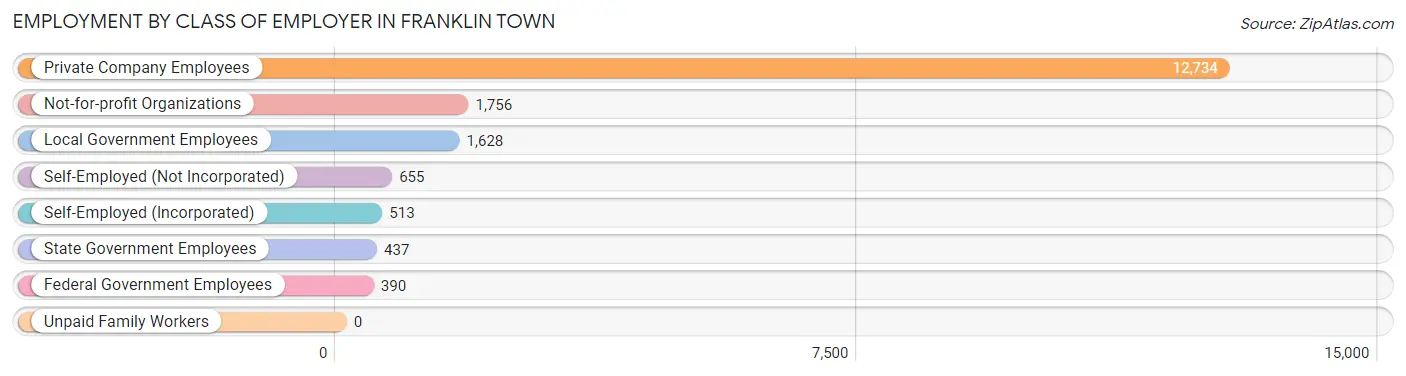
| Employer Class | # Employees | % Employees |
| Private Company Employees | 12,734 | 70.3% |
| Self-Employed (Incorporated) | 513 | 2.8% |
| Self-Employed (Not Incorporated) | 655 | 3.6% |
| Not-for-profit Organizations | 1,756 | 9.7% |
| Local Government Employees | 1,628 | 9.0% |
| State Government Employees | 437 | 2.4% |
| Federal Government Employees | 390 | 2.1% |
| Unpaid Family Workers | 0 | 0.0% |
| Total | 18,113 | 100.0% |
Employment Status by Age in Franklin Town
According to the labor force statistics for Franklin Town, out of the total population over 16 years of age (27,306), 71.7% or 19,578 individuals are in the labor force, with 5.4% or 1,057 of them unemployed. The age group with the highest labor force participation rate is 25 to 29 years, with 97.7% or 1,598 individuals in the labor force. Within the labor force, the 16 to 19 years age range has the highest percentage of unemployed individuals, with 21.5% or 292 of them being unemployed.
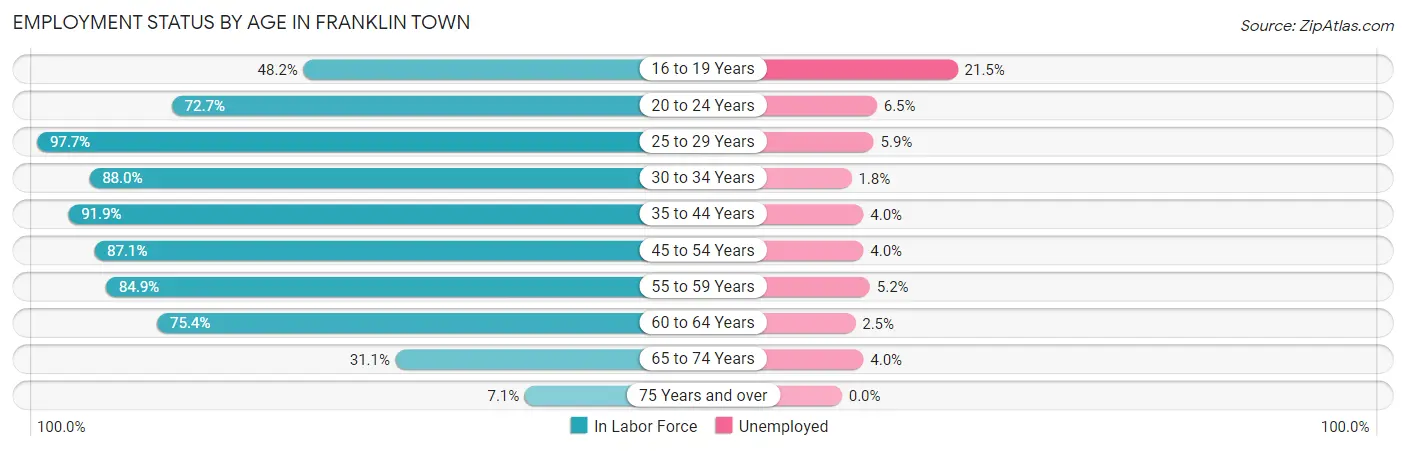
| Age Bracket | In Labor Force | Unemployed |
| 16 to 19 Years | 1,358 (48.2%) | 292 (21.5%) |
| 20 to 24 Years | 1,591 (72.7%) | 103 (6.5%) |
| 25 to 29 Years | 1,598 (97.7%) | 94 (5.9%) |
| 30 to 34 Years | 1,647 (88.0%) | 30 (1.8%) |
| 35 to 44 Years | 3,472 (91.9%) | 139 (4.0%) |
| 45 to 54 Years | 5,086 (87.1%) | 203 (4.0%) |
| 55 to 59 Years | 2,424 (84.9%) | 126 (5.2%) |
| 60 to 64 Years | 1,428 (75.4%) | 36 (2.5%) |
| 65 to 74 Years | 859 (31.1%) | 34 (4.0%) |
| 75 Years and over | 118 (7.1%) | 0 (0.0%) |
| Total | 19,578 (71.7%) | 1,057 (5.4%) |
Employment Status by Educational Attainment in Franklin Town
According to labor force statistics for Franklin Town, 87.6% of individuals (15,658) out of the total population between 25 and 64 years of age (17,874) are in the labor force, with 4.0% or 626 of them being unemployed. The group with the highest labor force participation rate are those with the educational attainment of bachelor's degree or higher, with 92.0% or 9,563 individuals in the labor force. Within the labor force, individuals with bachelor's degree or higher education have the highest percentage of unemployment, with 4.4% or 421 of them being unemployed.
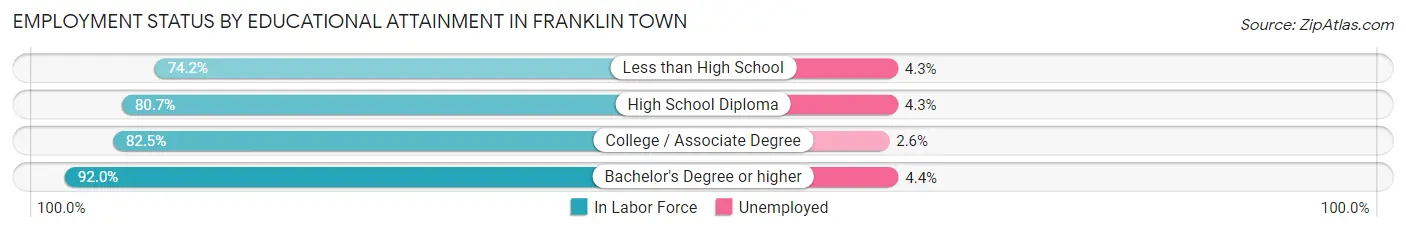
| Educational Attainment | In Labor Force | Unemployed |
| Less than High School | 299 (74.2%) | 17 (4.3%) |
| High School Diploma | 2,304 (80.7%) | 123 (4.3%) |
| College / Associate Degree | 3,482 (82.5%) | 110 (2.6%) |
| Bachelor's Degree or higher | 9,563 (92.0%) | 457 (4.4%) |
| Total | 15,658 (87.6%) | 715 (4.0%) |
Employment Occupations by Sex in Franklin Town
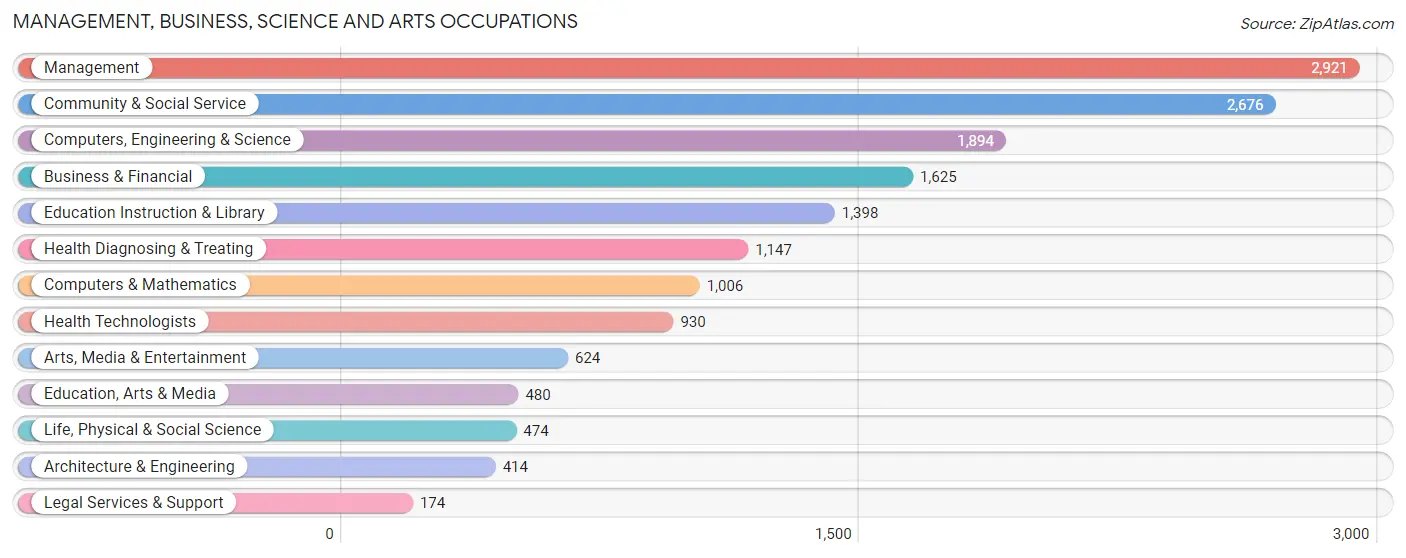
Management, Business, Science and Arts Occupations
The most common Management, Business, Science and Arts occupations in Franklin Town are Management (2,921 | 15.8%), Community & Social Service (2,676 | 14.4%), Computers, Engineering & Science (1,894 | 10.2%), Business & Financial (1,625 | 8.8%), and Education Instruction & Library (1,398 | 7.5%).
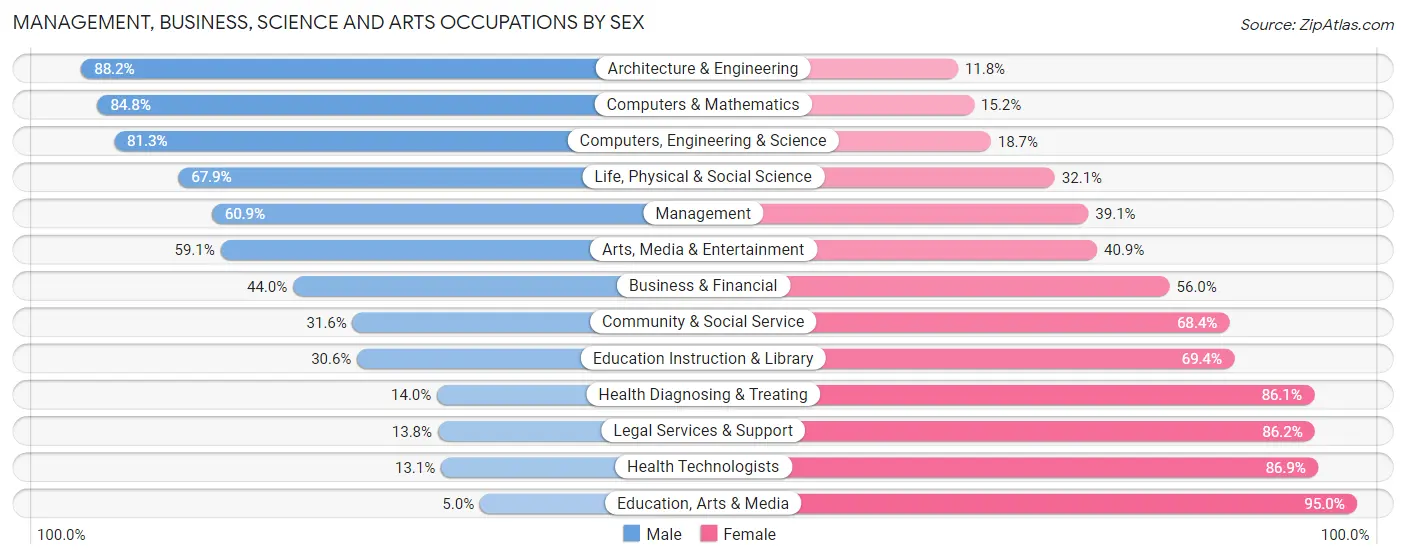
Management, Business, Science and Arts Occupations by Sex
Within the Management, Business, Science and Arts occupations in Franklin Town, the most male-oriented occupations are Architecture & Engineering (88.2%), Computers & Mathematics (84.8%), and Computers, Engineering & Science (81.3%), while the most female-oriented occupations are Education, Arts & Media (95.0%), Health Technologists (86.9%), and Legal Services & Support (86.2%).
| Occupation | Male | Female |
| Management | 1,780 (60.9%) | 1,141 (39.1%) |
| Business & Financial | 715 (44.0%) | 910 (56.0%) |
| Computers, Engineering & Science | 1,540 (81.3%) | 354 (18.7%) |
| Computers & Mathematics | 853 (84.8%) | 153 (15.2%) |
| Architecture & Engineering | 365 (88.2%) | 49 (11.8%) |
| Life, Physical & Social Science | 322 (67.9%) | 152 (32.1%) |
| Community & Social Service | 845 (31.6%) | 1,831 (68.4%) |
| Education, Arts & Media | 24 (5.0%) | 456 (95.0%) |
| Legal Services & Support | 24 (13.8%) | 150 (86.2%) |
| Education Instruction & Library | 428 (30.6%) | 970 (69.4%) |
| Arts, Media & Entertainment | 369 (59.1%) | 255 (40.9%) |
| Health Diagnosing & Treating | 160 (14.0%) | 987 (86.1%) |
| Health Technologists | 122 (13.1%) | 808 (86.9%) |
| Total (Category) | 5,040 (49.1%) | 5,223 (50.9%) |
| Total (Overall) | 9,703 (52.4%) | 8,823 (47.6%) |
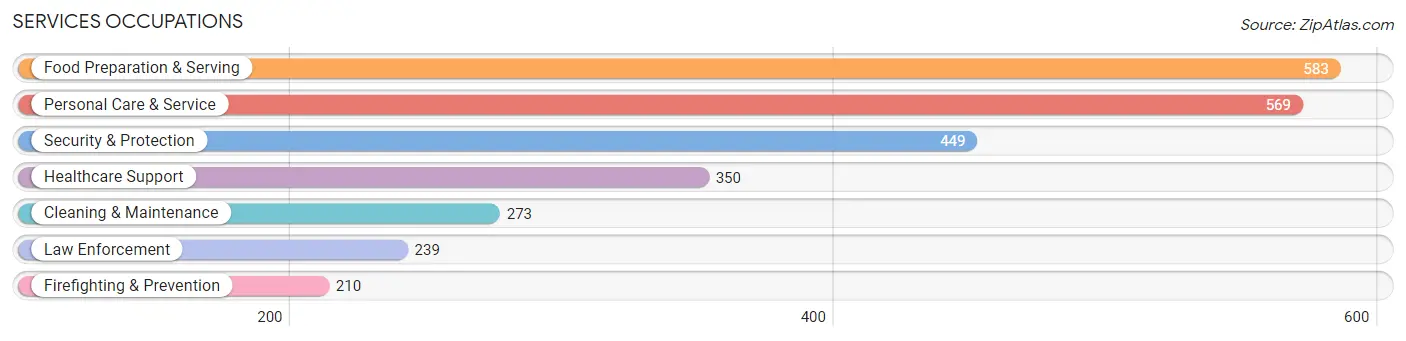
Services Occupations
The most common Services occupations in Franklin Town are Food Preparation & Serving (583 | 3.2%), Personal Care & Service (569 | 3.1%), Security & Protection (449 | 2.4%), Healthcare Support (350 | 1.9%), and Cleaning & Maintenance (273 | 1.5%).
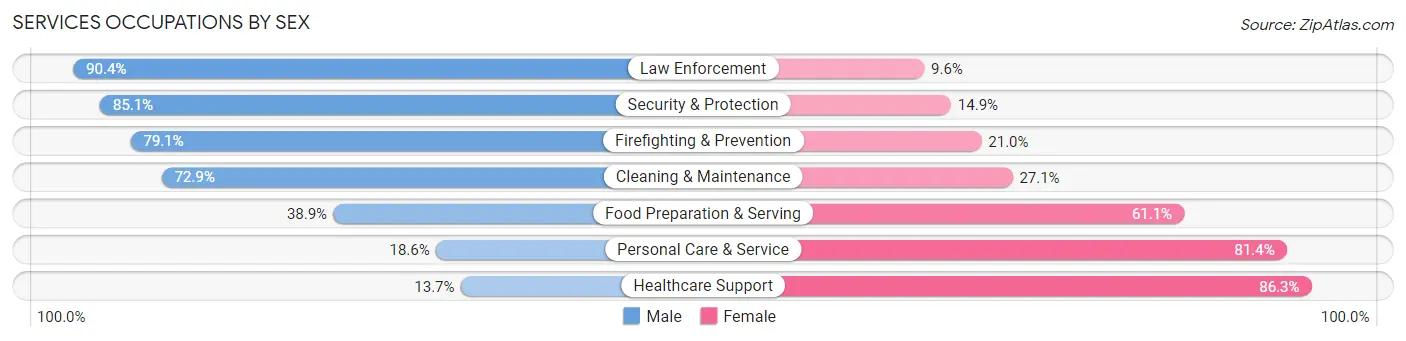
Services Occupations by Sex
Within the Services occupations in Franklin Town, the most male-oriented occupations are Law Enforcement (90.4%), Security & Protection (85.1%), and Firefighting & Prevention (79.0%), while the most female-oriented occupations are Healthcare Support (86.3%), Personal Care & Service (81.4%), and Food Preparation & Serving (61.1%).
| Occupation | Male | Female |
| Healthcare Support | 48 (13.7%) | 302 (86.3%) |
| Security & Protection | 382 (85.1%) | 67 (14.9%) |
| Firefighting & Prevention | 166 (79.0%) | 44 (20.9%) |
| Law Enforcement | 216 (90.4%) | 23 (9.6%) |
| Food Preparation & Serving | 227 (38.9%) | 356 (61.1%) |
| Cleaning & Maintenance | 199 (72.9%) | 74 (27.1%) |
| Personal Care & Service | 106 (18.6%) | 463 (81.4%) |
| Total (Category) | 962 (43.3%) | 1,262 (56.7%) |
| Total (Overall) | 9,703 (52.4%) | 8,823 (47.6%) |
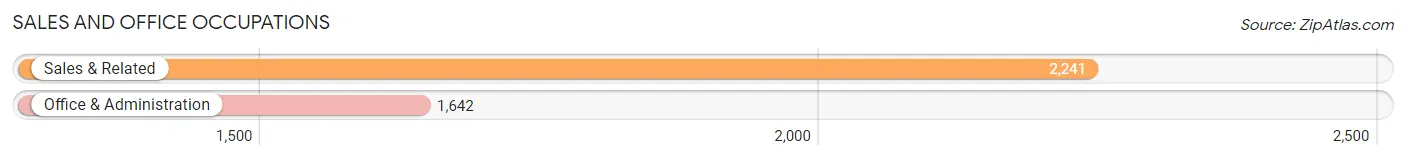
Sales and Office Occupations
The most common Sales and Office occupations in Franklin Town are Sales & Related (2,241 | 12.1%), and Office & Administration (1,642 | 8.9%).
Sales and Office Occupations by Sex
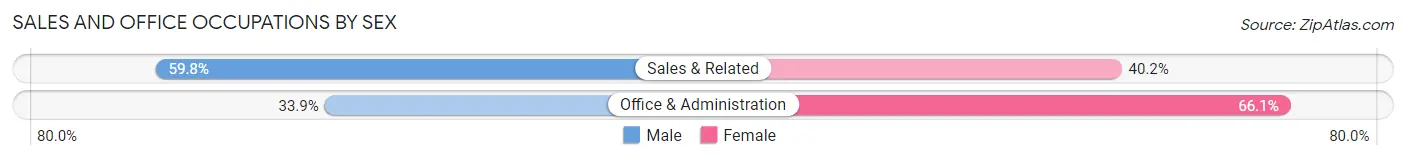
| Occupation | Male | Female |
| Sales & Related | 1,341 (59.8%) | 900 (40.2%) |
| Office & Administration | 556 (33.9%) | 1,086 (66.1%) |
| Total (Category) | 1,897 (48.8%) | 1,986 (51.1%) |
| Total (Overall) | 9,703 (52.4%) | 8,823 (47.6%) |
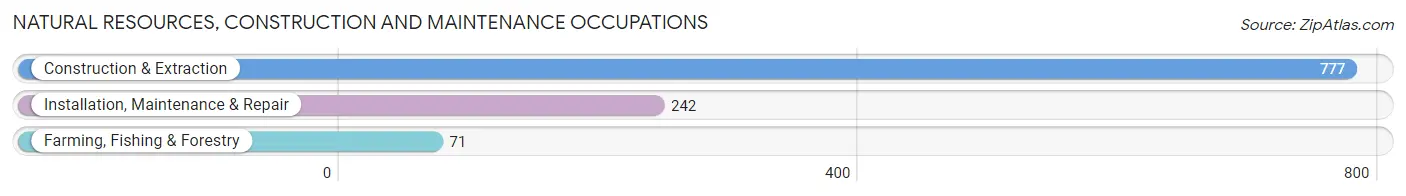
Natural Resources, Construction and Maintenance Occupations
The most common Natural Resources, Construction and Maintenance occupations in Franklin Town are Construction & Extraction (777 | 4.2%), Installation, Maintenance & Repair (242 | 1.3%), and Farming, Fishing & Forestry (71 | 0.4%).
Natural Resources, Construction and Maintenance Occupations by Sex
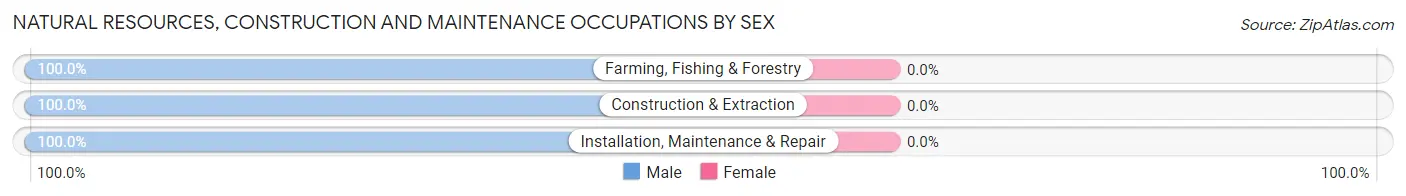
| Occupation | Male | Female |
| Farming, Fishing & Forestry | 71 (100.0%) | 0 (0.0%) |
| Construction & Extraction | 777 (100.0%) | 0 (0.0%) |
| Installation, Maintenance & Repair | 242 (100.0%) | 0 (0.0%) |
| Total (Category) | 1,090 (100.0%) | 0 (0.0%) |
| Total (Overall) | 9,703 (52.4%) | 8,823 (47.6%) |
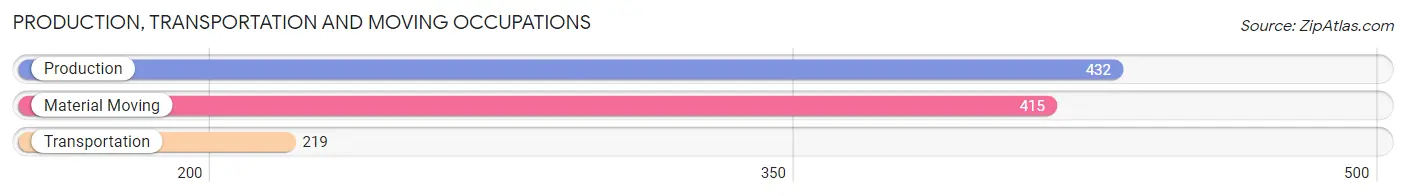
Production, Transportation and Moving Occupations
The most common Production, Transportation and Moving occupations in Franklin Town are Production (432 | 2.3%), Material Moving (415 | 2.2%), and Transportation (219 | 1.2%).
Production, Transportation and Moving Occupations by Sex
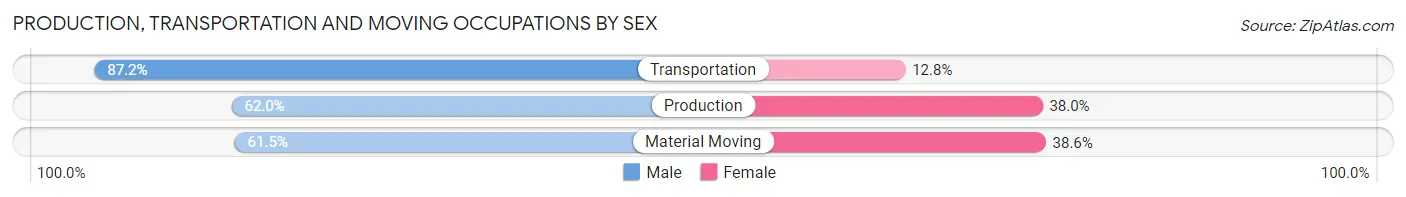
| Occupation | Male | Female |
| Production | 268 (62.0%) | 164 (38.0%) |
| Transportation | 191 (87.2%) | 28 (12.8%) |
| Material Moving | 255 (61.5%) | 160 (38.6%) |
| Total (Category) | 714 (67.0%) | 352 (33.0%) |
| Total (Overall) | 9,703 (52.4%) | 8,823 (47.6%) |
Employment Industries by Sex in Franklin Town
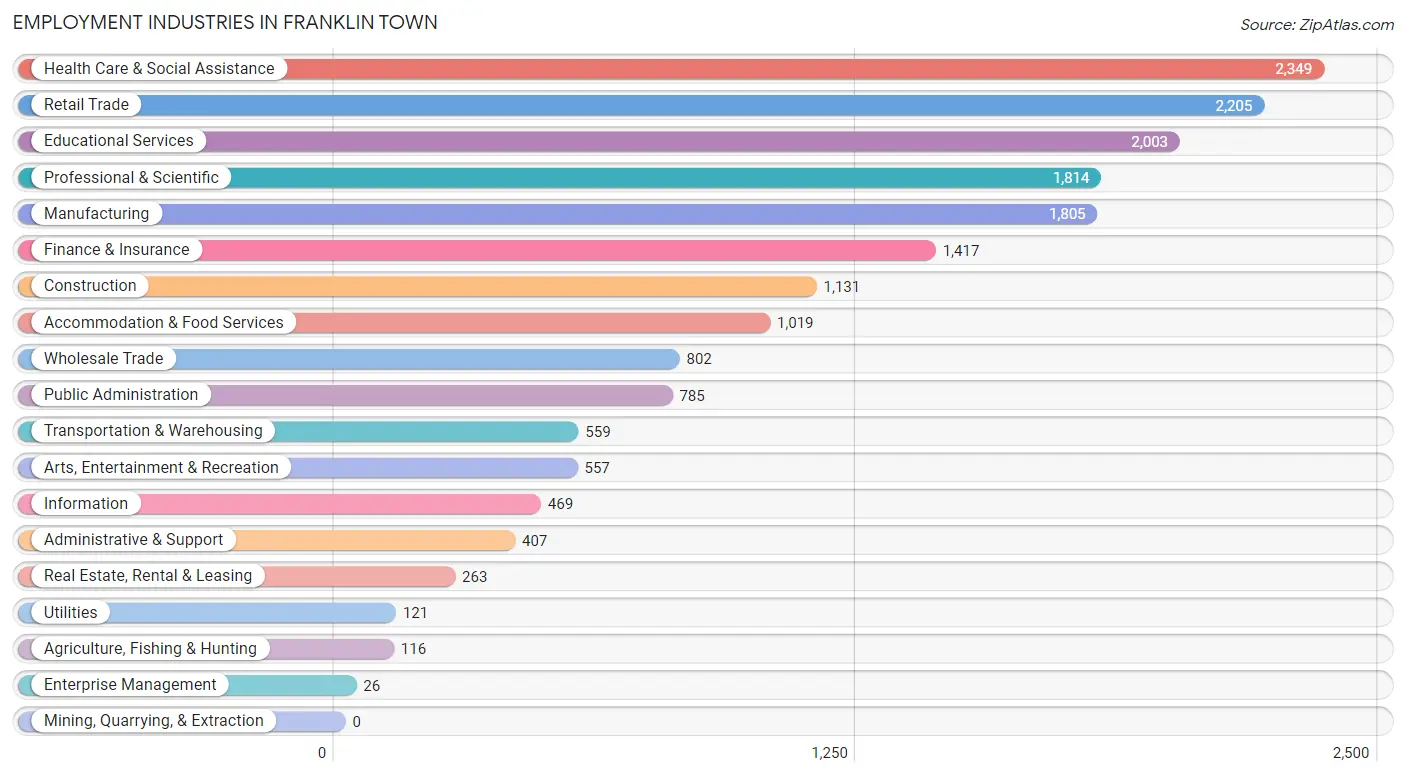
Employment Industries in Franklin Town
The major employment industries in Franklin Town include Health Care & Social Assistance (2,349 | 12.7%), Retail Trade (2,205 | 11.9%), Educational Services (2,003 | 10.8%), Professional & Scientific (1,814 | 9.8%), and Manufacturing (1,805 | 9.7%).
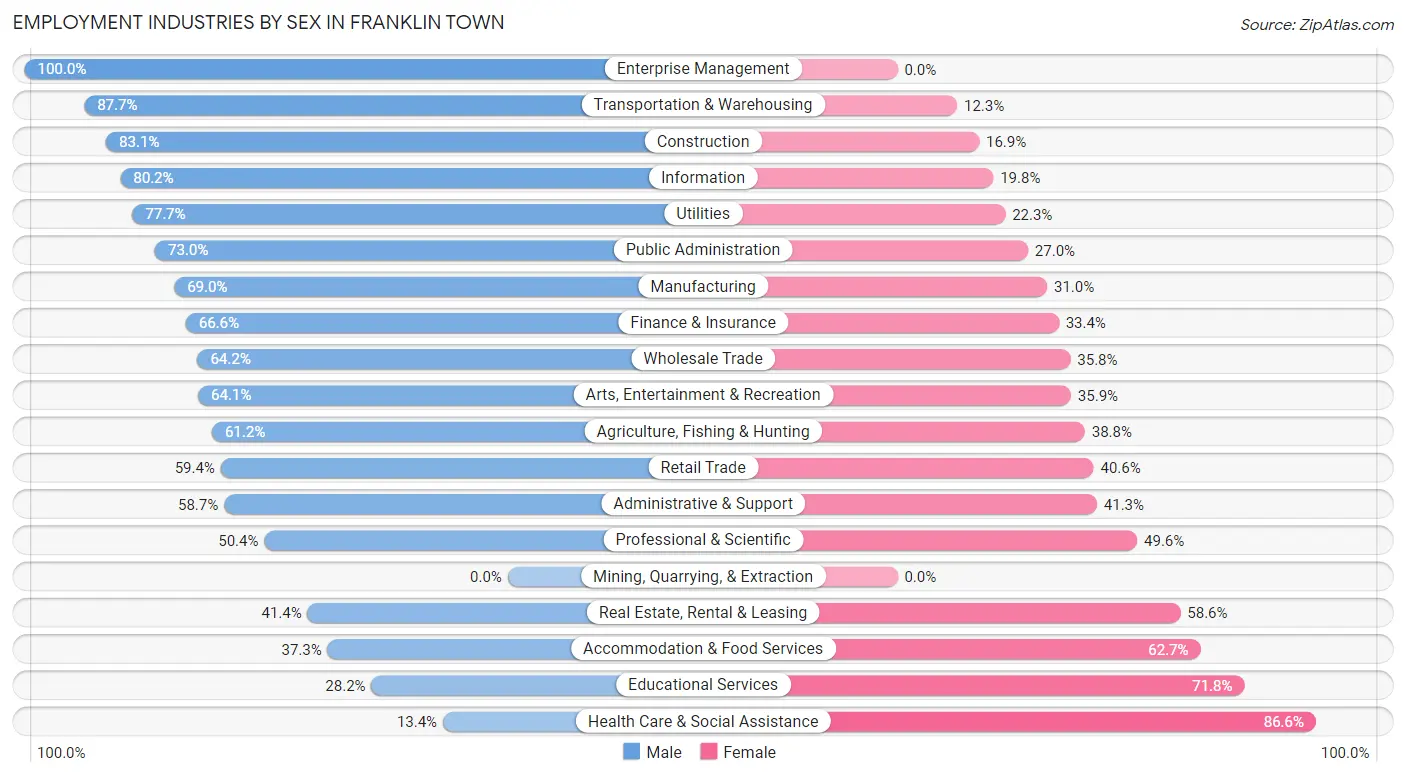
Employment Industries by Sex in Franklin Town
The Franklin Town industries that see more men than women are Enterprise Management (100.0%), Transportation & Warehousing (87.7%), and Construction (83.1%), whereas the industries that tend to have a higher number of women are Health Care & Social Assistance (86.6%), Educational Services (71.8%), and Accommodation & Food Services (62.7%).
| Industry | Male | Female |
| Agriculture, Fishing & Hunting | 71 (61.2%) | 45 (38.8%) |
| Mining, Quarrying, & Extraction | 0 (0.0%) | 0 (0.0%) |
| Construction | 940 (83.1%) | 191 (16.9%) |
| Manufacturing | 1,246 (69.0%) | 559 (31.0%) |
| Wholesale Trade | 515 (64.2%) | 287 (35.8%) |
| Retail Trade | 1,310 (59.4%) | 895 (40.6%) |
| Transportation & Warehousing | 490 (87.7%) | 69 (12.3%) |
| Utilities | 94 (77.7%) | 27 (22.3%) |
| Information | 376 (80.2%) | 93 (19.8%) |
| Finance & Insurance | 944 (66.6%) | 473 (33.4%) |
| Real Estate, Rental & Leasing | 109 (41.4%) | 154 (58.6%) |
| Professional & Scientific | 914 (50.4%) | 900 (49.6%) |
| Enterprise Management | 26 (100.0%) | 0 (0.0%) |
| Administrative & Support | 239 (58.7%) | 168 (41.3%) |
| Educational Services | 565 (28.2%) | 1,438 (71.8%) |
| Health Care & Social Assistance | 315 (13.4%) | 2,034 (86.6%) |
| Arts, Entertainment & Recreation | 357 (64.1%) | 200 (35.9%) |
| Accommodation & Food Services | 380 (37.3%) | 639 (62.7%) |
| Public Administration | 573 (73.0%) | 212 (27.0%) |
| Total | 9,703 (52.4%) | 8,823 (47.6%) |
Education in Franklin Town
School Enrollment in Franklin Town
The most common levels of schooling among the 8,863 students in Franklin Town are high school (2,475 | 27.9%), college / undergraduate (2,256 | 25.5%), and middle school (1,518 | 17.1%).
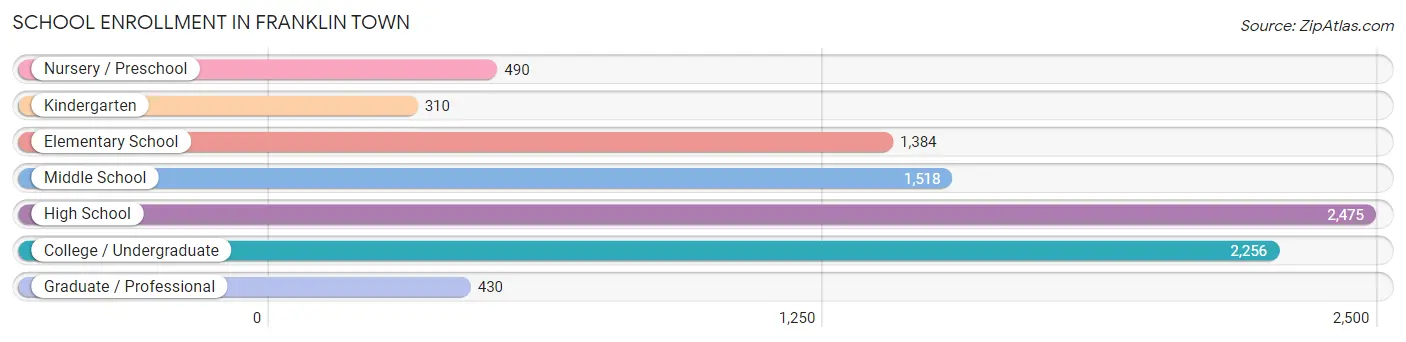
| School Level | # Students | % Students |
| Nursery / Preschool | 490 | 5.5% |
| Kindergarten | 310 | 3.5% |
| Elementary School | 1,384 | 15.6% |
| Middle School | 1,518 | 17.1% |
| High School | 2,475 | 27.9% |
| College / Undergraduate | 2,256 | 25.5% |
| Graduate / Professional | 430 | 4.9% |
| Total | 8,863 | 100.0% |
School Enrollment by Age by Funding Source in Franklin Town
Out of a total of 8,863 students who are enrolled in schools in Franklin Town, 2,694 (30.4%) attend a private institution, while the remaining 6,169 (69.6%) are enrolled in public schools. The age group of 3 to 4 year olds has the highest likelihood of being enrolled in private schools, with 243 (77.1% in the age bracket) enrolled. Conversely, the age group of 10 to 14 year olds has the lowest likelihood of being enrolled in a private school, with 2,204 (95.8% in the age bracket) attending a public institution.
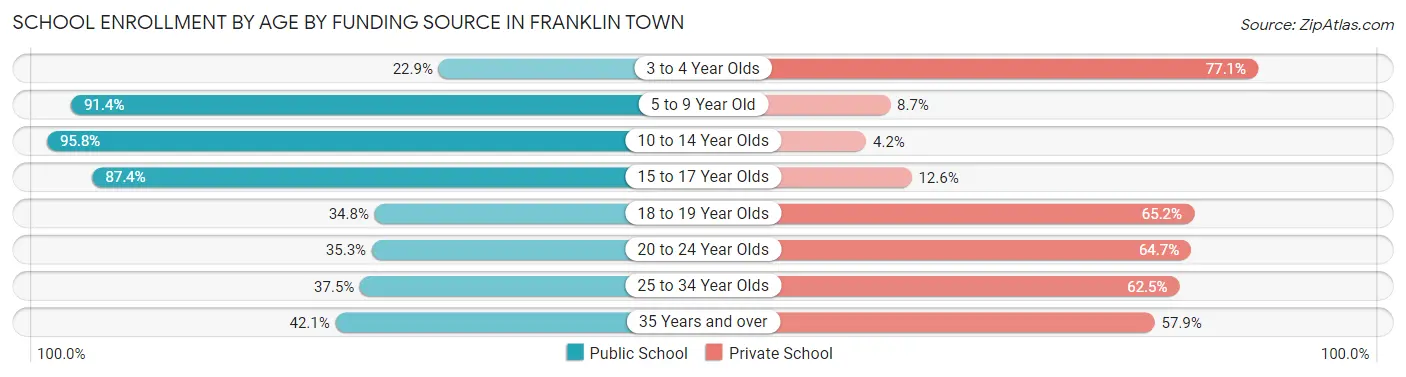
| Age Bracket | Public School | Private School |
| 3 to 4 Year Olds | 72 (22.9%) | 243 (77.1%) |
| 5 to 9 Year Old | 1,299 (91.3%) | 123 (8.6%) |
| 10 to 14 Year Olds | 2,204 (95.8%) | 96 (4.2%) |
| 15 to 17 Year Olds | 1,460 (87.4%) | 211 (12.6%) |
| 18 to 19 Year Olds | 521 (34.8%) | 977 (65.2%) |
| 20 to 24 Year Olds | 405 (35.3%) | 742 (64.7%) |
| 25 to 34 Year Olds | 87 (37.5%) | 145 (62.5%) |
| 35 Years and over | 117 (42.1%) | 161 (57.9%) |
| Total | 6,169 (69.6%) | 2,694 (30.4%) |
Educational Attainment by Field of Study in Franklin Town
Business (2,809 | 21.4%), social sciences (1,305 | 10.0%), education (1,088 | 8.3%), engineering (1,073 | 8.2%), and science & technology (1,011 | 7.7%) are the most common fields of study among 13,122 individuals in Franklin Town who have obtained a bachelor's degree or higher.
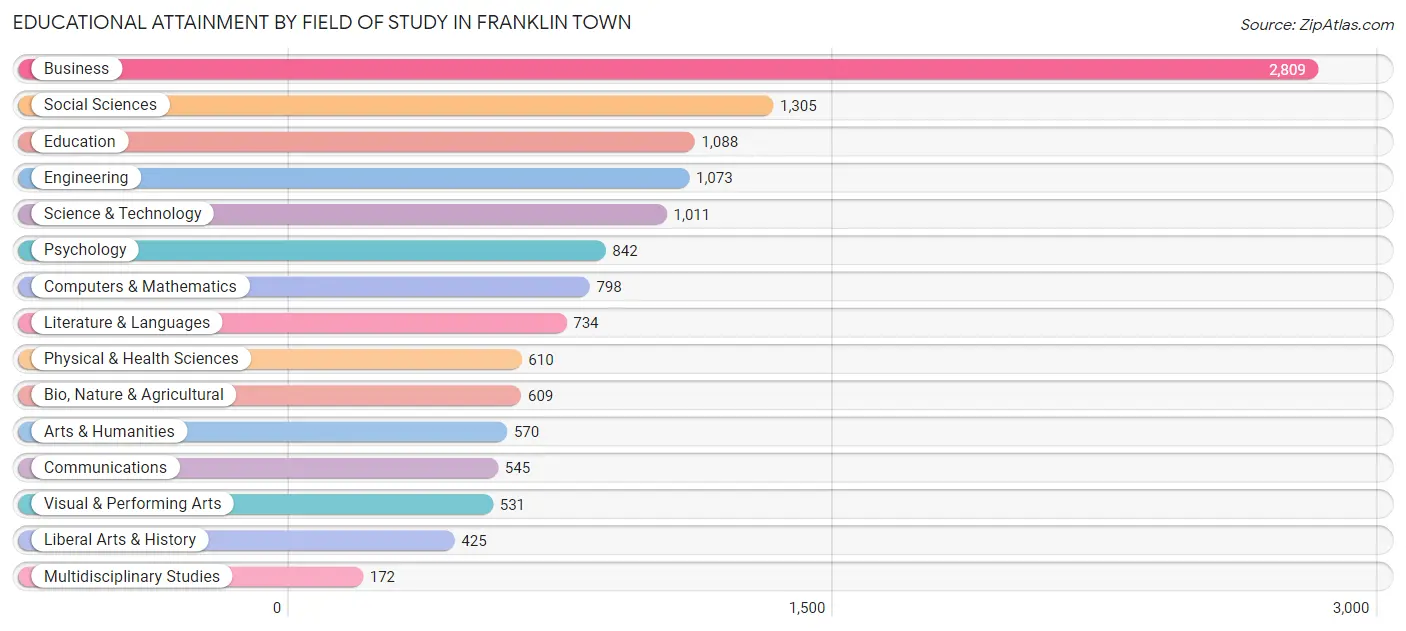
| Field of Study | # Graduates | % Graduates |
| Computers & Mathematics | 798 | 6.1% |
| Bio, Nature & Agricultural | 609 | 4.6% |
| Physical & Health Sciences | 610 | 4.6% |
| Psychology | 842 | 6.4% |
| Social Sciences | 1,305 | 10.0% |
| Engineering | 1,073 | 8.2% |
| Multidisciplinary Studies | 172 | 1.3% |
| Science & Technology | 1,011 | 7.7% |
| Business | 2,809 | 21.4% |
| Education | 1,088 | 8.3% |
| Literature & Languages | 734 | 5.6% |
| Liberal Arts & History | 425 | 3.2% |
| Visual & Performing Arts | 531 | 4.1% |
| Communications | 545 | 4.2% |
| Arts & Humanities | 570 | 4.3% |
| Total | 13,122 | 100.0% |
Transportation & Commute in Franklin Town
Vehicle Availability by Sex in Franklin Town
The most prevalent vehicle ownership categories in Franklin Town are males with 2 vehicles (4,803, accounting for 51.5%) and females with 2 vehicles (4,015, making up 57.4%).
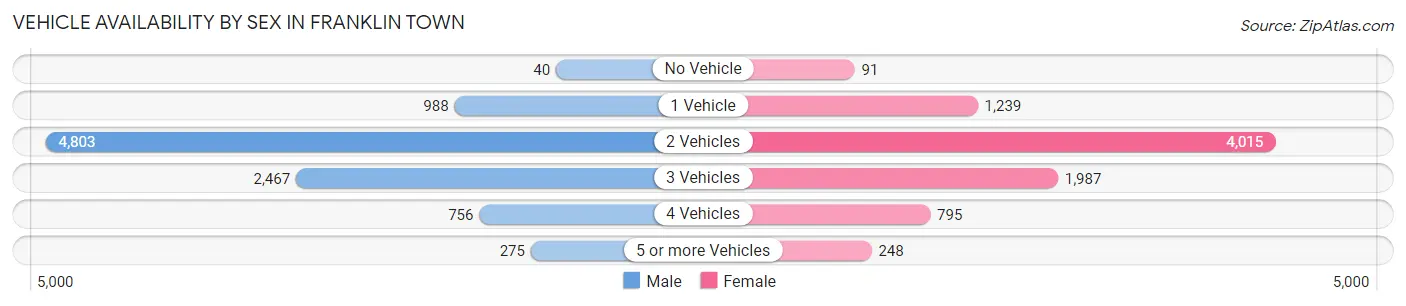
| Vehicles Available | Male | Female |
| No Vehicle | 40 (0.4%) | 91 (1.1%) |
| 1 Vehicle | 988 (10.6%) | 1,239 (14.8%) |
| 2 Vehicles | 4,803 (51.5%) | 4,015 (47.9%) |
| 3 Vehicles | 2,467 (26.4%) | 1,987 (23.7%) |
| 4 Vehicles | 756 (8.1%) | 795 (9.5%) |
| 5 or more Vehicles | 275 (2.9%) | 248 (3.0%) |
| Total | 9,329 (100.0%) | 8,375 (100.0%) |
Commute Time in Franklin Town
The most frequently occuring commute durations in Franklin Town are 45 to 59 minutes (2,487 commuters, 17.0%), 60 to 89 minutes (1,872 commuters, 12.8%), and 30 to 34 minutes (1,825 commuters, 12.4%).
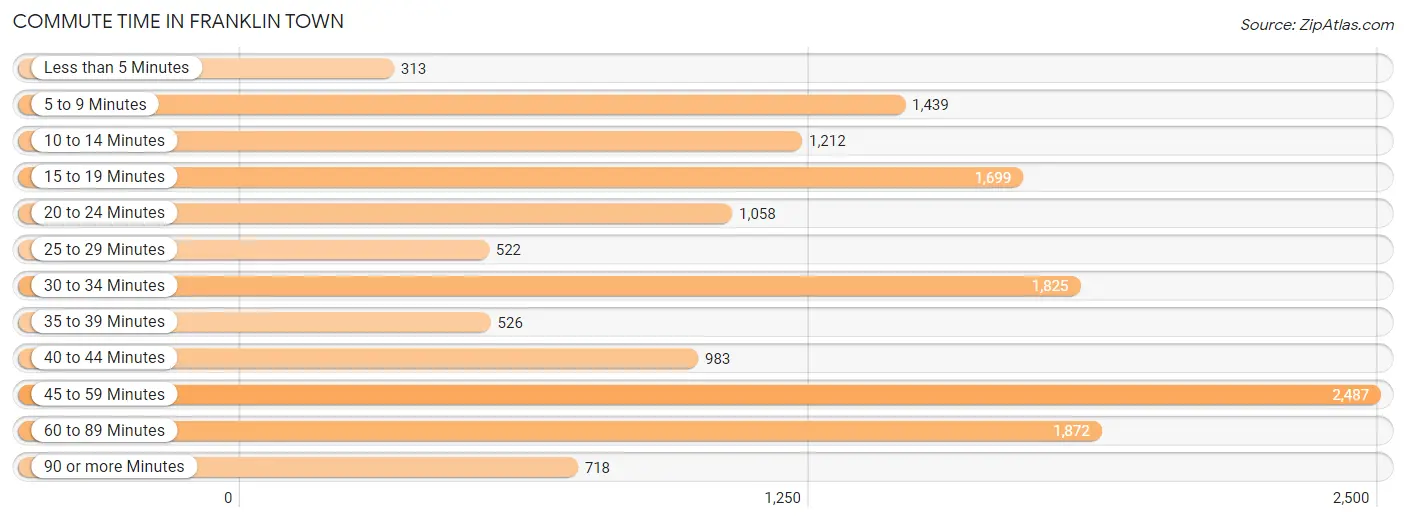
| Commute Time | # Commuters | % Commuters |
| Less than 5 Minutes | 313 | 2.1% |
| 5 to 9 Minutes | 1,439 | 9.8% |
| 10 to 14 Minutes | 1,212 | 8.3% |
| 15 to 19 Minutes | 1,699 | 11.6% |
| 20 to 24 Minutes | 1,058 | 7.2% |
| 25 to 29 Minutes | 522 | 3.6% |
| 30 to 34 Minutes | 1,825 | 12.4% |
| 35 to 39 Minutes | 526 | 3.6% |
| 40 to 44 Minutes | 983 | 6.7% |
| 45 to 59 Minutes | 2,487 | 17.0% |
| 60 to 89 Minutes | 1,872 | 12.8% |
| 90 or more Minutes | 718 | 4.9% |
Commute Time by Sex in Franklin Town
The most common commute times in Franklin Town are 45 to 59 minutes (1,466 commuters, 19.1%) for males and 45 to 59 minutes (1,021 commuters, 14.6%) for females.
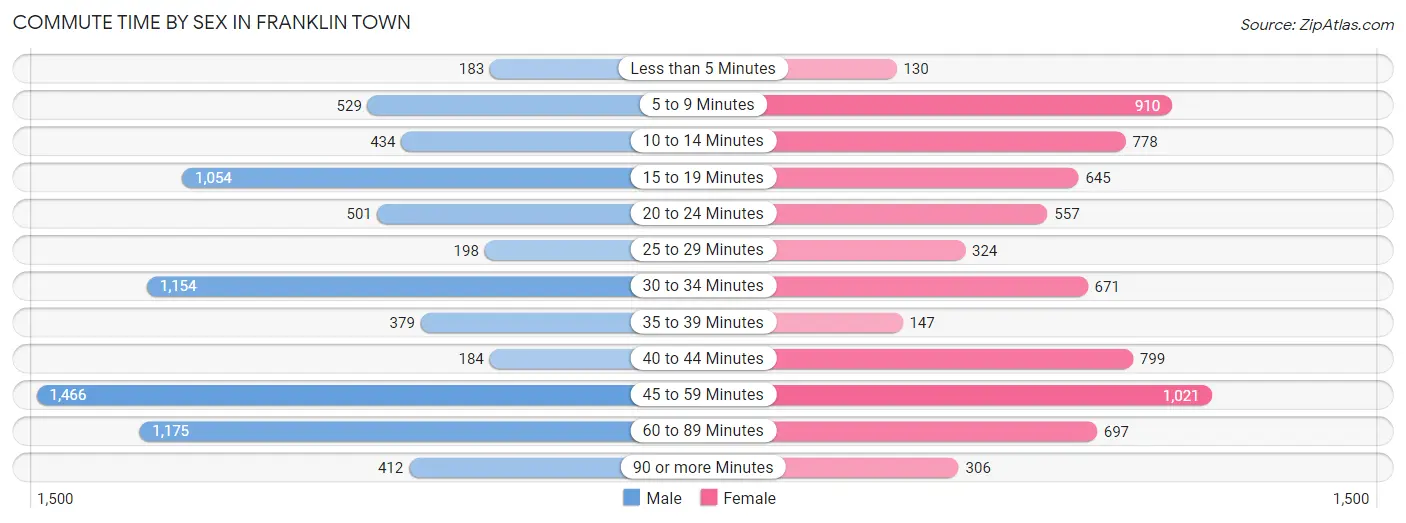
| Commute Time | Male | Female |
| Less than 5 Minutes | 183 (2.4%) | 130 (1.9%) |
| 5 to 9 Minutes | 529 (6.9%) | 910 (13.0%) |
| 10 to 14 Minutes | 434 (5.7%) | 778 (11.1%) |
| 15 to 19 Minutes | 1,054 (13.7%) | 645 (9.2%) |
| 20 to 24 Minutes | 501 (6.5%) | 557 (8.0%) |
| 25 to 29 Minutes | 198 (2.6%) | 324 (4.6%) |
| 30 to 34 Minutes | 1,154 (15.0%) | 671 (9.6%) |
| 35 to 39 Minutes | 379 (4.9%) | 147 (2.1%) |
| 40 to 44 Minutes | 184 (2.4%) | 799 (11.4%) |
| 45 to 59 Minutes | 1,466 (19.1%) | 1,021 (14.6%) |
| 60 to 89 Minutes | 1,175 (15.3%) | 697 (10.0%) |
| 90 or more Minutes | 412 (5.4%) | 306 (4.4%) |
Time of Departure to Work by Sex in Franklin Town
The most frequent times of departure to work in Franklin Town are 7:00 AM to 7:29 AM (1,391, 18.1%) for males and 8:00 AM to 8:29 AM (1,524, 21.8%) for females.
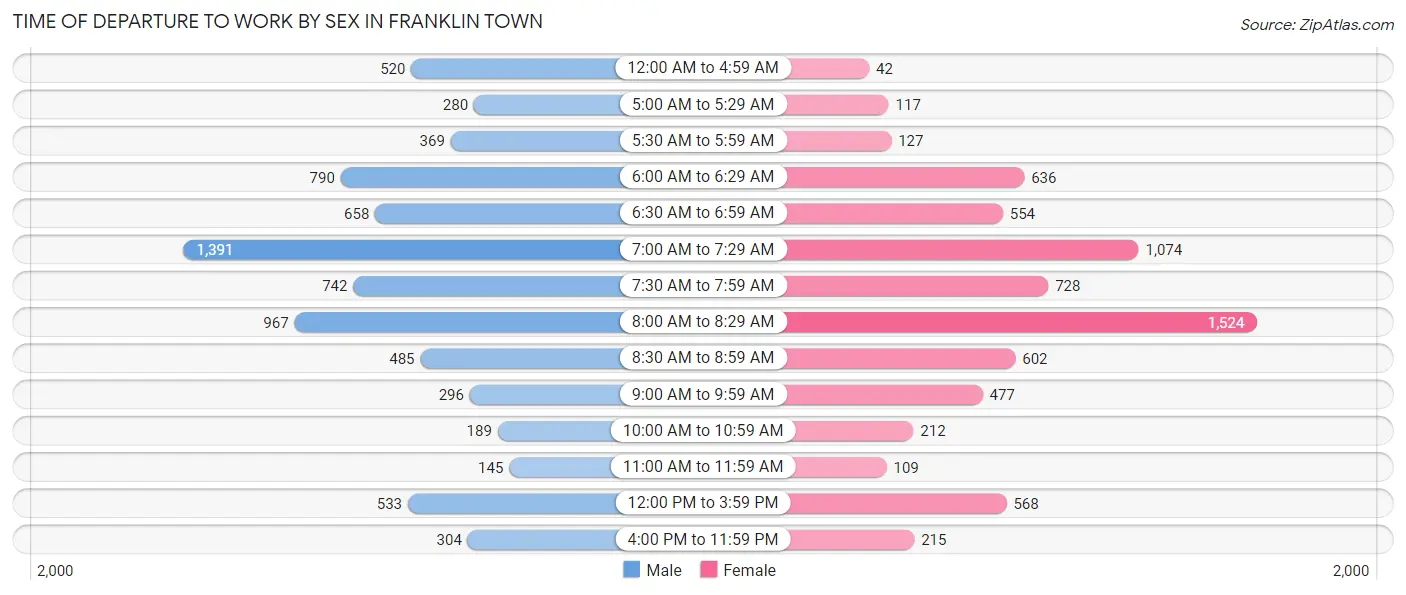
| Time of Departure | Male | Female |
| 12:00 AM to 4:59 AM | 520 (6.8%) | 42 (0.6%) |
| 5:00 AM to 5:29 AM | 280 (3.6%) | 117 (1.7%) |
| 5:30 AM to 5:59 AM | 369 (4.8%) | 127 (1.8%) |
| 6:00 AM to 6:29 AM | 790 (10.3%) | 636 (9.1%) |
| 6:30 AM to 6:59 AM | 658 (8.6%) | 554 (7.9%) |
| 7:00 AM to 7:29 AM | 1,391 (18.1%) | 1,074 (15.4%) |
| 7:30 AM to 7:59 AM | 742 (9.7%) | 728 (10.4%) |
| 8:00 AM to 8:29 AM | 967 (12.6%) | 1,524 (21.8%) |
| 8:30 AM to 8:59 AM | 485 (6.3%) | 602 (8.6%) |
| 9:00 AM to 9:59 AM | 296 (3.9%) | 477 (6.8%) |
| 10:00 AM to 10:59 AM | 189 (2.5%) | 212 (3.0%) |
| 11:00 AM to 11:59 AM | 145 (1.9%) | 109 (1.6%) |
| 12:00 PM to 3:59 PM | 533 (7.0%) | 568 (8.1%) |
| 4:00 PM to 11:59 PM | 304 (4.0%) | 215 (3.1%) |
| Total | 7,669 (100.0%) | 6,985 (100.0%) |
Housing Occupancy in Franklin Town
Occupancy by Ownership in Franklin Town
Of the total 12,131 dwellings in Franklin Town, owner-occupied units account for 9,604 (79.2%), while renter-occupied units make up 2,527 (20.8%).
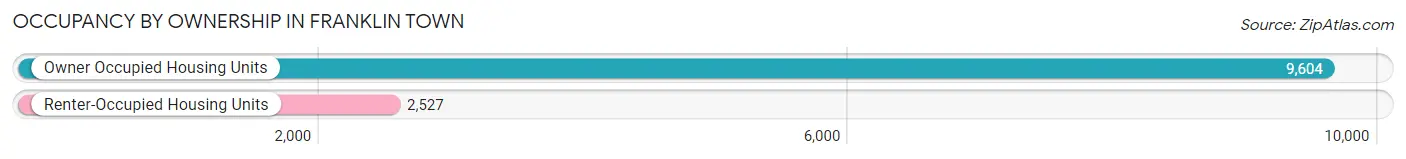
| Occupancy | # Housing Units | % Housing Units |
| Owner Occupied Housing Units | 9,604 | 79.2% |
| Renter-Occupied Housing Units | 2,527 | 20.8% |
| Total Occupied Housing Units | 12,131 | 100.0% |
Occupancy by Household Size in Franklin Town
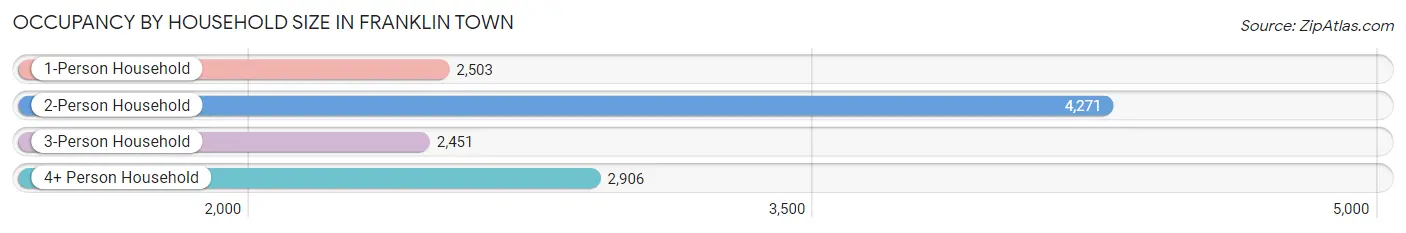
| Household Size | # Housing Units | % Housing Units |
| 1-Person Household | 2,503 | 20.6% |
| 2-Person Household | 4,271 | 35.2% |
| 3-Person Household | 2,451 | 20.2% |
| 4+ Person Household | 2,906 | 24.0% |
| Total Housing Units | 12,131 | 100.0% |
Occupancy by Ownership by Household Size in Franklin Town
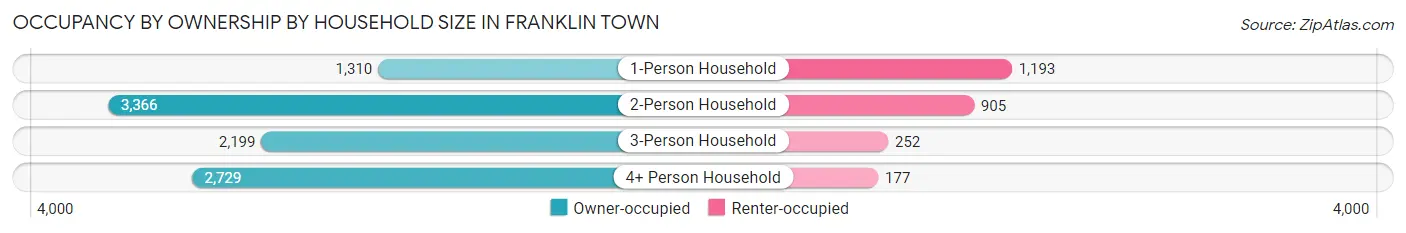
| Household Size | Owner-occupied | Renter-occupied |
| 1-Person Household | 1,310 (52.3%) | 1,193 (47.7%) |
| 2-Person Household | 3,366 (78.8%) | 905 (21.2%) |
| 3-Person Household | 2,199 (89.7%) | 252 (10.3%) |
| 4+ Person Household | 2,729 (93.9%) | 177 (6.1%) |
| Total Housing Units | 9,604 (79.2%) | 2,527 (20.8%) |
Occupancy by Educational Attainment in Franklin Town
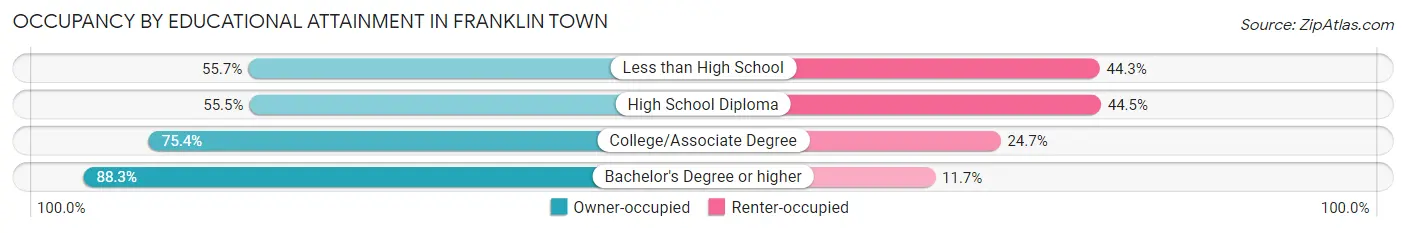
| Household Size | Owner-occupied | Renter-occupied |
| Less than High School | 127 (55.7%) | 101 (44.3%) |
| High School Diploma | 1,113 (55.5%) | 894 (44.5%) |
| College/Associate Degree | 2,179 (75.3%) | 713 (24.6%) |
| Bachelor's Degree or higher | 6,185 (88.3%) | 819 (11.7%) |
Occupancy by Age of Householder in Franklin Town
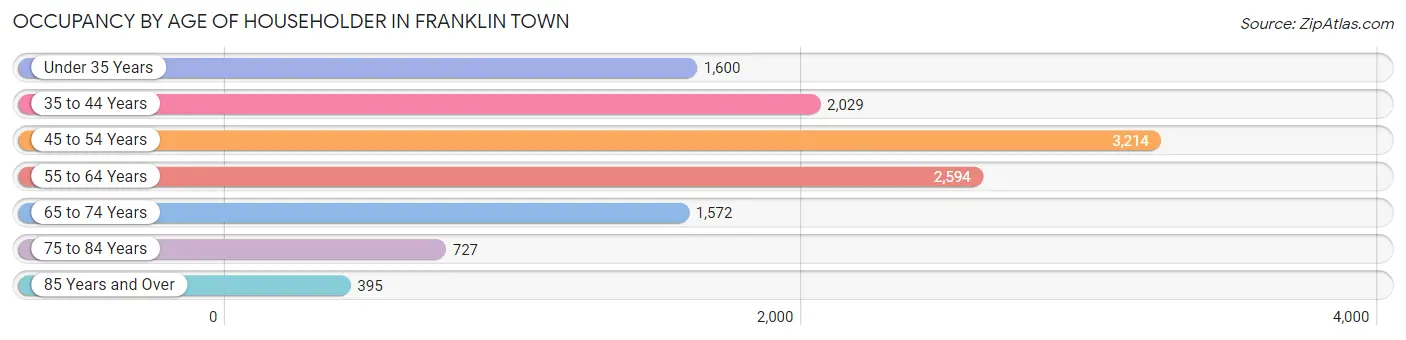
| Age Bracket | # Households | % Households |
| Under 35 Years | 1,600 | 13.2% |
| 35 to 44 Years | 2,029 | 16.7% |
| 45 to 54 Years | 3,214 | 26.5% |
| 55 to 64 Years | 2,594 | 21.4% |
| 65 to 74 Years | 1,572 | 13.0% |
| 75 to 84 Years | 727 | 6.0% |
| 85 Years and Over | 395 | 3.3% |
| Total | 12,131 | 100.0% |
Housing Finances in Franklin Town
Median Income by Occupancy in Franklin Town
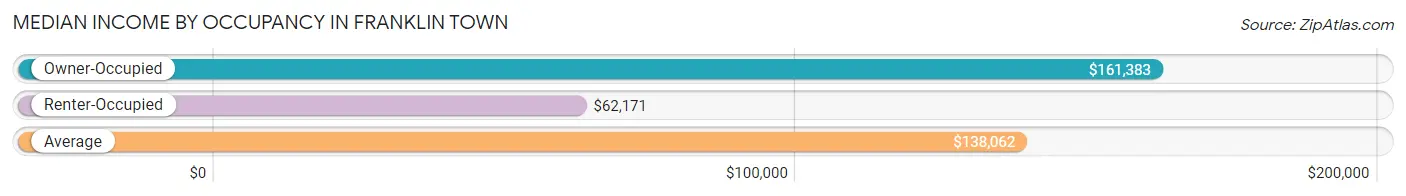
| Occupancy Type | # Households | Median Income |
| Owner-Occupied | 9,604 (79.2%) | $161,383 |
| Renter-Occupied | 2,527 (20.8%) | $62,171 |
| Average | 12,131 (100.0%) | $138,062 |
Occupancy by Householder Income Bracket in Franklin Town
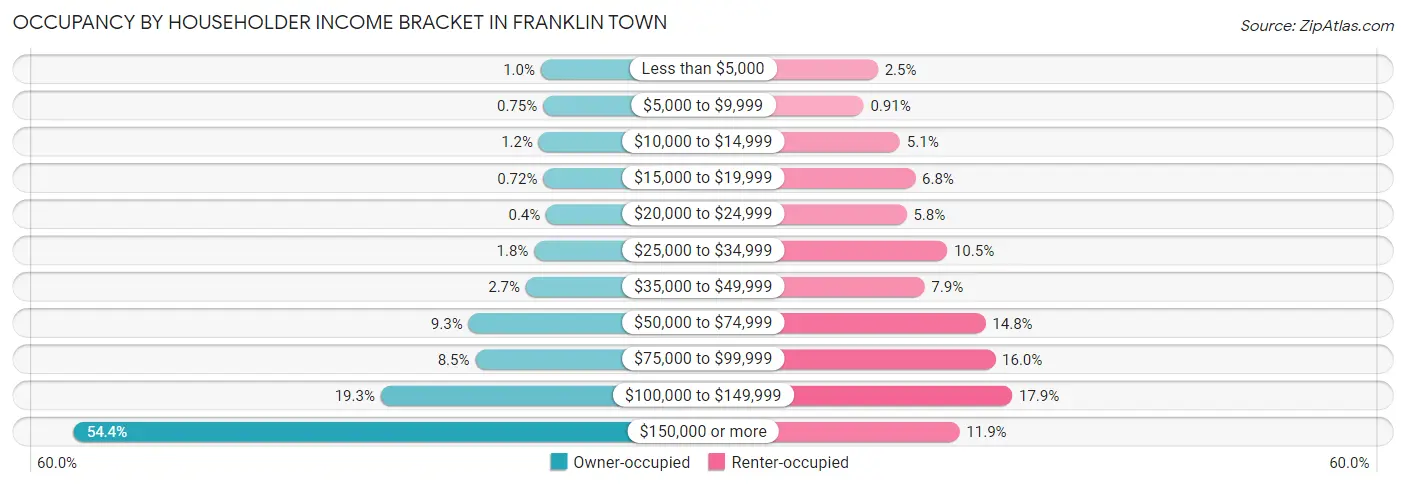
| Income Bracket | Owner-occupied | Renter-occupied |
| Less than $5,000 | 97 (1.0%) | 64 (2.5%) |
| $5,000 to $9,999 | 72 (0.7%) | 23 (0.9%) |
| $10,000 to $14,999 | 118 (1.2%) | 128 (5.1%) |
| $15,000 to $19,999 | 69 (0.7%) | 172 (6.8%) |
| $20,000 to $24,999 | 38 (0.4%) | 147 (5.8%) |
| $25,000 to $34,999 | 169 (1.8%) | 264 (10.4%) |
| $35,000 to $49,999 | 260 (2.7%) | 199 (7.9%) |
| $50,000 to $74,999 | 890 (9.3%) | 375 (14.8%) |
| $75,000 to $99,999 | 815 (8.5%) | 403 (16.0%) |
| $100,000 to $149,999 | 1,854 (19.3%) | 452 (17.9%) |
| $150,000 or more | 5,222 (54.4%) | 300 (11.9%) |
| Total | 9,604 (100.0%) | 2,527 (100.0%) |
Monthly Housing Cost Tiers in Franklin Town
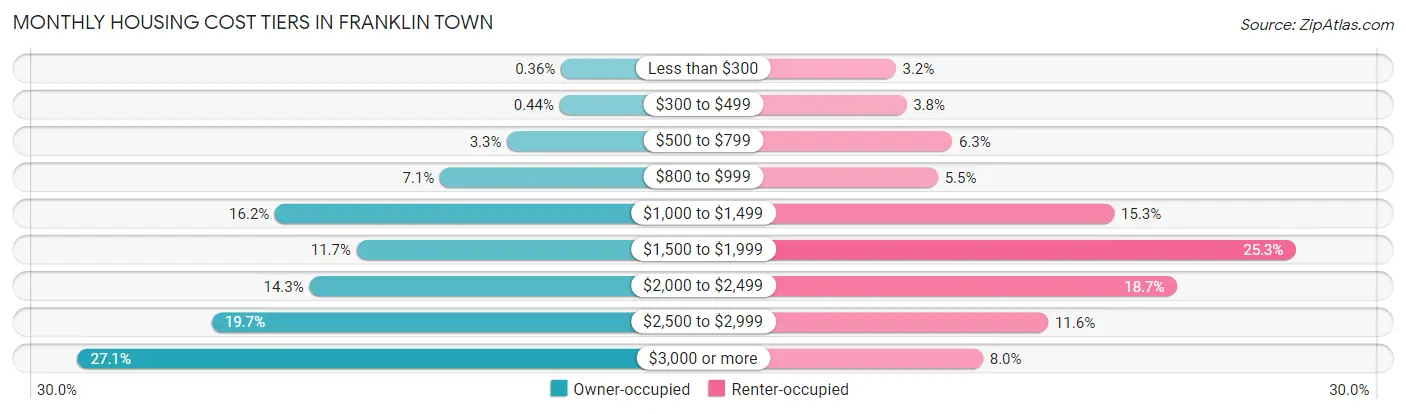
| Monthly Cost | Owner-occupied | Renter-occupied |
| Less than $300 | 35 (0.4%) | 81 (3.2%) |
| $300 to $499 | 42 (0.4%) | 96 (3.8%) |
| $500 to $799 | 321 (3.3%) | 160 (6.3%) |
| $800 to $999 | 677 (7.0%) | 140 (5.5%) |
| $1,000 to $1,499 | 1,552 (16.2%) | 386 (15.3%) |
| $1,500 to $1,999 | 1,119 (11.7%) | 639 (25.3%) |
| $2,000 to $2,499 | 1,370 (14.3%) | 473 (18.7%) |
| $2,500 to $2,999 | 1,888 (19.7%) | 294 (11.6%) |
| $3,000 or more | 2,600 (27.1%) | 203 (8.0%) |
| Total | 9,604 (100.0%) | 2,527 (100.0%) |
Physical Housing Characteristics in Franklin Town
Housing Structures in Franklin Town
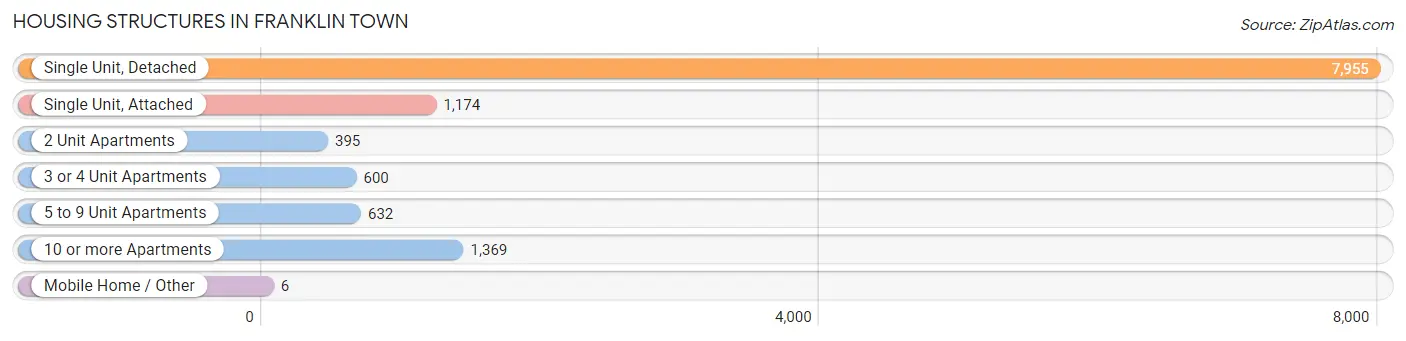
| Structure Type | # Housing Units | % Housing Units |
| Single Unit, Detached | 7,955 | 65.6% |
| Single Unit, Attached | 1,174 | 9.7% |
| 2 Unit Apartments | 395 | 3.3% |
| 3 or 4 Unit Apartments | 600 | 5.0% |
| 5 to 9 Unit Apartments | 632 | 5.2% |
| 10 or more Apartments | 1,369 | 11.3% |
| Mobile Home / Other | 6 | 0.1% |
| Total | 12,131 | 100.0% |
Housing Structures by Occupancy in Franklin Town
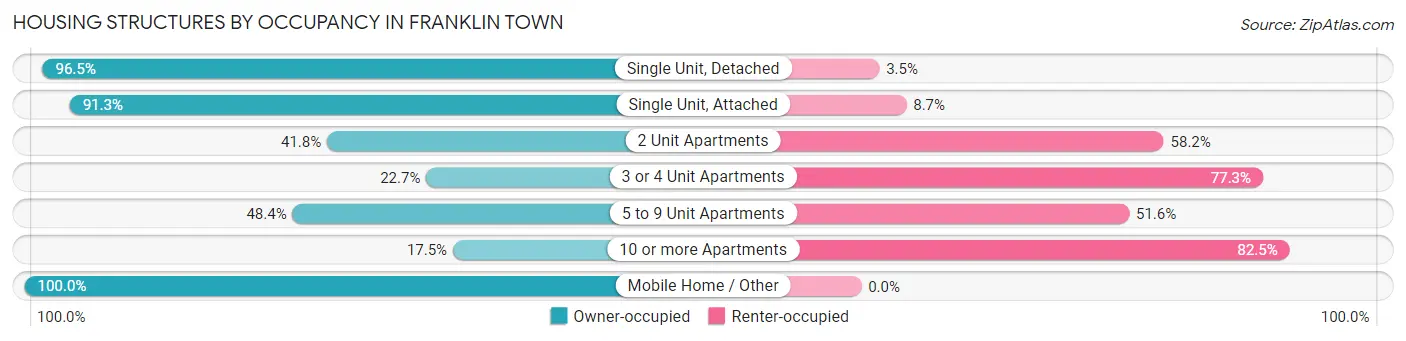
| Structure Type | Owner-occupied | Renter-occupied |
| Single Unit, Detached | 7,679 (96.5%) | 276 (3.5%) |
| Single Unit, Attached | 1,072 (91.3%) | 102 (8.7%) |
| 2 Unit Apartments | 165 (41.8%) | 230 (58.2%) |
| 3 or 4 Unit Apartments | 136 (22.7%) | 464 (77.3%) |
| 5 to 9 Unit Apartments | 306 (48.4%) | 326 (51.6%) |
| 10 or more Apartments | 240 (17.5%) | 1,129 (82.5%) |
| Mobile Home / Other | 6 (100.0%) | 0 (0.0%) |
| Total | 9,604 (79.2%) | 2,527 (20.8%) |
Housing Structures by Number of Rooms in Franklin Town
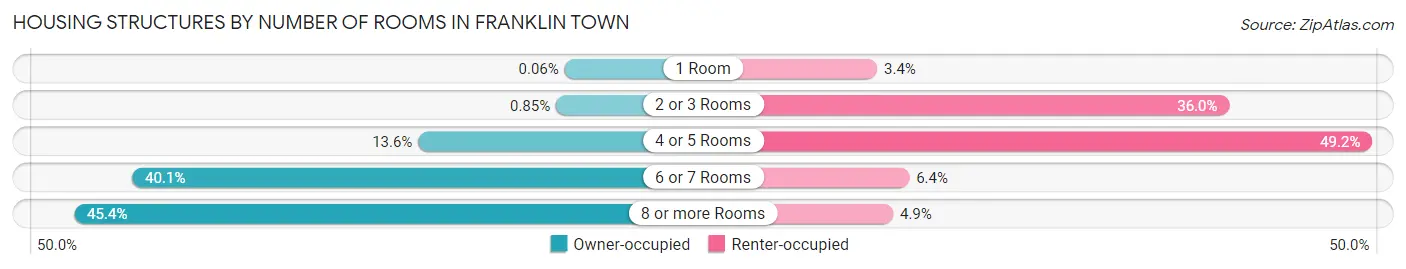
| Number of Rooms | Owner-occupied | Renter-occupied |
| 1 Room | 6 (0.1%) | 87 (3.4%) |
| 2 or 3 Rooms | 82 (0.9%) | 910 (36.0%) |
| 4 or 5 Rooms | 1,306 (13.6%) | 1,244 (49.2%) |
| 6 or 7 Rooms | 3,847 (40.1%) | 162 (6.4%) |
| 8 or more Rooms | 4,363 (45.4%) | 124 (4.9%) |
| Total | 9,604 (100.0%) | 2,527 (100.0%) |
Housing Structure by Heating Type in Franklin Town
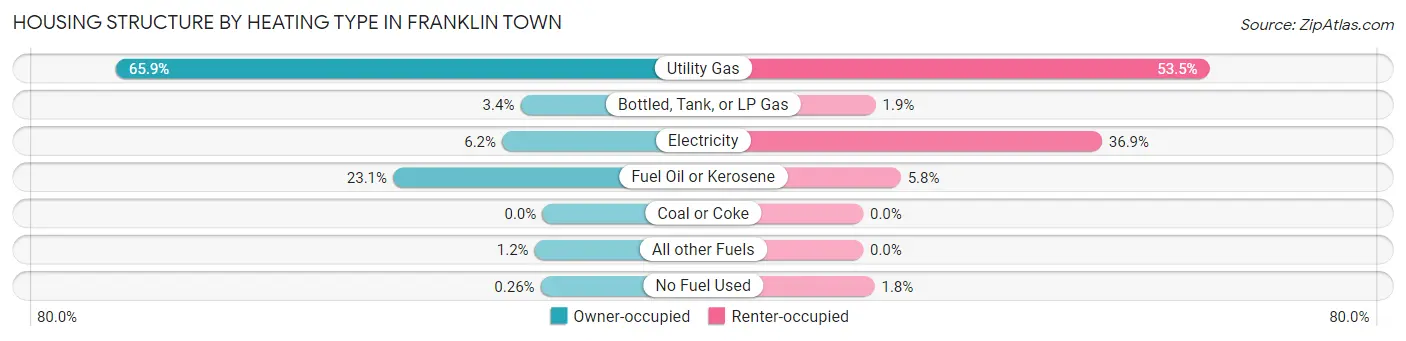
| Heating Type | Owner-occupied | Renter-occupied |
| Utility Gas | 6,327 (65.9%) | 1,353 (53.5%) |
| Bottled, Tank, or LP Gas | 325 (3.4%) | 49 (1.9%) |
| Electricity | 597 (6.2%) | 933 (36.9%) |
| Fuel Oil or Kerosene | 2,216 (23.1%) | 147 (5.8%) |
| Coal or Coke | 0 (0.0%) | 0 (0.0%) |
| All other Fuels | 114 (1.2%) | 0 (0.0%) |
| No Fuel Used | 25 (0.3%) | 45 (1.8%) |
| Total | 9,604 (100.0%) | 2,527 (100.0%) |
Household Vehicle Usage in Franklin Town
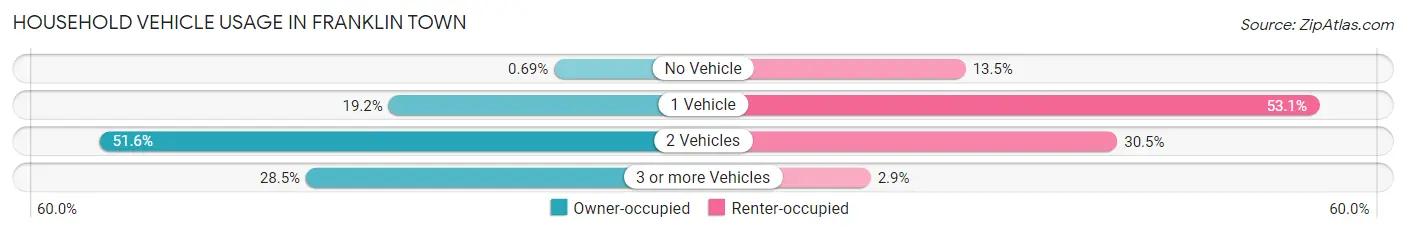
| Vehicles per Household | Owner-occupied | Renter-occupied |
| No Vehicle | 66 (0.7%) | 342 (13.5%) |
| 1 Vehicle | 1,847 (19.2%) | 1,341 (53.1%) |
| 2 Vehicles | 4,955 (51.6%) | 771 (30.5%) |
| 3 or more Vehicles | 2,736 (28.5%) | 73 (2.9%) |
| Total | 9,604 (100.0%) | 2,527 (100.0%) |
Real Estate & Mortgages in Franklin Town
Real Estate and Mortgage Overview in Franklin Town
| Characteristic | Without Mortgage | With Mortgage |
| Housing Units | 2,391 | 7,213 |
| Median Property Value | $499,900 | $522,000 |
| Median Household Income | $115,203 | $4,257 |
| Monthly Housing Costs | $1,087 | $2,588 |
| Real Estate Taxes | $6,278 | $204 |
Property Value by Mortgage Status in Franklin Town
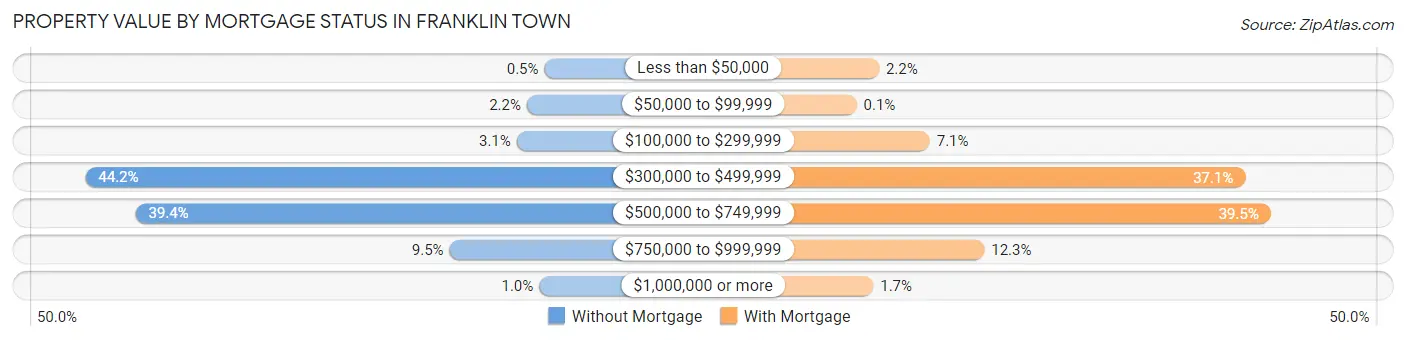
| Property Value | Without Mortgage | With Mortgage |
| Less than $50,000 | 12 (0.5%) | 161 (2.2%) |
| $50,000 to $99,999 | 52 (2.2%) | 7 (0.1%) |
| $100,000 to $299,999 | 75 (3.1%) | 510 (7.1%) |
| $300,000 to $499,999 | 1,057 (44.2%) | 2,677 (37.1%) |
| $500,000 to $749,999 | 943 (39.4%) | 2,852 (39.5%) |
| $750,000 to $999,999 | 228 (9.5%) | 884 (12.3%) |
| $1,000,000 or more | 24 (1.0%) | 122 (1.7%) |
| Total | 2,391 (100.0%) | 7,213 (100.0%) |
Household Income by Mortgage Status in Franklin Town
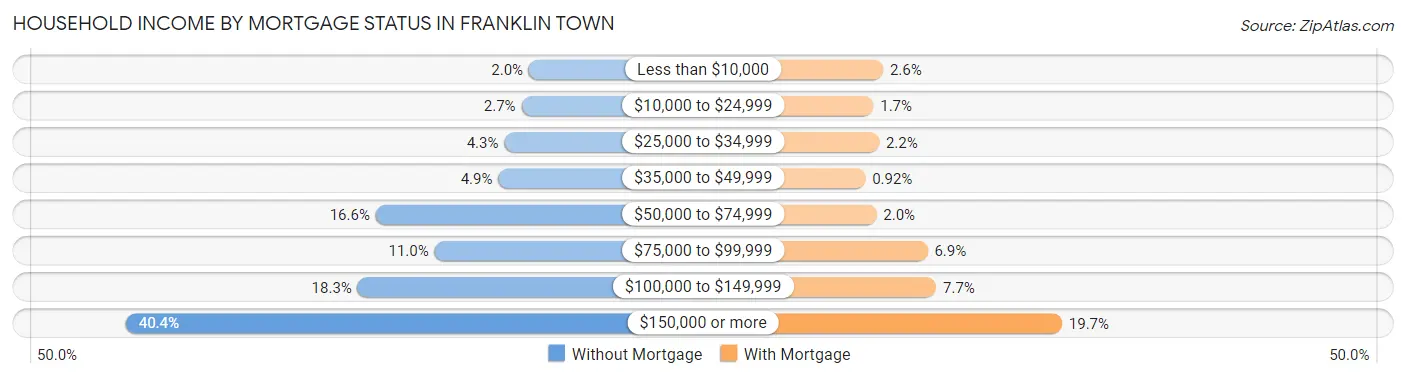
| Household Income | Without Mortgage | With Mortgage |
| Less than $10,000 | 47 (2.0%) | 188 (2.6%) |
| $10,000 to $24,999 | 64 (2.7%) | 122 (1.7%) |
| $25,000 to $34,999 | 103 (4.3%) | 161 (2.2%) |
| $35,000 to $49,999 | 117 (4.9%) | 66 (0.9%) |
| $50,000 to $74,999 | 396 (16.6%) | 143 (2.0%) |
| $75,000 to $99,999 | 262 (11.0%) | 494 (6.9%) |
| $100,000 to $149,999 | 437 (18.3%) | 553 (7.7%) |
| $150,000 or more | 965 (40.4%) | 1,417 (19.7%) |
| Total | 2,391 (100.0%) | 7,213 (100.0%) |
Property Value to Household Income Ratio in Franklin Town
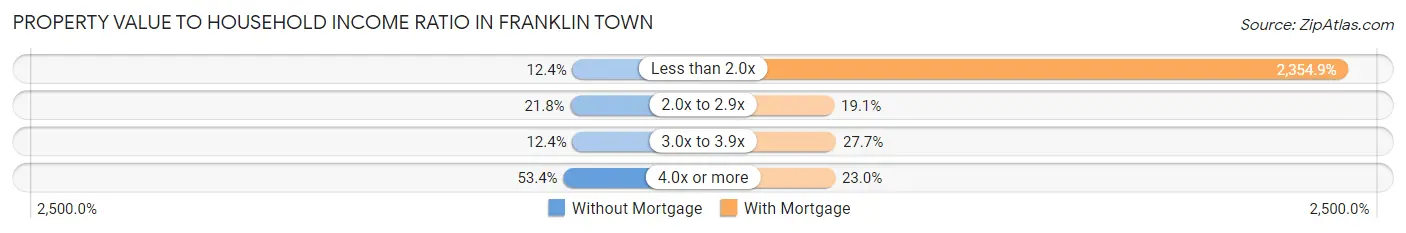
| Value-to-Income Ratio | Without Mortgage | With Mortgage |
| Less than 2.0x | 297 (12.4%) | 169,857 (2,354.9%) |
| 2.0x to 2.9x | 520 (21.7%) | 1,376 (19.1%) |
| 3.0x to 3.9x | 297 (12.4%) | 2,000 (27.7%) |
| 4.0x or more | 1,277 (53.4%) | 1,661 (23.0%) |
| Total | 2,391 (100.0%) | 7,213 (100.0%) |
Real Estate Taxes by Mortgage Status in Franklin Town
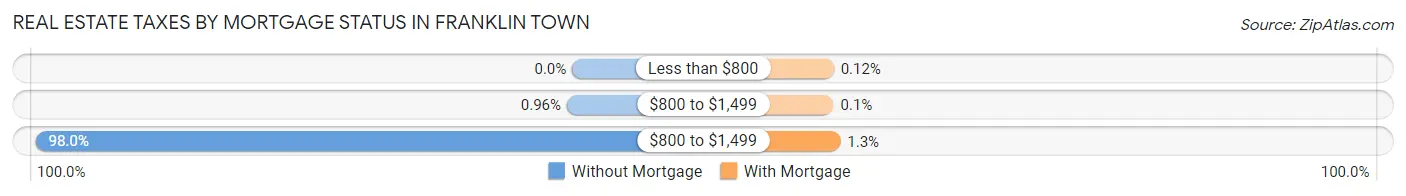
| Property Taxes | Without Mortgage | With Mortgage |
| Less than $800 | 0 (0.0%) | 9 (0.1%) |
| $800 to $1,499 | 23 (1.0%) | 7 (0.1%) |
| $800 to $1,499 | 2,343 (98.0%) | 96 (1.3%) |
| Total | 2,391 (100.0%) | 7,213 (100.0%) |
Health & Disability in Franklin Town
Health Insurance Coverage by Age in Franklin Town
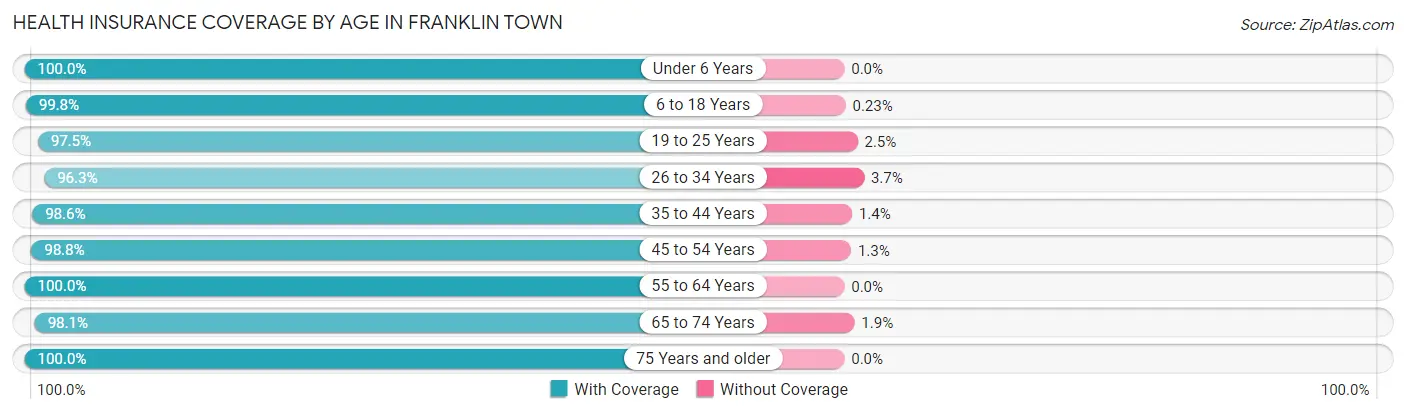
| Age Bracket | With Coverage | Without Coverage |
| Under 6 Years | 1,478 (100.0%) | 0 (0.0%) |
| 6 to 18 Years | 6,048 (99.8%) | 14 (0.2%) |
| 19 to 25 Years | 3,086 (97.5%) | 78 (2.5%) |
| 26 to 34 Years | 3,151 (96.3%) | 120 (3.7%) |
| 35 to 44 Years | 3,724 (98.6%) | 54 (1.4%) |
| 45 to 54 Years | 5,761 (98.8%) | 73 (1.3%) |
| 55 to 64 Years | 4,735 (100.0%) | 0 (0.0%) |
| 65 to 74 Years | 2,695 (98.1%) | 52 (1.9%) |
| 75 Years and older | 1,619 (100.0%) | 0 (0.0%) |
| Total | 32,297 (98.8%) | 391 (1.2%) |
Health Insurance Coverage by Citizenship Status in Franklin Town
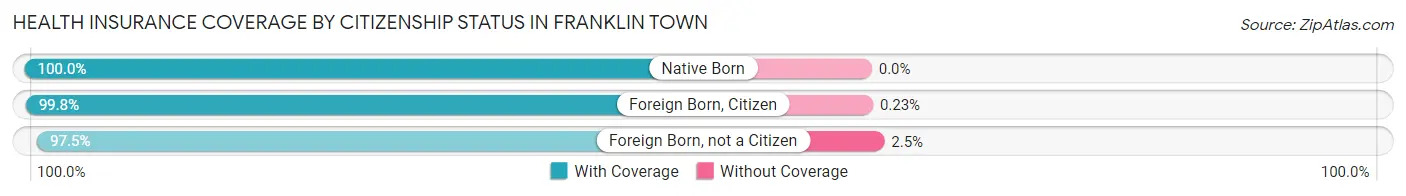
| Citizenship Status | With Coverage | Without Coverage |
| Native Born | 1,478 (100.0%) | 0 (0.0%) |
| Foreign Born, Citizen | 6,048 (99.8%) | 14 (0.2%) |
| Foreign Born, not a Citizen | 3,086 (97.5%) | 78 (2.5%) |
Health Insurance Coverage by Household Income in Franklin Town
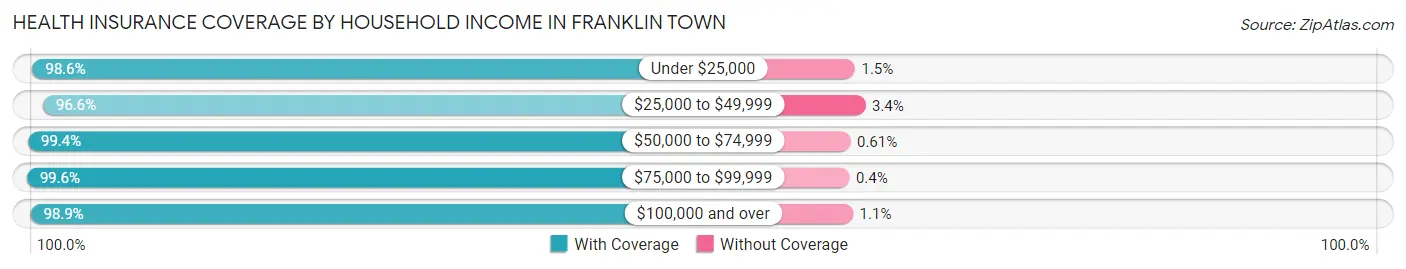
| Household Income | With Coverage | Without Coverage |
| Under $25,000 | 1,364 (98.6%) | 20 (1.5%) |
| $25,000 to $49,999 | 1,354 (96.6%) | 48 (3.4%) |
| $50,000 to $74,999 | 2,270 (99.4%) | 14 (0.6%) |
| $75,000 to $99,999 | 2,508 (99.6%) | 10 (0.4%) |
| $100,000 and over | 23,865 (98.9%) | 265 (1.1%) |
Public vs Private Health Insurance Coverage by Age in Franklin Town
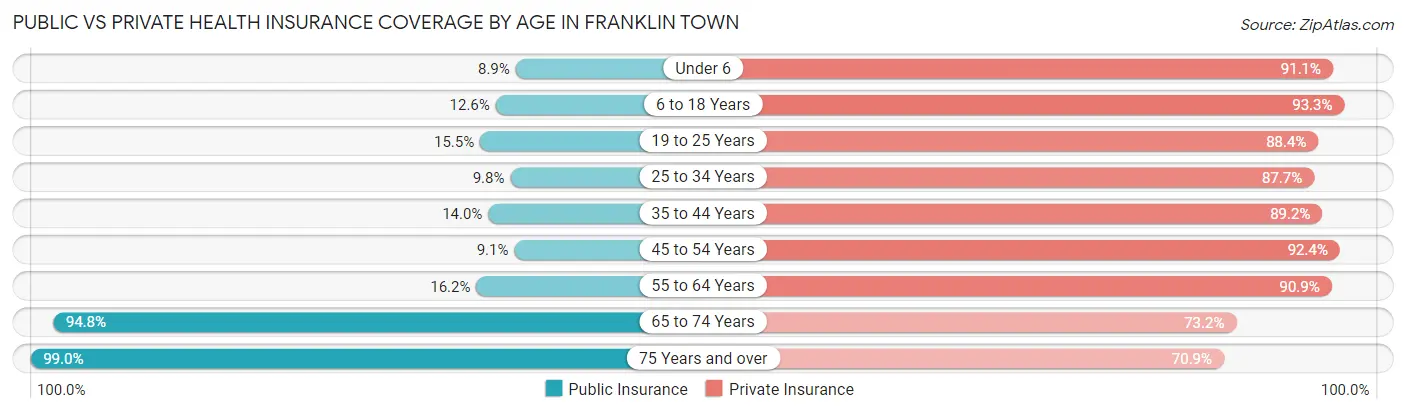
| Age Bracket | Public Insurance | Private Insurance |
| Under 6 | 131 (8.9%) | 1,347 (91.1%) |
| 6 to 18 Years | 762 (12.6%) | 5,654 (93.3%) |
| 19 to 25 Years | 489 (15.5%) | 2,798 (88.4%) |
| 25 to 34 Years | 322 (9.8%) | 2,867 (87.6%) |
| 35 to 44 Years | 527 (14.0%) | 3,369 (89.2%) |
| 45 to 54 Years | 531 (9.1%) | 5,392 (92.4%) |
| 55 to 64 Years | 765 (16.2%) | 4,304 (90.9%) |
| 65 to 74 Years | 2,603 (94.8%) | 2,011 (73.2%) |
| 75 Years and over | 1,602 (99.0%) | 1,148 (70.9%) |
| Total | 7,732 (23.6%) | 28,890 (88.4%) |
Disability Status by Sex by Age in Franklin Town
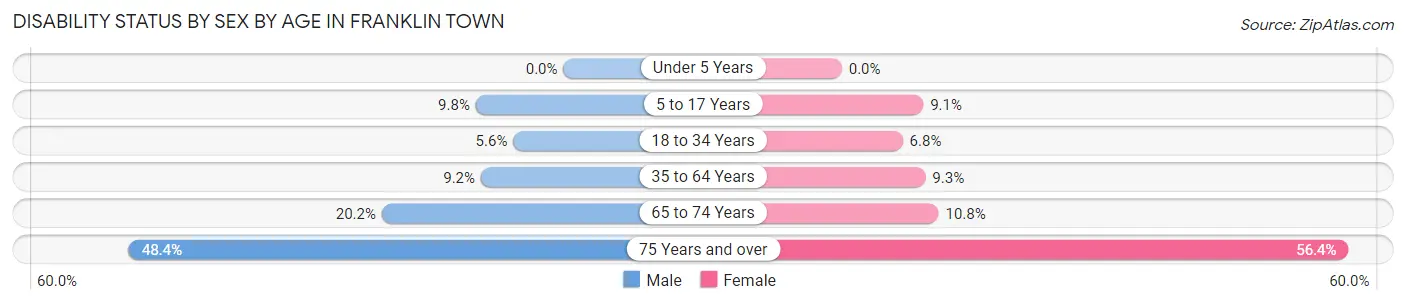
| Age Bracket | Male | Female |
| Under 5 Years | 0 (0.0%) | 0 (0.0%) |
| 5 to 17 Years | 248 (9.8%) | 264 (9.1%) |
| 18 to 34 Years | 207 (5.6%) | 244 (6.8%) |
| 35 to 64 Years | 647 (9.2%) | 680 (9.3%) |
| 65 to 74 Years | 244 (20.2%) | 166 (10.8%) |
| 75 Years and over | 285 (48.4%) | 581 (56.4%) |
Disability Class by Sex by Age in Franklin Town
Disability Class: Hearing Difficulty
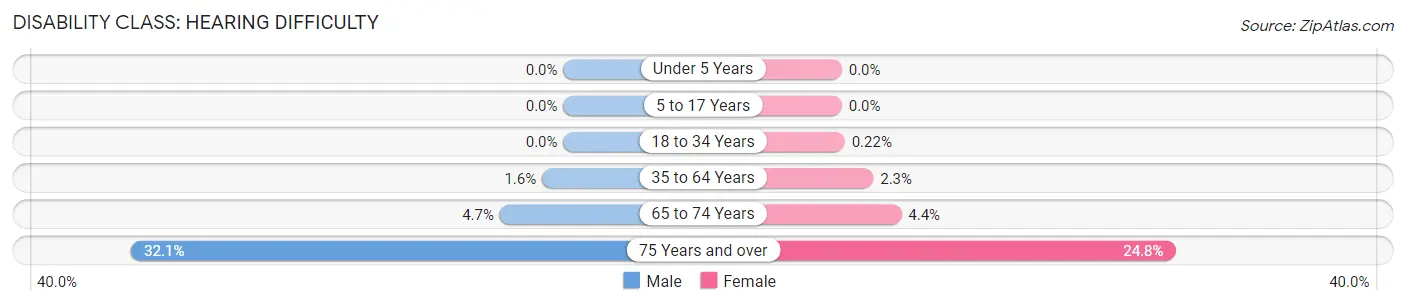
| Age Bracket | Male | Female |
| Under 5 Years | 0 (0.0%) | 0 (0.0%) |
| 5 to 17 Years | 0 (0.0%) | 0 (0.0%) |
| 18 to 34 Years | 0 (0.0%) | 8 (0.2%) |
| 35 to 64 Years | 111 (1.6%) | 171 (2.3%) |
| 65 to 74 Years | 57 (4.7%) | 68 (4.4%) |
| 75 Years and over | 189 (32.1%) | 255 (24.8%) |
Disability Class: Vision Difficulty
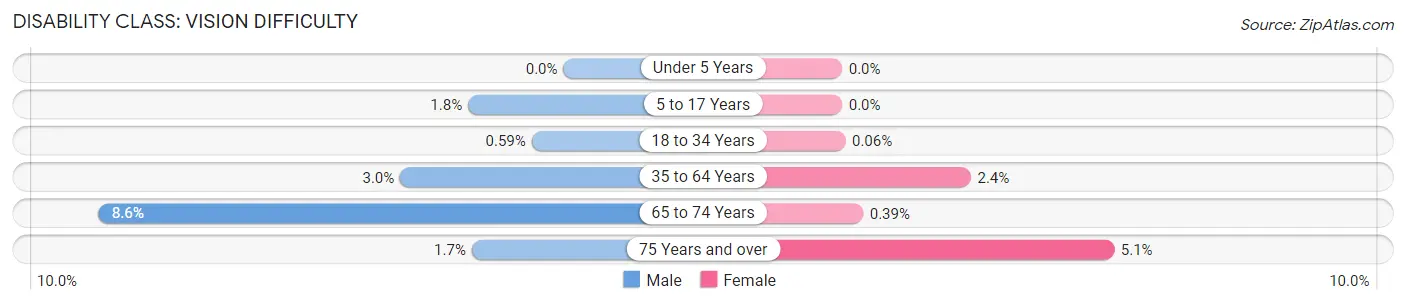
| Age Bracket | Male | Female |
| Under 5 Years | 0 (0.0%) | 0 (0.0%) |
| 5 to 17 Years | 45 (1.8%) | 0 (0.0%) |
| 18 to 34 Years | 22 (0.6%) | 2 (0.1%) |
| 35 to 64 Years | 213 (3.0%) | 175 (2.4%) |
| 65 to 74 Years | 104 (8.6%) | 6 (0.4%) |
| 75 Years and over | 10 (1.7%) | 52 (5.1%) |
Disability Class: Cognitive Difficulty
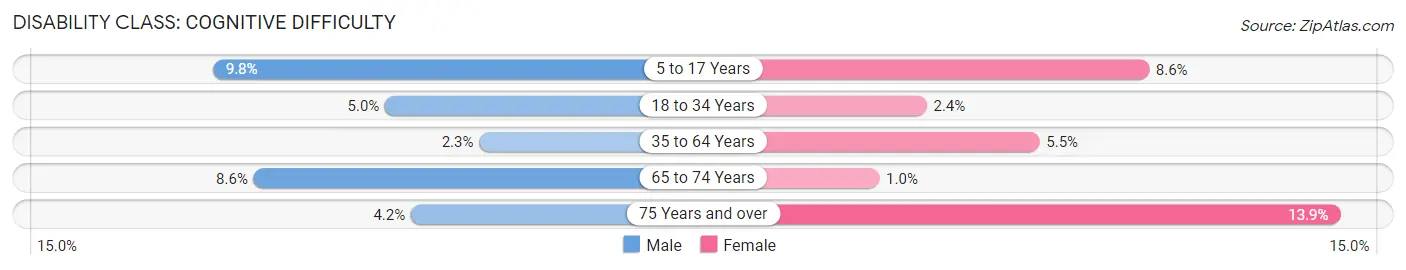
| Age Bracket | Male | Female |
| 5 to 17 Years | 248 (9.8%) | 249 (8.6%) |
| 18 to 34 Years | 184 (5.0%) | 85 (2.4%) |
| 35 to 64 Years | 165 (2.3%) | 402 (5.5%) |
| 65 to 74 Years | 104 (8.6%) | 16 (1.0%) |
| 75 Years and over | 25 (4.2%) | 143 (13.9%) |
Disability Class: Ambulatory Difficulty
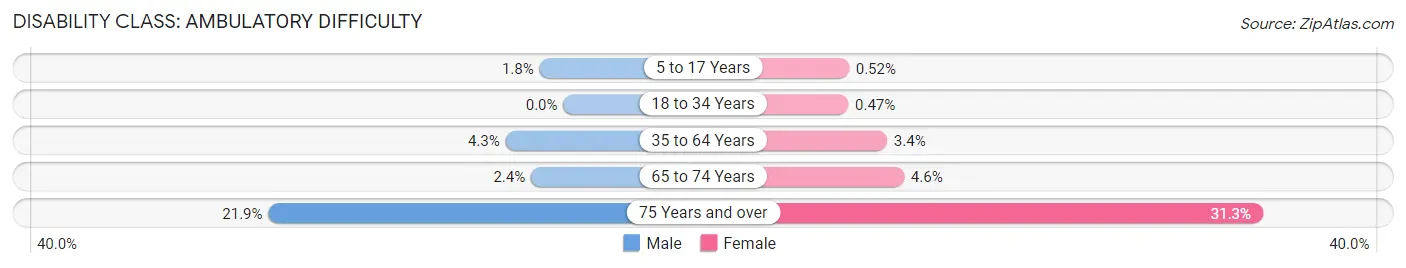
| Age Bracket | Male | Female |
| 5 to 17 Years | 45 (1.8%) | 15 (0.5%) |
| 18 to 34 Years | 0 (0.0%) | 17 (0.5%) |
| 35 to 64 Years | 302 (4.3%) | 245 (3.4%) |
| 65 to 74 Years | 29 (2.4%) | 71 (4.6%) |
| 75 Years and over | 129 (21.9%) | 322 (31.3%) |
Disability Class: Self-Care Difficulty
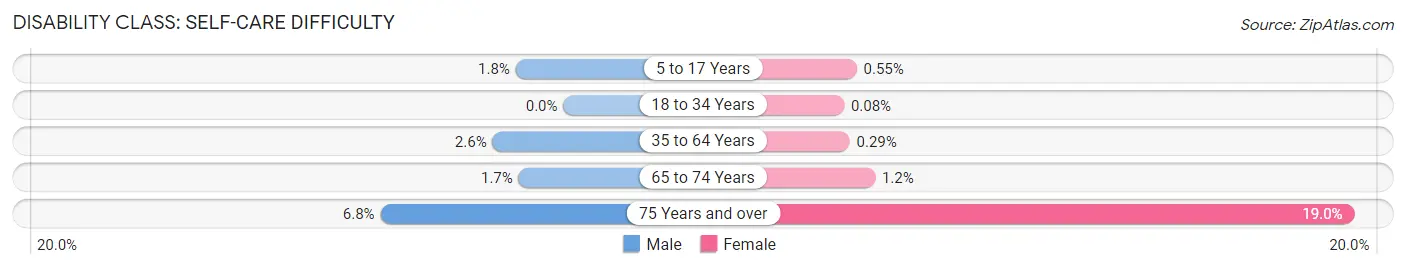
| Age Bracket | Male | Female |
| 5 to 17 Years | 45 (1.8%) | 16 (0.5%) |
| 18 to 34 Years | 0 (0.0%) | 3 (0.1%) |
| 35 to 64 Years | 185 (2.6%) | 21 (0.3%) |
| 65 to 74 Years | 20 (1.7%) | 19 (1.2%) |
| 75 Years and over | 40 (6.8%) | 196 (19.0%) |
Technology Access in Franklin Town
Computing Device Access in Franklin Town
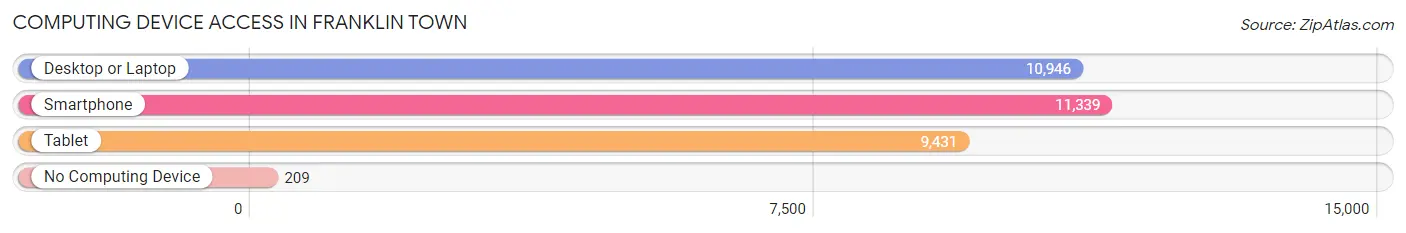
| Device Type | # Households | % Households |
| Desktop or Laptop | 10,946 | 90.2% |
| Smartphone | 11,339 | 93.5% |
| Tablet | 9,431 | 77.7% |
| No Computing Device | 209 | 1.7% |
| Total | 12,131 | 100.0% |
Internet Access in Franklin Town
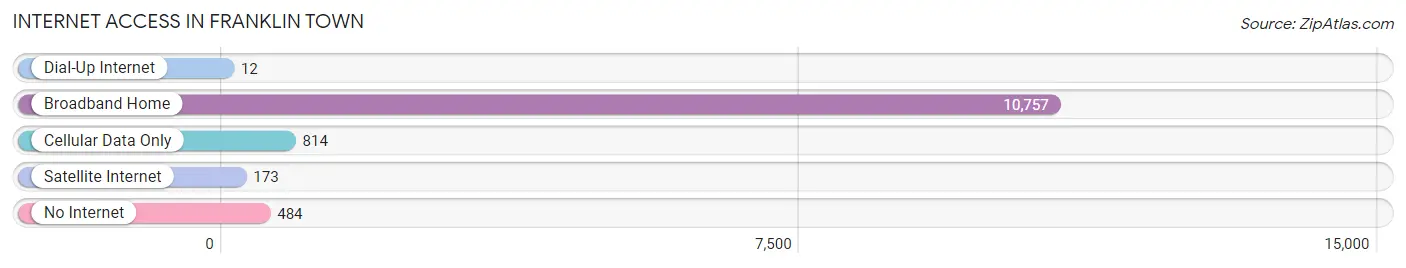
| Internet Type | # Households | % Households |
| Dial-Up Internet | 12 | 0.1% |
| Broadband Home | 10,757 | 88.7% |
| Cellular Data Only | 814 | 6.7% |
| Satellite Internet | 173 | 1.4% |
| No Internet | 484 | 4.0% |
| Total | 12,131 | 100.0% |
Franklin Town Summary
Franklin Town, Massachusetts is a small town located in Norfolk County, Massachusetts. It is situated in the eastern part of the state, about 20 miles south of Boston. The town was first settled in 1660 and incorporated in 1778. As of the 2010 census, the population of Franklin Town was 31,635.
Geography
Franklin Town is located in the eastern part of Massachusetts, about 20 miles south of Boston. It is bordered by the towns of Bellingham, Medway, Norfolk, Wrentham, and Millis. The town is situated on the Charles River, which forms its western boundary. The town is mostly rural, with a few small villages and hamlets scattered throughout. The town is mostly flat, with some rolling hills in the northern and eastern parts.
Climate
Franklin Town has a humid continental climate, with warm summers and cold winters. The average annual temperature is around 50°F (10°C). The average annual precipitation is around 45 inches (114 cm).
Demographics
As of the 2010 census, the population of Franklin Town was 31,635. The racial makeup of the town was 87.3% White, 5.3% African American, 0.4% Native American, 2.7% Asian, 0.1% Pacific Islander, 1.7% from other races, and 2.5% from two or more races. Hispanic or Latino of any race were 4.2% of the population.
Economy
Franklin Town is a largely residential community, with a few small businesses scattered throughout. The town is home to several large employers, including the Franklin Town Public Schools, Franklin Town Hospital, and the Franklin Town Police Department. The town also has a number of small businesses, including restaurants, retail stores, and professional services.
The town is also home to several large industrial parks, which are home to a variety of businesses, including manufacturing, warehousing, and distribution. The town is also home to several technology companies, including the Franklin Town Technology Park.
History
Franklin Town was first settled in 1660 and incorporated in 1778. The town was named after Benjamin Franklin, who was a prominent figure in the American Revolution. The town was an important center of industry during the Industrial Revolution, with several mills and factories located in the area.
In the late 19th century, the town began to transition from an industrial center to a residential community. The town was home to several large estates, which were owned by prominent families. The town also became a popular summer destination for wealthy Bostonians.
In the 20th century, the town continued to grow and develop. The town was home to several large employers, including the Franklin Town Public Schools, Franklin Town Hospital, and the Franklin Town Police Department. The town also became a popular destination for commuters, due to its proximity to Boston.
Today, Franklin Town is a largely residential community, with a few small businesses scattered throughout. The town is home to several large employers, including the Franklin Town Public Schools, Franklin Town Hospital, and the Franklin Town Police Department. The town also has a number of small businesses, including restaurants, retail stores, and professional services. The town is also home to several large industrial parks, which are home to a variety of businesses, including manufacturing, warehousing, and distribution. The town is also home to several technology companies, including the Franklin Town Technology Park.
Common Questions
What is Per Capita Income in Franklin Town?
Per Capita income in Franklin Town is $61,841.
What is the Median Family Income in Franklin Town?
Median Family Income in Franklin Town is $170,487.
What is the Median Household income in Franklin Town?
Median Household Income in Franklin Town is $138,062.
What is Income or Wage Gap in Franklin Town?
Income or Wage Gap in Franklin Town is 42.9%.
Women in Franklin Town earn 57.1 cents for every dollar earned by a man.
What is Inequality or Gini Index in Franklin Town?
Inequality or Gini Index in Franklin Town is 0.40.
What is the Total Population of Franklin Town?
Total Population of Franklin Town is 32,777.
What is the Total Male Population of Franklin Town?
Total Male Population of Franklin Town is 15,656.
What is the Total Female Population of Franklin Town?
Total Female Population of Franklin Town is 17,121.
What is the Ratio of Males per 100 Females in Franklin Town?
There are 91.44 Males per 100 Females in Franklin Town.
What is the Ratio of Females per 100 Males in Franklin Town?
There are 109.36 Females per 100 Males in Franklin Town.
What is the Median Population Age in Franklin Town?
Median Population Age in Franklin Town is 42.0 Years.
What is the Average Family Size in Franklin Town
Average Family Size in Franklin Town is 3.1 People.
What is the Average Household Size in Franklin Town
Average Household Size in Franklin Town is 2.6 People.
How Large is the Labor Force in Franklin Town?
There are 19,578 People in the Labor Forcein in Franklin Town.
What is the Percentage of People in the Labor Force in Franklin Town?
71.7% of People are in the Labor Force in Franklin Town.
What is the Unemployment Rate in Franklin Town?
Unemployment Rate in Franklin Town is 5.4%.