Cities with the Highest Percentage of Population with a Degree in Multidisciplinary Studies in Massachusetts
RELATED REPORTS & OPTIONS
Multidisciplinary Studies
Massachusetts
Compare Cities
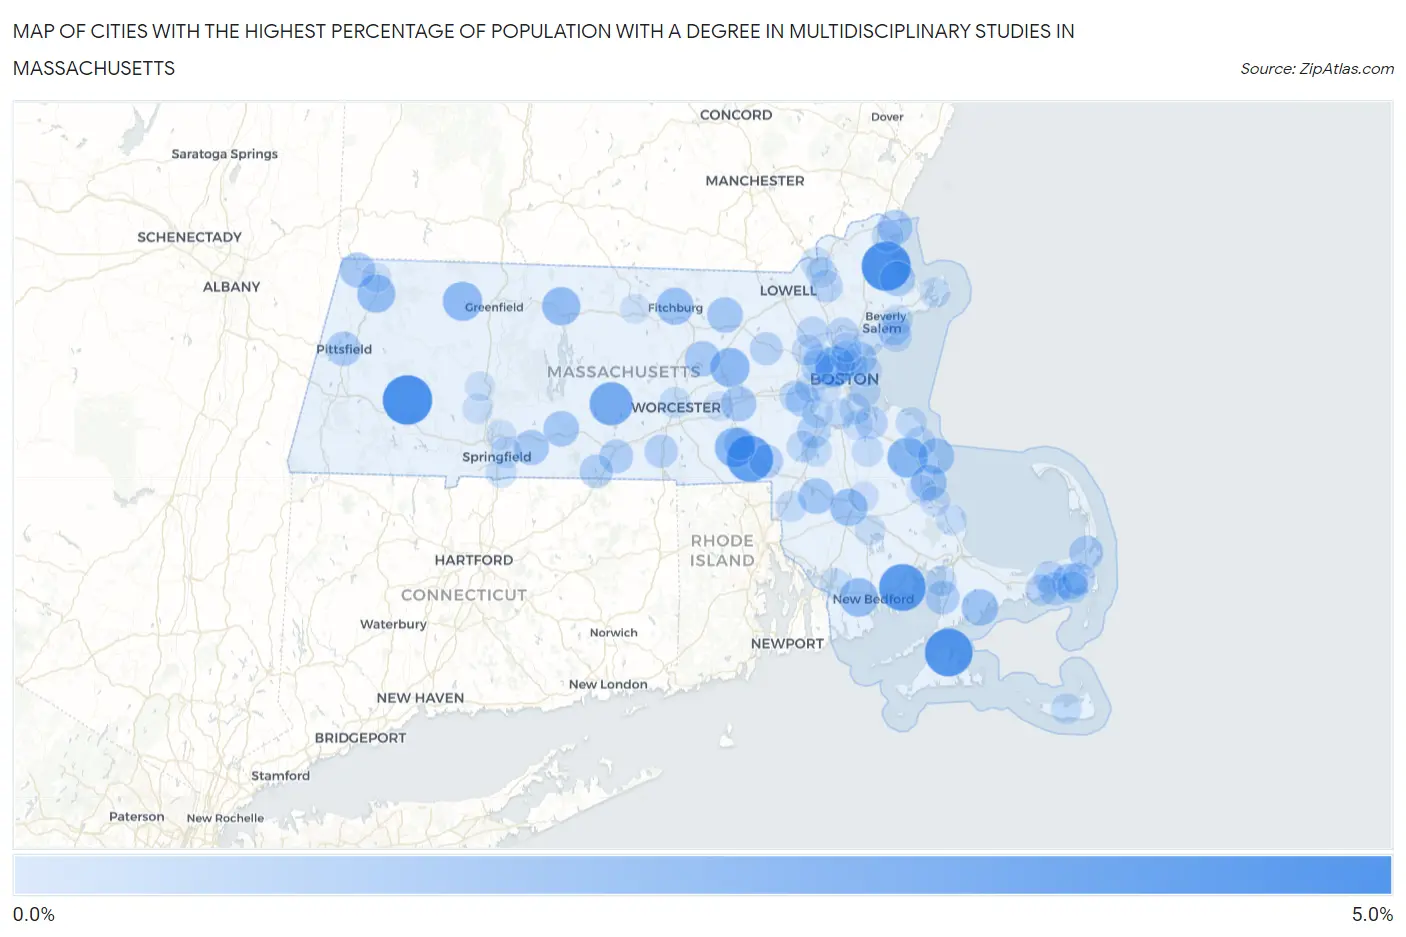
Map of Cities with the Highest Percentage of Population with a Degree in Multidisciplinary Studies in Massachusetts
0.0%
5.0%
Cities with the Highest Percentage of Population with a Degree in Multidisciplinary Studies in Massachusetts
| City | % Graduates | vs State | vs National | |
| 1. | Chester | 4.4% | 0.77%(+3.64)#1 | 0.88%(+3.53)#1,040 |
| 2. | Rowley | 4.3% | 0.77%(+3.56)#2 | 0.88%(+3.45)#1,064 |
| 3. | Vineyard Haven | 4.1% | 0.77%(+3.30)#3 | 0.88%(+3.19)#1,129 |
| 4. | Mattapoisett Center | 3.9% | 0.77%(+3.10)#4 | 0.88%(+3.00)#1,185 |
| 5. | Bellingham | 3.7% | 0.77%(+2.96)#5 | 0.88%(+2.85)#1,235 |
| 6. | North Brookfield | 3.1% | 0.77%(+2.37)#6 | 0.88%(+2.27)#1,514 |
| 7. | North Pembroke | 2.6% | 0.77%(+1.79)#7 | 0.88%(+1.68)#1,888 |
| 8. | Hopedale | 2.5% | 0.77%(+1.74)#8 | 0.88%(+1.63)#1,934 |
| 9. | Somerville | 2.4% | 0.77%(+1.67)#9 | 0.88%(+1.56)#1,979 |
| 10. | Shelburne Falls | 2.3% | 0.77%(+1.57)#10 | 0.88%(+1.47)#2,058 |
| 11. | Hudson | 2.3% | 0.77%(+1.56)#11 | 0.88%(+1.45)#2,070 |
| 12. | Smith Mills | 2.2% | 0.77%(+1.42)#12 | 0.88%(+1.31)#2,225 |
| 13. | Orange | 2.2% | 0.77%(+1.39)#13 | 0.88%(+1.29)#2,259 |
| 14. | Adams | 2.1% | 0.77%(+1.37)#14 | 0.88%(+1.26)#2,288 |
| 15. | Raynham Center | 2.0% | 0.77%(+1.20)#15 | 0.88%(+1.10)#2,488 |
| 16. | Fitchburg | 2.0% | 0.77%(+1.19)#16 | 0.88%(+1.08)#2,518 |
| 17. | Mashpee Neck | 1.8% | 0.77%(+1.06)#17 | 0.88%(+0.954)#2,678 |
| 18. | Ocean Bluff Brant Rock | 1.7% | 0.77%(+0.967)#18 | 0.88%(+0.861)#2,824 |
| 19. | South Duxbury | 1.7% | 0.77%(+0.917)#19 | 0.88%(+0.811)#2,903 |
| 20. | Harwich Center | 1.7% | 0.77%(+0.896)#20 | 0.88%(+0.790)#2,939 |
| 21. | Ayer | 1.7% | 0.77%(+0.889)#21 | 0.88%(+0.783)#2,958 |
| 22. | Norton Center | 1.6% | 0.77%(+0.870)#22 | 0.88%(+0.764)#2,994 |
| 23. | Palmer Town | 1.6% | 0.77%(+0.859)#23 | 0.88%(+0.753)#3,017 |
| 24. | Clinton | 1.6% | 0.77%(+0.826)#24 | 0.88%(+0.719)#3,088 |
| 25. | Cordaville | 1.6% | 0.77%(+0.803)#25 | 0.88%(+0.697)#3,133 |
| 26. | Williamstown | 1.6% | 0.77%(+0.799)#26 | 0.88%(+0.692)#3,144 |
| 27. | Wilbraham | 1.6% | 0.77%(+0.787)#27 | 0.88%(+0.681)#3,171 |
| 28. | Ipswich | 1.5% | 0.77%(+0.768)#28 | 0.88%(+0.662)#3,214 |
| 29. | Salisbury | 1.5% | 0.77%(+0.764)#29 | 0.88%(+0.658)#3,225 |
| 30. | Pittsfield | 1.4% | 0.77%(+0.664)#30 | 0.88%(+0.558)#3,443 |
| 31. | Orleans | 1.4% | 0.77%(+0.580)#31 | 0.88%(+0.474)#3,624 |
| 32. | Sturbridge | 1.3% | 0.77%(+0.548)#32 | 0.88%(+0.441)#3,701 |
| 33. | North Falmouth | 1.3% | 0.77%(+0.541)#33 | 0.88%(+0.434)#3,722 |
| 34. | Franklin Town | 1.3% | 0.77%(+0.538)#34 | 0.88%(+0.432)#3,733 |
| 35. | Needham | 1.3% | 0.77%(+0.512)#35 | 0.88%(+0.406)#3,818 |
| 36. | Cambridge | 1.3% | 0.77%(+0.487)#36 | 0.88%(+0.381)#3,893 |
| 37. | Revere | 1.2% | 0.77%(+0.472)#37 | 0.88%(+0.365)#3,940 |
| 38. | Holland | 1.2% | 0.77%(+0.465)#38 | 0.88%(+0.358)#3,962 |
| 39. | Norwood | 1.2% | 0.77%(+0.457)#39 | 0.88%(+0.351)#3,990 |
| 40. | Dennis Port | 1.2% | 0.77%(+0.444)#40 | 0.88%(+0.338)#4,030 |
| 41. | Oxford | 1.2% | 0.77%(+0.440)#41 | 0.88%(+0.333)#4,046 |
| 42. | Salem | 1.2% | 0.77%(+0.419)#42 | 0.88%(+0.313)#4,107 |
| 43. | South Dennis | 1.2% | 0.77%(+0.394)#43 | 0.88%(+0.287)#4,185 |
| 44. | West Concord | 1.1% | 0.77%(+0.369)#44 | 0.88%(+0.262)#4,257 |
| 45. | Greenfield | 1.1% | 0.77%(+0.367)#45 | 0.88%(+0.261)#4,259 |
| 46. | Belmont | 1.1% | 0.77%(+0.354)#46 | 0.88%(+0.248)#4,302 |
| 47. | Milford | 1.1% | 0.77%(+0.343)#47 | 0.88%(+0.236)#4,348 |
| 48. | Andover | 1.1% | 0.77%(+0.324)#48 | 0.88%(+0.218)#4,413 |
| 49. | East Harwich | 1.1% | 0.77%(+0.317)#49 | 0.88%(+0.211)#4,438 |
| 50. | Weymouth Town | 1.1% | 0.77%(+0.313)#50 | 0.88%(+0.206)#4,448 |
| 51. | Chelsea | 1.1% | 0.77%(+0.303)#51 | 0.88%(+0.197)#4,477 |
| 52. | Wakefield | 1.1% | 0.77%(+0.295)#52 | 0.88%(+0.189)#4,505 |
| 53. | Burlington | 0.97% | 0.77%(+0.197)#53 | 0.88%(+0.091)#4,849 |
| 54. | Arlington | 0.97% | 0.77%(+0.195)#54 | 0.88%(+0.089)#4,856 |
| 55. | South Yarmouth | 0.92% | 0.77%(+0.150)#55 | 0.88%(+0.044)#5,024 |
| 56. | Newburyport | 0.90% | 0.77%(+0.127)#56 | 0.88%(+0.021)#5,122 |
| 57. | Marblehead | 0.90% | 0.77%(+0.125)#57 | 0.88%(+0.019)#5,128 |
| 58. | Harwich Port | 0.89% | 0.77%(+0.121)#58 | 0.88%(+0.015)#5,146 |
| 59. | Amherst | 0.89% | 0.77%(+0.114)#59 | 0.88%(+0.008)#5,172 |
| 60. | Walpole | 0.87% | 0.77%(+0.096)#60 | 0.88%(-0.010)#5,242 |
| 61. | Marshfield Hills | 0.86% | 0.77%(+0.087)#61 | 0.88%(-0.019)#5,273 |
| 62. | Wellesley | 0.86% | 0.77%(+0.083)#62 | 0.88%(-0.023)#5,287 |
| 63. | Boston | 0.86% | 0.77%(+0.083)#63 | 0.88%(-0.024)#5,288 |
| 64. | Lexington | 0.85% | 0.77%(+0.081)#64 | 0.88%(-0.026)#5,301 |
| 65. | Dedham | 0.83% | 0.77%(+0.062)#65 | 0.88%(-0.044)#5,399 |
| 66. | North Attleborough | 0.83% | 0.77%(+0.058)#66 | 0.88%(-0.049)#5,417 |
| 67. | Quincy | 0.83% | 0.77%(+0.056)#67 | 0.88%(-0.050)#5,426 |
| 68. | Methuen Town | 0.81% | 0.77%(+0.039)#68 | 0.88%(-0.068)#5,481 |
| 69. | Worcester | 0.81% | 0.77%(+0.033)#69 | 0.88%(-0.074)#5,509 |
| 70. | Winthrop Town | 0.80% | 0.77%(+0.029)#70 | 0.88%(-0.078)#5,525 |
| 71. | Attleboro | 0.80% | 0.77%(+0.025)#71 | 0.88%(-0.081)#5,540 |
| 72. | North Scituate | 0.79% | 0.77%(+0.019)#72 | 0.88%(-0.087)#5,563 |
| 73. | Abington | 0.79% | 0.77%(+0.015)#73 | 0.88%(-0.091)#5,579 |
| 74. | Nantucket | 0.78% | 0.77%(+0.007)#74 | 0.88%(-0.099)#5,617 |
| 75. | Sharon | 0.77% | 0.77%(-0.002)#75 | 0.88%(-0.108)#5,655 |
| 76. | Malden | 0.77% | 0.77%(-0.006)#76 | 0.88%(-0.112)#5,683 |
| 77. | Pocasset | 0.76% | 0.77%(-0.010)#77 | 0.88%(-0.116)#5,697 |
| 78. | Springfield | 0.76% | 0.77%(-0.011)#78 | 0.88%(-0.117)#5,705 |
| 79. | Lawrence | 0.76% | 0.77%(-0.015)#79 | 0.88%(-0.122)#5,727 |
| 80. | Fall River | 0.75% | 0.77%(-0.026)#80 | 0.88%(-0.132)#5,769 |
| 81. | The Pinehills | 0.74% | 0.77%(-0.029)#81 | 0.88%(-0.135)#5,786 |
| 82. | Longmeadow | 0.74% | 0.77%(-0.029)#82 | 0.88%(-0.136)#5,789 |
| 83. | Beverly | 0.74% | 0.77%(-0.037)#83 | 0.88%(-0.143)#5,818 |
| 84. | Milton | 0.72% | 0.77%(-0.054)#84 | 0.88%(-0.161)#5,901 |
| 85. | North Lakeville | 0.70% | 0.77%(-0.073)#85 | 0.88%(-0.179)#5,980 |
| 86. | Gloucester | 0.66% | 0.77%(-0.110)#86 | 0.88%(-0.216)#6,140 |
| 87. | Kingston | 0.65% | 0.77%(-0.119)#87 | 0.88%(-0.225)#6,178 |
| 88. | Plymouth | 0.65% | 0.77%(-0.121)#88 | 0.88%(-0.227)#6,186 |
| 89. | Easthampton Town | 0.65% | 0.77%(-0.127)#89 | 0.88%(-0.233)#6,210 |
| 90. | Chicopee | 0.63% | 0.77%(-0.144)#90 | 0.88%(-0.250)#6,274 |
| 91. | Braintree Town | 0.62% | 0.77%(-0.156)#91 | 0.88%(-0.263)#6,322 |
| 92. | Bridgewater Town | 0.62% | 0.77%(-0.158)#92 | 0.88%(-0.264)#6,334 |
| 93. | Newton | 0.61% | 0.77%(-0.159)#93 | 0.88%(-0.266)#6,340 |
| 94. | Melrose | 0.61% | 0.77%(-0.164)#94 | 0.88%(-0.270)#6,370 |
| 95. | Lynn | 0.59% | 0.77%(-0.184)#95 | 0.88%(-0.290)#6,469 |
| 96. | Westborough | 0.59% | 0.77%(-0.184)#96 | 0.88%(-0.290)#6,470 |
| 97. | Gardner | 0.58% | 0.77%(-0.188)#97 | 0.88%(-0.295)#6,493 |
| 98. | North Adams | 0.58% | 0.77%(-0.190)#98 | 0.88%(-0.296)#6,502 |
| 99. | Brookline | 0.57% | 0.77%(-0.203)#99 | 0.88%(-0.309)#6,554 |
| 100. | Northampton | 0.56% | 0.77%(-0.212)#100 | 0.88%(-0.318)#6,588 |
Common Questions
What are the Top 10 Cities with the Highest Percentage of Population with a Degree in Multidisciplinary Studies in Massachusetts?
Top 10 Cities with the Highest Percentage of Population with a Degree in Multidisciplinary Studies in Massachusetts are:
#1
4.4%
#2
4.3%
#3
4.1%
#4
3.9%
#5
3.7%
#6
3.1%
#7
2.6%
#8
2.5%
#9
2.4%
#10
2.3%
What city has the Highest Percentage of Population with a Degree in Multidisciplinary Studies in Massachusetts?
Chester has the Highest Percentage of Population with a Degree in Multidisciplinary Studies in Massachusetts with 4.4%.
What is the Percentage of Population with a Degree in Multidisciplinary Studies in the State of Massachusetts?
Percentage of Population with a Degree in Multidisciplinary Studies in Massachusetts is 0.77%.
What is the Percentage of Population with a Degree in Multidisciplinary Studies in the United States?
Percentage of Population with a Degree in Multidisciplinary Studies in the United States is 0.88%.