Leominster, MA Map & Demographics
Leominster Map
Leominster Overview
$43,956
PER CAPITA INCOME
$105,157
AVG FAMILY INCOME
$75,620
AVG HOUSEHOLD INCOME
25.7%
WAGE / INCOME GAP [ % ]
74.3¢/ $1
WAGE / INCOME GAP [ $ ]
$9,370
FAMILY INCOME DEFICIT
0.44
INEQUALITY / GINI INDEX
43,620
TOTAL POPULATION
22,201
MALE POPULATION
21,419
FEMALE POPULATION
103.65
MALES / 100 FEMALES
96.48
FEMALES / 100 MALES
43.0
MEDIAN AGE
3.0
AVG FAMILY SIZE
2.3
AVG HOUSEHOLD SIZE
24,373
LABOR FORCE [ PEOPLE ]
67.5%
PERCENT IN LABOR FORCE
6.0%
UNEMPLOYMENT RATE
Leominster Zip Codes
Income in Leominster
Income Overview in Leominster
Per Capita Income in Leominster is $43,956, while median incomes of families and households are $105,157 and $75,620 respectively.
| Characteristic | Number | Measure |
| Per Capita Income | 43,620 | $43,956 |
| Median Family Income | 11,232 | $105,157 |
| Mean Family Income | 11,232 | $125,075 |
| Median Household Income | 18,474 | $75,620 |
| Mean Household Income | 18,474 | $102,576 |
| Income Deficit | 11,232 | $9,370 |
| Wage / Income Gap (%) | 43,620 | 25.68% |
| Wage / Income Gap ($) | 43,620 | 74.32¢ per $1 |
| Gini / Inequality Index | 43,620 | 0.44 |
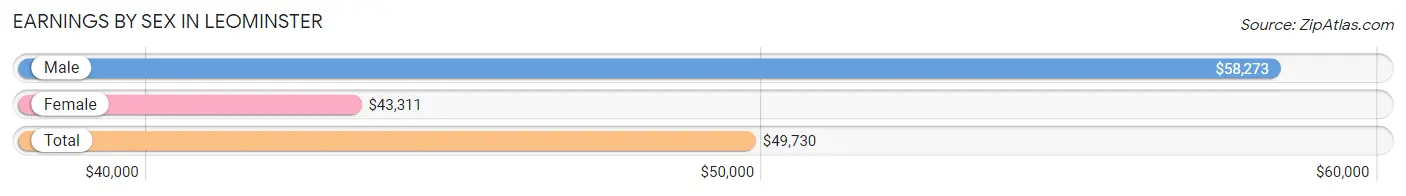
Earnings by Sex in Leominster
Average Earnings in Leominster are $49,730, $58,273 for men and $43,311 for women, a difference of 25.7%.
| Sex | Number | Average Earnings |
| Male | 13,091 (52.8%) | $58,273 |
| Female | 11,713 (47.2%) | $43,311 |
| Total | 24,804 (100.0%) | $49,730 |
Earnings by Sex by Income Bracket in Leominster
The most common earnings brackets in Leominster are $100,000+ for men (2,797 | 21.4%) and $55,000 to $64,999 for women (1,473 | 12.6%).
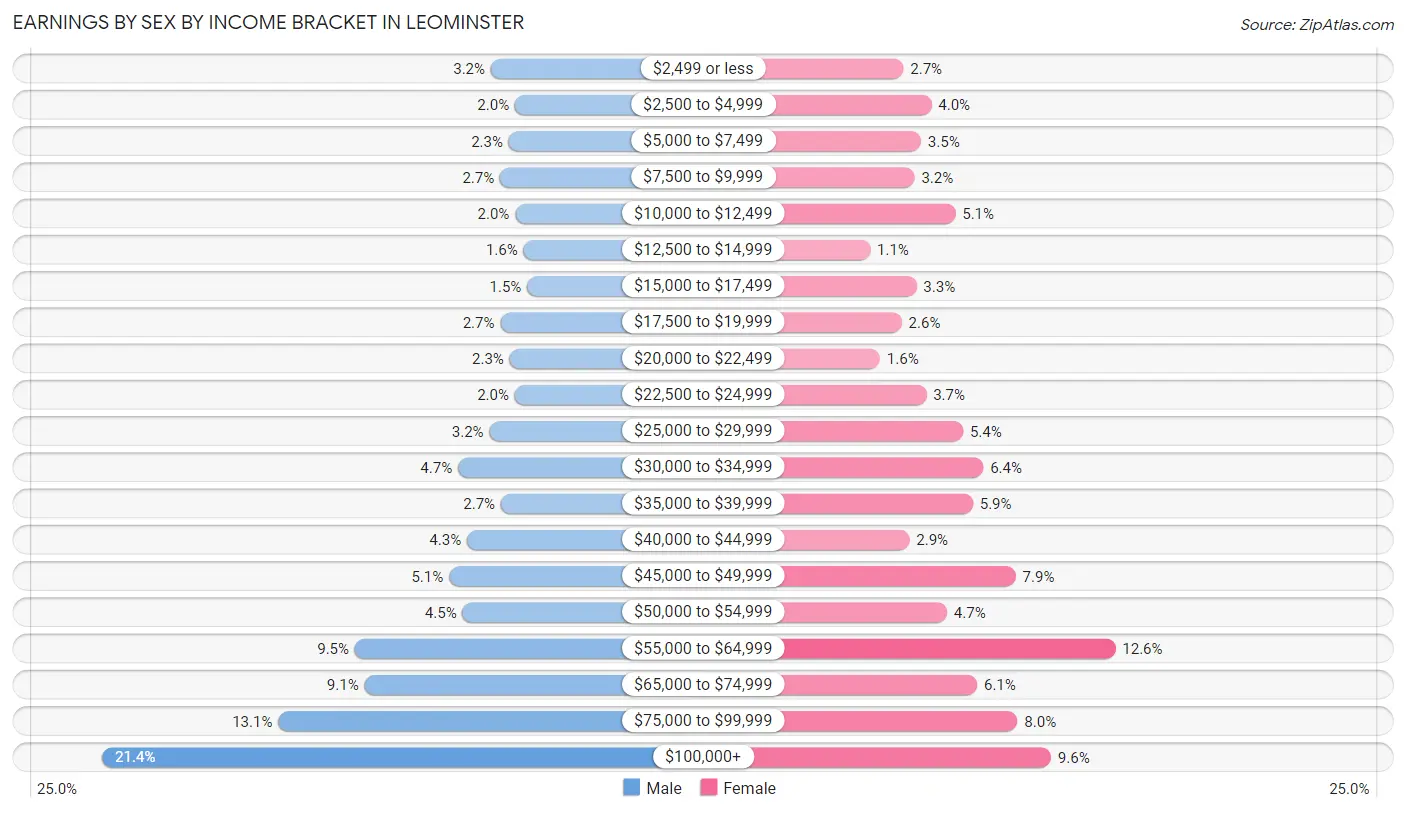
| Income | Male | Female |
| $2,499 or less | 414 (3.2%) | 310 (2.6%) |
| $2,500 to $4,999 | 266 (2.0%) | 464 (4.0%) |
| $5,000 to $7,499 | 304 (2.3%) | 407 (3.5%) |
| $7,500 to $9,999 | 357 (2.7%) | 371 (3.2%) |
| $10,000 to $12,499 | 265 (2.0%) | 595 (5.1%) |
| $12,500 to $14,999 | 214 (1.6%) | 128 (1.1%) |
| $15,000 to $17,499 | 191 (1.5%) | 382 (3.3%) |
| $17,500 to $19,999 | 356 (2.7%) | 301 (2.6%) |
| $20,000 to $22,499 | 299 (2.3%) | 181 (1.5%) |
| $22,500 to $24,999 | 267 (2.0%) | 436 (3.7%) |
| $25,000 to $29,999 | 423 (3.2%) | 637 (5.4%) |
| $30,000 to $34,999 | 615 (4.7%) | 749 (6.4%) |
| $35,000 to $39,999 | 352 (2.7%) | 691 (5.9%) |
| $40,000 to $44,999 | 560 (4.3%) | 343 (2.9%) |
| $45,000 to $49,999 | 670 (5.1%) | 926 (7.9%) |
| $50,000 to $54,999 | 588 (4.5%) | 549 (4.7%) |
| $55,000 to $64,999 | 1,247 (9.5%) | 1,473 (12.6%) |
| $65,000 to $74,999 | 1,189 (9.1%) | 714 (6.1%) |
| $75,000 to $99,999 | 1,717 (13.1%) | 936 (8.0%) |
| $100,000+ | 2,797 (21.4%) | 1,120 (9.6%) |
| Total | 13,091 (100.0%) | 11,713 (100.0%) |
Earnings by Sex by Educational Attainment in Leominster
Average earnings in Leominster are $64,330 for men and $47,738 for women, a difference of 25.8%. Men with an educational attainment of graduate degree enjoy the highest average annual earnings of $97,273, while those with high school diploma education earn the least with $46,663. Women with an educational attainment of graduate degree earn the most with the average annual earnings of $64,261, while those with high school diploma education have the smallest earnings of $33,231.
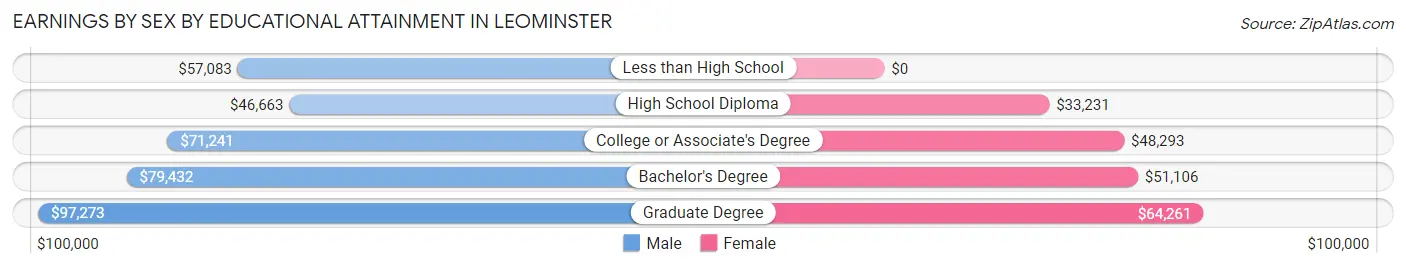
| Educational Attainment | Male Income | Female Income |
| Less than High School | $57,083 | $0 |
| High School Diploma | $46,663 | $33,231 |
| College or Associate's Degree | $71,241 | $48,293 |
| Bachelor's Degree | $79,432 | $51,106 |
| Graduate Degree | $97,273 | $64,261 |
| Total | $64,330 | $47,738 |
Family Income in Leominster
Family Income Brackets in Leominster
According to the Leominster family income data, there are 2,797 families falling into the $100,000 to $149,999 income range, which is the most common income bracket and makes up 24.9% of all families. Conversely, the less than $10,000 income bracket is the least frequent group with only 146 families (1.3%) belonging to this category.
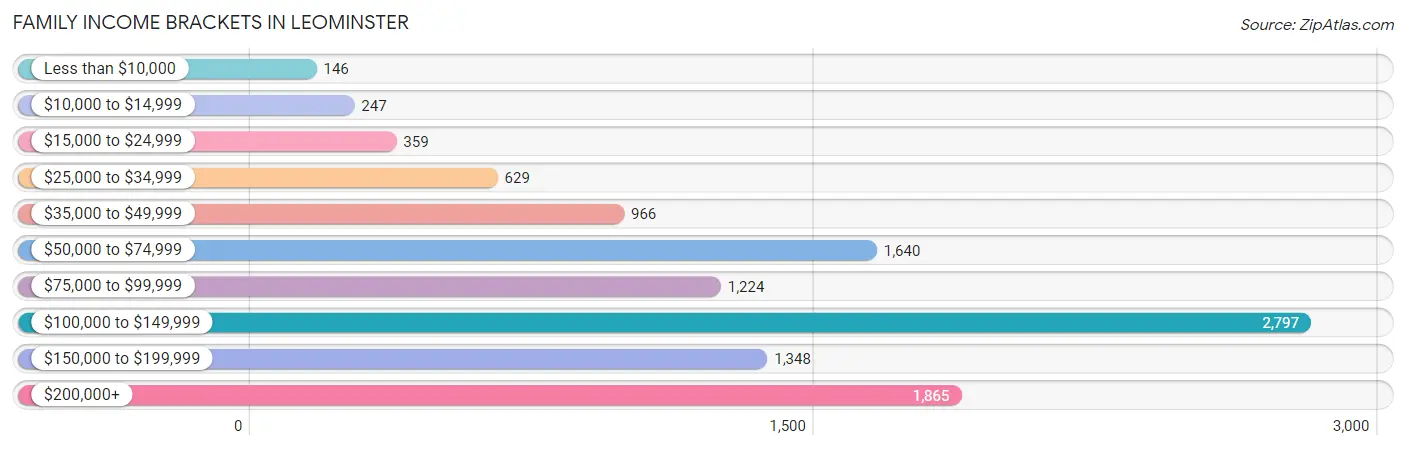
| Income Bracket | # Families | % Families |
| Less than $10,000 | 146 | 1.3% |
| $10,000 to $14,999 | 247 | 2.2% |
| $15,000 to $24,999 | 359 | 3.2% |
| $25,000 to $34,999 | 629 | 5.6% |
| $35,000 to $49,999 | 966 | 8.6% |
| $50,000 to $74,999 | 1,640 | 14.6% |
| $75,000 to $99,999 | 1,224 | 10.9% |
| $100,000 to $149,999 | 2,797 | 24.9% |
| $150,000 to $199,999 | 1,348 | 12.0% |
| $200,000+ | 1,865 | 16.6% |
Family Income by Famaliy Size in Leominster
6-person families (206 | 1.8%) account for the highest median family income in Leominster with $188,491 per family, while 2-person families (5,519 | 49.1%) have the highest median income of $40,858 per family member.
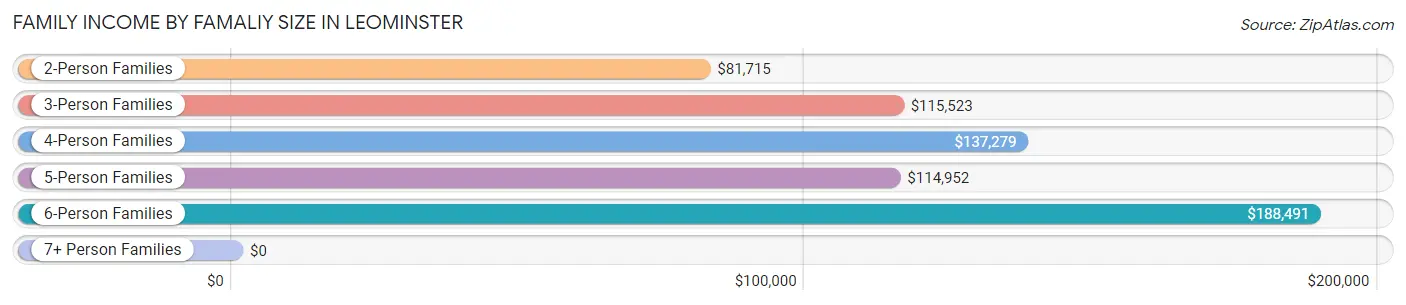
| Income Bracket | # Families | Median Income |
| 2-Person Families | 5,519 (49.1%) | $81,715 |
| 3-Person Families | 2,535 (22.6%) | $115,523 |
| 4-Person Families | 2,142 (19.1%) | $137,279 |
| 5-Person Families | 743 (6.6%) | $114,952 |
| 6-Person Families | 206 (1.8%) | $188,491 |
| 7+ Person Families | 87 (0.8%) | $0 |
| Total | 11,232 (100.0%) | $105,157 |
Family Income by Number of Earners in Leominster
The median family income in Leominster is $105,157, with families comprising 3+ earners (1,607) having the highest median family income of $190,125, while families with no earners (1,549) have the lowest median family income of $36,188, accounting for 14.3% and 13.8% of families, respectively.
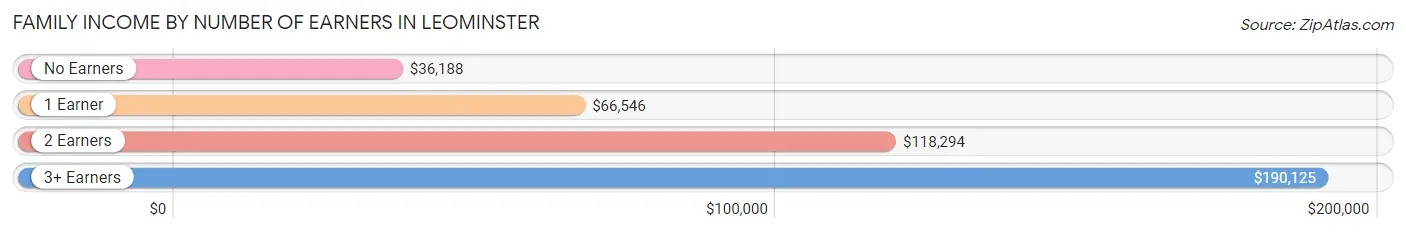
| Number of Earners | # Families | Median Income |
| No Earners | 1,549 (13.8%) | $36,188 |
| 1 Earner | 3,175 (28.3%) | $66,546 |
| 2 Earners | 4,901 (43.6%) | $118,294 |
| 3+ Earners | 1,607 (14.3%) | $190,125 |
| Total | 11,232 (100.0%) | $105,157 |
Household Income in Leominster
Household Income Brackets in Leominster
With 3,639 households falling in the category, the $50,000 to $74,999 income range is the most frequent in Leominster, accounting for 19.7% of all households. In contrast, only 573 households (3.1%) fall into the $10,000 to $14,999 income bracket, making it the least populous group.
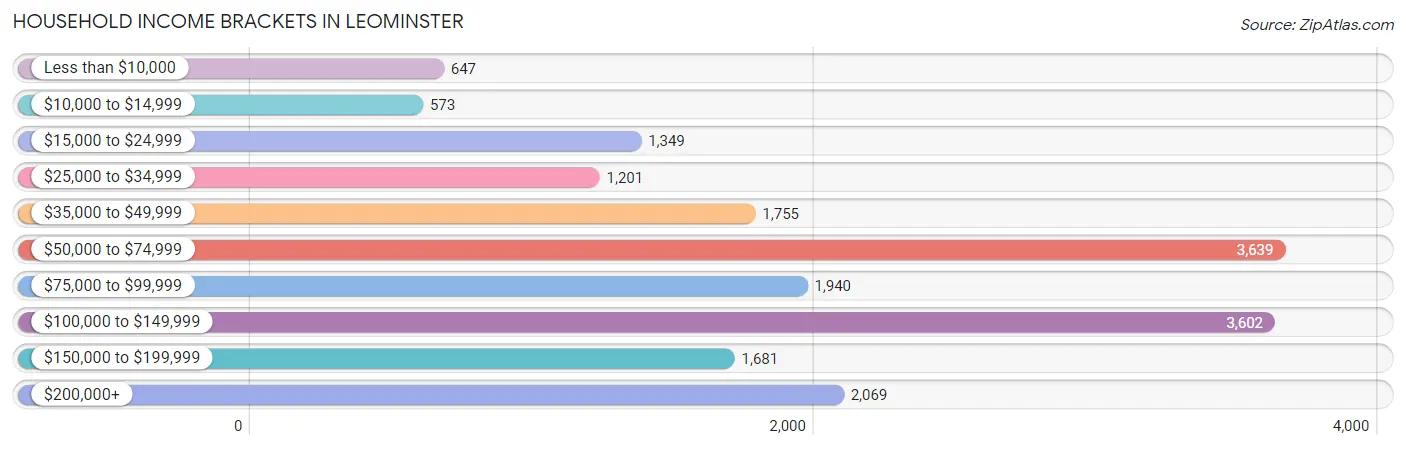
| Income Bracket | # Households | % Households |
| Less than $10,000 | 647 | 3.5% |
| $10,000 to $14,999 | 573 | 3.1% |
| $15,000 to $24,999 | 1,349 | 7.3% |
| $25,000 to $34,999 | 1,201 | 6.5% |
| $35,000 to $49,999 | 1,755 | 9.5% |
| $50,000 to $74,999 | 3,639 | 19.7% |
| $75,000 to $99,999 | 1,940 | 10.5% |
| $100,000 to $149,999 | 3,602 | 19.5% |
| $150,000 to $199,999 | 1,681 | 9.1% |
| $200,000+ | 2,069 | 11.2% |
Household Income by Householder Age in Leominster
The median household income in Leominster is $75,620, with the highest median household income of $102,977 found in the 45 to 64 years age bracket for the primary householder. A total of 7,527 households (40.7%) fall into this category. Meanwhile, the 65+ years age bracket for the primary householder has the lowest median household income of $53,001, with 5,238 households (28.3%) in this group.
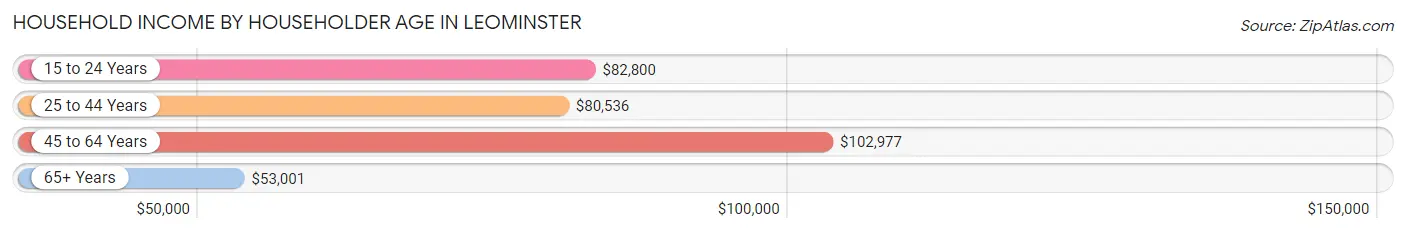
| Income Bracket | # Households | Median Income |
| 15 to 24 Years | 472 (2.5%) | $82,800 |
| 25 to 44 Years | 5,237 (28.3%) | $80,536 |
| 45 to 64 Years | 7,527 (40.7%) | $102,977 |
| 65+ Years | 5,238 (28.3%) | $53,001 |
| Total | 18,474 (100.0%) | $75,620 |
Poverty in Leominster
Income Below Poverty by Sex and Age in Leominster
With 9.3% poverty level for males and 8.8% for females among the residents of Leominster, 6 to 11 year old males and 35 to 44 year old females are the most vulnerable to poverty, with 352 males (26.1%) and 544 females (20.1%) in their respective age groups living below the poverty level.
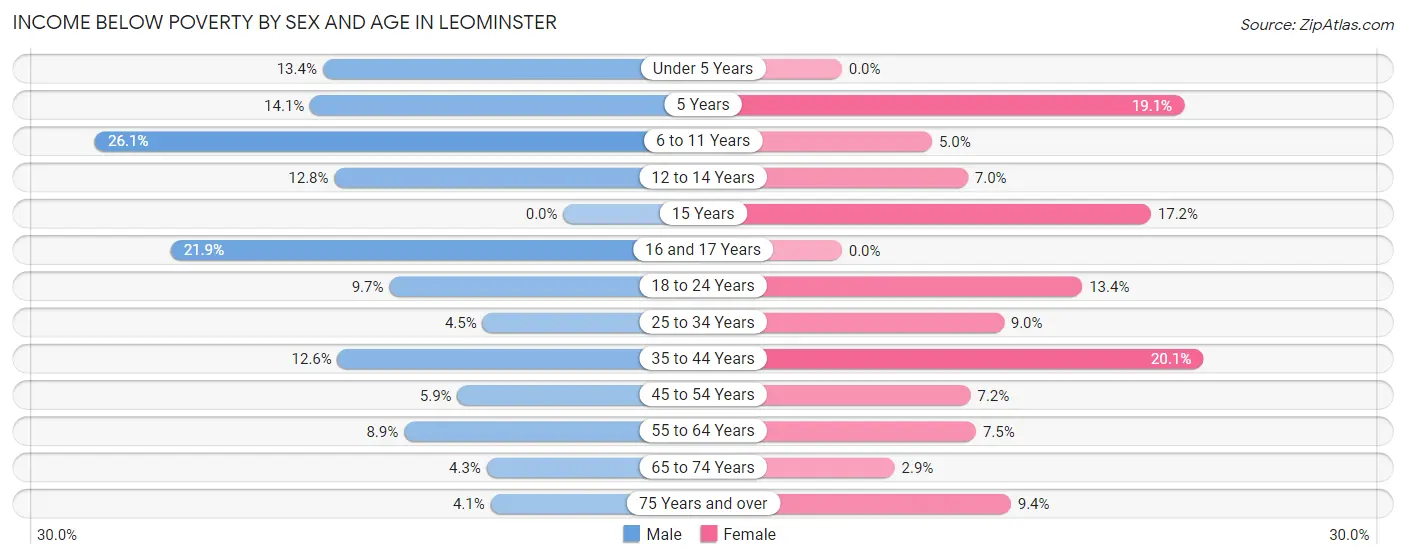
| Age Bracket | Male | Female |
| Under 5 Years | 189 (13.4%) | 0 (0.0%) |
| 5 Years | 33 (14.1%) | 8 (19.1%) |
| 6 to 11 Years | 352 (26.1%) | 75 (5.0%) |
| 12 to 14 Years | 117 (12.8%) | 55 (7.0%) |
| 15 Years | 0 (0.0%) | 63 (17.2%) |
| 16 and 17 Years | 106 (21.9%) | 0 (0.0%) |
| 18 to 24 Years | 213 (9.7%) | 178 (13.4%) |
| 25 to 34 Years | 146 (4.5%) | 237 (9.0%) |
| 35 to 44 Years | 303 (12.6%) | 544 (20.1%) |
| 45 to 54 Years | 169 (5.9%) | 227 (7.2%) |
| 55 to 64 Years | 280 (8.9%) | 260 (7.5%) |
| 65 to 74 Years | 102 (4.3%) | 75 (2.9%) |
| 75 Years and over | 55 (4.1%) | 157 (9.4%) |
| Total | 2,065 (9.3%) | 1,879 (8.8%) |
Income Above Poverty by Sex and Age in Leominster
According to the poverty statistics in Leominster, males aged 15 years and females aged under 5 years are the age groups that are most secure financially, with 100.0% of males and 100.0% of females in these age groups living above the poverty line.
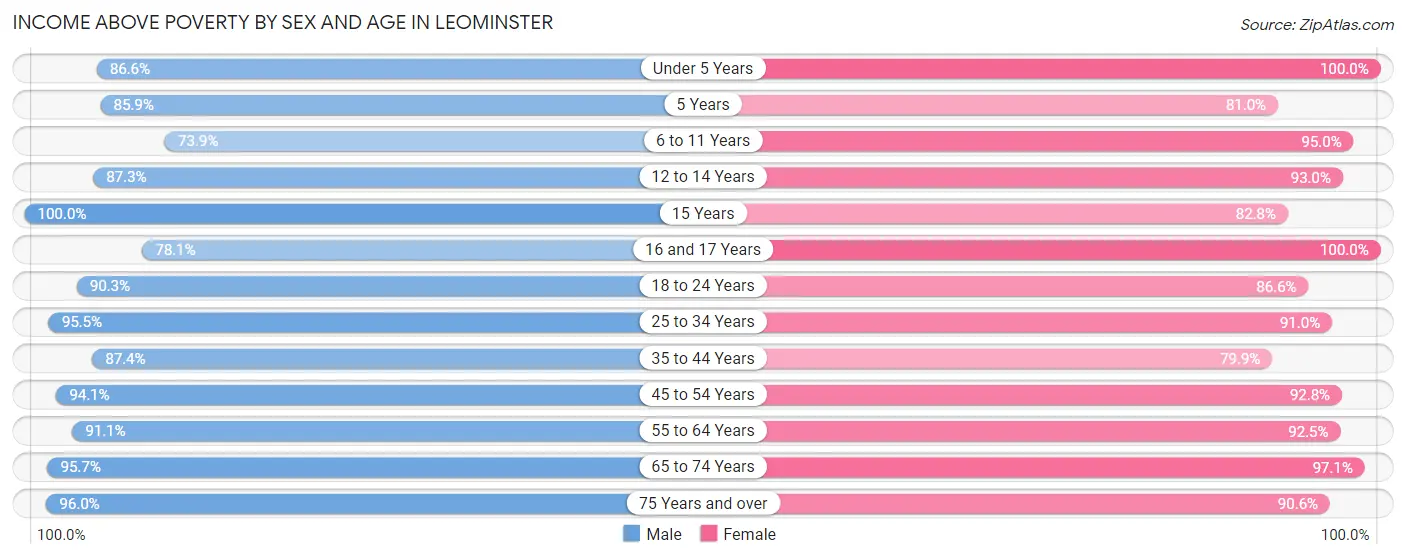
| Age Bracket | Male | Female |
| Under 5 Years | 1,221 (86.6%) | 764 (100.0%) |
| 5 Years | 201 (85.9%) | 34 (80.9%) |
| 6 to 11 Years | 998 (73.9%) | 1,418 (95.0%) |
| 12 to 14 Years | 801 (87.3%) | 728 (93.0%) |
| 15 Years | 74 (100.0%) | 303 (82.8%) |
| 16 and 17 Years | 379 (78.1%) | 306 (100.0%) |
| 18 to 24 Years | 1,985 (90.3%) | 1,151 (86.6%) |
| 25 to 34 Years | 3,097 (95.5%) | 2,391 (91.0%) |
| 35 to 44 Years | 2,107 (87.4%) | 2,160 (79.9%) |
| 45 to 54 Years | 2,695 (94.1%) | 2,937 (92.8%) |
| 55 to 64 Years | 2,875 (91.1%) | 3,221 (92.5%) |
| 65 to 74 Years | 2,286 (95.7%) | 2,475 (97.1%) |
| 75 Years and over | 1,302 (96.0%) | 1,511 (90.6%) |
| Total | 20,021 (90.6%) | 19,399 (91.2%) |
Income Below Poverty Among Married-Couple Families in Leominster
The poverty statistics for married-couple families in Leominster show that 3.8% or 298 of the total 7,748 families live below the poverty line. Families with 3 or 4 children have the highest poverty rate of 20.0%, comprising of 92 families. On the other hand, families with no children have the lowest poverty rate of 2.2%, which includes 99 families.
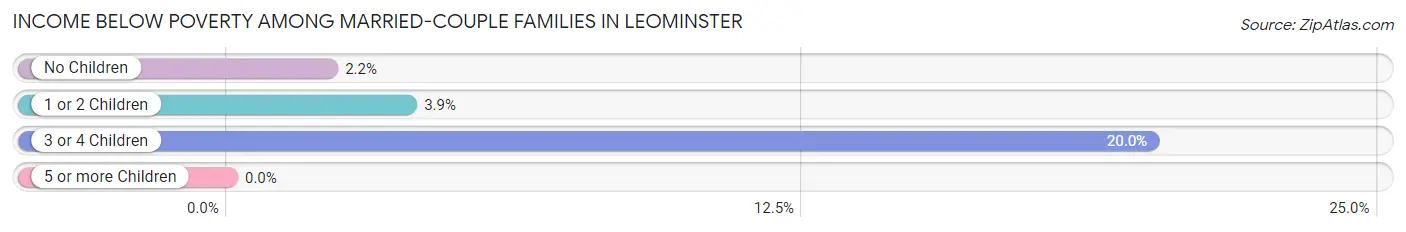
| Children | Above Poverty | Below Poverty |
| No Children | 4,449 (97.8%) | 99 (2.2%) |
| 1 or 2 Children | 2,634 (96.1%) | 107 (3.9%) |
| 3 or 4 Children | 367 (80.0%) | 92 (20.0%) |
| 5 or more Children | 0 (0.0%) | 0 (0.0%) |
| Total | 7,450 (96.2%) | 298 (3.8%) |
Income Below Poverty Among Single-Parent Households in Leominster
According to the poverty data in Leominster, 6.2% or 78 single-father households and 13.5% or 300 single-mother households are living below the poverty line. Among single-father households, those with 3 or 4 children have the highest poverty rate, with 49 households (40.5%) experiencing poverty. Likewise, among single-mother households, those with 1 or 2 children have the highest poverty rate, with 180 households (17.4%) falling below the poverty line.
| Children | Single Father | Single Mother |
| No Children | 0 (0.0%) | 112 (10.3%) |
| 1 or 2 Children | 29 (7.2%) | 180 (17.4%) |
| 3 or 4 Children | 49 (40.5%) | 8 (7.7%) |
| 5 or more Children | 0 (0.0%) | 0 (0.0%) |
| Total | 78 (6.2%) | 300 (13.5%) |
Income Below Poverty Among Married-Couple vs Single-Parent Households in Leominster
The poverty data for Leominster shows that 298 of the married-couple family households (3.8%) and 378 of the single-parent households (10.8%) are living below the poverty level. Within the married-couple family households, those with 3 or 4 children have the highest poverty rate, with 92 households (20.0%) falling below the poverty line. Among the single-parent households, those with 3 or 4 children have the highest poverty rate, with 57 household (25.3%) living below poverty.
| Children | Married-Couple Families | Single-Parent Households |
| No Children | 99 (2.2%) | 112 (6.1%) |
| 1 or 2 Children | 107 (3.9%) | 209 (14.5%) |
| 3 or 4 Children | 92 (20.0%) | 57 (25.3%) |
| 5 or more Children | 0 (0.0%) | 0 (0.0%) |
| Total | 298 (3.8%) | 378 (10.8%) |
Race in Leominster
The most populous races in Leominster are White / Caucasian (33,403 | 76.6%), Hispanic or Latino (6,071 | 13.9%), and Two or more Races (4,393 | 10.1%).
| Race | # Population | % Population |
| Asian | 1,288 | 2.9% |
| Black / African American | 2,835 | 6.5% |
| Hawaiian / Pacific | 0 | 0.0% |
| Hispanic or Latino | 6,071 | 13.9% |
| Native / Alaskan | 45 | 0.1% |
| White / Caucasian | 33,403 | 76.6% |
| Two or more Races | 4,393 | 10.1% |
| Some other Race | 1,656 | 3.8% |
| Total | 43,620 | 100.0% |
Ancestry in Leominster
The most populous ancestries reported in Leominster are Irish (6,727 | 15.4%), Italian (6,377 | 14.6%), English (4,075 | 9.3%), French (3,507 | 8.0%), and French Canadian (2,759 | 6.3%), together accounting for 53.7% of all Leominster residents.
| Ancestry | # Population | % Population |
| African | 296 | 0.7% |
| Albanian | 19 | 0.0% |
| American | 2,123 | 4.9% |
| Arab | 450 | 1.0% |
| Argentinean | 72 | 0.2% |
| Armenian | 63 | 0.1% |
| Assyrian / Chaldean / Syriac | 21 | 0.1% |
| Bangladeshi | 206 | 0.5% |
| Basque | 170 | 0.4% |
| Bhutanese | 342 | 0.8% |
| Brazilian | 930 | 2.1% |
| British | 75 | 0.2% |
| Bulgarian | 41 | 0.1% |
| Burmese | 453 | 1.0% |
| Canadian | 384 | 0.9% |
| Cape Verdean | 57 | 0.1% |
| Central American | 1,082 | 2.5% |
| Central American Indian | 44 | 0.1% |
| Cherokee | 41 | 0.1% |
| Chilean | 86 | 0.2% |
| Colombian | 69 | 0.2% |
| Costa Rican | 85 | 0.2% |
| Creek | 22 | 0.1% |
| Croatian | 10 | 0.0% |
| Cuban | 152 | 0.4% |
| Czech | 49 | 0.1% |
| Czechoslovakian | 73 | 0.2% |
| Danish | 62 | 0.1% |
| Dominican | 235 | 0.5% |
| Dutch | 116 | 0.3% |
| Eastern European | 18 | 0.0% |
| Ecuadorian | 160 | 0.4% |
| Egyptian | 40 | 0.1% |
| English | 4,075 | 9.3% |
| Ethiopian | 50 | 0.1% |
| European | 308 | 0.7% |
| Filipino | 48 | 0.1% |
| Finnish | 262 | 0.6% |
| French | 3,507 | 8.0% |
| French American Indian | 8 | 0.0% |
| French Canadian | 2,759 | 6.3% |
| German | 2,524 | 5.8% |
| Ghanaian | 282 | 0.6% |
| Greek | 399 | 0.9% |
| Guatemalan | 310 | 0.7% |
| Haitian | 89 | 0.2% |
| Honduran | 316 | 0.7% |
| Hungarian | 79 | 0.2% |
| Icelander | 11 | 0.0% |
| Indian (Asian) | 256 | 0.6% |
| Iranian | 2 | 0.0% |
| Irish | 6,727 | 15.4% |
| Italian | 6,377 | 14.6% |
| Jamaican | 310 | 0.7% |
| Japanese | 22 | 0.1% |
| Kenyan | 75 | 0.2% |
| Korean | 251 | 0.6% |
| Lebanese | 376 | 0.9% |
| Lithuanian | 238 | 0.5% |
| Malaysian | 199 | 0.5% |
| Mexican | 526 | 1.2% |
| Native Hawaiian | 14 | 0.0% |
| Nigerian | 123 | 0.3% |
| Northern European | 19 | 0.0% |
| Norwegian | 119 | 0.3% |
| Panamanian | 10 | 0.0% |
| Peruvian | 54 | 0.1% |
| Polish | 1,195 | 2.7% |
| Portuguese | 806 | 1.8% |
| Puerto Rican | 2,583 | 5.9% |
| Romanian | 11 | 0.0% |
| Russian | 375 | 0.9% |
| Salvadoran | 361 | 0.8% |
| Scandinavian | 39 | 0.1% |
| Scotch-Irish | 191 | 0.4% |
| Scottish | 874 | 2.0% |
| Seminole | 22 | 0.1% |
| Slovak | 41 | 0.1% |
| South American | 1,199 | 2.8% |
| Spaniard | 8 | 0.0% |
| Spanish | 65 | 0.2% |
| Sri Lankan | 160 | 0.4% |
| Subsaharan African | 1,110 | 2.5% |
| Swedish | 614 | 1.4% |
| Swiss | 32 | 0.1% |
| Syrian | 21 | 0.1% |
| Thai | 183 | 0.4% |
| Trinidadian and Tobagonian | 22 | 0.1% |
| Ugandan | 198 | 0.4% |
| Ukrainian | 70 | 0.2% |
| Uruguayan | 366 | 0.8% |
| Venezuelan | 49 | 0.1% |
| Welsh | 95 | 0.2% |
| West Indian | 21 | 0.1% |
| Yugoslavian | 82 | 0.2% | View All 95 Rows |
Immigrants in Leominster
The most numerous immigrant groups reported in Leominster came from Latin America (2,826 | 6.5%), South America (1,748 | 4.0%), Africa (1,297 | 3.0%), Brazil (941 | 2.2%), and Asia (879 | 2.0%), together accounting for 17.6% of all Leominster residents.
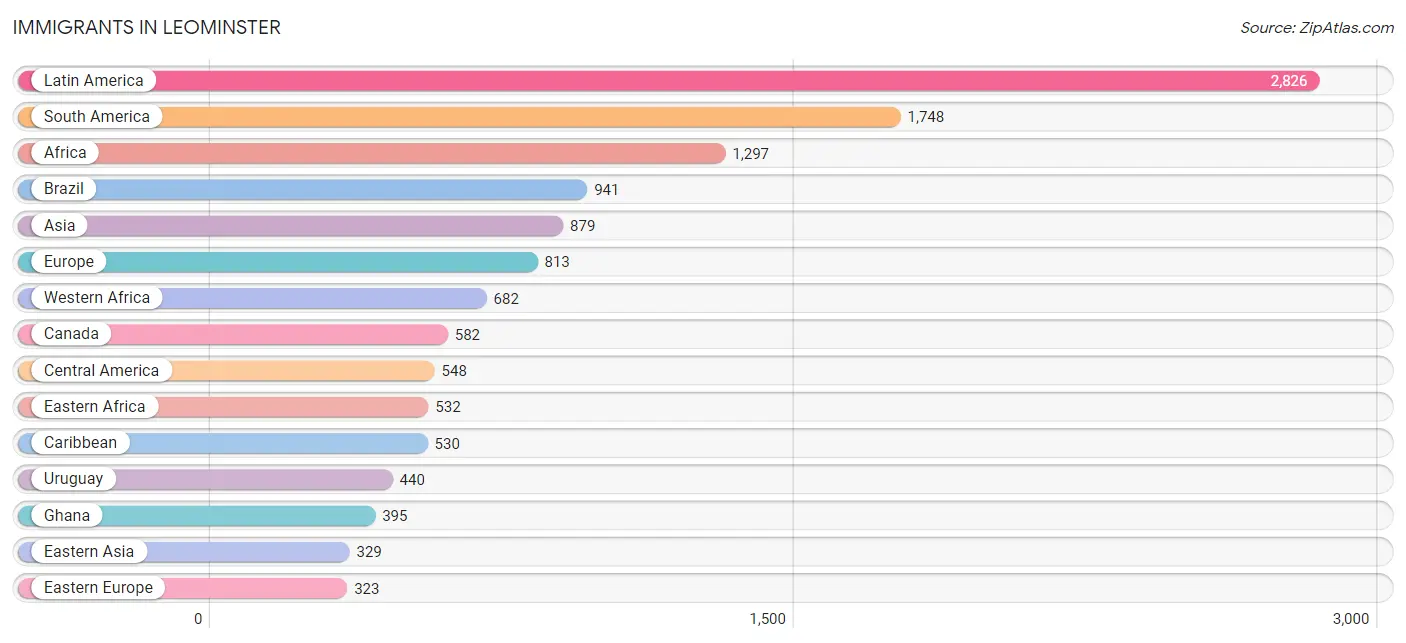
| Immigration Origin | # Population | % Population |
| Africa | 1,297 | 3.0% |
| Albania | 19 | 0.0% |
| Argentina | 97 | 0.2% |
| Asia | 879 | 2.0% |
| Azores | 35 | 0.1% |
| Barbados | 61 | 0.1% |
| Brazil | 941 | 2.2% |
| Bulgaria | 32 | 0.1% |
| Cabo Verde | 164 | 0.4% |
| Cambodia | 13 | 0.0% |
| Cameroon | 30 | 0.1% |
| Canada | 582 | 1.3% |
| Caribbean | 530 | 1.2% |
| Central America | 548 | 1.3% |
| Chile | 70 | 0.2% |
| China | 105 | 0.2% |
| Colombia | 68 | 0.2% |
| Costa Rica | 32 | 0.1% |
| Cuba | 134 | 0.3% |
| Dominican Republic | 126 | 0.3% |
| Eastern Africa | 532 | 1.2% |
| Eastern Asia | 329 | 0.7% |
| Eastern Europe | 323 | 0.7% |
| Ecuador | 29 | 0.1% |
| Egypt | 40 | 0.1% |
| El Salvador | 132 | 0.3% |
| Ethiopia | 11 | 0.0% |
| Europe | 813 | 1.9% |
| Germany | 180 | 0.4% |
| Ghana | 395 | 0.9% |
| Guatemala | 42 | 0.1% |
| Haiti | 142 | 0.3% |
| Honduras | 258 | 0.6% |
| Hong Kong | 42 | 0.1% |
| Hungary | 24 | 0.1% |
| India | 176 | 0.4% |
| Iran | 2 | 0.0% |
| Israel | 8 | 0.0% |
| Italy | 116 | 0.3% |
| Jamaica | 24 | 0.1% |
| Japan | 26 | 0.1% |
| Kenya | 294 | 0.7% |
| Korea | 198 | 0.4% |
| Laos | 12 | 0.0% |
| Latin America | 2,826 | 6.5% |
| Lebanon | 35 | 0.1% |
| Mexico | 84 | 0.2% |
| Middle Africa | 30 | 0.1% |
| Nepal | 17 | 0.0% |
| Nigeria | 123 | 0.3% |
| Northern Africa | 40 | 0.1% |
| Northern Europe | 124 | 0.3% |
| Peru | 54 | 0.1% |
| Philippines | 134 | 0.3% |
| Poland | 19 | 0.0% |
| Portugal | 70 | 0.2% |
| Russia | 8 | 0.0% |
| Scotland | 69 | 0.2% |
| South Africa | 13 | 0.0% |
| South America | 1,748 | 4.0% |
| South Central Asia | 195 | 0.4% |
| South Eastern Asia | 282 | 0.6% |
| Southern Europe | 186 | 0.4% |
| Syria | 11 | 0.0% |
| Taiwan | 48 | 0.1% |
| Thailand | 23 | 0.1% |
| Trinidad and Tobago | 36 | 0.1% |
| Turkey | 10 | 0.0% |
| Uganda | 198 | 0.4% |
| Ukraine | 221 | 0.5% |
| Uruguay | 440 | 1.0% |
| Venezuela | 49 | 0.1% |
| Vietnam | 100 | 0.2% |
| Western Africa | 682 | 1.6% |
| Western Asia | 73 | 0.2% |
| Western Europe | 180 | 0.4% | View All 76 Rows |
Sex and Age in Leominster
Sex and Age in Leominster
The most populous age groups in Leominster are 25 to 29 Years (1,803 | 8.1%) for men and 60 to 64 Years (1,934 | 9.0%) for women.
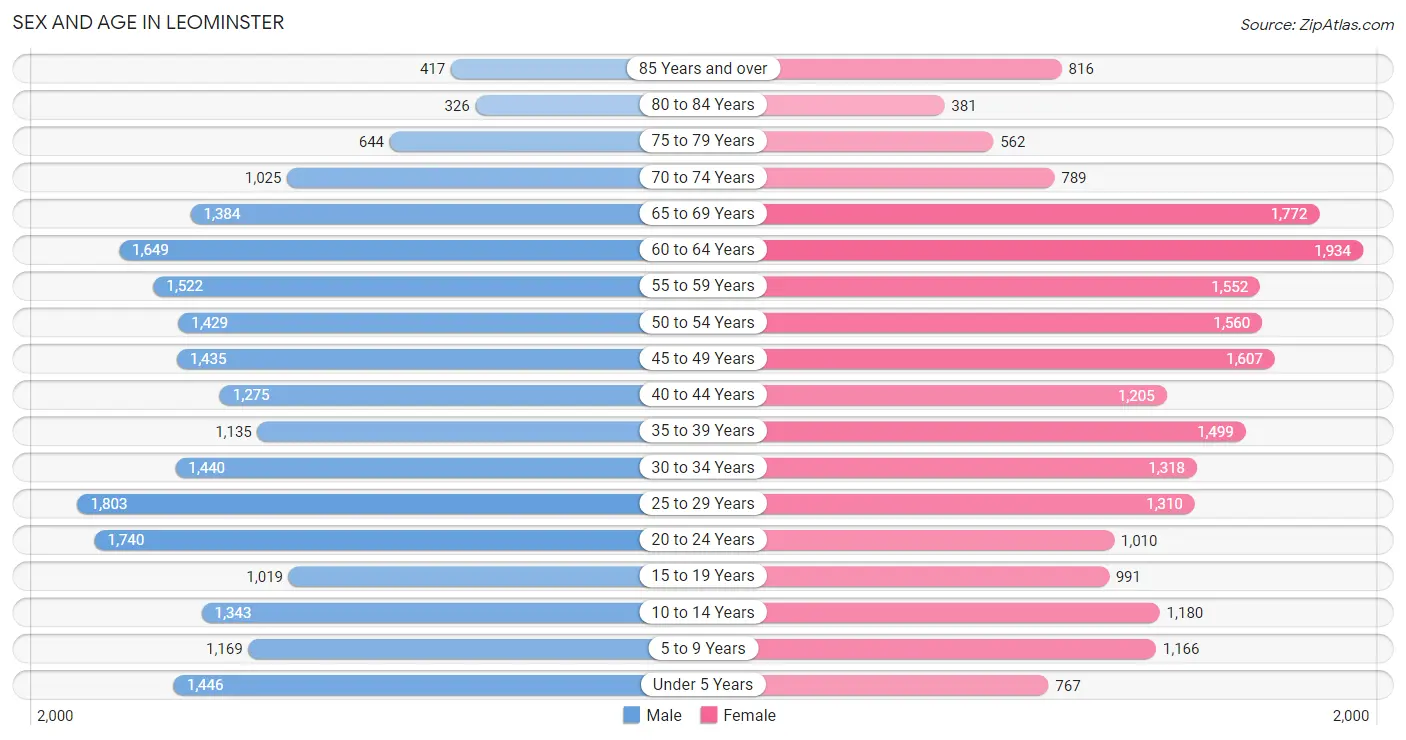
| Age Bracket | Male | Female |
| Under 5 Years | 1,446 (6.5%) | 767 (3.6%) |
| 5 to 9 Years | 1,169 (5.3%) | 1,166 (5.4%) |
| 10 to 14 Years | 1,343 (6.0%) | 1,180 (5.5%) |
| 15 to 19 Years | 1,019 (4.6%) | 991 (4.6%) |
| 20 to 24 Years | 1,740 (7.8%) | 1,010 (4.7%) |
| 25 to 29 Years | 1,803 (8.1%) | 1,310 (6.1%) |
| 30 to 34 Years | 1,440 (6.5%) | 1,318 (6.1%) |
| 35 to 39 Years | 1,135 (5.1%) | 1,499 (7.0%) |
| 40 to 44 Years | 1,275 (5.7%) | 1,205 (5.6%) |
| 45 to 49 Years | 1,435 (6.5%) | 1,607 (7.5%) |
| 50 to 54 Years | 1,429 (6.4%) | 1,560 (7.3%) |
| 55 to 59 Years | 1,522 (6.9%) | 1,552 (7.2%) |
| 60 to 64 Years | 1,649 (7.4%) | 1,934 (9.0%) |
| 65 to 69 Years | 1,384 (6.2%) | 1,772 (8.3%) |
| 70 to 74 Years | 1,025 (4.6%) | 789 (3.7%) |
| 75 to 79 Years | 644 (2.9%) | 562 (2.6%) |
| 80 to 84 Years | 326 (1.5%) | 381 (1.8%) |
| 85 Years and over | 417 (1.9%) | 816 (3.8%) |
| Total | 22,201 (100.0%) | 21,419 (100.0%) |
Families and Households in Leominster
Median Family Size in Leominster
The median family size in Leominster is 3.01 persons per family, with married-couple families (7,748 | 69.0%) accounting for the largest median family size of 3.12 persons per family. On the other hand, single female/mother families (2,228 | 19.8%) represent the smallest median family size with 2.63 persons per family.
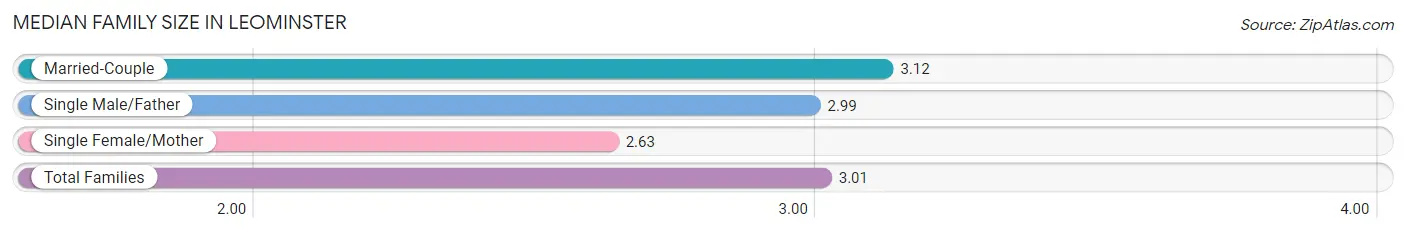
| Family Type | # Families | Family Size |
| Married-Couple | 7,748 (69.0%) | 3.12 |
| Single Male/Father | 1,256 (11.2%) | 2.99 |
| Single Female/Mother | 2,228 (19.8%) | 2.63 |
| Total Families | 11,232 (100.0%) | 3.01 |
Median Household Size in Leominster
The median household size in Leominster is 2.34 persons per household, with single male/father households (1,256 | 6.8%) accounting for the largest median household size of 3.27 persons per household. non-family households (7,242 | 39.2%) represent the smallest median household size with 1.19 persons per household.
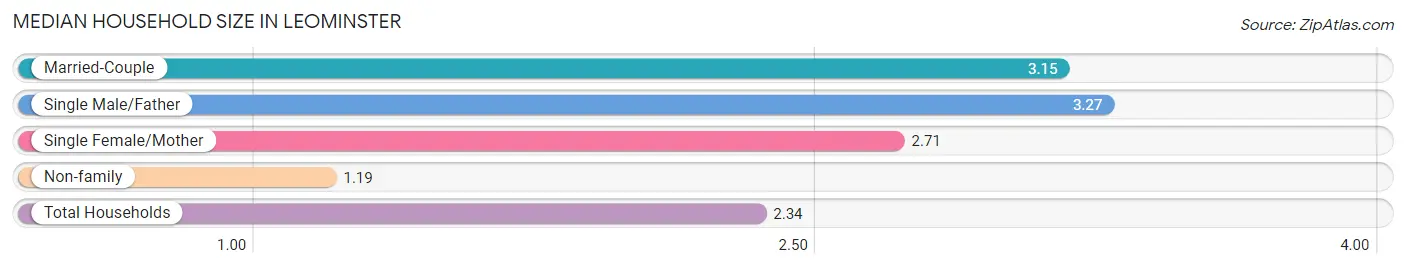
| Household Type | # Households | Household Size |
| Married-Couple | 7,748 (41.9%) | 3.15 |
| Single Male/Father | 1,256 (6.8%) | 3.27 |
| Single Female/Mother | 2,228 (12.1%) | 2.71 |
| Non-family | 7,242 (39.2%) | 1.19 |
| Total Households | 18,474 (100.0%) | 2.34 |
Household Size by Marriage Status in Leominster
Out of a total of 18,474 households in Leominster, 11,232 (60.8%) are family households, while 7,242 (39.2%) are nonfamily households. The most numerous type of family households are 2-person households, comprising 5,340, and the most common type of nonfamily households are 1-person households, comprising 5,989.
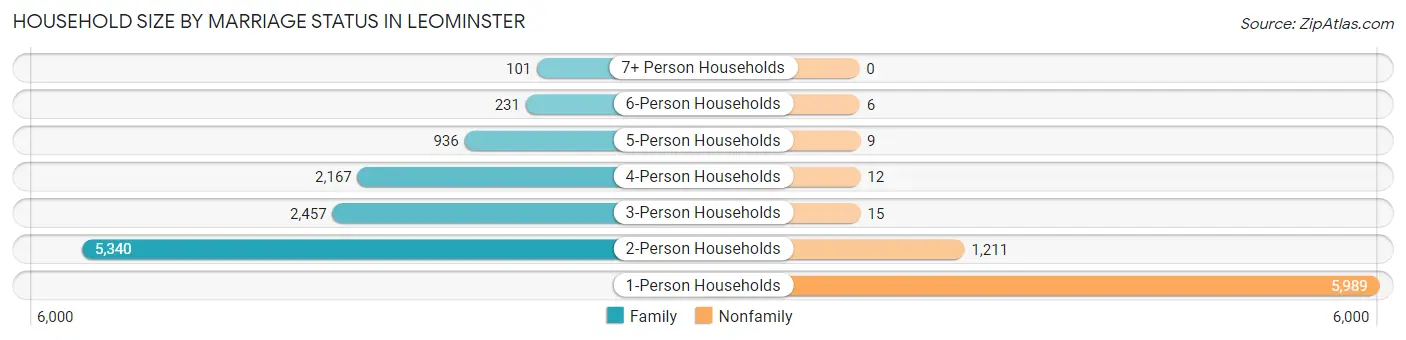
| Household Size | Family Households | Nonfamily Households |
| 1-Person Households | - | 5,989 (32.4%) |
| 2-Person Households | 5,340 (28.9%) | 1,211 (6.6%) |
| 3-Person Households | 2,457 (13.3%) | 15 (0.1%) |
| 4-Person Households | 2,167 (11.7%) | 12 (0.1%) |
| 5-Person Households | 936 (5.1%) | 9 (0.1%) |
| 6-Person Households | 231 (1.3%) | 6 (0.0%) |
| 7+ Person Households | 101 (0.5%) | 0 (0.0%) |
| Total | 11,232 (60.8%) | 7,242 (39.2%) |
Female Fertility in Leominster
Fertility by Age in Leominster
Average fertility rate in Leominster is 53.0 births per 1,000 women. Women in the age bracket of 20 to 34 years have the highest fertility rate with 107.0 births per 1,000 women. Women in the age bracket of 20 to 34 years acount for 80.2% of all women with births.
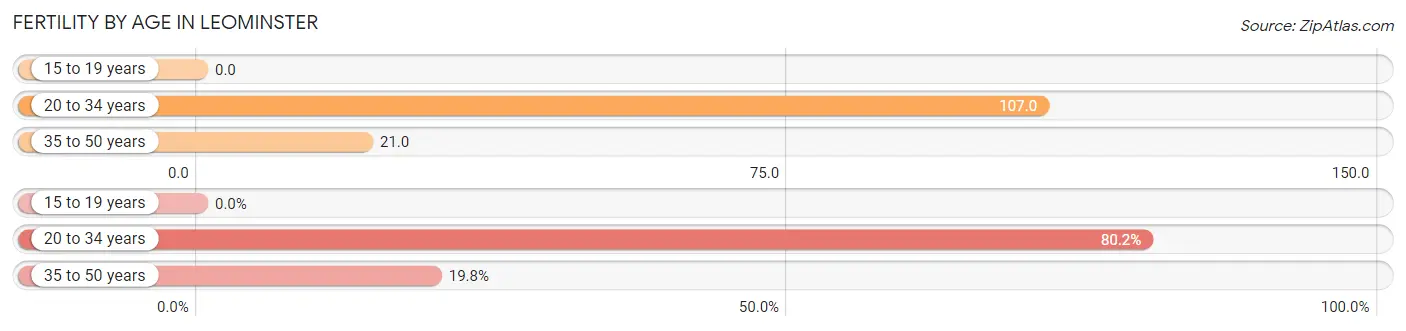
| Age Bracket | Women with Births | Births / 1,000 Women |
| 15 to 19 years | 0 (0.0%) | 0.0 |
| 20 to 34 years | 388 (80.2%) | 107.0 |
| 35 to 50 years | 96 (19.8%) | 21.0 |
| Total | 484 (100.0%) | 53.0 |
Fertility by Age by Marriage Status in Leominster
49.4% of women with births (484) in Leominster are married. The highest percentage of unmarried women with births falls into 20 to 34 years age bracket with 59.8% of them unmarried at the time of birth, while the lowest percentage of unmarried women with births belong to 35 to 50 years age bracket with 13.5% of them unmarried.
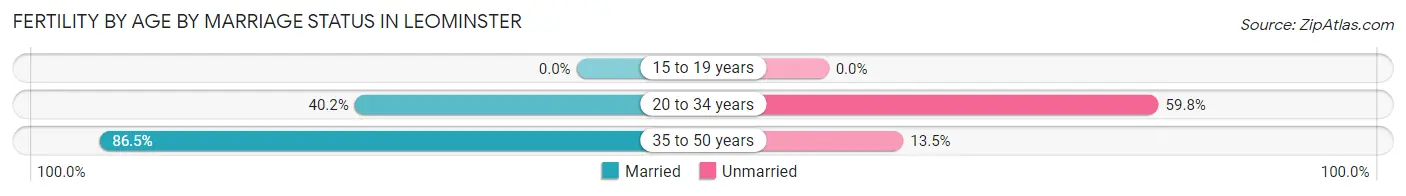
| Age Bracket | Married | Unmarried |
| 15 to 19 years | 0 (0.0%) | 0 (0.0%) |
| 20 to 34 years | 156 (40.2%) | 232 (59.8%) |
| 35 to 50 years | 83 (86.5%) | 13 (13.5%) |
| Total | 239 (49.4%) | 245 (50.6%) |
Fertility by Education in Leominster
Average fertility rate in Leominster is 53.0 births per 1,000 women. Women with the education attainment of high school diploma have the highest fertility rate of 66.0 births per 1,000 women, while women with the education attainment of less than high school have the lowest fertility at 11.0 births per 1,000 women. Women with the education attainment of college or associate's degree represent 31.0% of all women with births.
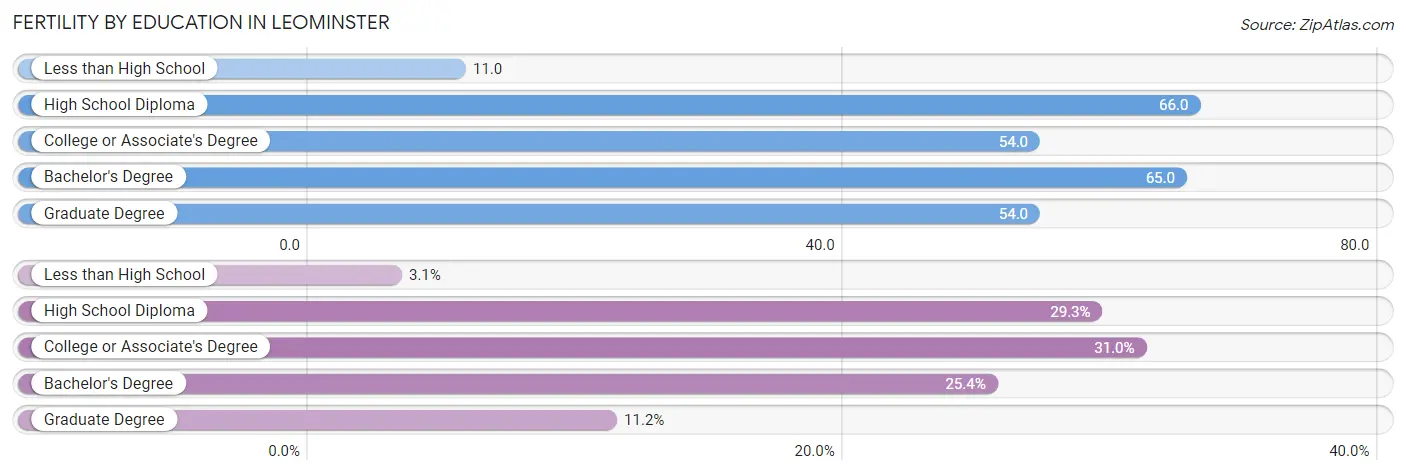
| Educational Attainment | Women with Births | Births / 1,000 Women |
| Less than High School | 15 (3.1%) | 11.0 |
| High School Diploma | 142 (29.3%) | 66.0 |
| College or Associate's Degree | 150 (31.0%) | 54.0 |
| Bachelor's Degree | 123 (25.4%) | 65.0 |
| Graduate Degree | 54 (11.2%) | 54.0 |
| Total | 484 (100.0%) | 53.0 |
Fertility by Education by Marriage Status in Leominster
50.6% of women with births in Leominster are unmarried. Women with the educational attainment of less than high school are most likely to be married with 100.0% of them married at childbirth, while women with the educational attainment of college or associate's degree are least likely to be married with 81.3% of them unmarried at childbirth.
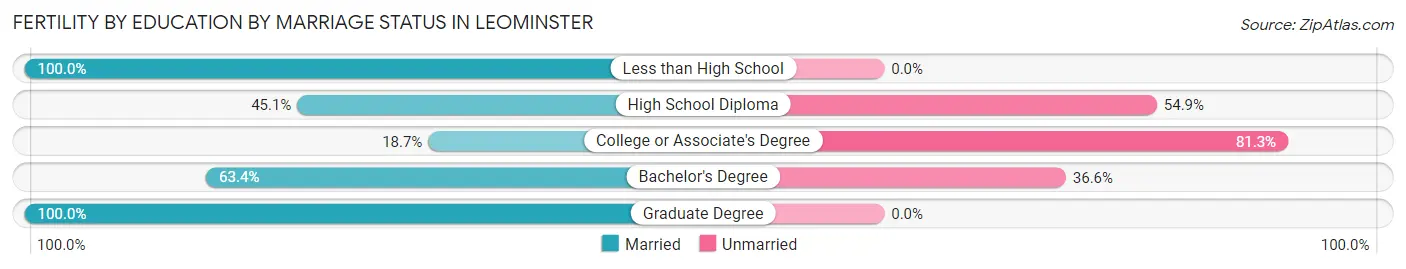
| Educational Attainment | Married | Unmarried |
| Less than High School | 15 (100.0%) | 0 (0.0%) |
| High School Diploma | 64 (45.1%) | 78 (54.9%) |
| College or Associate's Degree | 28 (18.7%) | 122 (81.3%) |
| Bachelor's Degree | 78 (63.4%) | 45 (36.6%) |
| Graduate Degree | 54 (100.0%) | 0 (0.0%) |
| Total | 239 (49.4%) | 245 (50.6%) |
Employment Characteristics in Leominster
Employment by Class of Employer in Leominster
Among the 22,514 employed individuals in Leominster, private company employees (15,879 | 70.5%), not-for-profit organizations (2,379 | 10.6%), and local government employees (1,505 | 6.7%) make up the most common classes of employment.
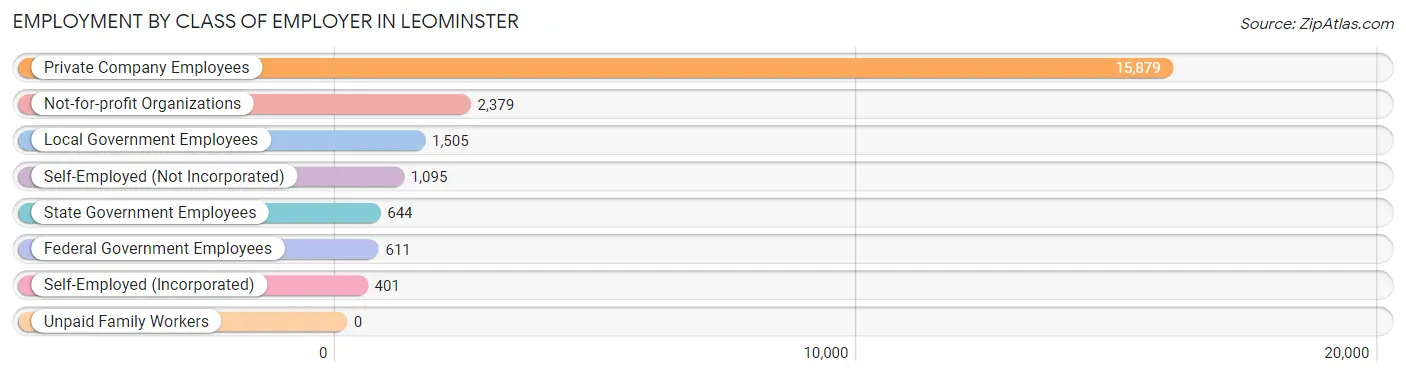
| Employer Class | # Employees | % Employees |
| Private Company Employees | 15,879 | 70.5% |
| Self-Employed (Incorporated) | 401 | 1.8% |
| Self-Employed (Not Incorporated) | 1,095 | 4.9% |
| Not-for-profit Organizations | 2,379 | 10.6% |
| Local Government Employees | 1,505 | 6.7% |
| State Government Employees | 644 | 2.9% |
| Federal Government Employees | 611 | 2.7% |
| Unpaid Family Workers | 0 | 0.0% |
| Total | 22,514 | 100.0% |
Employment Status by Age in Leominster
According to the labor force statistics for Leominster, out of the total population over 16 years of age (36,108), 67.5% or 24,373 individuals are in the labor force, with 6.0% or 1,462 of them unemployed. The age group with the highest labor force participation rate is 45 to 54 years, with 89.0% or 5,368 individuals in the labor force. Within the labor force, the 16 to 19 years age range has the highest percentage of unemployed individuals, with 10.3% or 92 of them being unemployed.
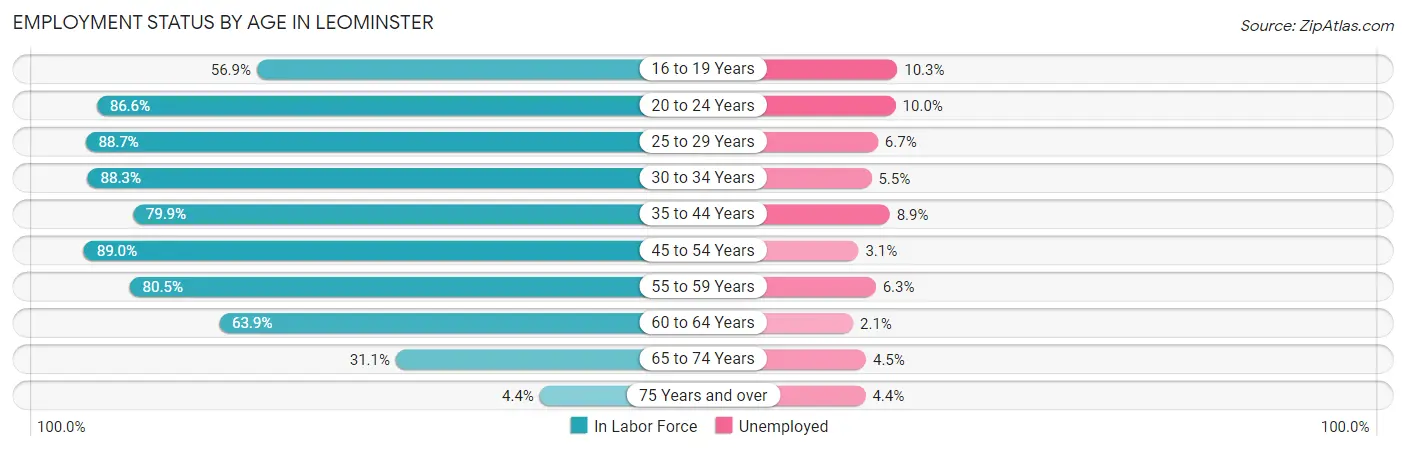
| Age Bracket | In Labor Force | Unemployed |
| 16 to 19 Years | 893 (56.9%) | 92 (10.3%) |
| 20 to 24 Years | 2,381 (86.6%) | 238 (10.0%) |
| 25 to 29 Years | 2,761 (88.7%) | 185 (6.7%) |
| 30 to 34 Years | 2,435 (88.3%) | 134 (5.5%) |
| 35 to 44 Years | 4,086 (79.9%) | 364 (8.9%) |
| 45 to 54 Years | 5,368 (89.0%) | 166 (3.1%) |
| 55 to 59 Years | 2,475 (80.5%) | 156 (6.3%) |
| 60 to 64 Years | 2,290 (63.9%) | 48 (2.1%) |
| 65 to 74 Years | 1,546 (31.1%) | 70 (4.5%) |
| 75 Years and over | 138 (4.4%) | 6 (4.4%) |
| Total | 24,373 (67.5%) | 1,462 (6.0%) |
Employment Status by Educational Attainment in Leominster
According to labor force statistics for Leominster, 82.0% of individuals (19,412) out of the total population between 25 and 64 years of age (23,673) are in the labor force, with 5.4% or 1,048 of them being unemployed. The group with the highest labor force participation rate are those with the educational attainment of bachelor's degree or higher, with 87.4% or 7,486 individuals in the labor force. Within the labor force, individuals with high school diploma education have the highest percentage of unemployment, with 9.5% or 470 of them being unemployed.
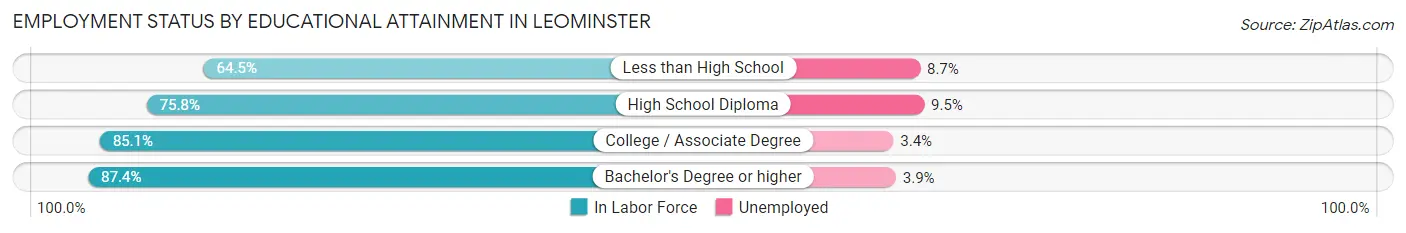
| Educational Attainment | In Labor Force | Unemployed |
| Less than High School | 1,029 (64.5%) | 139 (8.7%) |
| High School Diploma | 4,945 (75.8%) | 620 (9.5%) |
| College / Associate Degree | 5,947 (85.1%) | 238 (3.4%) |
| Bachelor's Degree or higher | 7,486 (87.4%) | 334 (3.9%) |
| Total | 19,412 (82.0%) | 1,278 (5.4%) |
Employment Occupations by Sex in Leominster
Management, Business, Science and Arts Occupations
The most common Management, Business, Science and Arts occupations in Leominster are Community & Social Service (2,666 | 11.7%), Management (2,258 | 9.9%), Computers, Engineering & Science (1,746 | 7.6%), Education Instruction & Library (1,537 | 6.7%), and Health Diagnosing & Treating (1,464 | 6.4%).
Management, Business, Science and Arts Occupations by Sex
Within the Management, Business, Science and Arts occupations in Leominster, the most male-oriented occupations are Computers & Mathematics (81.7%), Architecture & Engineering (78.6%), and Computers, Engineering & Science (75.2%), while the most female-oriented occupations are Health Technologists (82.7%), Education Instruction & Library (78.8%), and Health Diagnosing & Treating (77.5%).
| Occupation | Male | Female |
| Management | 1,449 (64.2%) | 809 (35.8%) |
| Business & Financial | 688 (55.2%) | 558 (44.8%) |
| Computers, Engineering & Science | 1,313 (75.2%) | 433 (24.8%) |
| Computers & Mathematics | 687 (81.7%) | 154 (18.3%) |
| Architecture & Engineering | 488 (78.6%) | 133 (21.4%) |
| Life, Physical & Social Science | 138 (48.6%) | 146 (51.4%) |
| Community & Social Service | 880 (33.0%) | 1,786 (67.0%) |
| Education, Arts & Media | 182 (39.1%) | 283 (60.9%) |
| Legal Services & Support | 50 (26.9%) | 136 (73.1%) |
| Education Instruction & Library | 326 (21.2%) | 1,211 (78.8%) |
| Arts, Media & Entertainment | 322 (67.4%) | 156 (32.6%) |
| Health Diagnosing & Treating | 329 (22.5%) | 1,135 (77.5%) |
| Health Technologists | 161 (17.3%) | 772 (82.7%) |
| Total (Category) | 4,659 (49.7%) | 4,721 (50.3%) |
| Total (Overall) | 11,885 (52.0%) | 10,956 (48.0%) |
Services Occupations
The most common Services occupations in Leominster are Healthcare Support (1,229 | 5.4%), Food Preparation & Serving (957 | 4.2%), Cleaning & Maintenance (633 | 2.8%), Personal Care & Service (595 | 2.6%), and Security & Protection (551 | 2.4%).
Services Occupations by Sex
Within the Services occupations in Leominster, the most male-oriented occupations are Law Enforcement (98.3%), Security & Protection (79.3%), and Cleaning & Maintenance (64.0%), while the most female-oriented occupations are Personal Care & Service (89.7%), Healthcare Support (81.0%), and Food Preparation & Serving (67.9%).
| Occupation | Male | Female |
| Healthcare Support | 234 (19.0%) | 995 (81.0%) |
| Security & Protection | 437 (79.3%) | 114 (20.7%) |
| Firefighting & Prevention | 145 (57.1%) | 109 (42.9%) |
| Law Enforcement | 292 (98.3%) | 5 (1.7%) |
| Food Preparation & Serving | 307 (32.1%) | 650 (67.9%) |
| Cleaning & Maintenance | 405 (64.0%) | 228 (36.0%) |
| Personal Care & Service | 61 (10.2%) | 534 (89.7%) |
| Total (Category) | 1,444 (36.4%) | 2,521 (63.6%) |
| Total (Overall) | 11,885 (52.0%) | 10,956 (48.0%) |
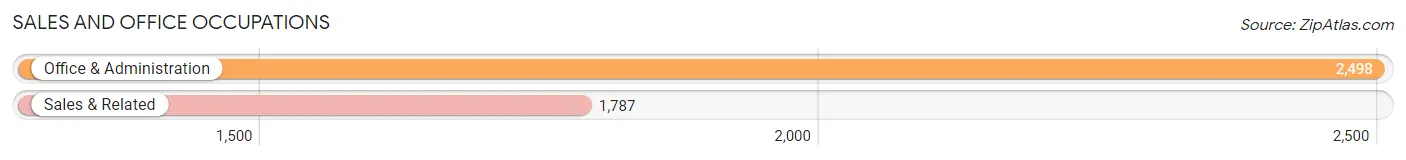
Sales and Office Occupations
The most common Sales and Office occupations in Leominster are Office & Administration (2,498 | 10.9%), and Sales & Related (1,787 | 7.8%).
Sales and Office Occupations by Sex
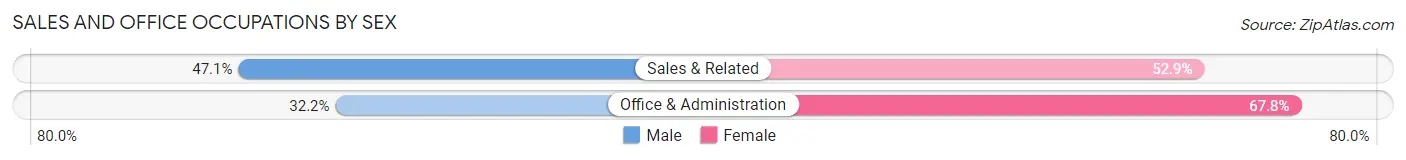
| Occupation | Male | Female |
| Sales & Related | 842 (47.1%) | 945 (52.9%) |
| Office & Administration | 804 (32.2%) | 1,694 (67.8%) |
| Total (Category) | 1,646 (38.4%) | 2,639 (61.6%) |
| Total (Overall) | 11,885 (52.0%) | 10,956 (48.0%) |
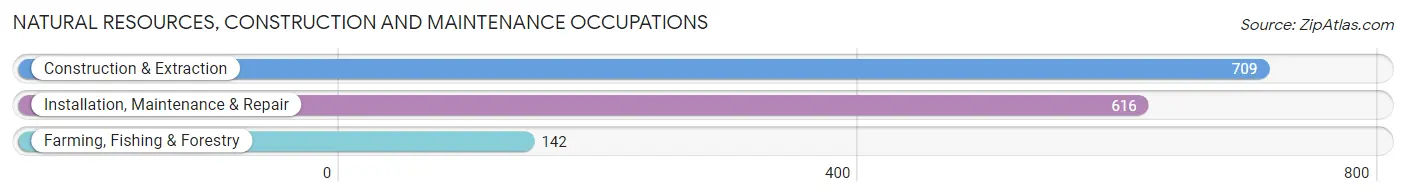
Natural Resources, Construction and Maintenance Occupations
The most common Natural Resources, Construction and Maintenance occupations in Leominster are Construction & Extraction (709 | 3.1%), Installation, Maintenance & Repair (616 | 2.7%), and Farming, Fishing & Forestry (142 | 0.6%).
Natural Resources, Construction and Maintenance Occupations by Sex
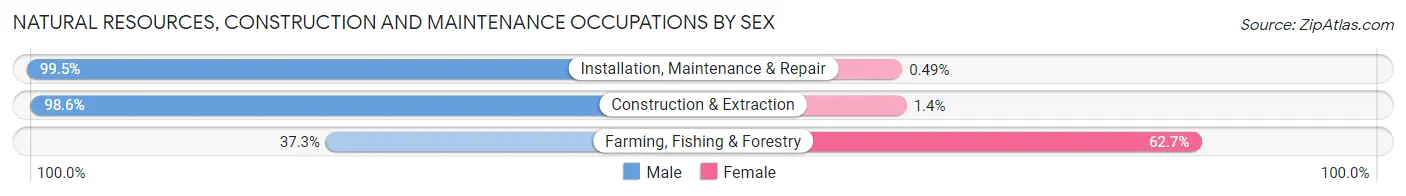
| Occupation | Male | Female |
| Farming, Fishing & Forestry | 53 (37.3%) | 89 (62.7%) |
| Construction & Extraction | 699 (98.6%) | 10 (1.4%) |
| Installation, Maintenance & Repair | 613 (99.5%) | 3 (0.5%) |
| Total (Category) | 1,365 (93.0%) | 102 (7.0%) |
| Total (Overall) | 11,885 (52.0%) | 10,956 (48.0%) |
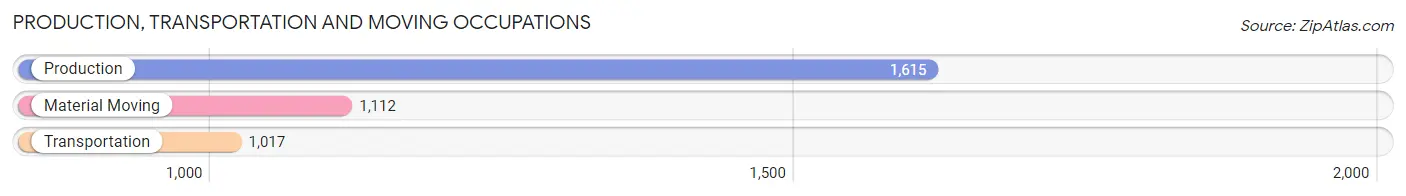
Production, Transportation and Moving Occupations
The most common Production, Transportation and Moving occupations in Leominster are Production (1,615 | 7.1%), Material Moving (1,112 | 4.9%), and Transportation (1,017 | 4.4%).
Production, Transportation and Moving Occupations by Sex
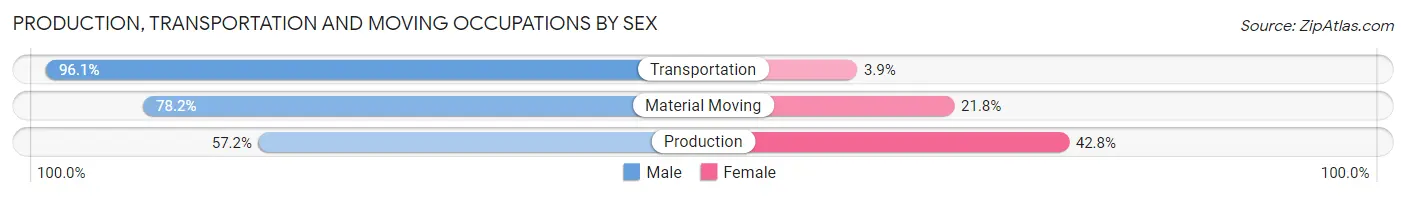
| Occupation | Male | Female |
| Production | 924 (57.2%) | 691 (42.8%) |
| Transportation | 977 (96.1%) | 40 (3.9%) |
| Material Moving | 870 (78.2%) | 242 (21.8%) |
| Total (Category) | 2,771 (74.0%) | 973 (26.0%) |
| Total (Overall) | 11,885 (52.0%) | 10,956 (48.0%) |
Employment Industries by Sex in Leominster
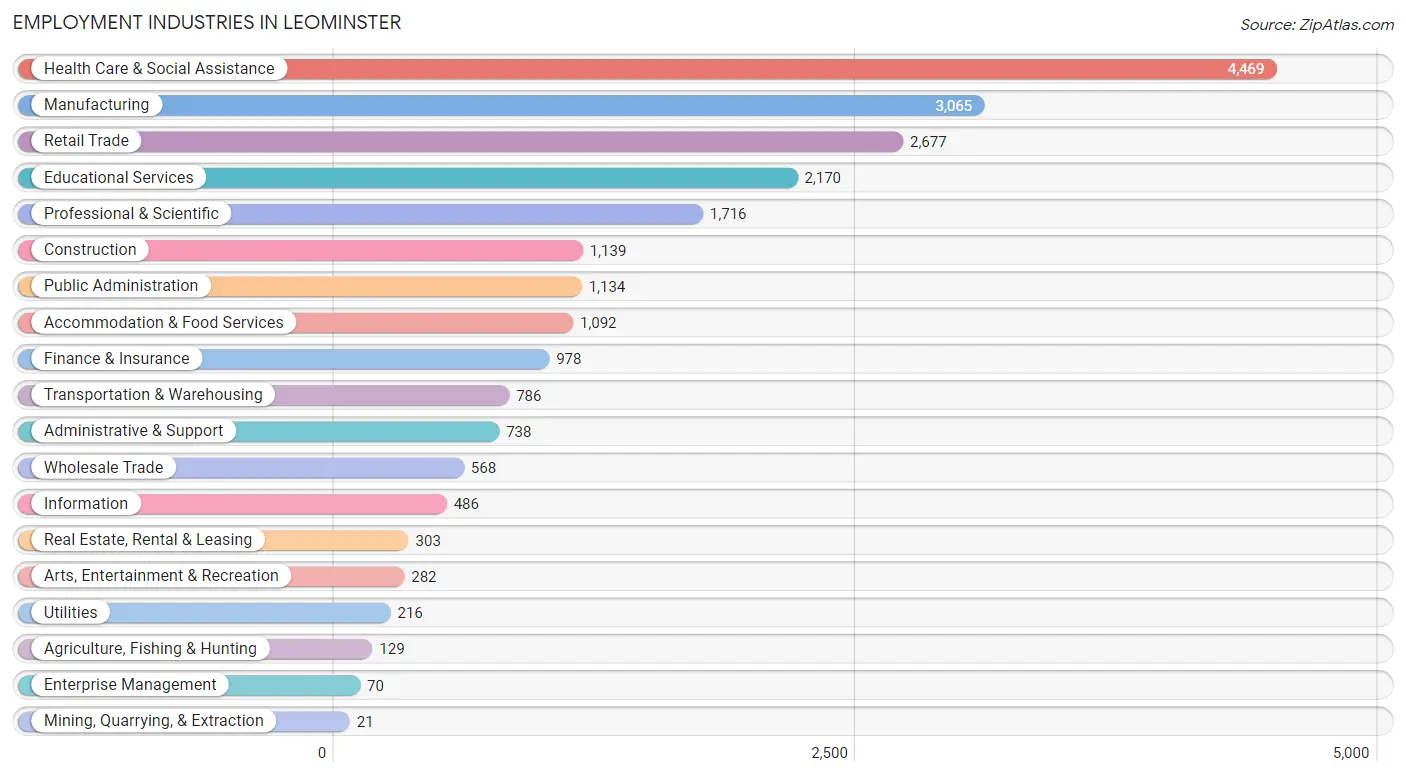
Employment Industries in Leominster
The major employment industries in Leominster include Health Care & Social Assistance (4,469 | 19.6%), Manufacturing (3,065 | 13.4%), Retail Trade (2,677 | 11.7%), Educational Services (2,170 | 9.5%), and Professional & Scientific (1,716 | 7.5%).
Employment Industries by Sex in Leominster
The Leominster industries that see more men than women are Mining, Quarrying, & Extraction (100.0%), Construction (88.6%), and Transportation & Warehousing (87.3%), whereas the industries that tend to have a higher number of women are Health Care & Social Assistance (79.4%), Arts, Entertainment & Recreation (74.5%), and Educational Services (63.9%).
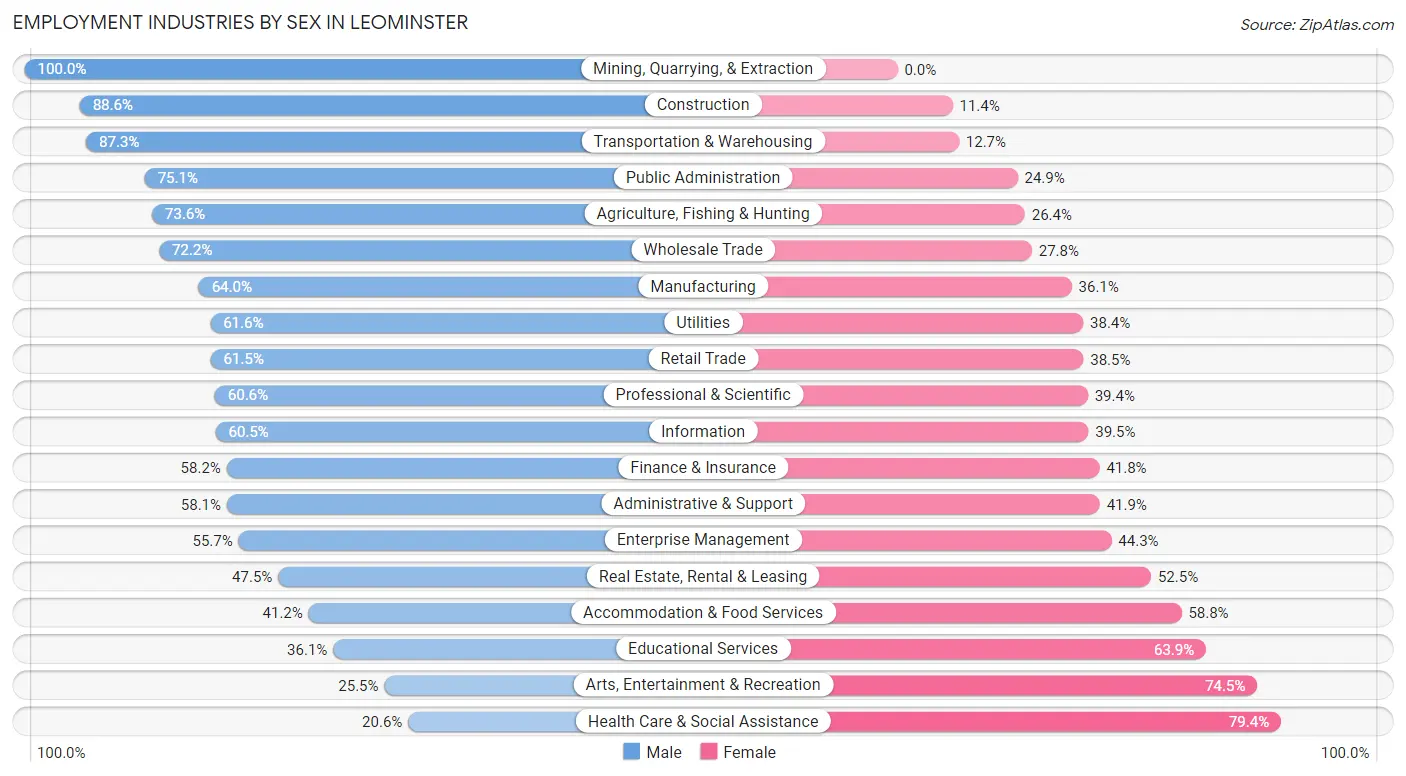
| Industry | Male | Female |
| Agriculture, Fishing & Hunting | 95 (73.6%) | 34 (26.4%) |
| Mining, Quarrying, & Extraction | 21 (100.0%) | 0 (0.0%) |
| Construction | 1,009 (88.6%) | 130 (11.4%) |
| Manufacturing | 1,960 (63.9%) | 1,105 (36.0%) |
| Wholesale Trade | 410 (72.2%) | 158 (27.8%) |
| Retail Trade | 1,647 (61.5%) | 1,030 (38.5%) |
| Transportation & Warehousing | 686 (87.3%) | 100 (12.7%) |
| Utilities | 133 (61.6%) | 83 (38.4%) |
| Information | 294 (60.5%) | 192 (39.5%) |
| Finance & Insurance | 569 (58.2%) | 409 (41.8%) |
| Real Estate, Rental & Leasing | 144 (47.5%) | 159 (52.5%) |
| Professional & Scientific | 1,040 (60.6%) | 676 (39.4%) |
| Enterprise Management | 39 (55.7%) | 31 (44.3%) |
| Administrative & Support | 429 (58.1%) | 309 (41.9%) |
| Educational Services | 784 (36.1%) | 1,386 (63.9%) |
| Health Care & Social Assistance | 921 (20.6%) | 3,548 (79.4%) |
| Arts, Entertainment & Recreation | 72 (25.5%) | 210 (74.5%) |
| Accommodation & Food Services | 450 (41.2%) | 642 (58.8%) |
| Public Administration | 852 (75.1%) | 282 (24.9%) |
| Total | 11,885 (52.0%) | 10,956 (48.0%) |
Education in Leominster
School Enrollment in Leominster
The most common levels of schooling among the 8,510 students in Leominster are elementary school (1,992 | 23.4%), middle school (1,844 | 21.7%), and high school (1,791 | 21.0%).
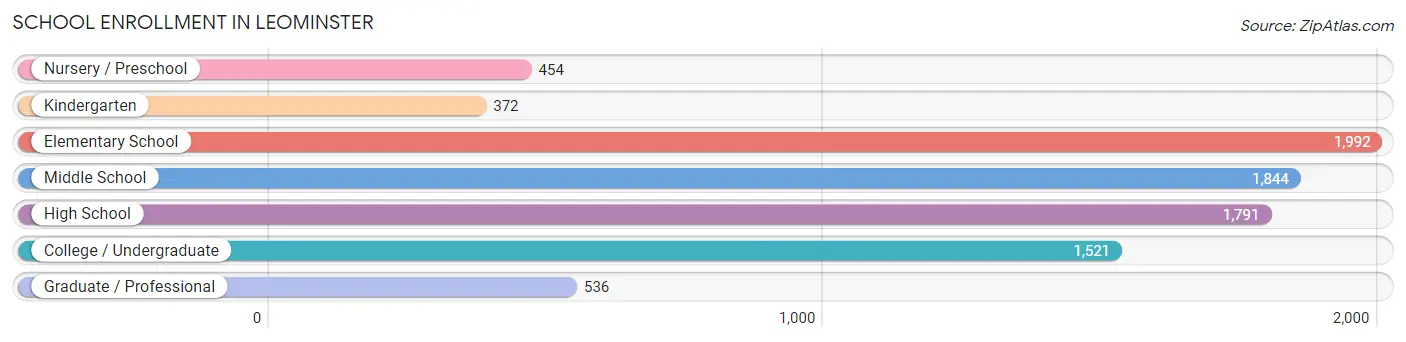
| School Level | # Students | % Students |
| Nursery / Preschool | 454 | 5.3% |
| Kindergarten | 372 | 4.4% |
| Elementary School | 1,992 | 23.4% |
| Middle School | 1,844 | 21.7% |
| High School | 1,791 | 21.0% |
| College / Undergraduate | 1,521 | 17.9% |
| Graduate / Professional | 536 | 6.3% |
| Total | 8,510 | 100.0% |
School Enrollment by Age by Funding Source in Leominster
Out of a total of 8,510 students who are enrolled in schools in Leominster, 1,515 (17.8%) attend a private institution, while the remaining 6,995 (82.2%) are enrolled in public schools. The age group of 35 years and over has the highest likelihood of being enrolled in private schools, with 359 (51.5% in the age bracket) enrolled. Conversely, the age group of 15 to 17 year olds has the lowest likelihood of being enrolled in a private school, with 1,166 (96.2% in the age bracket) attending a public institution.
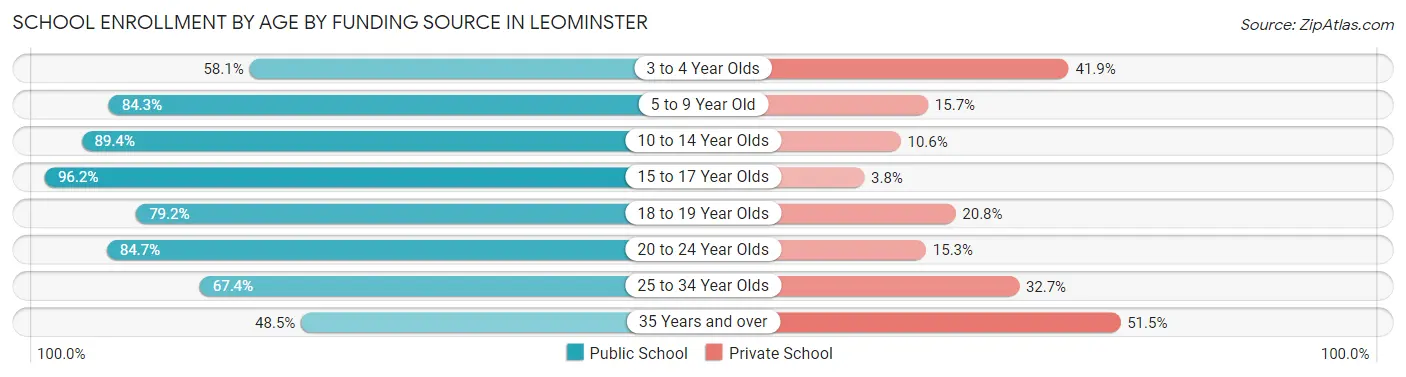
| Age Bracket | Public School | Private School |
| 3 to 4 Year Olds | 197 (58.1%) | 142 (41.9%) |
| 5 to 9 Year Old | 1,833 (84.3%) | 341 (15.7%) |
| 10 to 14 Year Olds | 2,210 (89.4%) | 262 (10.6%) |
| 15 to 17 Year Olds | 1,166 (96.2%) | 46 (3.8%) |
| 18 to 19 Year Olds | 377 (79.2%) | 99 (20.8%) |
| 20 to 24 Year Olds | 509 (84.7%) | 92 (15.3%) |
| 25 to 34 Year Olds | 363 (67.3%) | 176 (32.7%) |
| 35 Years and over | 338 (48.5%) | 359 (51.5%) |
| Total | 6,995 (82.2%) | 1,515 (17.8%) |
Educational Attainment by Field of Study in Leominster
Business (1,646 | 14.7%), education (1,195 | 10.7%), science & technology (1,064 | 9.5%), social sciences (1,028 | 9.2%), and engineering (971 | 8.7%) are the most common fields of study among 11,171 individuals in Leominster who have obtained a bachelor's degree or higher.
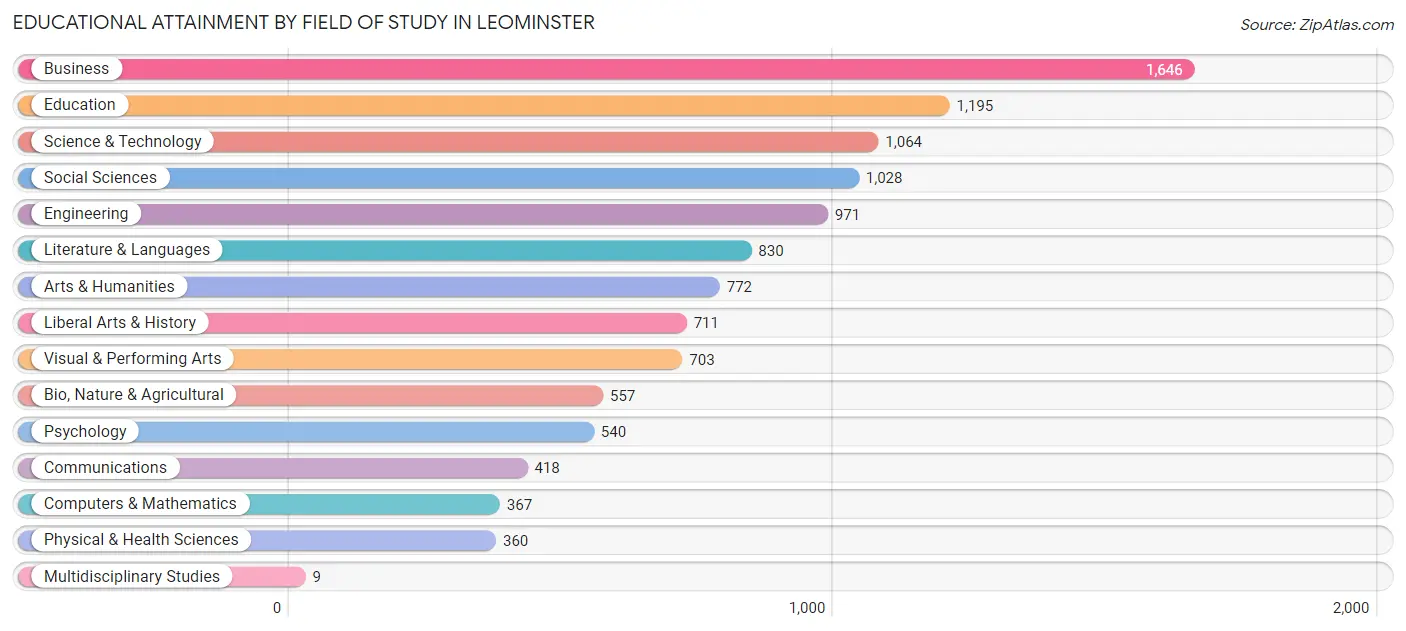
| Field of Study | # Graduates | % Graduates |
| Computers & Mathematics | 367 | 3.3% |
| Bio, Nature & Agricultural | 557 | 5.0% |
| Physical & Health Sciences | 360 | 3.2% |
| Psychology | 540 | 4.8% |
| Social Sciences | 1,028 | 9.2% |
| Engineering | 971 | 8.7% |
| Multidisciplinary Studies | 9 | 0.1% |
| Science & Technology | 1,064 | 9.5% |
| Business | 1,646 | 14.7% |
| Education | 1,195 | 10.7% |
| Literature & Languages | 830 | 7.4% |
| Liberal Arts & History | 711 | 6.4% |
| Visual & Performing Arts | 703 | 6.3% |
| Communications | 418 | 3.7% |
| Arts & Humanities | 772 | 6.9% |
| Total | 11,171 | 100.0% |
Transportation & Commute in Leominster
Vehicle Availability by Sex in Leominster
The most prevalent vehicle ownership categories in Leominster are males with 2 vehicles (5,316, accounting for 46.0%) and females with 2 vehicles (4,726, making up 48.8%).
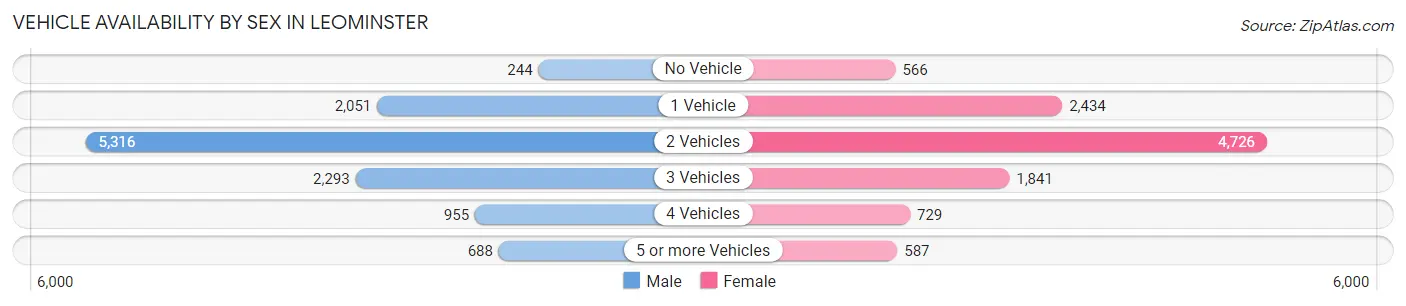
| Vehicles Available | Male | Female |
| No Vehicle | 244 (2.1%) | 566 (5.2%) |
| 1 Vehicle | 2,051 (17.8%) | 2,434 (22.4%) |
| 2 Vehicles | 5,316 (46.0%) | 4,726 (43.4%) |
| 3 Vehicles | 2,293 (19.9%) | 1,841 (16.9%) |
| 4 Vehicles | 955 (8.3%) | 729 (6.7%) |
| 5 or more Vehicles | 688 (6.0%) | 587 (5.4%) |
| Total | 11,547 (100.0%) | 10,883 (100.0%) |
Commute Time in Leominster
The most frequently occuring commute durations in Leominster are 10 to 14 minutes (3,512 commuters, 17.4%), 20 to 24 minutes (2,507 commuters, 12.4%), and 30 to 34 minutes (2,306 commuters, 11.4%).
| Commute Time | # Commuters | % Commuters |
| Less than 5 Minutes | 474 | 2.3% |
| 5 to 9 Minutes | 2,261 | 11.2% |
| 10 to 14 Minutes | 3,512 | 17.4% |
| 15 to 19 Minutes | 2,231 | 11.0% |
| 20 to 24 Minutes | 2,507 | 12.4% |
| 25 to 29 Minutes | 948 | 4.7% |
| 30 to 34 Minutes | 2,306 | 11.4% |
| 35 to 39 Minutes | 789 | 3.9% |
| 40 to 44 Minutes | 976 | 4.8% |
| 45 to 59 Minutes | 1,934 | 9.6% |
| 60 to 89 Minutes | 1,445 | 7.1% |
| 90 or more Minutes | 845 | 4.2% |
Commute Time by Sex in Leominster
The most common commute times in Leominster are 10 to 14 minutes (1,639 commuters, 15.4%) for males and 10 to 14 minutes (1,873 commuters, 19.5%) for females.
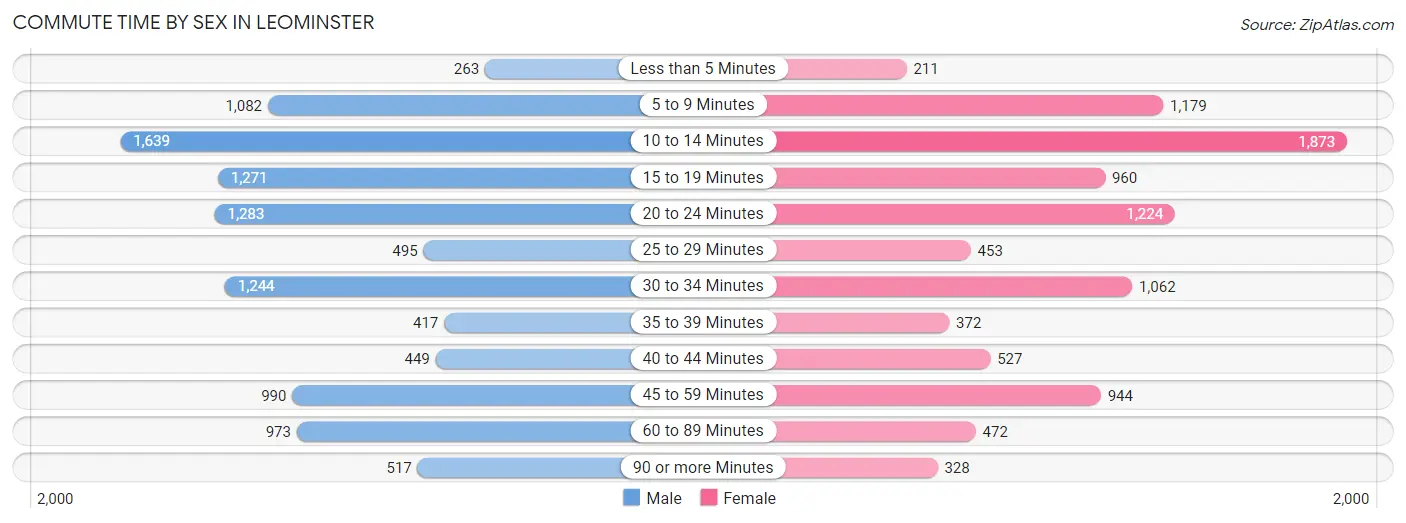
| Commute Time | Male | Female |
| Less than 5 Minutes | 263 (2.5%) | 211 (2.2%) |
| 5 to 9 Minutes | 1,082 (10.2%) | 1,179 (12.3%) |
| 10 to 14 Minutes | 1,639 (15.4%) | 1,873 (19.5%) |
| 15 to 19 Minutes | 1,271 (12.0%) | 960 (10.0%) |
| 20 to 24 Minutes | 1,283 (12.1%) | 1,224 (12.7%) |
| 25 to 29 Minutes | 495 (4.7%) | 453 (4.7%) |
| 30 to 34 Minutes | 1,244 (11.7%) | 1,062 (11.1%) |
| 35 to 39 Minutes | 417 (3.9%) | 372 (3.9%) |
| 40 to 44 Minutes | 449 (4.2%) | 527 (5.5%) |
| 45 to 59 Minutes | 990 (9.3%) | 944 (9.8%) |
| 60 to 89 Minutes | 973 (9.2%) | 472 (4.9%) |
| 90 or more Minutes | 517 (4.9%) | 328 (3.4%) |
Time of Departure to Work by Sex in Leominster
The most frequent times of departure to work in Leominster are 7:00 AM to 7:29 AM (1,375, 12.9%) for males and 6:30 AM to 6:59 AM (1,471, 15.3%) for females.
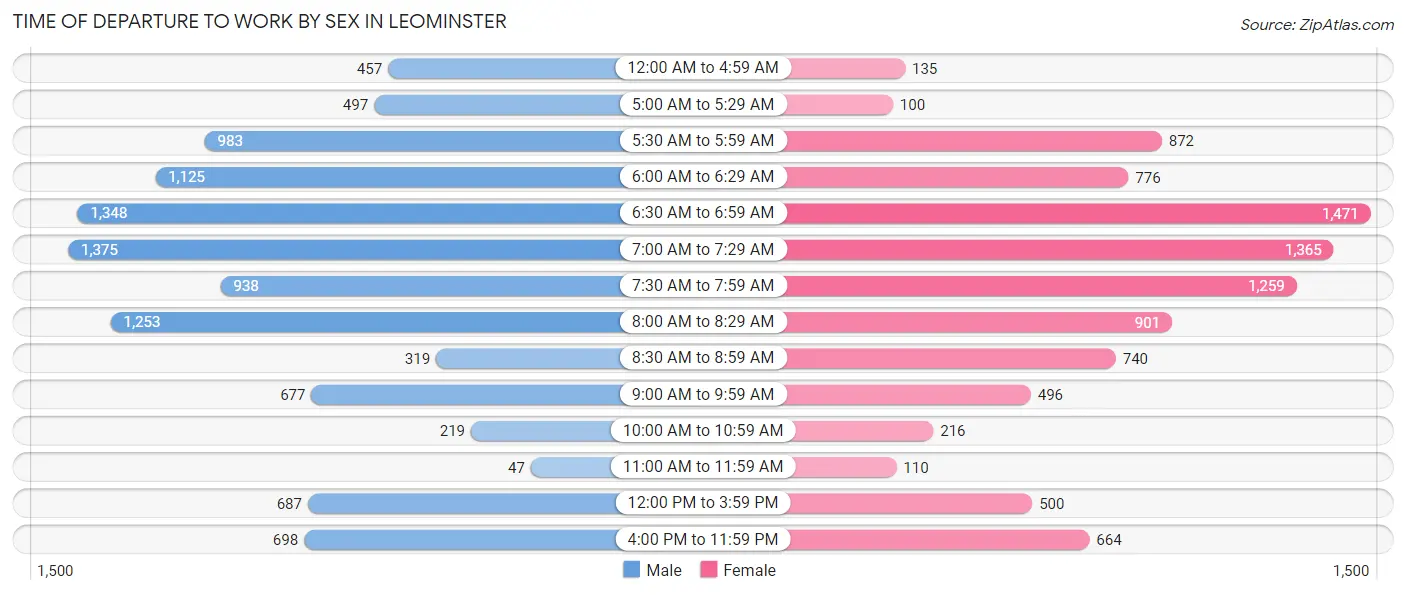
| Time of Departure | Male | Female |
| 12:00 AM to 4:59 AM | 457 (4.3%) | 135 (1.4%) |
| 5:00 AM to 5:29 AM | 497 (4.7%) | 100 (1.0%) |
| 5:30 AM to 5:59 AM | 983 (9.2%) | 872 (9.1%) |
| 6:00 AM to 6:29 AM | 1,125 (10.6%) | 776 (8.1%) |
| 6:30 AM to 6:59 AM | 1,348 (12.7%) | 1,471 (15.3%) |
| 7:00 AM to 7:29 AM | 1,375 (12.9%) | 1,365 (14.2%) |
| 7:30 AM to 7:59 AM | 938 (8.8%) | 1,259 (13.1%) |
| 8:00 AM to 8:29 AM | 1,253 (11.8%) | 901 (9.4%) |
| 8:30 AM to 8:59 AM | 319 (3.0%) | 740 (7.7%) |
| 9:00 AM to 9:59 AM | 677 (6.4%) | 496 (5.2%) |
| 10:00 AM to 10:59 AM | 219 (2.1%) | 216 (2.2%) |
| 11:00 AM to 11:59 AM | 47 (0.4%) | 110 (1.1%) |
| 12:00 PM to 3:59 PM | 687 (6.5%) | 500 (5.2%) |
| 4:00 PM to 11:59 PM | 698 (6.6%) | 664 (6.9%) |
| Total | 10,623 (100.0%) | 9,605 (100.0%) |
Housing Occupancy in Leominster
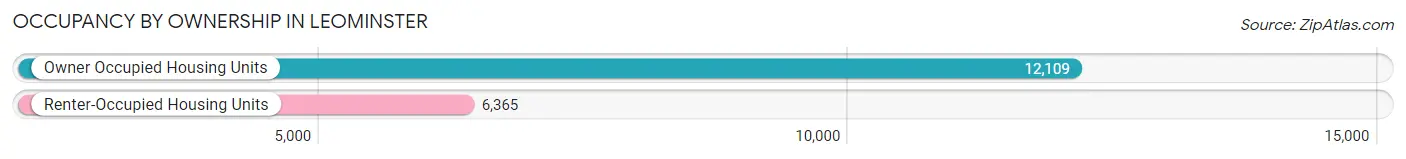
Occupancy by Ownership in Leominster
Of the total 18,474 dwellings in Leominster, owner-occupied units account for 12,109 (65.5%), while renter-occupied units make up 6,365 (34.4%).
| Occupancy | # Housing Units | % Housing Units |
| Owner Occupied Housing Units | 12,109 | 65.5% |
| Renter-Occupied Housing Units | 6,365 | 34.4% |
| Total Occupied Housing Units | 18,474 | 100.0% |
Occupancy by Household Size in Leominster
| Household Size | # Housing Units | % Housing Units |
| 1-Person Household | 5,989 | 32.4% |
| 2-Person Household | 6,551 | 35.5% |
| 3-Person Household | 2,472 | 13.4% |
| 4+ Person Household | 3,462 | 18.7% |
| Total Housing Units | 18,474 | 100.0% |
Occupancy by Ownership by Household Size in Leominster
| Household Size | Owner-occupied | Renter-occupied |
| 1-Person Household | 3,080 (51.4%) | 2,909 (48.6%) |
| 2-Person Household | 4,222 (64.4%) | 2,329 (35.5%) |
| 3-Person Household | 1,899 (76.8%) | 573 (23.2%) |
| 4+ Person Household | 2,908 (84.0%) | 554 (16.0%) |
| Total Housing Units | 12,109 (65.5%) | 6,365 (34.4%) |
Occupancy by Educational Attainment in Leominster
| Household Size | Owner-occupied | Renter-occupied |
| Less than High School | 760 (51.5%) | 717 (48.5%) |
| High School Diploma | 2,453 (53.6%) | 2,127 (46.4%) |
| College/Associate Degree | 4,183 (70.0%) | 1,793 (30.0%) |
| Bachelor's Degree or higher | 4,713 (73.2%) | 1,728 (26.8%) |
Occupancy by Age of Householder in Leominster
| Age Bracket | # Households | % Households |
| Under 35 Years | 2,897 | 15.7% |
| 35 to 44 Years | 2,812 | 15.2% |
| 45 to 54 Years | 3,790 | 20.5% |
| 55 to 64 Years | 3,737 | 20.2% |
| 65 to 74 Years | 3,125 | 16.9% |
| 75 to 84 Years | 1,249 | 6.8% |
| 85 Years and Over | 864 | 4.7% |
| Total | 18,474 | 100.0% |
Housing Finances in Leominster
Median Income by Occupancy in Leominster
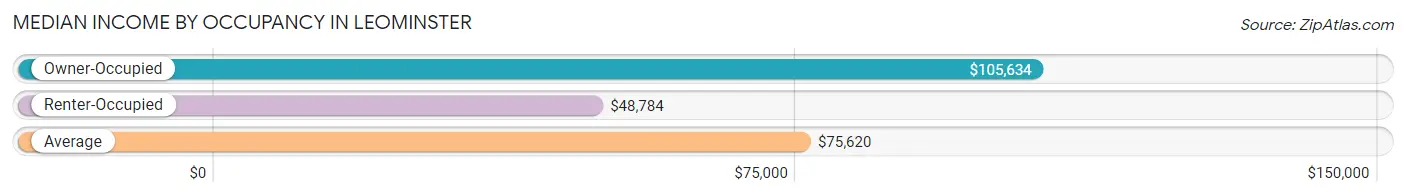
| Occupancy Type | # Households | Median Income |
| Owner-Occupied | 12,109 (65.5%) | $105,634 |
| Renter-Occupied | 6,365 (34.4%) | $48,784 |
| Average | 18,474 (100.0%) | $75,620 |
Occupancy by Householder Income Bracket in Leominster
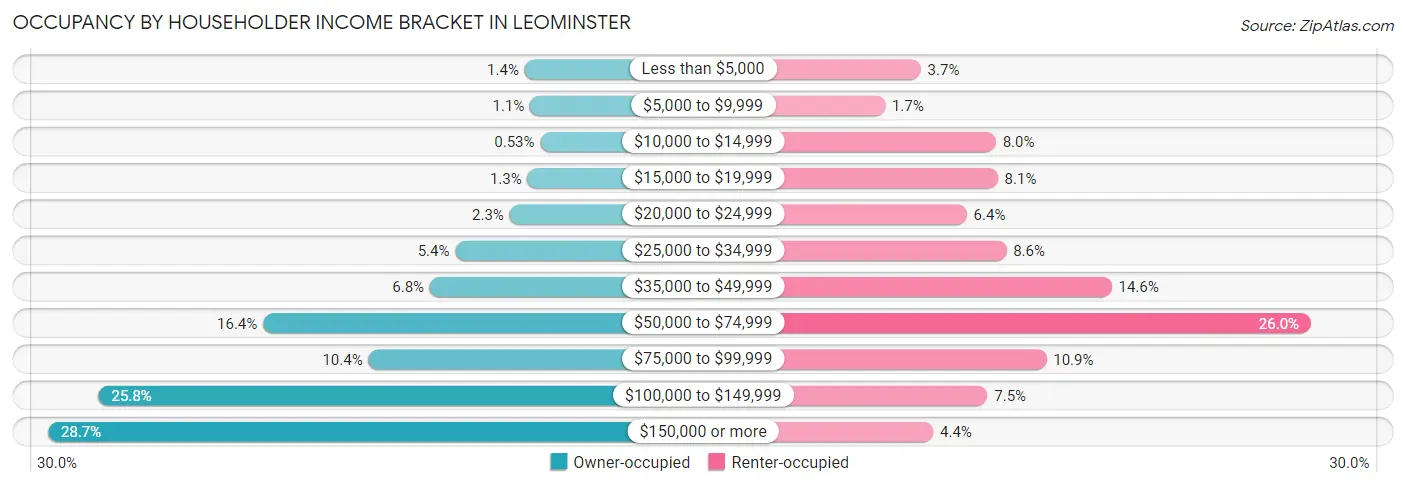
| Income Bracket | Owner-occupied | Renter-occupied |
| Less than $5,000 | 172 (1.4%) | 237 (3.7%) |
| $5,000 to $9,999 | 134 (1.1%) | 107 (1.7%) |
| $10,000 to $14,999 | 64 (0.5%) | 510 (8.0%) |
| $15,000 to $19,999 | 153 (1.3%) | 517 (8.1%) |
| $20,000 to $24,999 | 276 (2.3%) | 404 (6.4%) |
| $25,000 to $34,999 | 653 (5.4%) | 548 (8.6%) |
| $35,000 to $49,999 | 828 (6.8%) | 931 (14.6%) |
| $50,000 to $74,999 | 1,982 (16.4%) | 1,656 (26.0%) |
| $75,000 to $99,999 | 1,253 (10.3%) | 694 (10.9%) |
| $100,000 to $149,999 | 3,122 (25.8%) | 479 (7.5%) |
| $150,000 or more | 3,472 (28.7%) | 282 (4.4%) |
| Total | 12,109 (100.0%) | 6,365 (100.0%) |
Monthly Housing Cost Tiers in Leominster
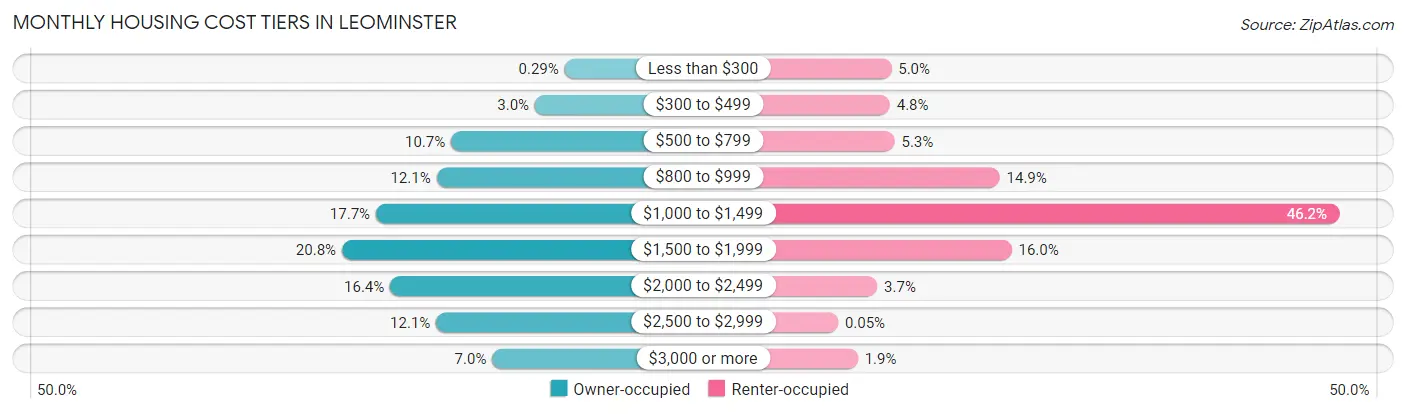
| Monthly Cost | Owner-occupied | Renter-occupied |
| Less than $300 | 35 (0.3%) | 316 (5.0%) |
| $300 to $499 | 366 (3.0%) | 307 (4.8%) |
| $500 to $799 | 1,301 (10.7%) | 335 (5.3%) |
| $800 to $999 | 1,463 (12.1%) | 950 (14.9%) |
| $1,000 to $1,499 | 2,138 (17.7%) | 2,938 (46.2%) |
| $1,500 to $1,999 | 2,518 (20.8%) | 1,020 (16.0%) |
| $2,000 to $2,499 | 1,980 (16.4%) | 233 (3.7%) |
| $2,500 to $2,999 | 1,467 (12.1%) | 3 (0.1%) |
| $3,000 or more | 841 (7.0%) | 119 (1.9%) |
| Total | 12,109 (100.0%) | 6,365 (100.0%) |
Physical Housing Characteristics in Leominster
Housing Structures in Leominster
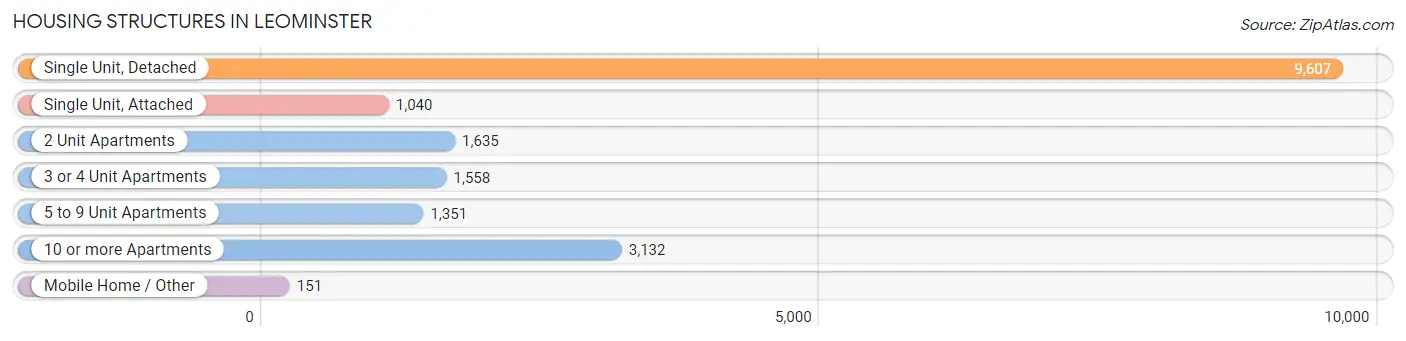
| Structure Type | # Housing Units | % Housing Units |
| Single Unit, Detached | 9,607 | 52.0% |
| Single Unit, Attached | 1,040 | 5.6% |
| 2 Unit Apartments | 1,635 | 8.8% |
| 3 or 4 Unit Apartments | 1,558 | 8.4% |
| 5 to 9 Unit Apartments | 1,351 | 7.3% |
| 10 or more Apartments | 3,132 | 17.0% |
| Mobile Home / Other | 151 | 0.8% |
| Total | 18,474 | 100.0% |
Housing Structures by Occupancy in Leominster
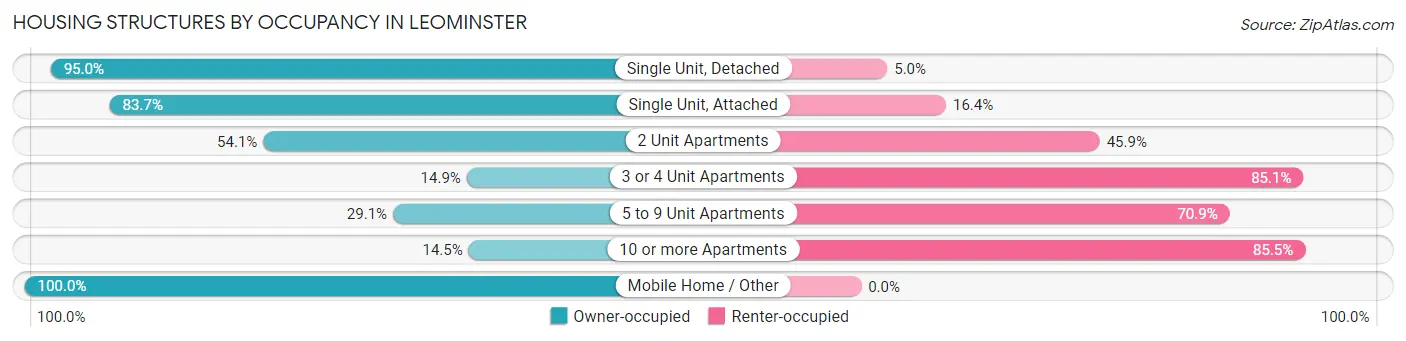
| Structure Type | Owner-occupied | Renter-occupied |
| Single Unit, Detached | 9,124 (95.0%) | 483 (5.0%) |
| Single Unit, Attached | 870 (83.7%) | 170 (16.4%) |
| 2 Unit Apartments | 884 (54.1%) | 751 (45.9%) |
| 3 or 4 Unit Apartments | 232 (14.9%) | 1,326 (85.1%) |
| 5 to 9 Unit Apartments | 393 (29.1%) | 958 (70.9%) |
| 10 or more Apartments | 455 (14.5%) | 2,677 (85.5%) |
| Mobile Home / Other | 151 (100.0%) | 0 (0.0%) |
| Total | 12,109 (65.5%) | 6,365 (34.4%) |
Housing Structures by Number of Rooms in Leominster
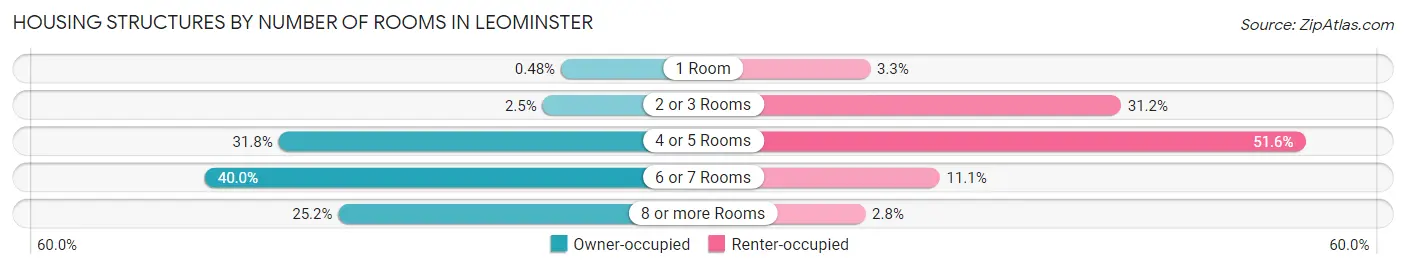
| Number of Rooms | Owner-occupied | Renter-occupied |
| 1 Room | 58 (0.5%) | 212 (3.3%) |
| 2 or 3 Rooms | 305 (2.5%) | 1,984 (31.2%) |
| 4 or 5 Rooms | 3,853 (31.8%) | 3,287 (51.6%) |
| 6 or 7 Rooms | 4,843 (40.0%) | 704 (11.1%) |
| 8 or more Rooms | 3,050 (25.2%) | 178 (2.8%) |
| Total | 12,109 (100.0%) | 6,365 (100.0%) |
Housing Structure by Heating Type in Leominster
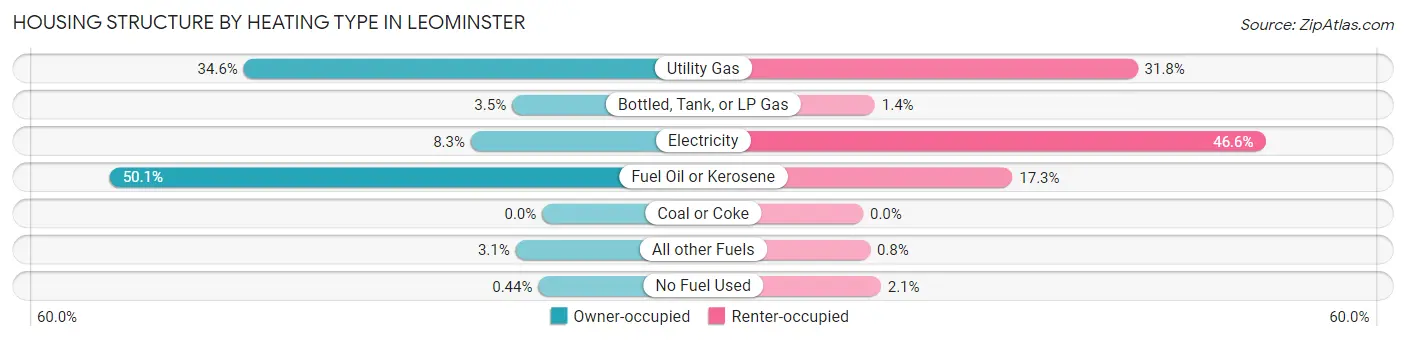
| Heating Type | Owner-occupied | Renter-occupied |
| Utility Gas | 4,190 (34.6%) | 2,026 (31.8%) |
| Bottled, Tank, or LP Gas | 422 (3.5%) | 87 (1.4%) |
| Electricity | 1,001 (8.3%) | 2,968 (46.6%) |
| Fuel Oil or Kerosene | 6,070 (50.1%) | 1,102 (17.3%) |
| Coal or Coke | 0 (0.0%) | 0 (0.0%) |
| All other Fuels | 373 (3.1%) | 51 (0.8%) |
| No Fuel Used | 53 (0.4%) | 131 (2.1%) |
| Total | 12,109 (100.0%) | 6,365 (100.0%) |
Household Vehicle Usage in Leominster
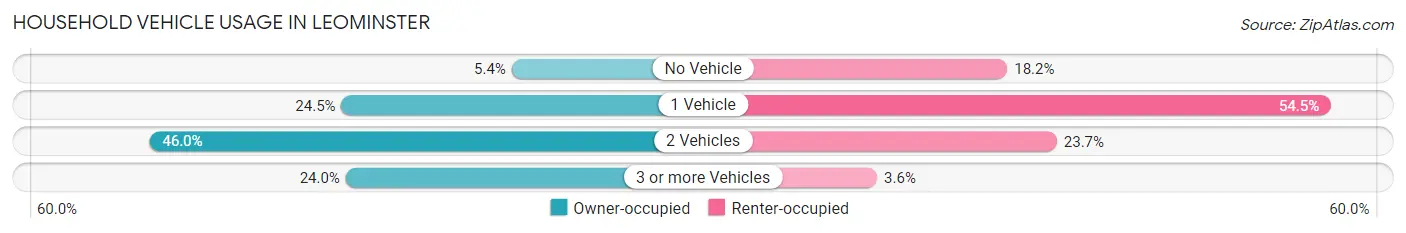
| Vehicles per Household | Owner-occupied | Renter-occupied |
| No Vehicle | 659 (5.4%) | 1,158 (18.2%) |
| 1 Vehicle | 2,968 (24.5%) | 3,466 (54.4%) |
| 2 Vehicles | 5,572 (46.0%) | 1,511 (23.7%) |
| 3 or more Vehicles | 2,910 (24.0%) | 230 (3.6%) |
| Total | 12,109 (100.0%) | 6,365 (100.0%) |
Real Estate & Mortgages in Leominster
Real Estate and Mortgage Overview in Leominster
| Characteristic | Without Mortgage | With Mortgage |
| Housing Units | 4,016 | 8,093 |
| Median Property Value | $297,300 | $333,700 |
| Median Household Income | $66,059 | $2,849 |
| Monthly Housing Costs | $866 | $841 |
| Real Estate Taxes | $4,943 | $189 |
Property Value by Mortgage Status in Leominster
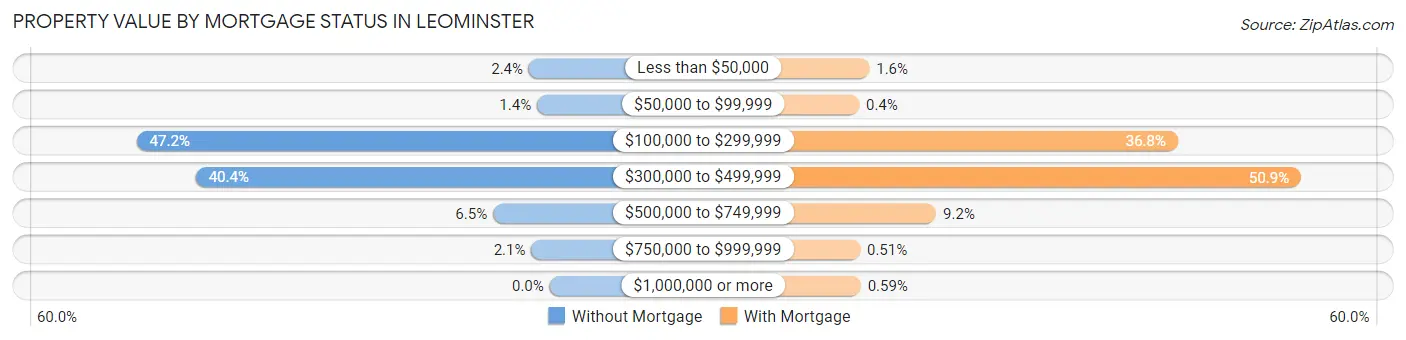
| Property Value | Without Mortgage | With Mortgage |
| Less than $50,000 | 95 (2.4%) | 127 (1.6%) |
| $50,000 to $99,999 | 58 (1.4%) | 32 (0.4%) |
| $100,000 to $299,999 | 1,895 (47.2%) | 2,980 (36.8%) |
| $300,000 to $499,999 | 1,624 (40.4%) | 4,120 (50.9%) |
| $500,000 to $749,999 | 260 (6.5%) | 745 (9.2%) |
| $750,000 to $999,999 | 84 (2.1%) | 41 (0.5%) |
| $1,000,000 or more | 0 (0.0%) | 48 (0.6%) |
| Total | 4,016 (100.0%) | 8,093 (100.0%) |
Household Income by Mortgage Status in Leominster
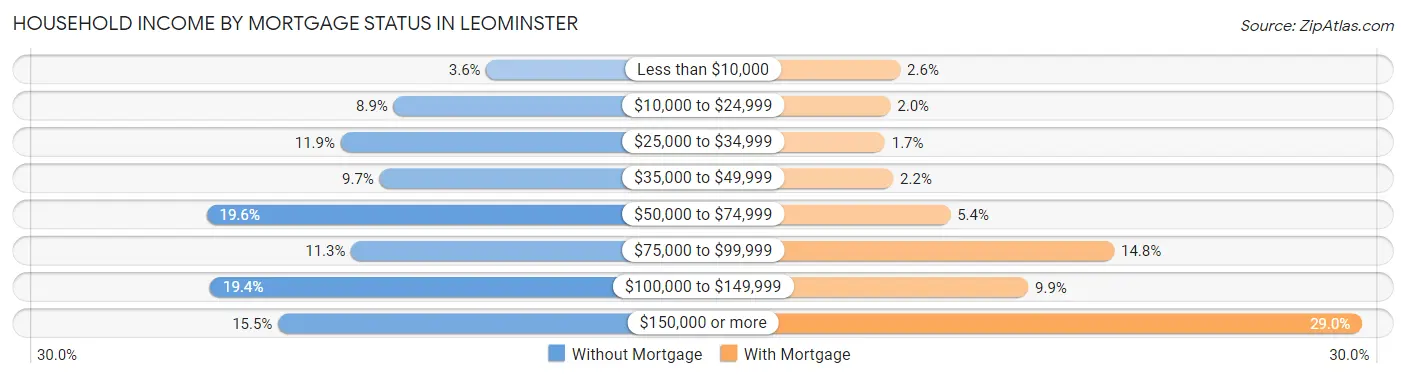
| Household Income | Without Mortgage | With Mortgage |
| Less than $10,000 | 145 (3.6%) | 206 (2.5%) |
| $10,000 to $24,999 | 358 (8.9%) | 161 (2.0%) |
| $25,000 to $34,999 | 479 (11.9%) | 135 (1.7%) |
| $35,000 to $49,999 | 390 (9.7%) | 174 (2.1%) |
| $50,000 to $74,999 | 787 (19.6%) | 438 (5.4%) |
| $75,000 to $99,999 | 455 (11.3%) | 1,195 (14.8%) |
| $100,000 to $149,999 | 779 (19.4%) | 798 (9.9%) |
| $150,000 or more | 623 (15.5%) | 2,343 (28.9%) |
| Total | 4,016 (100.0%) | 8,093 (100.0%) |
Property Value to Household Income Ratio in Leominster
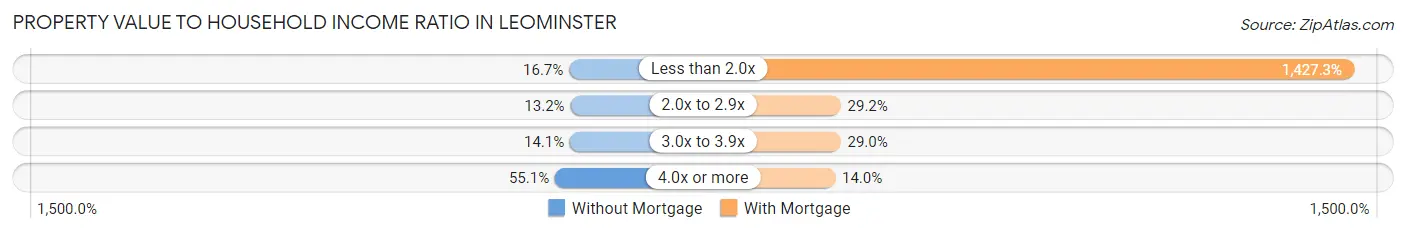
| Value-to-Income Ratio | Without Mortgage | With Mortgage |
| Less than 2.0x | 670 (16.7%) | 115,508 (1,427.3%) |
| 2.0x to 2.9x | 529 (13.2%) | 2,359 (29.1%) |
| 3.0x to 3.9x | 567 (14.1%) | 2,350 (29.0%) |
| 4.0x or more | 2,212 (55.1%) | 1,129 (14.0%) |
| Total | 4,016 (100.0%) | 8,093 (100.0%) |
Real Estate Taxes by Mortgage Status in Leominster
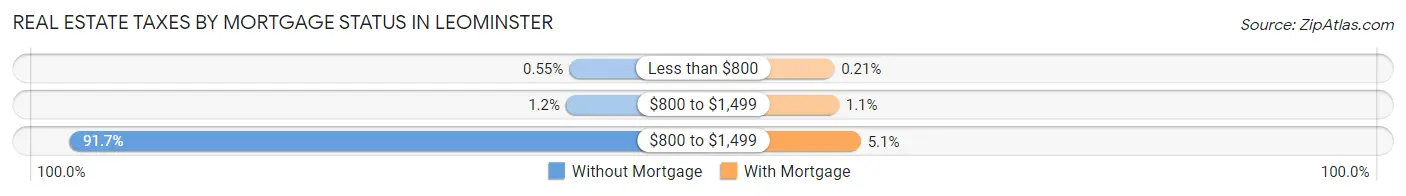
| Property Taxes | Without Mortgage | With Mortgage |
| Less than $800 | 22 (0.5%) | 17 (0.2%) |
| $800 to $1,499 | 46 (1.1%) | 85 (1.1%) |
| $800 to $1,499 | 3,682 (91.7%) | 409 (5.1%) |
| Total | 4,016 (100.0%) | 8,093 (100.0%) |
Health & Disability in Leominster
Health Insurance Coverage by Age in Leominster
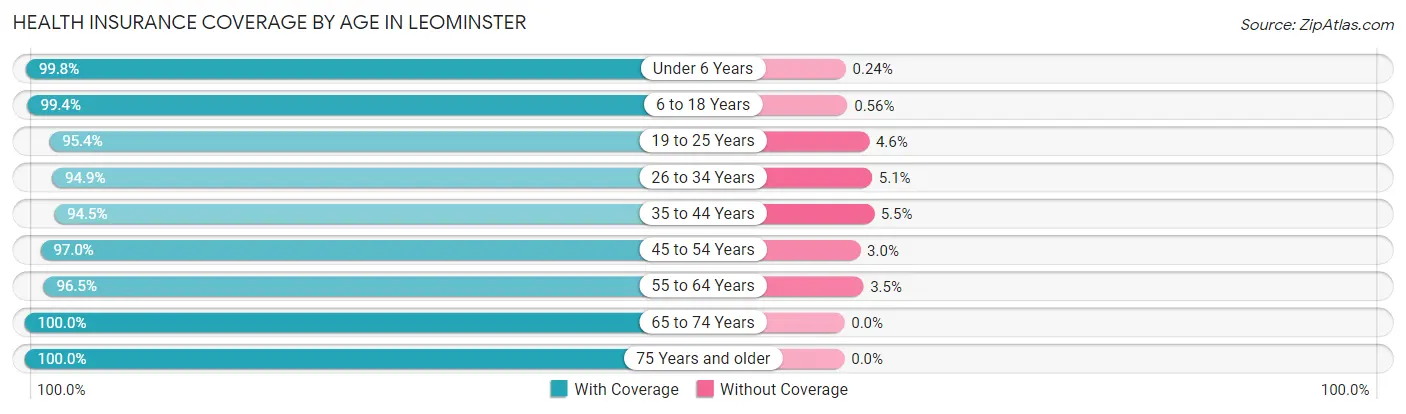
| Age Bracket | With Coverage | Without Coverage |
| Under 6 Years | 2,493 (99.8%) | 6 (0.2%) |
| 6 to 18 Years | 6,181 (99.4%) | 35 (0.6%) |
| 19 to 25 Years | 3,423 (95.4%) | 165 (4.6%) |
| 26 to 34 Years | 5,090 (94.9%) | 276 (5.1%) |
| 35 to 44 Years | 4,833 (94.5%) | 281 (5.5%) |
| 45 to 54 Years | 5,808 (97.0%) | 177 (3.0%) |
| 55 to 64 Years | 6,402 (96.5%) | 234 (3.5%) |
| 65 to 74 Years | 4,938 (100.0%) | 0 (0.0%) |
| 75 Years and older | 3,025 (100.0%) | 0 (0.0%) |
| Total | 42,193 (97.3%) | 1,174 (2.7%) |
Health Insurance Coverage by Citizenship Status in Leominster
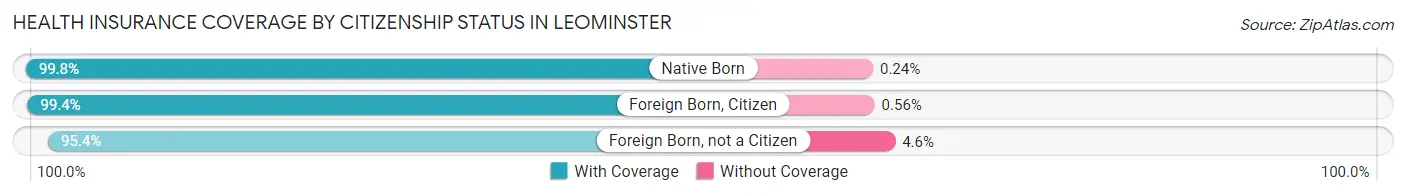
| Citizenship Status | With Coverage | Without Coverage |
| Native Born | 2,493 (99.8%) | 6 (0.2%) |
| Foreign Born, Citizen | 6,181 (99.4%) | 35 (0.6%) |
| Foreign Born, not a Citizen | 3,423 (95.4%) | 165 (4.6%) |
Health Insurance Coverage by Household Income in Leominster
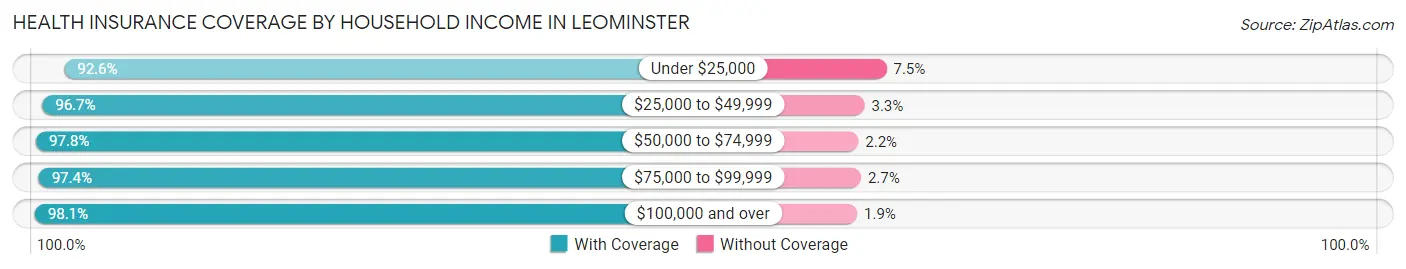
| Household Income | With Coverage | Without Coverage |
| Under $25,000 | 3,538 (92.5%) | 285 (7.4%) |
| $25,000 to $49,999 | 5,787 (96.7%) | 199 (3.3%) |
| $50,000 to $74,999 | 6,748 (97.8%) | 149 (2.2%) |
| $75,000 to $99,999 | 4,290 (97.4%) | 117 (2.6%) |
| $100,000 and over | 21,590 (98.1%) | 424 (1.9%) |
Public vs Private Health Insurance Coverage by Age in Leominster
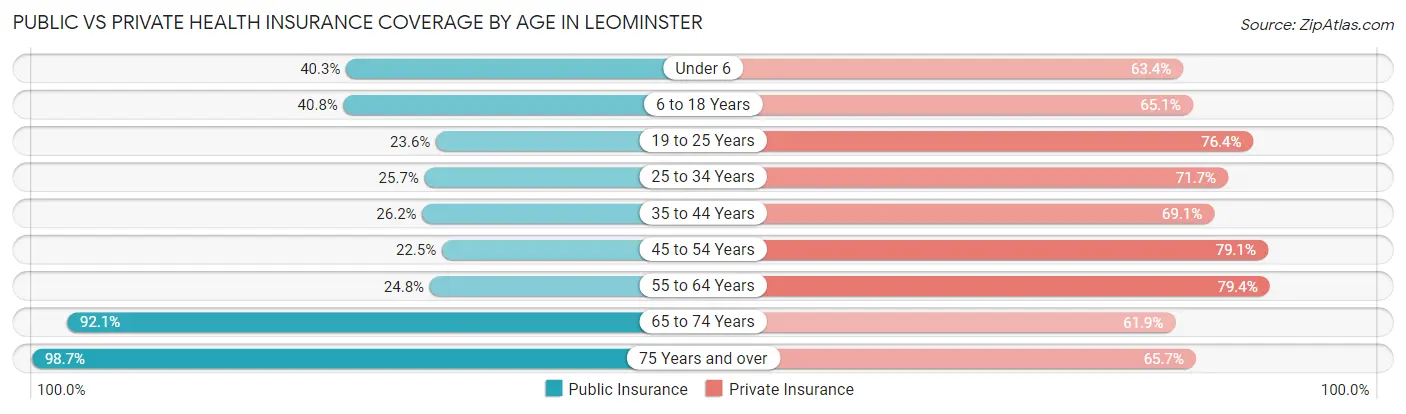
| Age Bracket | Public Insurance | Private Insurance |
| Under 6 | 1,007 (40.3%) | 1,583 (63.3%) |
| 6 to 18 Years | 2,535 (40.8%) | 4,046 (65.1%) |
| 19 to 25 Years | 847 (23.6%) | 2,741 (76.4%) |
| 25 to 34 Years | 1,381 (25.7%) | 3,845 (71.7%) |
| 35 to 44 Years | 1,338 (26.2%) | 3,534 (69.1%) |
| 45 to 54 Years | 1,347 (22.5%) | 4,732 (79.1%) |
| 55 to 64 Years | 1,644 (24.8%) | 5,268 (79.4%) |
| 65 to 74 Years | 4,550 (92.1%) | 3,056 (61.9%) |
| 75 Years and over | 2,985 (98.7%) | 1,987 (65.7%) |
| Total | 17,634 (40.7%) | 30,792 (71.0%) |
Disability Status by Sex by Age in Leominster
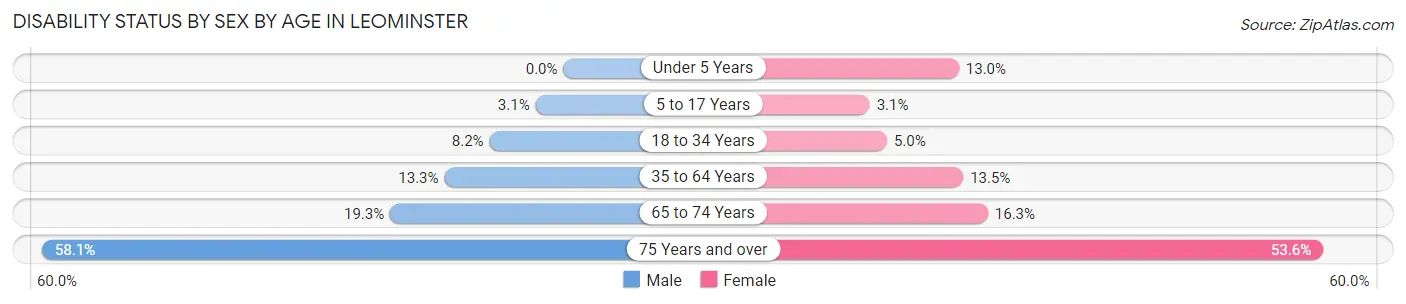
| Age Bracket | Male | Female |
| Under 5 Years | 0 (0.0%) | 100 (13.0%) |
| 5 to 17 Years | 95 (3.1%) | 94 (3.1%) |
| 18 to 34 Years | 446 (8.2%) | 199 (5.0%) |
| 35 to 64 Years | 1,111 (13.3%) | 1,264 (13.5%) |
| 65 to 74 Years | 461 (19.3%) | 415 (16.3%) |
| 75 Years and over | 788 (58.1%) | 894 (53.6%) |
Disability Class by Sex by Age in Leominster
Disability Class: Hearing Difficulty
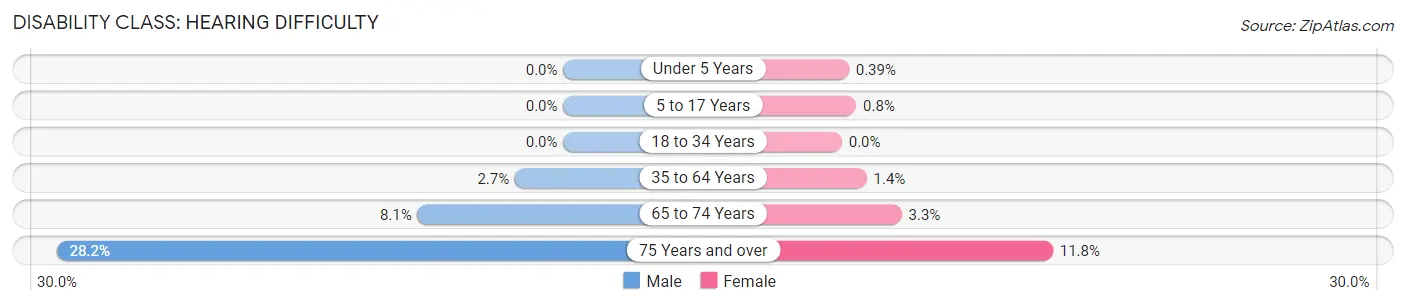
| Age Bracket | Male | Female |
| Under 5 Years | 0 (0.0%) | 3 (0.4%) |
| 5 to 17 Years | 0 (0.0%) | 24 (0.8%) |
| 18 to 34 Years | 0 (0.0%) | 0 (0.0%) |
| 35 to 64 Years | 226 (2.7%) | 129 (1.4%) |
| 65 to 74 Years | 194 (8.1%) | 85 (3.3%) |
| 75 Years and over | 383 (28.2%) | 196 (11.7%) |
Disability Class: Vision Difficulty
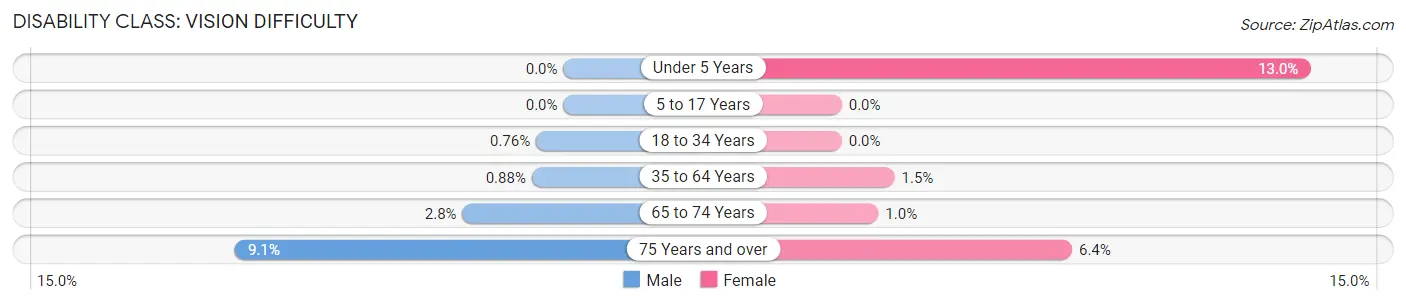
| Age Bracket | Male | Female |
| Under 5 Years | 0 (0.0%) | 100 (13.0%) |
| 5 to 17 Years | 0 (0.0%) | 0 (0.0%) |
| 18 to 34 Years | 41 (0.8%) | 0 (0.0%) |
| 35 to 64 Years | 74 (0.9%) | 137 (1.5%) |
| 65 to 74 Years | 67 (2.8%) | 26 (1.0%) |
| 75 Years and over | 124 (9.1%) | 107 (6.4%) |
Disability Class: Cognitive Difficulty
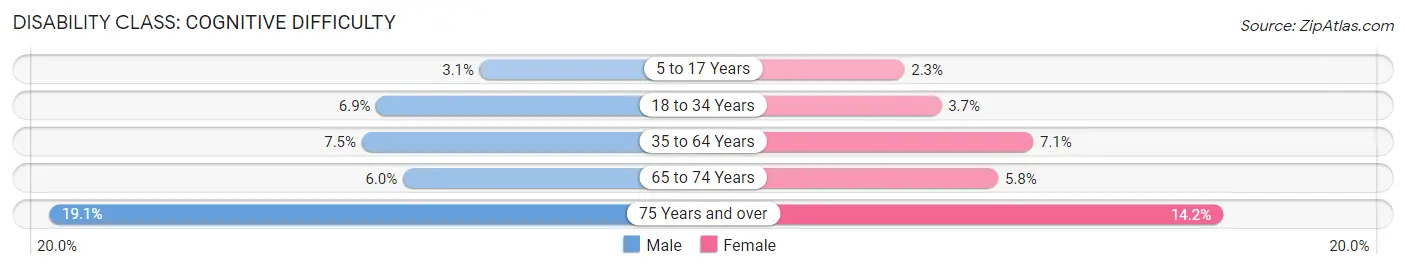
| Age Bracket | Male | Female |
| 5 to 17 Years | 95 (3.1%) | 70 (2.3%) |
| 18 to 34 Years | 376 (6.9%) | 146 (3.7%) |
| 35 to 64 Years | 627 (7.5%) | 664 (7.1%) |
| 65 to 74 Years | 142 (5.9%) | 148 (5.8%) |
| 75 Years and over | 259 (19.1%) | 236 (14.1%) |
Disability Class: Ambulatory Difficulty
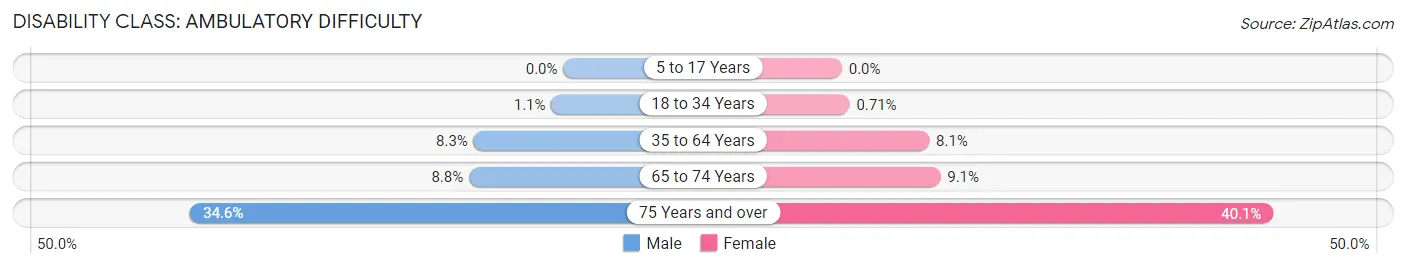
| Age Bracket | Male | Female |
| 5 to 17 Years | 0 (0.0%) | 0 (0.0%) |
| 18 to 34 Years | 60 (1.1%) | 28 (0.7%) |
| 35 to 64 Years | 698 (8.3%) | 757 (8.1%) |
| 65 to 74 Years | 209 (8.7%) | 233 (9.1%) |
| 75 Years and over | 470 (34.6%) | 668 (40.1%) |
Disability Class: Self-Care Difficulty
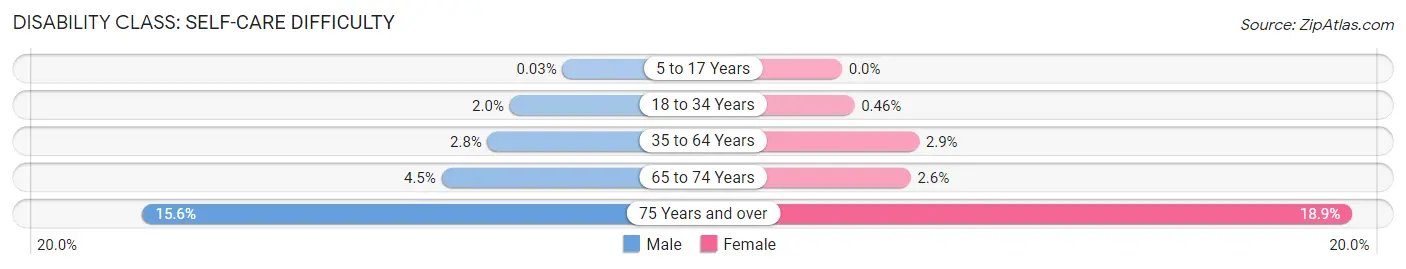
| Age Bracket | Male | Female |
| 5 to 17 Years | 1 (0.0%) | 0 (0.0%) |
| 18 to 34 Years | 108 (2.0%) | 18 (0.5%) |
| 35 to 64 Years | 236 (2.8%) | 267 (2.9%) |
| 65 to 74 Years | 108 (4.5%) | 65 (2.5%) |
| 75 Years and over | 212 (15.6%) | 316 (18.9%) |
Technology Access in Leominster
Computing Device Access in Leominster
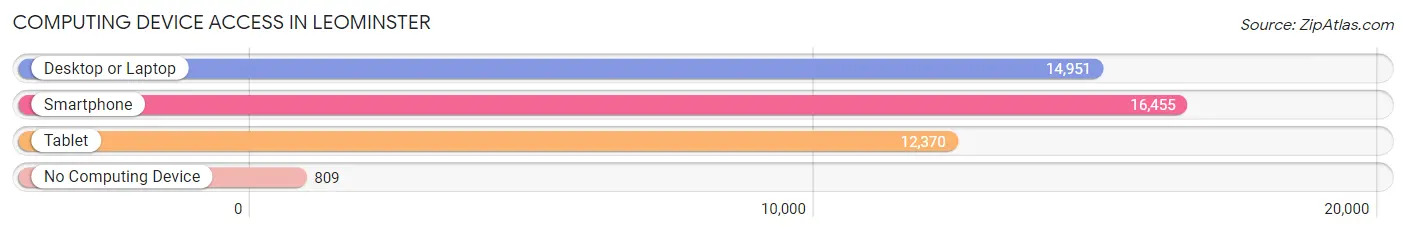
| Device Type | # Households | % Households |
| Desktop or Laptop | 14,951 | 80.9% |
| Smartphone | 16,455 | 89.1% |
| Tablet | 12,370 | 67.0% |
| No Computing Device | 809 | 4.4% |
| Total | 18,474 | 100.0% |
Internet Access in Leominster
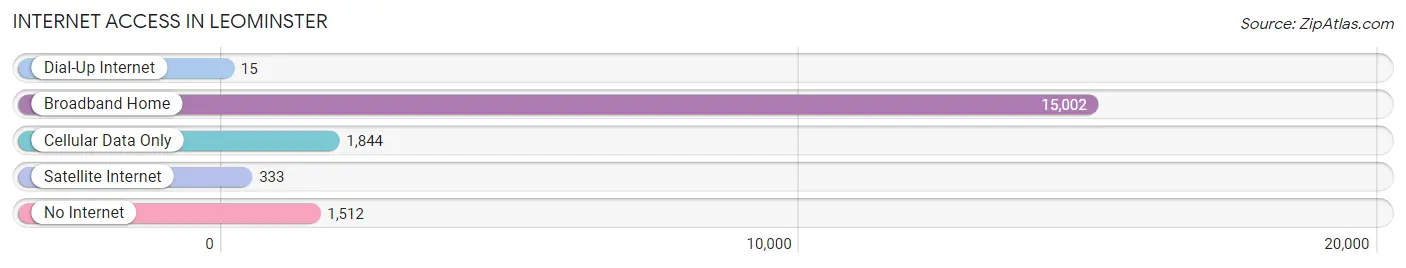
| Internet Type | # Households | % Households |
| Dial-Up Internet | 15 | 0.1% |
| Broadband Home | 15,002 | 81.2% |
| Cellular Data Only | 1,844 | 10.0% |
| Satellite Internet | 333 | 1.8% |
| No Internet | 1,512 | 8.2% |
| Total | 18,474 | 100.0% |
Leominster Summary
Leominster, MA is a city located in Worcester County, Massachusetts. It is situated in the north-central part of the state, about 40 miles west of Boston. The city is bordered by the towns of Fitchburg, Lancaster, Lunenburg, Sterling, and Westminster. As of the 2010 census, the population of Leominster was 40,759, making it the second-largest city in Worcester County.
History
Leominster was first settled in 1653 by settlers from Lancaster, England. The town was officially incorporated in 1740 and was named after the town of Leominster in Herefordshire, England. The town was an important center for the production of woolen goods during the Industrial Revolution. In the 19th century, the city was home to several large shoe factories, which employed thousands of workers.
Geography
Leominster is located at 42°27'N 71°45'W. According to the United States Census Bureau, the city has a total area of 16.2 square miles, of which 15.9 square miles is land and 0.3 square miles is water. The city is located in the northern part of Worcester County, and is bordered by the towns of Fitchburg, Lancaster, Lunenburg, Sterling, and Westminster.
Economy
Leominster’s economy is largely based on manufacturing and retail. The city is home to several large manufacturing companies, including the plastics manufacturer Plastipak, the medical device manufacturer Becton Dickinson, and the paper products manufacturer Georgia-Pacific. The city is also home to several large retail stores, including Walmart, Target, and Home Depot.
Demographics
As of the 2010 census, the population of Leominster was 40,759. The racial makeup of the city was 87.2% White, 4.3% African American, 0.4% Native American, 2.2% Asian, 0.1% Pacific Islander, 4.3% from other races, and 1.5% from two or more races. Hispanic or Latino of any race were 8.7% of the population.
The median income for a household in the city was $50,817, and the median income for a family was $60,817. The per capita income for the city was $23,845. About 8.2% of families and 10.2% of the population were below the poverty line, including 14.2% of those under age 18 and 8.2% of those age 65 or over.
Common Questions
What is Per Capita Income in Leominster?
Per Capita income in Leominster is $43,956.
What is the Median Family Income in Leominster?
Median Family Income in Leominster is $105,157.
What is the Median Household income in Leominster?
Median Household Income in Leominster is $75,620.
What is Income or Wage Gap in Leominster?
Income or Wage Gap in Leominster is 25.7%.
Women in Leominster earn 74.3 cents for every dollar earned by a man.
What is Family Income Deficit in Leominster?
Family Income Deficit in Leominster is $9,370.
Families that are below poverty line in Leominster earn $9,370 less on average than the poverty threshold level.
What is Inequality or Gini Index in Leominster?
Inequality or Gini Index in Leominster is 0.44.
What is the Total Population of Leominster?
Total Population of Leominster is 43,620.
What is the Total Male Population of Leominster?
Total Male Population of Leominster is 22,201.
What is the Total Female Population of Leominster?
Total Female Population of Leominster is 21,419.
What is the Ratio of Males per 100 Females in Leominster?
There are 103.65 Males per 100 Females in Leominster.
What is the Ratio of Females per 100 Males in Leominster?
There are 96.48 Females per 100 Males in Leominster.
What is the Median Population Age in Leominster?
Median Population Age in Leominster is 43.0 Years.
What is the Average Family Size in Leominster
Average Family Size in Leominster is 3.0 People.
What is the Average Household Size in Leominster
Average Household Size in Leominster is 2.3 People.
How Large is the Labor Force in Leominster?
There are 24,373 People in the Labor Forcein in Leominster.
What is the Percentage of People in the Labor Force in Leominster?
67.5% of People are in the Labor Force in Leominster.
What is the Unemployment Rate in Leominster?
Unemployment Rate in Leominster is 6.0%.