Westfield, MA Map & Demographics
Westfield Map
Westfield Overview
$38,979
PER CAPITA INCOME
$98,478
AVG FAMILY INCOME
$78,307
AVG HOUSEHOLD INCOME
38.4%
WAGE / INCOME GAP [ % ]
61.6¢/ $1
WAGE / INCOME GAP [ $ ]
$11,282
FAMILY INCOME DEFICIT
0.44
INEQUALITY / GINI INDEX
40,794
TOTAL POPULATION
19,494
MALE POPULATION
21,300
FEMALE POPULATION
91.52
MALES / 100 FEMALES
109.26
FEMALES / 100 MALES
39.2
MEDIAN AGE
3.1
AVG FAMILY SIZE
2.5
AVG HOUSEHOLD SIZE
20,212
LABOR FORCE [ PEOPLE ]
59.5%
PERCENT IN LABOR FORCE
4.5%
UNEMPLOYMENT RATE
Westfield Zip Codes
Westfield Area Codes
Income in Westfield
Income Overview in Westfield
Per Capita Income in Westfield is $38,979, while median incomes of families and households are $98,478 and $78,307 respectively.
| Characteristic | Number | Measure |
| Per Capita Income | 40,794 | $38,979 |
| Median Family Income | 10,068 | $98,478 |
| Mean Family Income | 10,068 | $124,165 |
| Median Household Income | 15,435 | $78,307 |
| Mean Household Income | 15,435 | $101,724 |
| Income Deficit | 10,068 | $11,282 |
| Wage / Income Gap (%) | 40,794 | 38.43% |
| Wage / Income Gap ($) | 40,794 | 61.57¢ per $1 |
| Gini / Inequality Index | 40,794 | 0.44 |
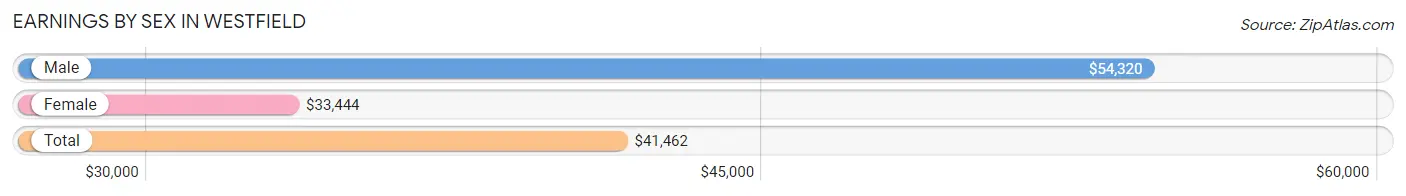
Earnings by Sex in Westfield
Average Earnings in Westfield are $41,462, $54,320 for men and $33,444 for women, a difference of 38.4%.
| Sex | Number | Average Earnings |
| Male | 11,156 (51.7%) | $54,320 |
| Female | 10,416 (48.3%) | $33,444 |
| Total | 21,572 (100.0%) | $41,462 |
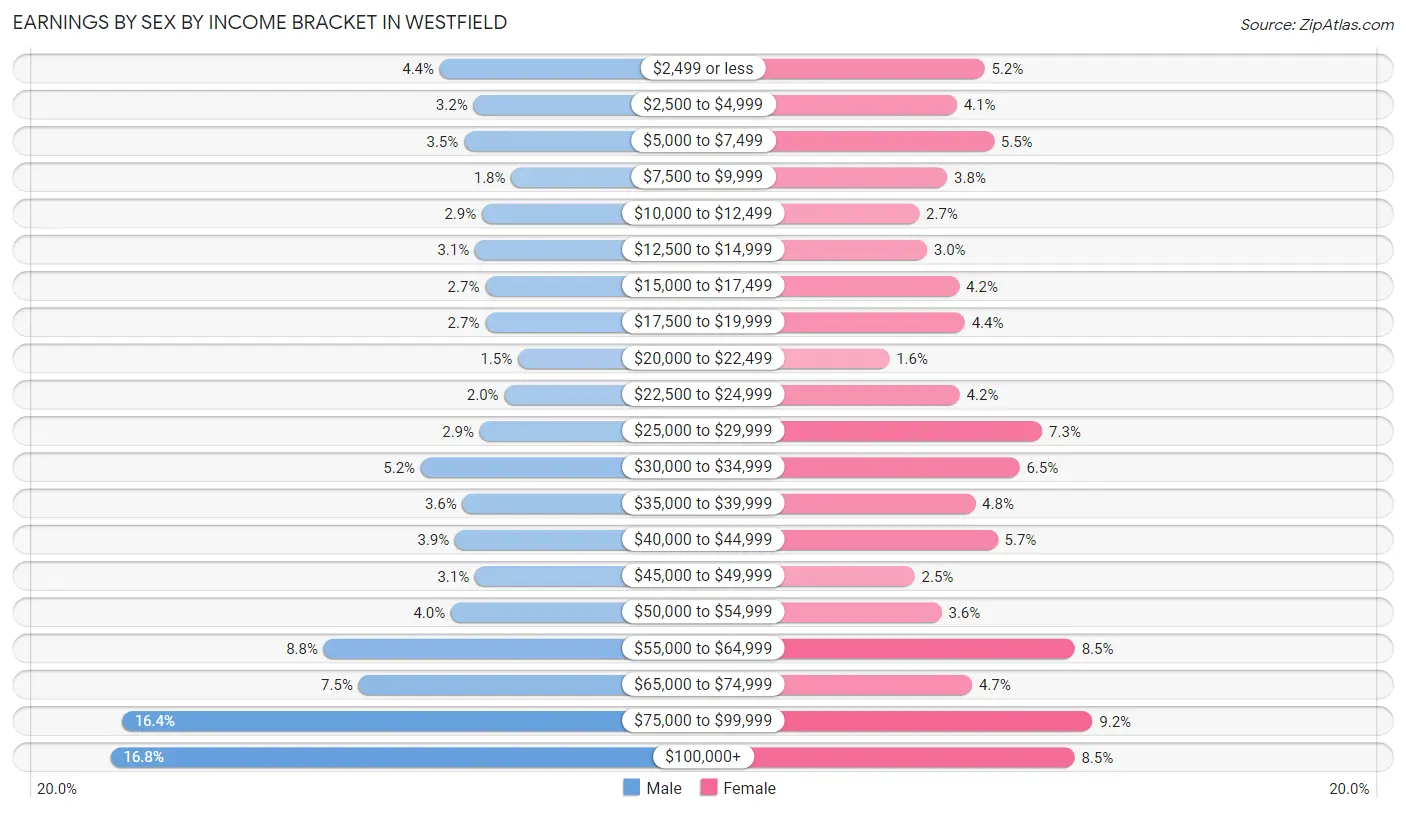
Earnings by Sex by Income Bracket in Westfield
The most common earnings brackets in Westfield are $100,000+ for men (1,872 | 16.8%) and $75,000 to $99,999 for women (958 | 9.2%).
| Income | Male | Female |
| $2,499 or less | 495 (4.4%) | 537 (5.2%) |
| $2,500 to $4,999 | 355 (3.2%) | 429 (4.1%) |
| $5,000 to $7,499 | 394 (3.5%) | 574 (5.5%) |
| $7,500 to $9,999 | 196 (1.8%) | 392 (3.8%) |
| $10,000 to $12,499 | 319 (2.9%) | 282 (2.7%) |
| $12,500 to $14,999 | 348 (3.1%) | 312 (3.0%) |
| $15,000 to $17,499 | 306 (2.7%) | 438 (4.2%) |
| $17,500 to $19,999 | 306 (2.7%) | 460 (4.4%) |
| $20,000 to $22,499 | 168 (1.5%) | 166 (1.6%) |
| $22,500 to $24,999 | 225 (2.0%) | 441 (4.2%) |
| $25,000 to $29,999 | 328 (2.9%) | 762 (7.3%) |
| $30,000 to $34,999 | 575 (5.1%) | 674 (6.5%) |
| $35,000 to $39,999 | 400 (3.6%) | 501 (4.8%) |
| $40,000 to $44,999 | 432 (3.9%) | 589 (5.7%) |
| $45,000 to $49,999 | 348 (3.1%) | 265 (2.5%) |
| $50,000 to $54,999 | 448 (4.0%) | 370 (3.5%) |
| $55,000 to $64,999 | 981 (8.8%) | 890 (8.5%) |
| $65,000 to $74,999 | 835 (7.5%) | 488 (4.7%) |
| $75,000 to $99,999 | 1,825 (16.4%) | 958 (9.2%) |
| $100,000+ | 1,872 (16.8%) | 888 (8.5%) |
| Total | 11,156 (100.0%) | 10,416 (100.0%) |
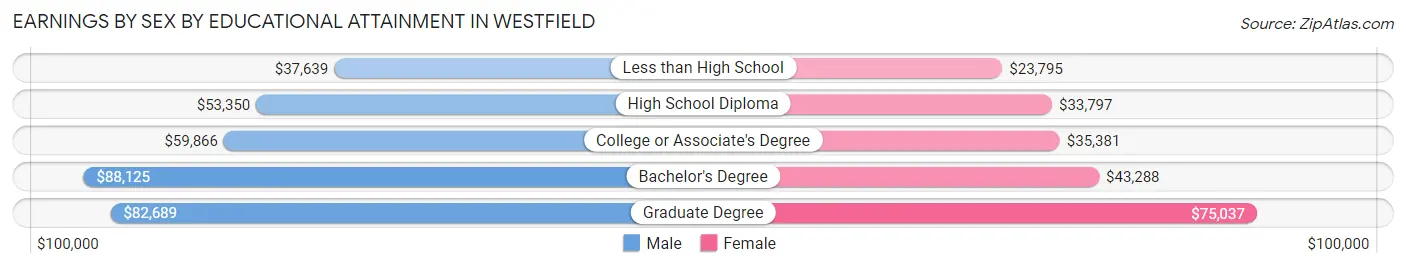
Earnings by Sex by Educational Attainment in Westfield
Average earnings in Westfield are $60,156 for men and $40,337 for women, a difference of 33.0%. Men with an educational attainment of bachelor's degree enjoy the highest average annual earnings of $88,125, while those with less than high school education earn the least with $37,639. Women with an educational attainment of graduate degree earn the most with the average annual earnings of $75,037, while those with less than high school education have the smallest earnings of $23,795.
| Educational Attainment | Male Income | Female Income |
| Less than High School | $37,639 | $23,795 |
| High School Diploma | $53,350 | $33,797 |
| College or Associate's Degree | $59,866 | $35,381 |
| Bachelor's Degree | $88,125 | $43,288 |
| Graduate Degree | $82,689 | $75,037 |
| Total | $60,156 | $40,337 |
Family Income in Westfield
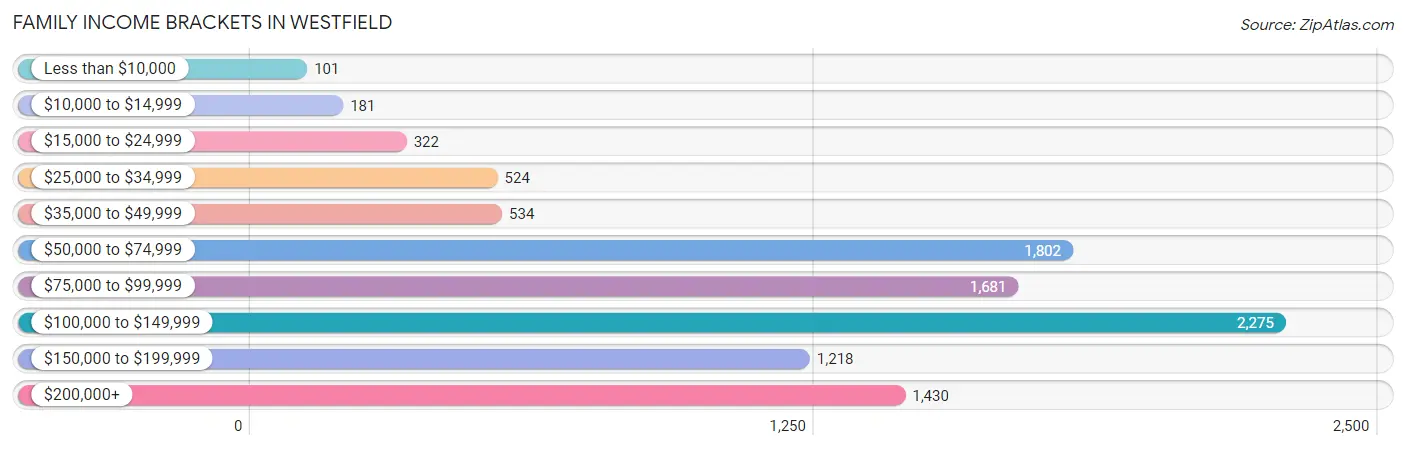
Family Income Brackets in Westfield
According to the Westfield family income data, there are 2,275 families falling into the $100,000 to $149,999 income range, which is the most common income bracket and makes up 22.6% of all families. Conversely, the less than $10,000 income bracket is the least frequent group with only 101 families (1.0%) belonging to this category.
| Income Bracket | # Families | % Families |
| Less than $10,000 | 101 | 1.0% |
| $10,000 to $14,999 | 181 | 1.8% |
| $15,000 to $24,999 | 322 | 3.2% |
| $25,000 to $34,999 | 524 | 5.2% |
| $35,000 to $49,999 | 534 | 5.3% |
| $50,000 to $74,999 | 1,802 | 17.9% |
| $75,000 to $99,999 | 1,681 | 16.7% |
| $100,000 to $149,999 | 2,275 | 22.6% |
| $150,000 to $199,999 | 1,218 | 12.1% |
| $200,000+ | 1,430 | 14.2% |
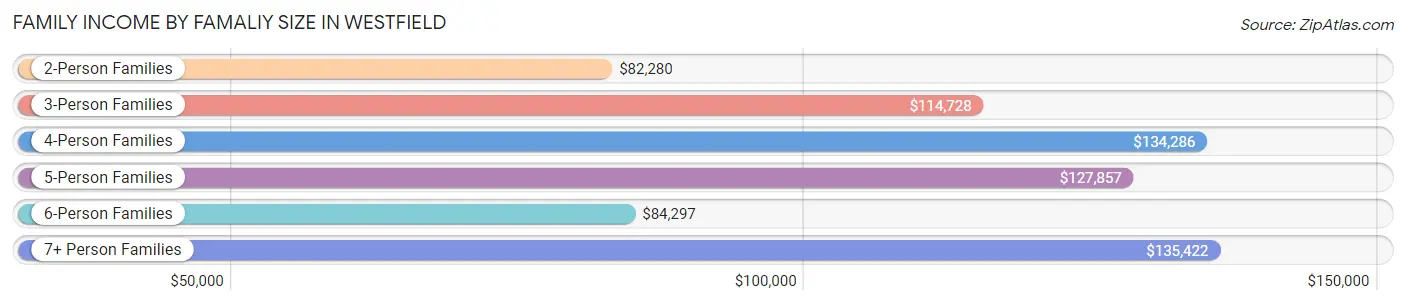
Family Income by Famaliy Size in Westfield
7+ person families (183 | 1.8%) account for the highest median family income in Westfield with $135,422 per family, while 2-person families (4,943 | 49.1%) have the highest median income of $41,140 per family member.
| Income Bracket | # Families | Median Income |
| 2-Person Families | 4,943 (49.1%) | $82,280 |
| 3-Person Families | 2,005 (19.9%) | $114,728 |
| 4-Person Families | 1,714 (17.0%) | $134,286 |
| 5-Person Families | 864 (8.6%) | $127,857 |
| 6-Person Families | 359 (3.6%) | $84,297 |
| 7+ Person Families | 183 (1.8%) | $135,422 |
| Total | 10,068 (100.0%) | $98,478 |
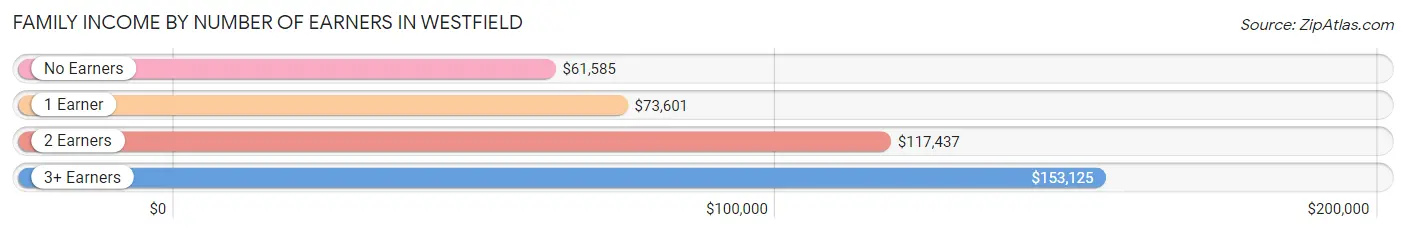
Family Income by Number of Earners in Westfield
The median family income in Westfield is $98,478, with families comprising 3+ earners (1,559) having the highest median family income of $153,125, while families with no earners (1,285) have the lowest median family income of $61,585, accounting for 15.5% and 12.8% of families, respectively.
| Number of Earners | # Families | Median Income |
| No Earners | 1,285 (12.8%) | $61,585 |
| 1 Earner | 3,389 (33.7%) | $73,601 |
| 2 Earners | 3,835 (38.1%) | $117,437 |
| 3+ Earners | 1,559 (15.5%) | $153,125 |
| Total | 10,068 (100.0%) | $98,478 |
Household Income in Westfield
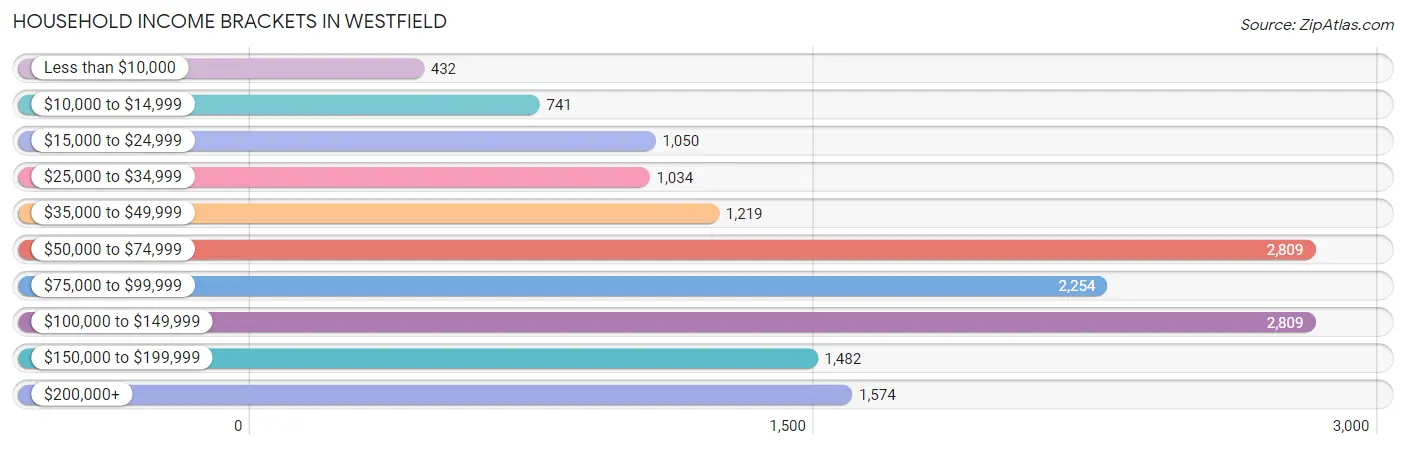
Household Income Brackets in Westfield
With 2,809 households falling in the category, the $50,000 to $74,999 income range is the most frequent in Westfield, accounting for 18.2% of all households. In contrast, only 432 households (2.8%) fall into the less than $10,000 income bracket, making it the least populous group.
| Income Bracket | # Households | % Households |
| Less than $10,000 | 432 | 2.8% |
| $10,000 to $14,999 | 741 | 4.8% |
| $15,000 to $24,999 | 1,050 | 6.8% |
| $25,000 to $34,999 | 1,034 | 6.7% |
| $35,000 to $49,999 | 1,219 | 7.9% |
| $50,000 to $74,999 | 2,809 | 18.2% |
| $75,000 to $99,999 | 2,254 | 14.6% |
| $100,000 to $149,999 | 2,809 | 18.2% |
| $150,000 to $199,999 | 1,482 | 9.6% |
| $200,000+ | 1,574 | 10.2% |
Household Income by Householder Age in Westfield
The median household income in Westfield is $78,307, with the highest median household income of $96,230 found in the 45 to 64 years age bracket for the primary householder. A total of 5,667 households (36.7%) fall into this category. Meanwhile, the 15 to 24 years age bracket for the primary householder has the lowest median household income of $0, with 162 households (1.1%) in this group.
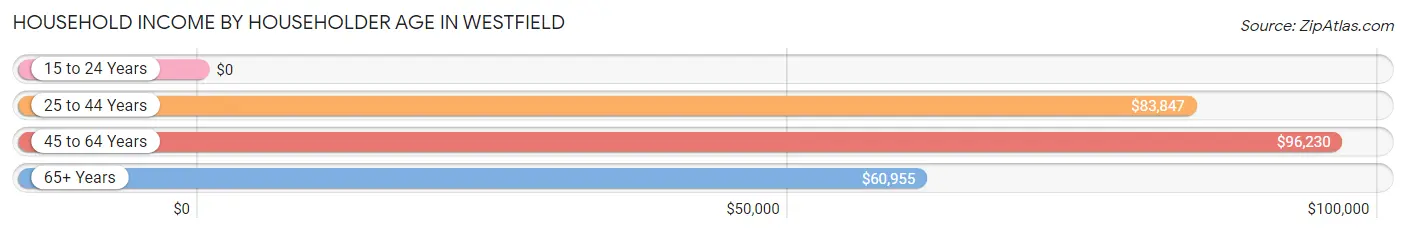
| Income Bracket | # Households | Median Income |
| 15 to 24 Years | 162 (1.1%) | $0 |
| 25 to 44 Years | 5,015 (32.5%) | $83,847 |
| 45 to 64 Years | 5,667 (36.7%) | $96,230 |
| 65+ Years | 4,591 (29.7%) | $60,955 |
| Total | 15,435 (100.0%) | $78,307 |
Poverty in Westfield
Income Below Poverty by Sex and Age in Westfield
With 7.9% poverty level for males and 9.7% for females among the residents of Westfield, 12 to 14 year old males and 18 to 24 year old females are the most vulnerable to poverty, with 134 males (19.6%) and 200 females (14.8%) in their respective age groups living below the poverty level.
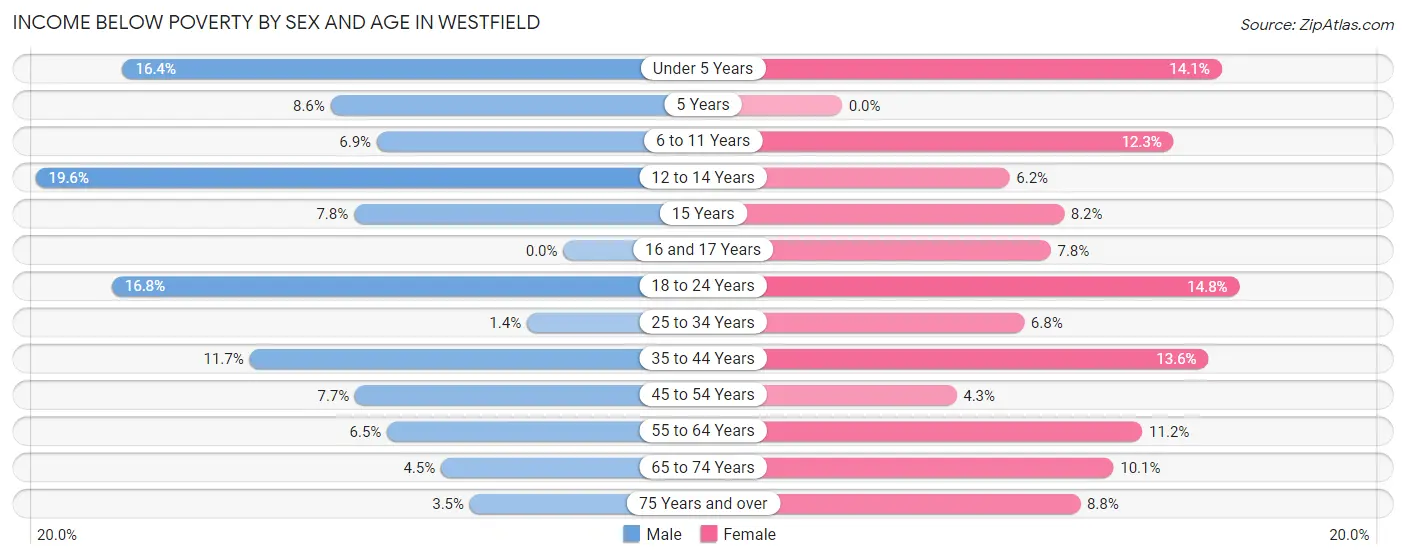
| Age Bracket | Male | Female |
| Under 5 Years | 116 (16.4%) | 152 (14.1%) |
| 5 Years | 21 (8.6%) | 0 (0.0%) |
| 6 to 11 Years | 96 (6.9%) | 162 (12.3%) |
| 12 to 14 Years | 134 (19.6%) | 45 (6.2%) |
| 15 Years | 22 (7.8%) | 14 (8.2%) |
| 16 and 17 Years | 0 (0.0%) | 44 (7.7%) |
| 18 to 24 Years | 276 (16.8%) | 200 (14.8%) |
| 25 to 34 Years | 32 (1.3%) | 201 (6.8%) |
| 35 to 44 Years | 263 (11.7%) | 310 (13.6%) |
| 45 to 54 Years | 190 (7.7%) | 99 (4.3%) |
| 55 to 64 Years | 184 (6.5%) | 299 (11.2%) |
| 65 to 74 Years | 93 (4.5%) | 262 (10.1%) |
| 75 Years and over | 31 (3.5%) | 134 (8.8%) |
| Total | 1,458 (7.9%) | 1,922 (9.7%) |
Income Above Poverty by Sex and Age in Westfield
According to the poverty statistics in Westfield, males aged 16 and 17 years and females aged 5 years are the age groups that are most secure financially, with 100.0% of males and 100.0% of females in these age groups living above the poverty line.
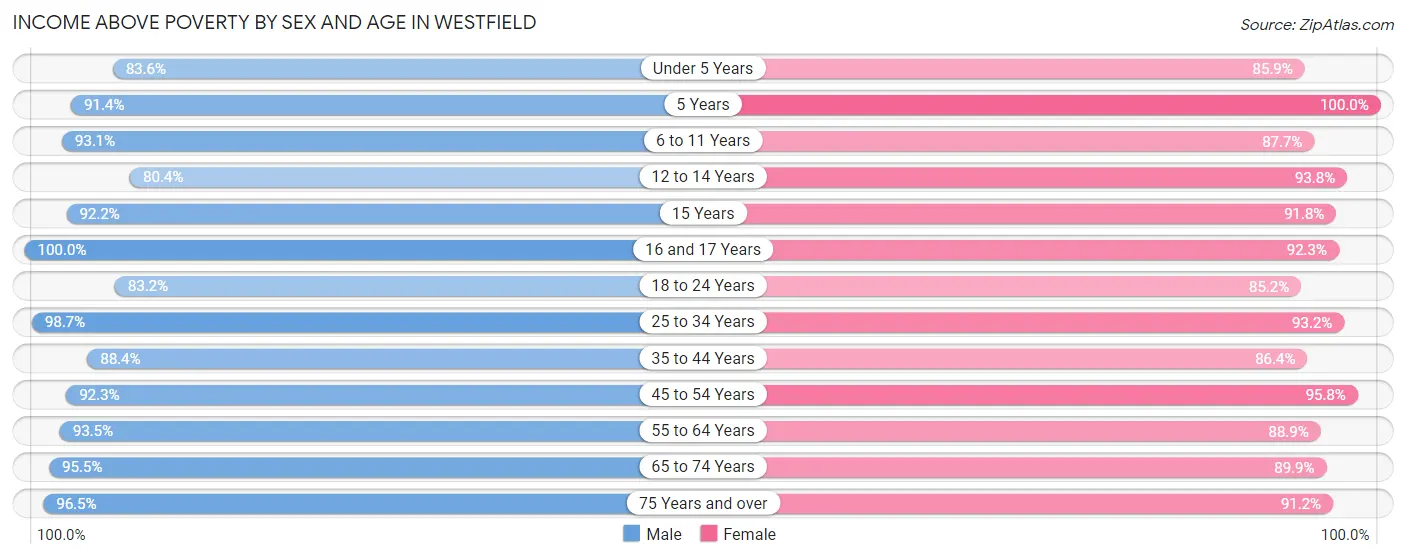
| Age Bracket | Male | Female |
| Under 5 Years | 593 (83.6%) | 926 (85.9%) |
| 5 Years | 222 (91.4%) | 213 (100.0%) |
| 6 to 11 Years | 1,292 (93.1%) | 1,153 (87.7%) |
| 12 to 14 Years | 550 (80.4%) | 678 (93.8%) |
| 15 Years | 261 (92.2%) | 156 (91.8%) |
| 16 and 17 Years | 595 (100.0%) | 524 (92.2%) |
| 18 to 24 Years | 1,371 (83.2%) | 1,155 (85.2%) |
| 25 to 34 Years | 2,339 (98.7%) | 2,771 (93.2%) |
| 35 to 44 Years | 1,994 (88.3%) | 1,968 (86.4%) |
| 45 to 54 Years | 2,269 (92.3%) | 2,231 (95.8%) |
| 55 to 64 Years | 2,630 (93.5%) | 2,383 (88.8%) |
| 65 to 74 Years | 1,957 (95.5%) | 2,338 (89.9%) |
| 75 Years and over | 862 (96.5%) | 1,381 (91.2%) |
| Total | 16,935 (92.1%) | 17,877 (90.3%) |
Income Below Poverty Among Married-Couple Families in Westfield
The poverty statistics for married-couple families in Westfield show that 3.7% or 283 of the total 7,587 families live below the poverty line. Families with 3 or 4 children have the highest poverty rate of 6.7%, comprising of 48 families. On the other hand, families with 5 or more children have the lowest poverty rate of 0.0%, which includes 0 families.
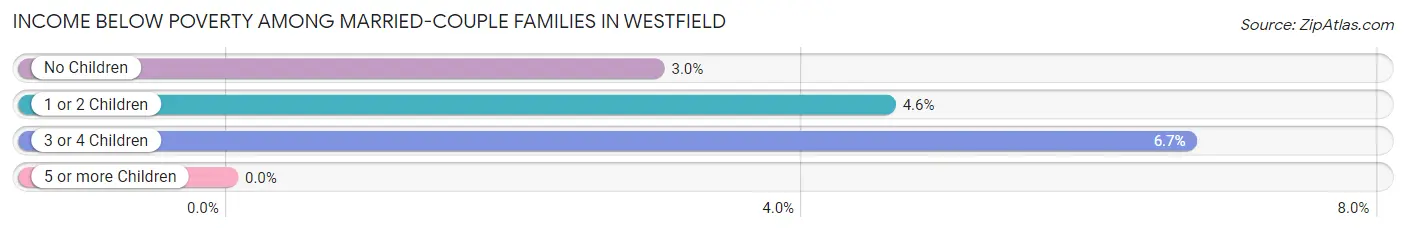
| Children | Above Poverty | Below Poverty |
| No Children | 4,602 (97.0%) | 141 (3.0%) |
| 1 or 2 Children | 1,957 (95.4%) | 94 (4.6%) |
| 3 or 4 Children | 671 (93.3%) | 48 (6.7%) |
| 5 or more Children | 74 (100.0%) | 0 (0.0%) |
| Total | 7,304 (96.3%) | 283 (3.7%) |
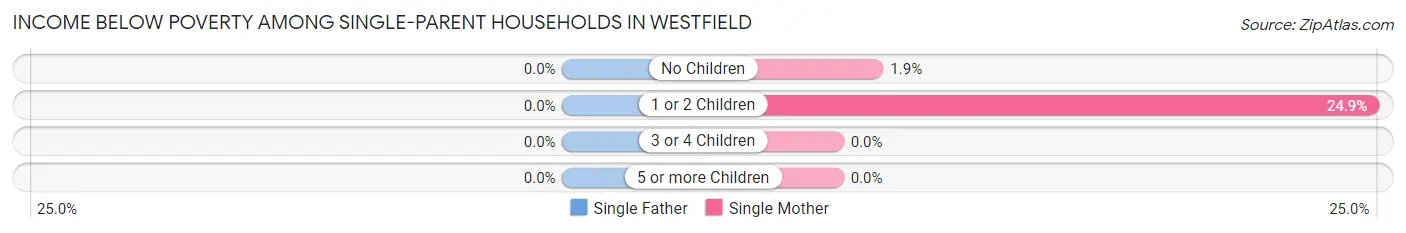
Income Below Poverty Among Single-Parent Households in Westfield
| Children | Single Father | Single Mother |
| No Children | 0 (0.0%) | 13 (1.8%) |
| 1 or 2 Children | 0 (0.0%) | 256 (24.9%) |
| 3 or 4 Children | 0 (0.0%) | 0 (0.0%) |
| 5 or more Children | 0 (0.0%) | 0 (0.0%) |
| Total | 0 (0.0%) | 269 (14.9%) |
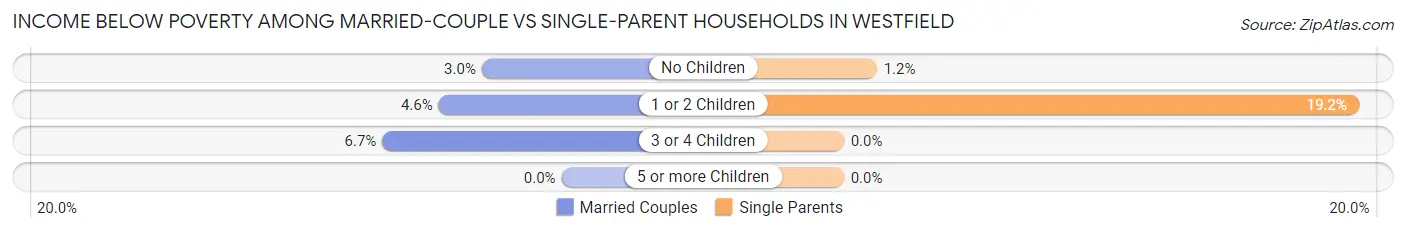
Income Below Poverty Among Married-Couple vs Single-Parent Households in Westfield
The poverty data for Westfield shows that 283 of the married-couple family households (3.7%) and 269 of the single-parent households (10.8%) are living below the poverty level. Within the married-couple family households, those with 3 or 4 children have the highest poverty rate, with 48 households (6.7%) falling below the poverty line. Among the single-parent households, those with 1 or 2 children have the highest poverty rate, with 256 household (19.2%) living below poverty.
| Children | Married-Couple Families | Single-Parent Households |
| No Children | 141 (3.0%) | 13 (1.2%) |
| 1 or 2 Children | 94 (4.6%) | 256 (19.2%) |
| 3 or 4 Children | 48 (6.7%) | 0 (0.0%) |
| 5 or more Children | 0 (0.0%) | 0 (0.0%) |
| Total | 283 (3.7%) | 269 (10.8%) |
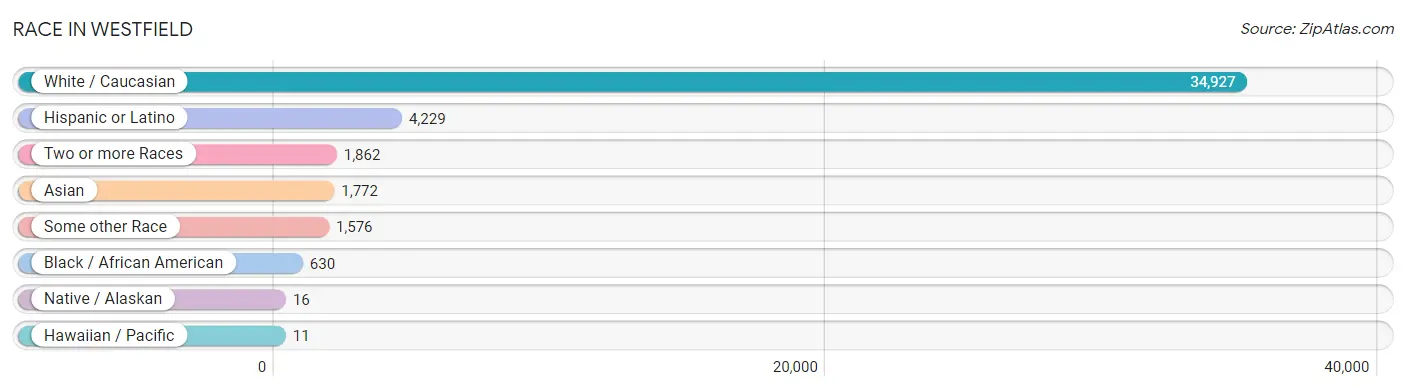
Race in Westfield
The most populous races in Westfield are White / Caucasian (34,927 | 85.6%), Hispanic or Latino (4,229 | 10.4%), and Two or more Races (1,862 | 4.6%).
| Race | # Population | % Population |
| Asian | 1,772 | 4.3% |
| Black / African American | 630 | 1.5% |
| Hawaiian / Pacific | 11 | 0.0% |
| Hispanic or Latino | 4,229 | 10.4% |
| Native / Alaskan | 16 | 0.0% |
| White / Caucasian | 34,927 | 85.6% |
| Two or more Races | 1,862 | 4.6% |
| Some other Race | 1,576 | 3.9% |
| Total | 40,794 | 100.0% |
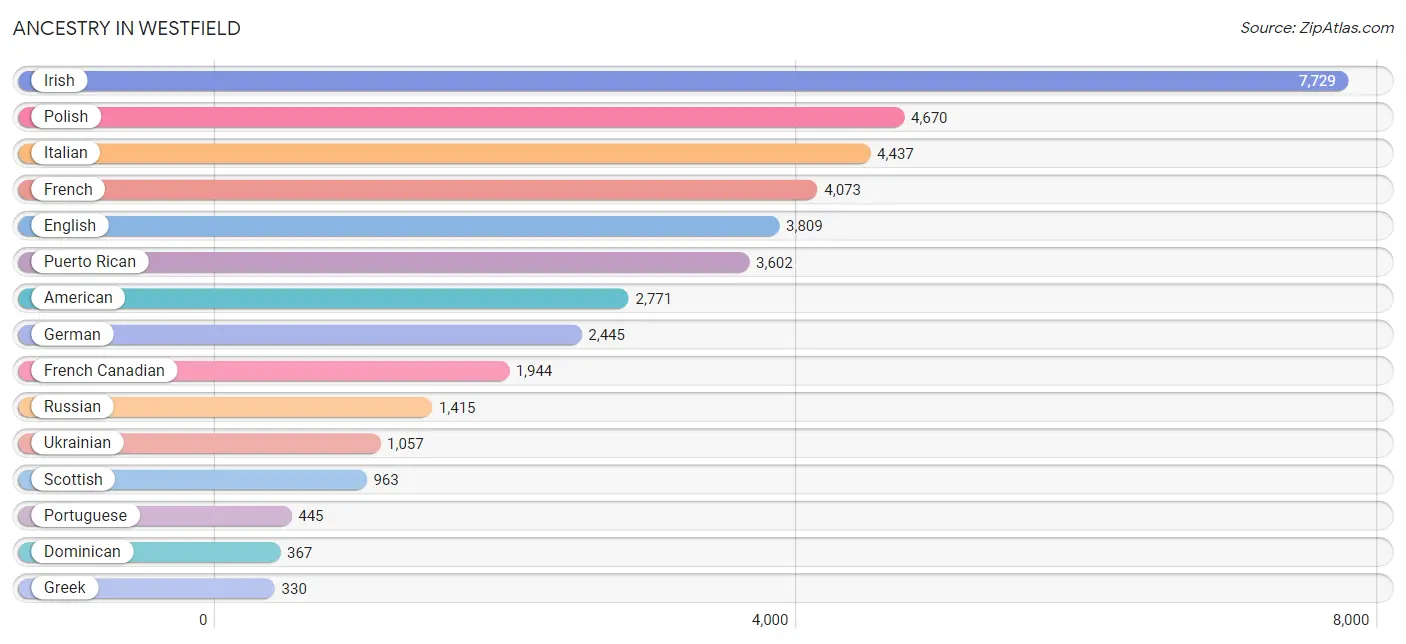
Ancestry in Westfield
The most populous ancestries reported in Westfield are Irish (7,729 | 19.0%), Polish (4,670 | 11.5%), Italian (4,437 | 10.9%), French (4,073 | 10.0%), and English (3,809 | 9.3%), together accounting for 60.6% of all Westfield residents.
| Ancestry | # Population | % Population |
| Afghan | 84 | 0.2% |
| African | 18 | 0.0% |
| Albanian | 23 | 0.1% |
| Alsatian | 16 | 0.0% |
| American | 2,771 | 6.8% |
| Arab | 68 | 0.2% |
| Armenian | 93 | 0.2% |
| Austrian | 52 | 0.1% |
| Bhutanese | 12 | 0.0% |
| Blackfeet | 10 | 0.0% |
| Brazilian | 94 | 0.2% |
| British | 163 | 0.4% |
| British West Indian | 9 | 0.0% |
| Burmese | 70 | 0.2% |
| Canadian | 203 | 0.5% |
| Cape Verdean | 11 | 0.0% |
| Central American | 36 | 0.1% |
| Cherokee | 113 | 0.3% |
| Croatian | 65 | 0.2% |
| Cuban | 35 | 0.1% |
| Czech | 122 | 0.3% |
| Czechoslovakian | 10 | 0.0% |
| Danish | 29 | 0.1% |
| Dominican | 367 | 0.9% |
| Dutch | 160 | 0.4% |
| Eastern European | 61 | 0.2% |
| English | 3,809 | 9.3% |
| European | 275 | 0.7% |
| Finnish | 33 | 0.1% |
| French | 4,073 | 10.0% |
| French American Indian | 2 | 0.0% |
| French Canadian | 1,944 | 4.8% |
| German | 2,445 | 6.0% |
| German Russian | 17 | 0.0% |
| Greek | 330 | 0.8% |
| Guatemalan | 21 | 0.1% |
| Honduran | 15 | 0.0% |
| Hungarian | 30 | 0.1% |
| Indian (Asian) | 315 | 0.8% |
| Iranian | 79 | 0.2% |
| Iraqi | 10 | 0.0% |
| Irish | 7,729 | 19.0% |
| Israeli | 13 | 0.0% |
| Italian | 4,437 | 10.9% |
| Jamaican | 17 | 0.0% |
| Japanese | 6 | 0.0% |
| Jordanian | 14 | 0.0% |
| Korean | 89 | 0.2% |
| Lebanese | 44 | 0.1% |
| Lithuanian | 225 | 0.5% |
| Mexican | 41 | 0.1% |
| Nigerian | 55 | 0.1% |
| Norwegian | 131 | 0.3% |
| Pakistani | 14 | 0.0% |
| Peruvian | 17 | 0.0% |
| Polish | 4,670 | 11.5% |
| Portuguese | 445 | 1.1% |
| Puerto Rican | 3,602 | 8.8% |
| Romanian | 55 | 0.1% |
| Russian | 1,415 | 3.5% |
| Samoan | 22 | 0.1% |
| Scandinavian | 28 | 0.1% |
| Scotch-Irish | 186 | 0.5% |
| Scottish | 963 | 2.4% |
| Slovak | 245 | 0.6% |
| Slovene | 58 | 0.1% |
| South American | 56 | 0.1% |
| Spaniard | 44 | 0.1% |
| Spanish | 12 | 0.0% |
| Sri Lankan | 28 | 0.1% |
| Subsaharan African | 109 | 0.3% |
| Swedish | 267 | 0.6% |
| Swiss | 8 | 0.0% |
| Thai | 148 | 0.4% |
| Trinidadian and Tobagonian | 10 | 0.0% |
| Ukrainian | 1,057 | 2.6% |
| Venezuelan | 39 | 0.1% |
| Welsh | 195 | 0.5% |
| West Indian | 126 | 0.3% |
| Zimbabwean | 20 | 0.1% | View All 80 Rows |
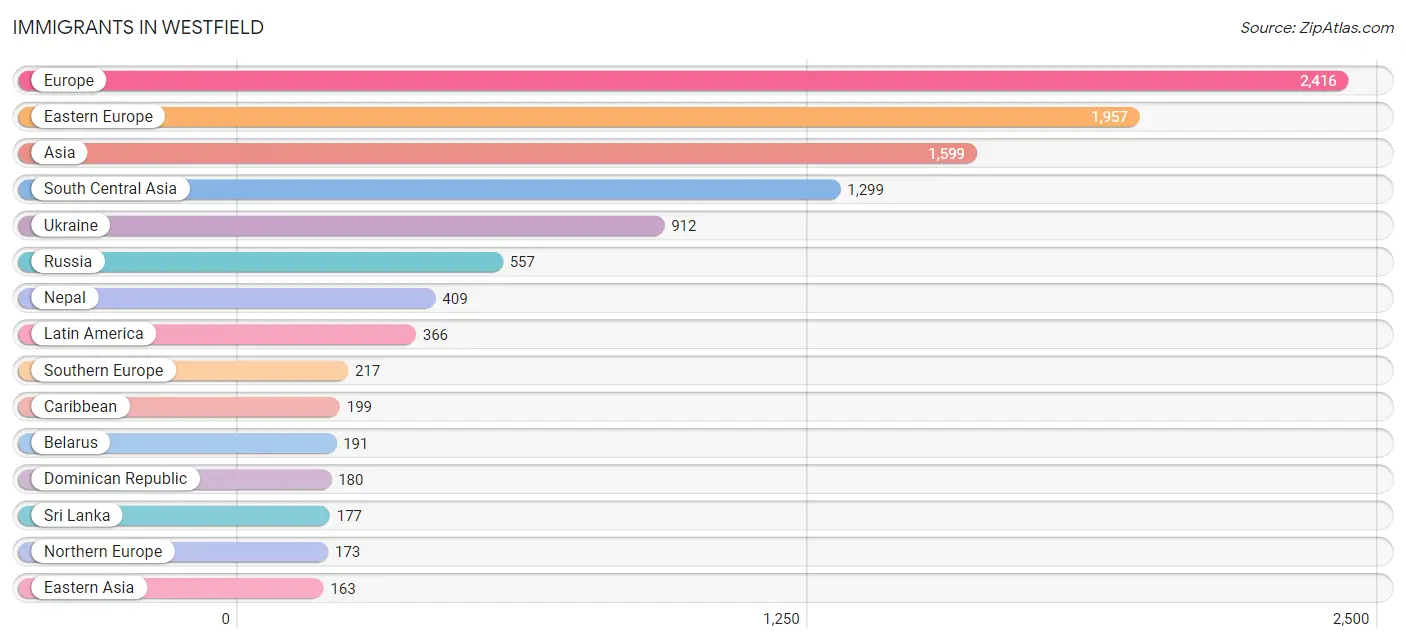
Immigrants in Westfield
The most numerous immigrant groups reported in Westfield came from Europe (2,416 | 5.9%), Eastern Europe (1,957 | 4.8%), Asia (1,599 | 3.9%), South Central Asia (1,299 | 3.2%), and Ukraine (912 | 2.2%), together accounting for 20.1% of all Westfield residents.
| Immigration Origin | # Population | % Population |
| Afghanistan | 109 | 0.3% |
| Africa | 70 | 0.2% |
| Asia | 1,599 | 3.9% |
| Azores | 137 | 0.3% |
| Belarus | 191 | 0.5% |
| Brazil | 101 | 0.3% |
| Canada | 79 | 0.2% |
| Caribbean | 199 | 0.5% |
| Central America | 12 | 0.0% |
| China | 129 | 0.3% |
| Colombia | 15 | 0.0% |
| Congo | 11 | 0.0% |
| Dominican Republic | 180 | 0.4% |
| Eastern Africa | 49 | 0.1% |
| Eastern Asia | 163 | 0.4% |
| Eastern Europe | 1,957 | 4.8% |
| England | 85 | 0.2% |
| Europe | 2,416 | 5.9% |
| France | 13 | 0.0% |
| Germany | 56 | 0.1% |
| Greece | 50 | 0.1% |
| Guatemala | 12 | 0.0% |
| India | 18 | 0.0% |
| Iran | 79 | 0.2% |
| Iraq | 10 | 0.0% |
| Israel | 42 | 0.1% |
| Italy | 30 | 0.1% |
| Japan | 12 | 0.0% |
| Jordan | 14 | 0.0% |
| Kazakhstan | 93 | 0.2% |
| Kenya | 18 | 0.0% |
| Korea | 22 | 0.1% |
| Latin America | 366 | 0.9% |
| Lebanon | 10 | 0.0% |
| Middle Africa | 11 | 0.0% |
| Moldova | 25 | 0.1% |
| Nepal | 409 | 1.0% |
| Nigeria | 10 | 0.0% |
| Northern Europe | 173 | 0.4% |
| Philippines | 13 | 0.0% |
| Poland | 144 | 0.4% |
| Portugal | 137 | 0.3% |
| Romania | 55 | 0.1% |
| Russia | 557 | 1.4% |
| South America | 155 | 0.4% |
| South Central Asia | 1,299 | 3.2% |
| South Eastern Asia | 55 | 0.1% |
| Southern Europe | 217 | 0.5% |
| Sri Lanka | 177 | 0.4% |
| Thailand | 14 | 0.0% |
| Trinidad and Tobago | 10 | 0.0% |
| Ukraine | 912 | 2.2% |
| Uzbekistan | 17 | 0.0% |
| Venezuela | 39 | 0.1% |
| Vietnam | 28 | 0.1% |
| West Indies | 9 | 0.0% |
| Western Africa | 10 | 0.0% |
| Western Asia | 82 | 0.2% |
| Western Europe | 69 | 0.2% |
| Zimbabwe | 31 | 0.1% | View All 60 Rows |
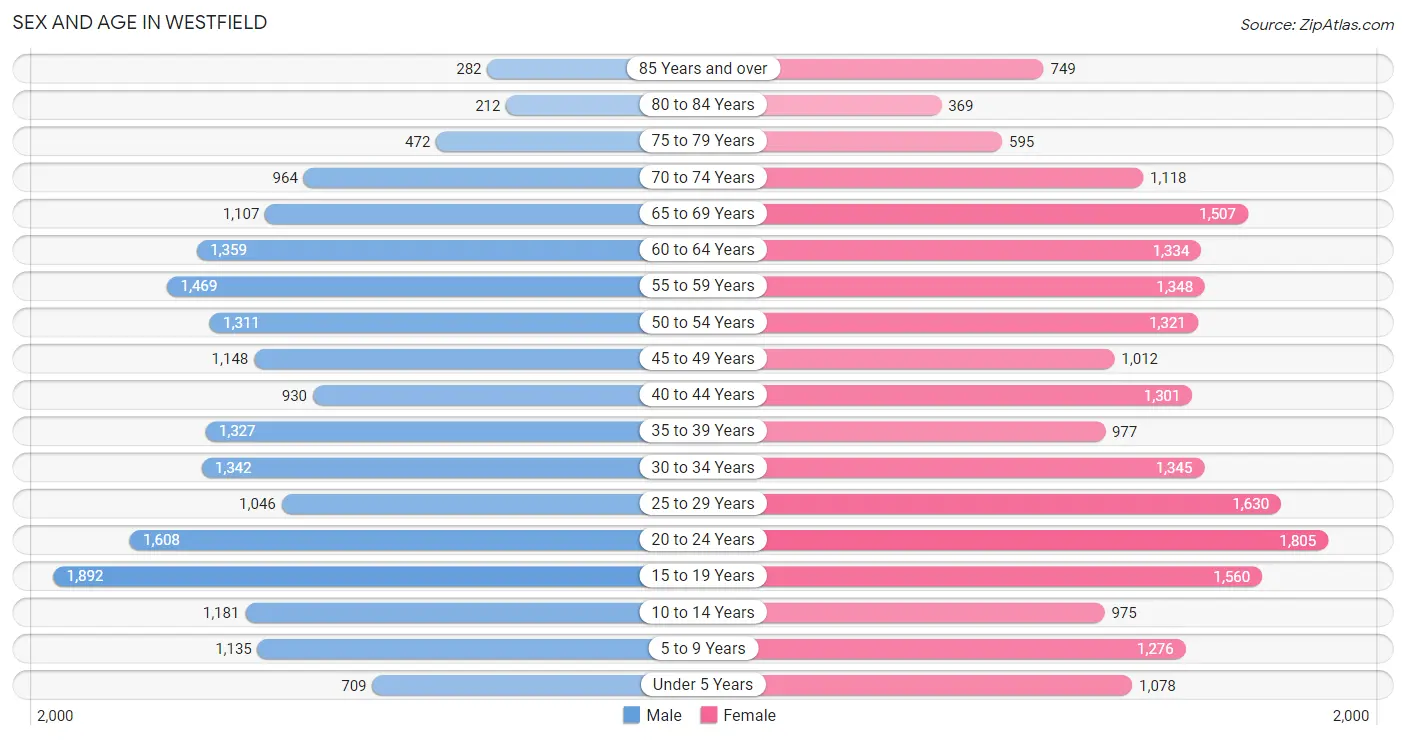
Sex and Age in Westfield
Sex and Age in Westfield
The most populous age groups in Westfield are 15 to 19 Years (1,892 | 9.7%) for men and 20 to 24 Years (1,805 | 8.5%) for women.
| Age Bracket | Male | Female |
| Under 5 Years | 709 (3.6%) | 1,078 (5.1%) |
| 5 to 9 Years | 1,135 (5.8%) | 1,276 (6.0%) |
| 10 to 14 Years | 1,181 (6.1%) | 975 (4.6%) |
| 15 to 19 Years | 1,892 (9.7%) | 1,560 (7.3%) |
| 20 to 24 Years | 1,608 (8.3%) | 1,805 (8.5%) |
| 25 to 29 Years | 1,046 (5.4%) | 1,630 (7.6%) |
| 30 to 34 Years | 1,342 (6.9%) | 1,345 (6.3%) |
| 35 to 39 Years | 1,327 (6.8%) | 977 (4.6%) |
| 40 to 44 Years | 930 (4.8%) | 1,301 (6.1%) |
| 45 to 49 Years | 1,148 (5.9%) | 1,012 (4.8%) |
| 50 to 54 Years | 1,311 (6.7%) | 1,321 (6.2%) |
| 55 to 59 Years | 1,469 (7.5%) | 1,348 (6.3%) |
| 60 to 64 Years | 1,359 (7.0%) | 1,334 (6.3%) |
| 65 to 69 Years | 1,107 (5.7%) | 1,507 (7.1%) |
| 70 to 74 Years | 964 (5.0%) | 1,118 (5.2%) |
| 75 to 79 Years | 472 (2.4%) | 595 (2.8%) |
| 80 to 84 Years | 212 (1.1%) | 369 (1.7%) |
| 85 Years and over | 282 (1.5%) | 749 (3.5%) |
| Total | 19,494 (100.0%) | 21,300 (100.0%) |
Families and Households in Westfield
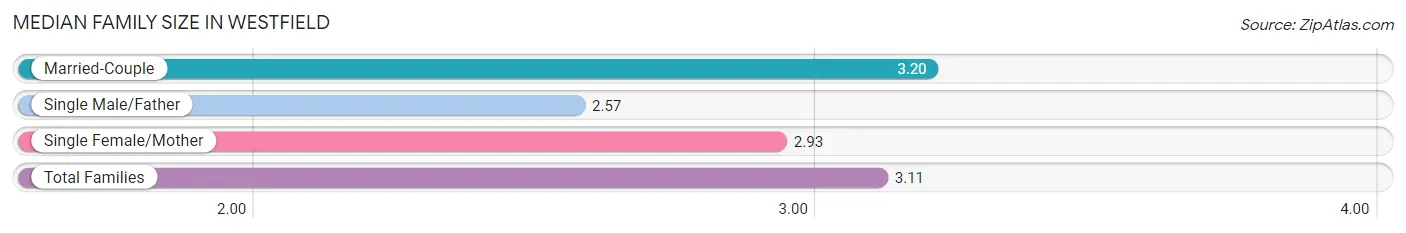
Median Family Size in Westfield
The median family size in Westfield is 3.11 persons per family, with married-couple families (7,587 | 75.4%) accounting for the largest median family size of 3.2 persons per family. On the other hand, single male/father families (682 | 6.8%) represent the smallest median family size with 2.57 persons per family.
| Family Type | # Families | Family Size |
| Married-Couple | 7,587 (75.4%) | 3.20 |
| Single Male/Father | 682 (6.8%) | 2.57 |
| Single Female/Mother | 1,799 (17.9%) | 2.93 |
| Total Families | 10,068 (100.0%) | 3.11 |
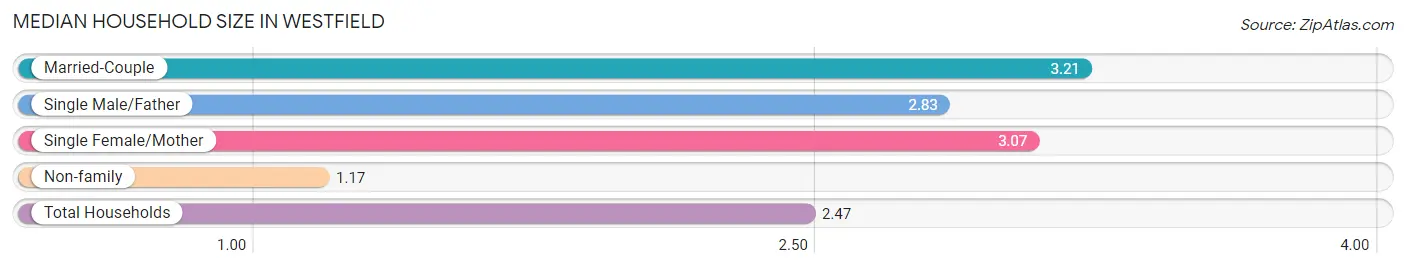
Median Household Size in Westfield
The median household size in Westfield is 2.47 persons per household, with married-couple households (7,587 | 49.1%) accounting for the largest median household size of 3.21 persons per household. non-family households (5,367 | 34.8%) represent the smallest median household size with 1.17 persons per household.
| Household Type | # Households | Household Size |
| Married-Couple | 7,587 (49.1%) | 3.21 |
| Single Male/Father | 682 (4.4%) | 2.83 |
| Single Female/Mother | 1,799 (11.7%) | 3.07 |
| Non-family | 5,367 (34.8%) | 1.17 |
| Total Households | 15,435 (100.0%) | 2.47 |
Household Size by Marriage Status in Westfield
Out of a total of 15,435 households in Westfield, 10,068 (65.2%) are family households, while 5,367 (34.8%) are nonfamily households. The most numerous type of family households are 2-person households, comprising 4,595, and the most common type of nonfamily households are 1-person households, comprising 4,616.
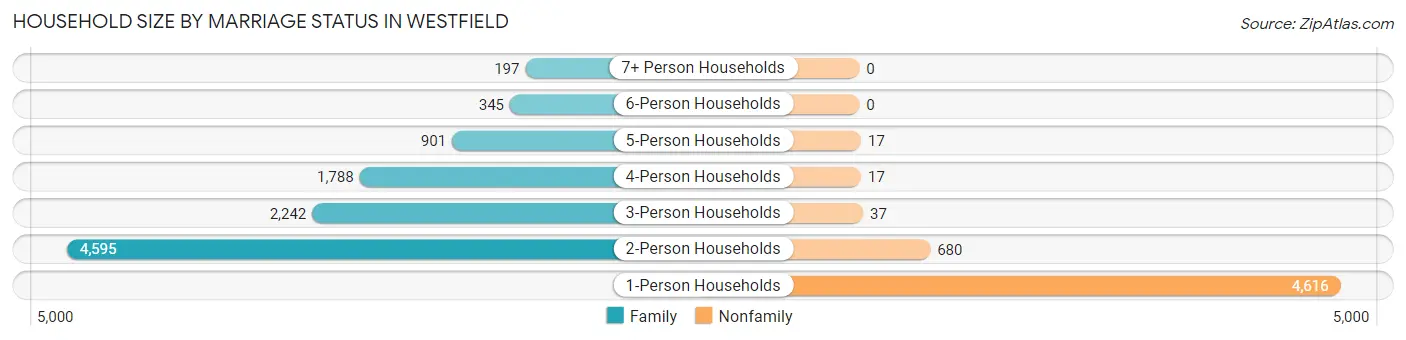
| Household Size | Family Households | Nonfamily Households |
| 1-Person Households | - | 4,616 (29.9%) |
| 2-Person Households | 4,595 (29.8%) | 680 (4.4%) |
| 3-Person Households | 2,242 (14.5%) | 37 (0.2%) |
| 4-Person Households | 1,788 (11.6%) | 17 (0.1%) |
| 5-Person Households | 901 (5.8%) | 17 (0.1%) |
| 6-Person Households | 345 (2.2%) | 0 (0.0%) |
| 7+ Person Households | 197 (1.3%) | 0 (0.0%) |
| Total | 10,068 (65.2%) | 5,367 (34.8%) |
Female Fertility in Westfield
Fertility by Age in Westfield
Average fertility rate in Westfield is 46.0 births per 1,000 women. Women in the age bracket of 20 to 34 years have the highest fertility rate with 83.0 births per 1,000 women. Women in the age bracket of 20 to 34 years acount for 85.9% of all women with births.
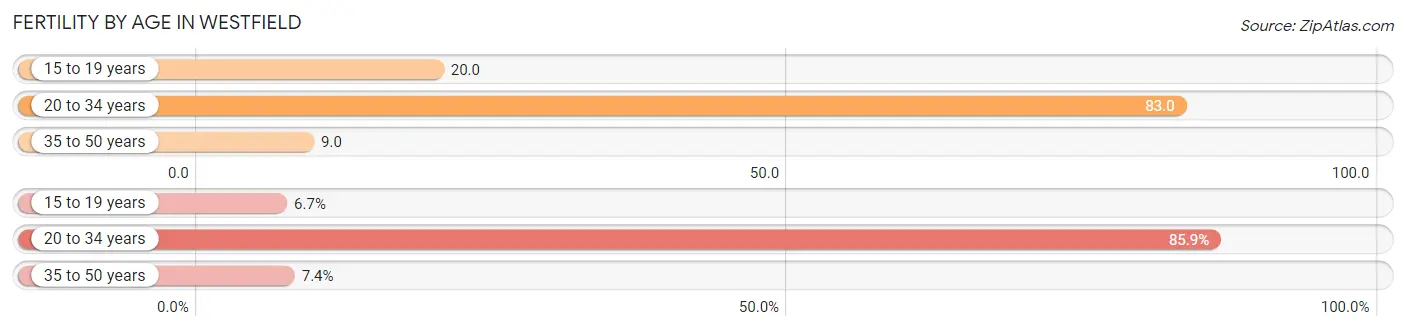
| Age Bracket | Women with Births | Births / 1,000 Women |
| 15 to 19 years | 31 (6.7%) | 20.0 |
| 20 to 34 years | 397 (85.9%) | 83.0 |
| 35 to 50 years | 34 (7.4%) | 9.0 |
| Total | 462 (100.0%) | 46.0 |
Fertility by Age by Marriage Status in Westfield
72.5% of women with births (462) in Westfield are married. The highest percentage of unmarried women with births falls into 15 to 19 years age bracket with 100.0% of them unmarried at the time of birth, while the lowest percentage of unmarried women with births belong to 35 to 50 years age bracket with 0.0% of them unmarried.
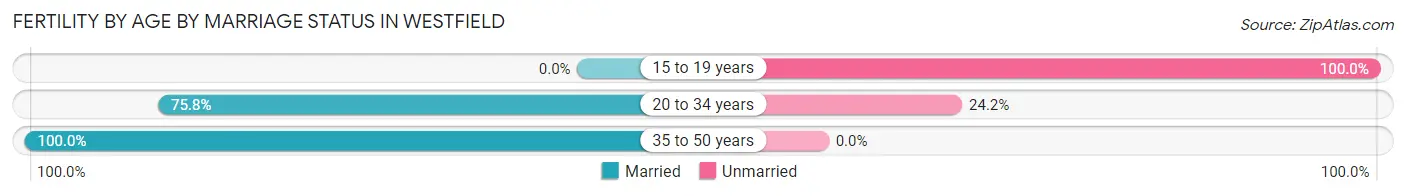
| Age Bracket | Married | Unmarried |
| 15 to 19 years | 0 (0.0%) | 31 (100.0%) |
| 20 to 34 years | 301 (75.8%) | 96 (24.2%) |
| 35 to 50 years | 34 (100.0%) | 0 (0.0%) |
| Total | 335 (72.5%) | 127 (27.5%) |
Fertility by Education in Westfield
Average fertility rate in Westfield is 46.0 births per 1,000 women. Women with the education attainment of graduate degree have the highest fertility rate of 111.0 births per 1,000 women, while women with the education attainment of high school diploma have the lowest fertility at 7.0 births per 1,000 women. Women with the education attainment of less than high school represent 31.2% of all women with births.
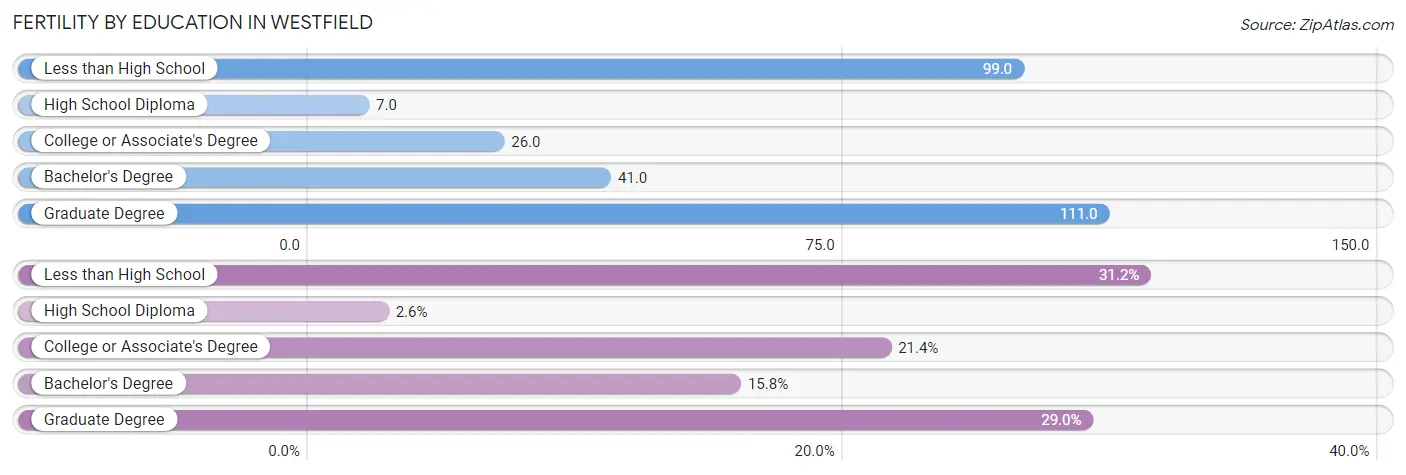
| Educational Attainment | Women with Births | Births / 1,000 Women |
| Less than High School | 144 (31.2%) | 99.0 |
| High School Diploma | 12 (2.6%) | 7.0 |
| College or Associate's Degree | 99 (21.4%) | 26.0 |
| Bachelor's Degree | 73 (15.8%) | 41.0 |
| Graduate Degree | 134 (29.0%) | 111.0 |
| Total | 462 (100.0%) | 46.0 |
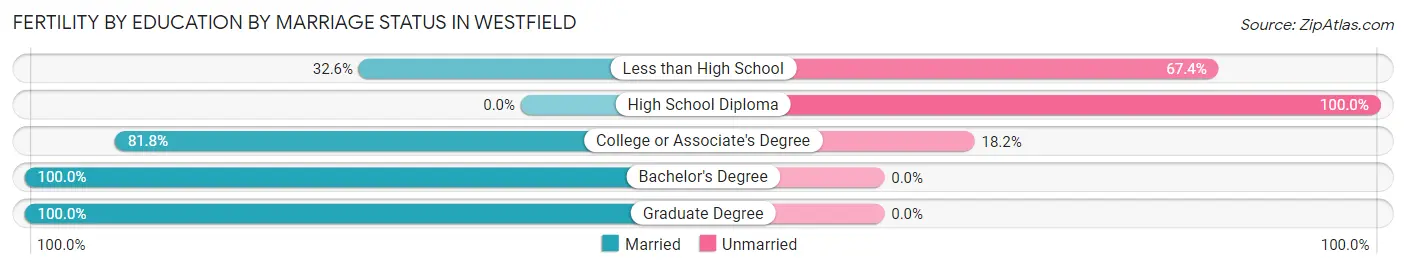
Fertility by Education by Marriage Status in Westfield
27.5% of women with births in Westfield are unmarried. Women with the educational attainment of bachelor's degree are most likely to be married with 100.0% of them married at childbirth, while women with the educational attainment of high school diploma are least likely to be married with 100.0% of them unmarried at childbirth.
| Educational Attainment | Married | Unmarried |
| Less than High School | 47 (32.6%) | 97 (67.4%) |
| High School Diploma | 0 (0.0%) | 12 (100.0%) |
| College or Associate's Degree | 81 (81.8%) | 18 (18.2%) |
| Bachelor's Degree | 73 (100.0%) | 0 (0.0%) |
| Graduate Degree | 134 (100.0%) | 0 (0.0%) |
| Total | 335 (72.5%) | 127 (27.5%) |
Employment Characteristics in Westfield
Employment by Class of Employer in Westfield
Among the 18,935 employed individuals in Westfield, private company employees (11,691 | 61.7%), not-for-profit organizations (2,158 | 11.4%), and local government employees (1,784 | 9.4%) make up the most common classes of employment.
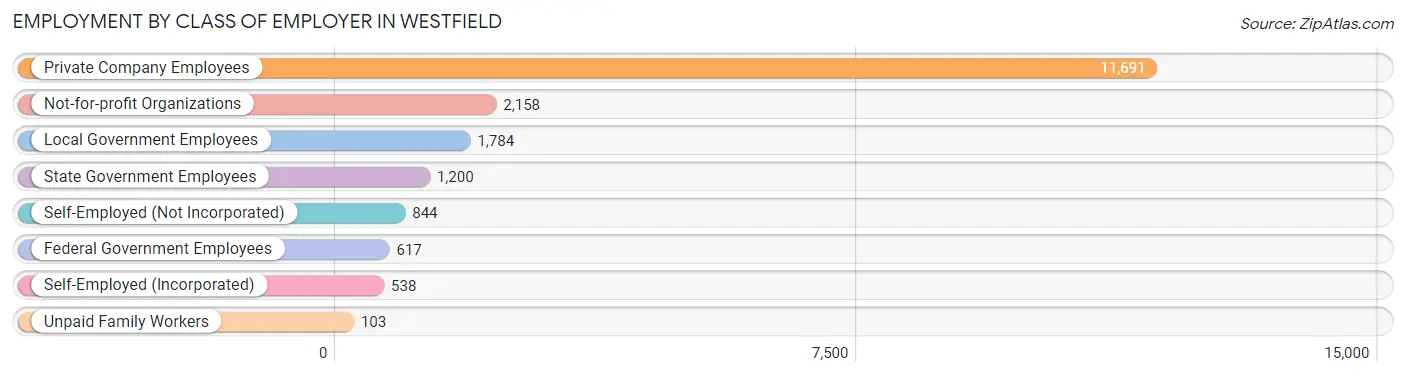
| Employer Class | # Employees | % Employees |
| Private Company Employees | 11,691 | 61.7% |
| Self-Employed (Incorporated) | 538 | 2.8% |
| Self-Employed (Not Incorporated) | 844 | 4.5% |
| Not-for-profit Organizations | 2,158 | 11.4% |
| Local Government Employees | 1,784 | 9.4% |
| State Government Employees | 1,200 | 6.3% |
| Federal Government Employees | 617 | 3.3% |
| Unpaid Family Workers | 103 | 0.5% |
| Total | 18,935 | 100.0% |
Employment Status by Age in Westfield
According to the labor force statistics for Westfield, out of the total population over 16 years of age (33,969), 59.5% or 20,212 individuals are in the labor force, with 4.5% or 910 of them unemployed. The age group with the highest labor force participation rate is 30 to 34 years, with 89.2% or 2,397 individuals in the labor force. Within the labor force, the 75 years and over age range has the highest percentage of unemployed individuals, with 19.2% or 41 of them being unemployed.
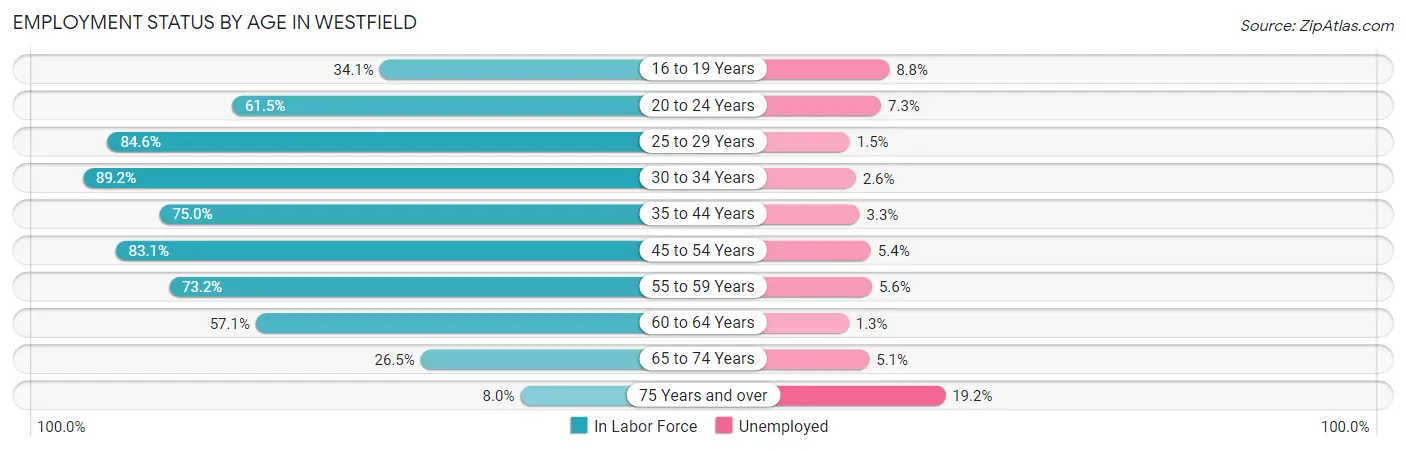
| Age Bracket | In Labor Force | Unemployed |
| 16 to 19 Years | 1,017 (34.1%) | 89 (8.8%) |
| 20 to 24 Years | 2,099 (61.5%) | 153 (7.3%) |
| 25 to 29 Years | 2,264 (84.6%) | 34 (1.5%) |
| 30 to 34 Years | 2,397 (89.2%) | 62 (2.6%) |
| 35 to 44 Years | 3,401 (75.0%) | 112 (3.3%) |
| 45 to 54 Years | 3,982 (83.1%) | 215 (5.4%) |
| 55 to 59 Years | 2,062 (73.2%) | 115 (5.6%) |
| 60 to 64 Years | 1,538 (57.1%) | 20 (1.3%) |
| 65 to 74 Years | 1,244 (26.5%) | 63 (5.1%) |
| 75 Years and over | 214 (8.0%) | 41 (19.2%) |
| Total | 20,212 (59.5%) | 910 (4.5%) |
Employment Status by Educational Attainment in Westfield
According to labor force statistics for Westfield, 77.4% of individuals (15,635) out of the total population between 25 and 64 years of age (20,200) are in the labor force, with 3.5% or 547 of them being unemployed. The group with the highest labor force participation rate are those with the educational attainment of bachelor's degree or higher, with 88.2% or 6,143 individuals in the labor force. Within the labor force, individuals with less than high school education have the highest percentage of unemployment, with 6.2% or 65 of them being unemployed.
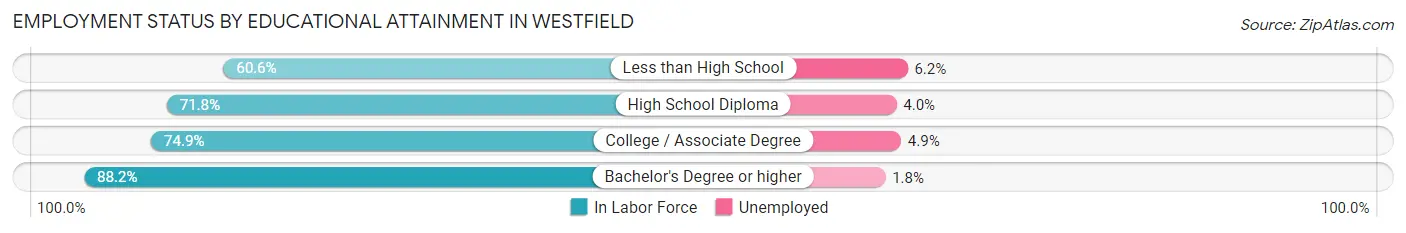
| Educational Attainment | In Labor Force | Unemployed |
| Less than High School | 1,051 (60.6%) | 108 (6.2%) |
| High School Diploma | 3,818 (71.8%) | 213 (4.0%) |
| College / Associate Degree | 4,632 (74.9%) | 303 (4.9%) |
| Bachelor's Degree or higher | 6,143 (88.2%) | 125 (1.8%) |
| Total | 15,635 (77.4%) | 707 (3.5%) |
Employment Occupations by Sex in Westfield
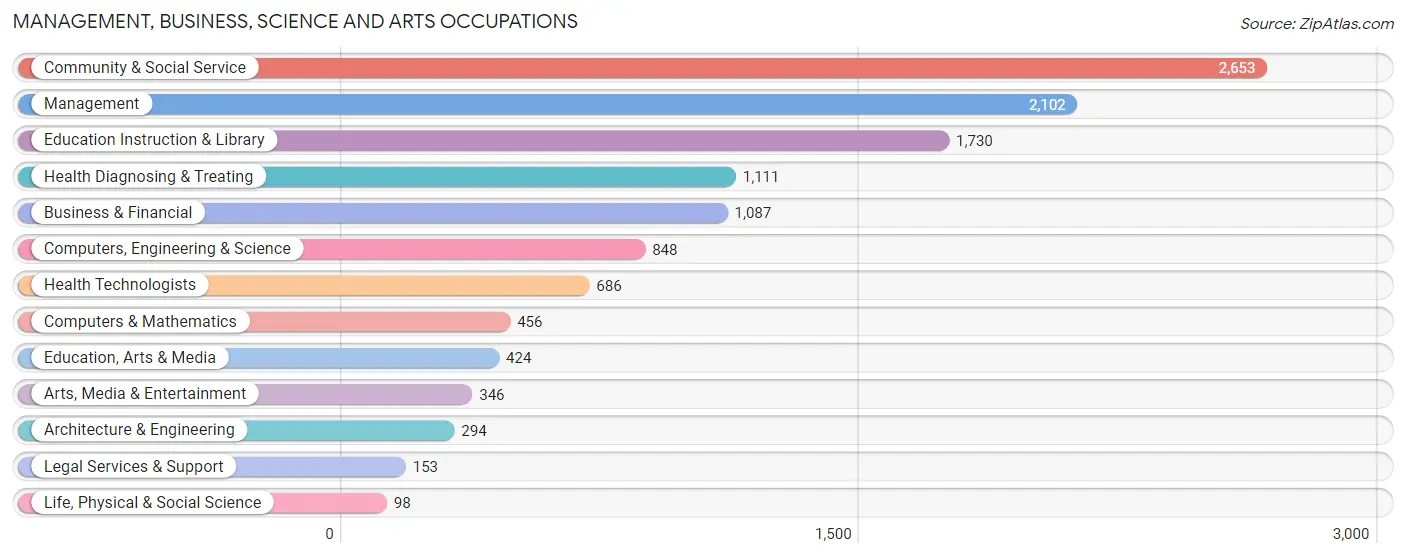
Management, Business, Science and Arts Occupations
The most common Management, Business, Science and Arts occupations in Westfield are Community & Social Service (2,653 | 13.8%), Management (2,102 | 10.9%), Education Instruction & Library (1,730 | 9.0%), Health Diagnosing & Treating (1,111 | 5.8%), and Business & Financial (1,087 | 5.7%).
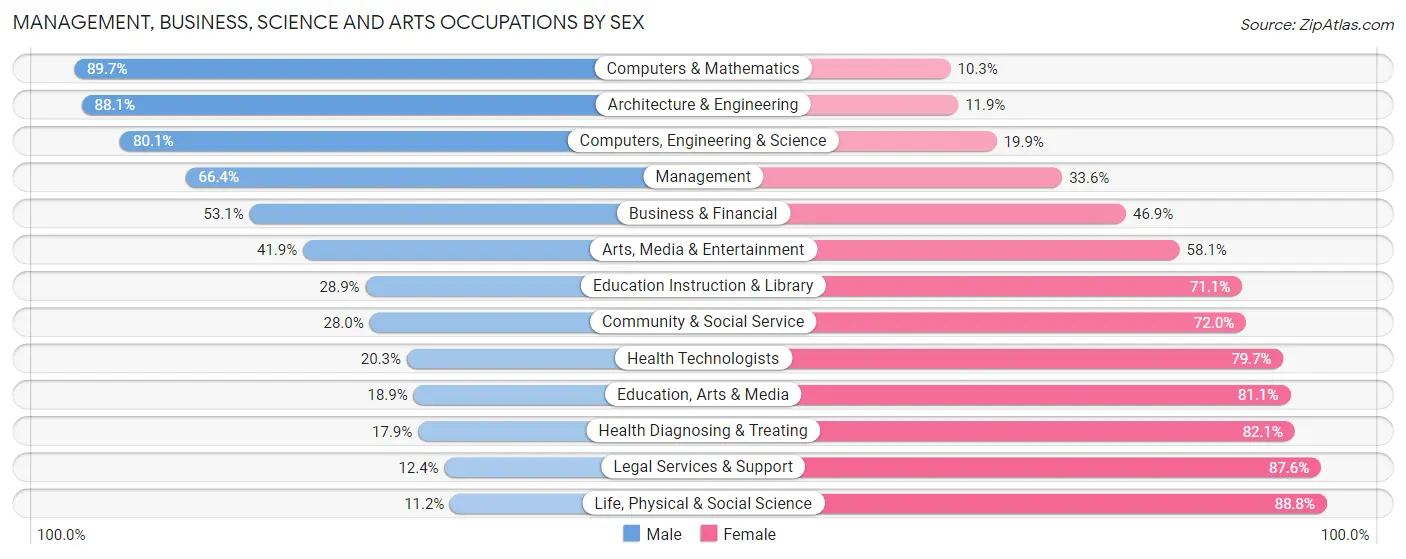
Management, Business, Science and Arts Occupations by Sex
Within the Management, Business, Science and Arts occupations in Westfield, the most male-oriented occupations are Computers & Mathematics (89.7%), Architecture & Engineering (88.1%), and Computers, Engineering & Science (80.1%), while the most female-oriented occupations are Life, Physical & Social Science (88.8%), Legal Services & Support (87.6%), and Health Diagnosing & Treating (82.1%).
| Occupation | Male | Female |
| Management | 1,396 (66.4%) | 706 (33.6%) |
| Business & Financial | 577 (53.1%) | 510 (46.9%) |
| Computers, Engineering & Science | 679 (80.1%) | 169 (19.9%) |
| Computers & Mathematics | 409 (89.7%) | 47 (10.3%) |
| Architecture & Engineering | 259 (88.1%) | 35 (11.9%) |
| Life, Physical & Social Science | 11 (11.2%) | 87 (88.8%) |
| Community & Social Service | 744 (28.0%) | 1,909 (72.0%) |
| Education, Arts & Media | 80 (18.9%) | 344 (81.1%) |
| Legal Services & Support | 19 (12.4%) | 134 (87.6%) |
| Education Instruction & Library | 500 (28.9%) | 1,230 (71.1%) |
| Arts, Media & Entertainment | 145 (41.9%) | 201 (58.1%) |
| Health Diagnosing & Treating | 199 (17.9%) | 912 (82.1%) |
| Health Technologists | 139 (20.3%) | 547 (79.7%) |
| Total (Category) | 3,595 (46.1%) | 4,206 (53.9%) |
| Total (Overall) | 10,190 (53.0%) | 9,041 (47.0%) |
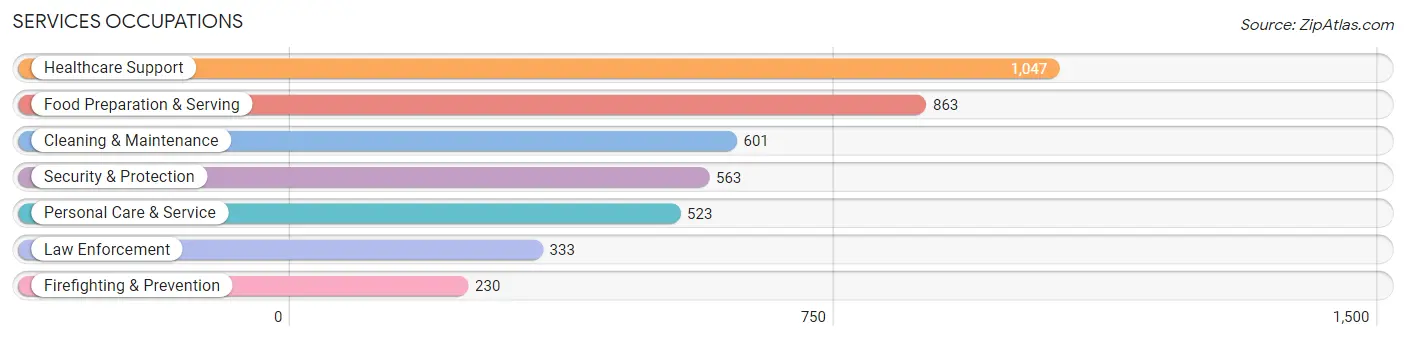
Services Occupations
The most common Services occupations in Westfield are Healthcare Support (1,047 | 5.4%), Food Preparation & Serving (863 | 4.5%), Cleaning & Maintenance (601 | 3.1%), Security & Protection (563 | 2.9%), and Personal Care & Service (523 | 2.7%).
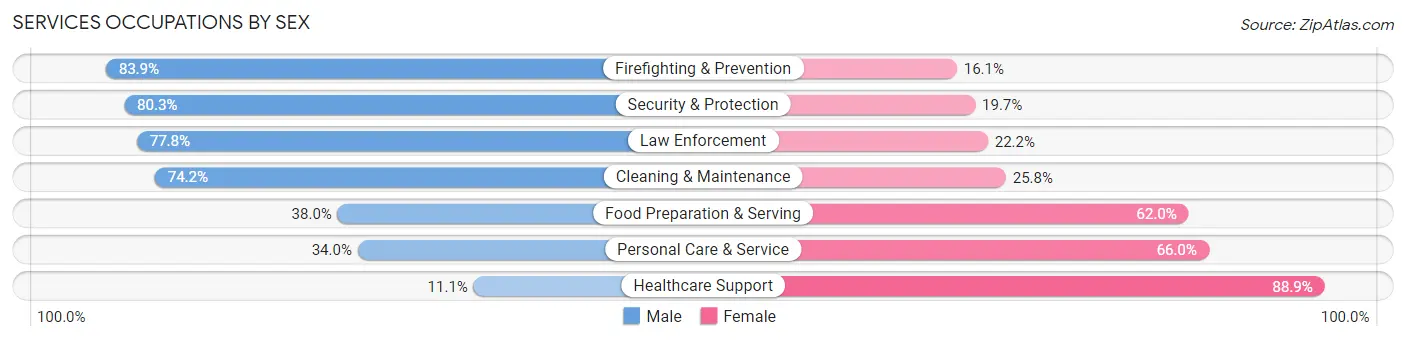
Services Occupations by Sex
Within the Services occupations in Westfield, the most male-oriented occupations are Firefighting & Prevention (83.9%), Security & Protection (80.3%), and Law Enforcement (77.8%), while the most female-oriented occupations are Healthcare Support (88.9%), Personal Care & Service (66.0%), and Food Preparation & Serving (62.0%).
| Occupation | Male | Female |
| Healthcare Support | 116 (11.1%) | 931 (88.9%) |
| Security & Protection | 452 (80.3%) | 111 (19.7%) |
| Firefighting & Prevention | 193 (83.9%) | 37 (16.1%) |
| Law Enforcement | 259 (77.8%) | 74 (22.2%) |
| Food Preparation & Serving | 328 (38.0%) | 535 (62.0%) |
| Cleaning & Maintenance | 446 (74.2%) | 155 (25.8%) |
| Personal Care & Service | 178 (34.0%) | 345 (66.0%) |
| Total (Category) | 1,520 (42.3%) | 2,077 (57.7%) |
| Total (Overall) | 10,190 (53.0%) | 9,041 (47.0%) |
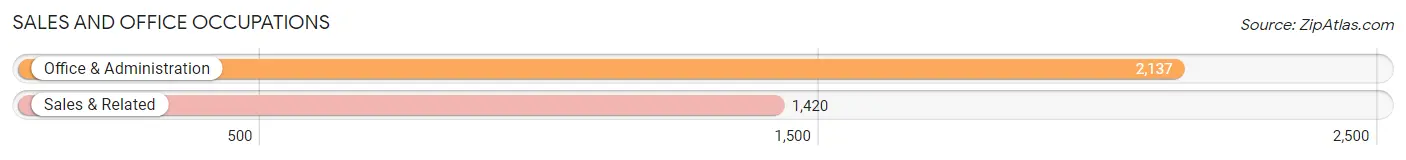
Sales and Office Occupations
The most common Sales and Office occupations in Westfield are Office & Administration (2,137 | 11.1%), and Sales & Related (1,420 | 7.4%).
Sales and Office Occupations by Sex
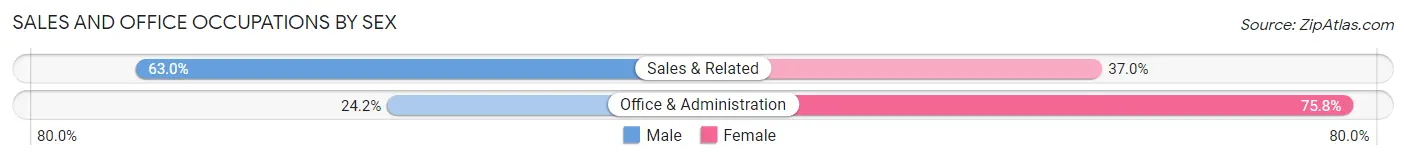
| Occupation | Male | Female |
| Sales & Related | 894 (63.0%) | 526 (37.0%) |
| Office & Administration | 518 (24.2%) | 1,619 (75.8%) |
| Total (Category) | 1,412 (39.7%) | 2,145 (60.3%) |
| Total (Overall) | 10,190 (53.0%) | 9,041 (47.0%) |
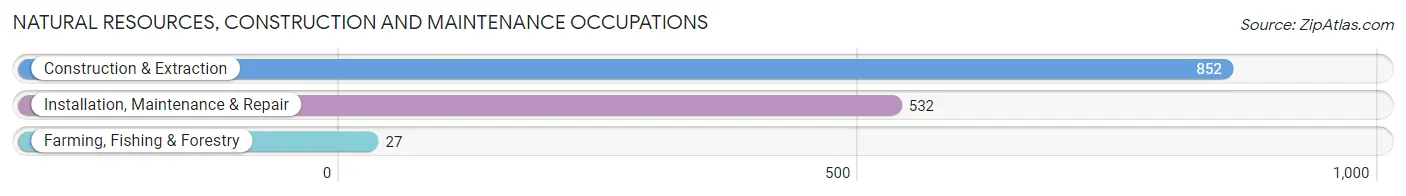
Natural Resources, Construction and Maintenance Occupations
The most common Natural Resources, Construction and Maintenance occupations in Westfield are Construction & Extraction (852 | 4.4%), Installation, Maintenance & Repair (532 | 2.8%), and Farming, Fishing & Forestry (27 | 0.1%).
Natural Resources, Construction and Maintenance Occupations by Sex
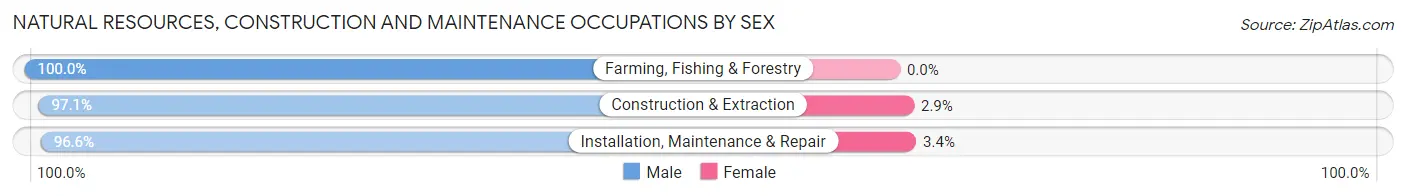
| Occupation | Male | Female |
| Farming, Fishing & Forestry | 27 (100.0%) | 0 (0.0%) |
| Construction & Extraction | 827 (97.1%) | 25 (2.9%) |
| Installation, Maintenance & Repair | 514 (96.6%) | 18 (3.4%) |
| Total (Category) | 1,368 (97.0%) | 43 (3.0%) |
| Total (Overall) | 10,190 (53.0%) | 9,041 (47.0%) |
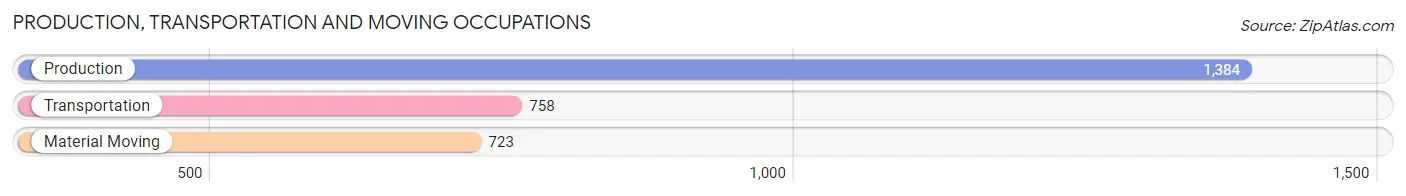
Production, Transportation and Moving Occupations
The most common Production, Transportation and Moving occupations in Westfield are Production (1,384 | 7.2%), Transportation (758 | 3.9%), and Material Moving (723 | 3.8%).
Production, Transportation and Moving Occupations by Sex
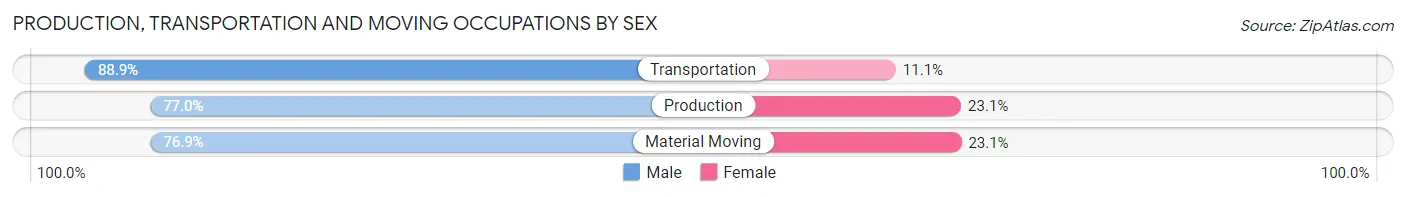
| Occupation | Male | Female |
| Production | 1,065 (76.9%) | 319 (23.1%) |
| Transportation | 674 (88.9%) | 84 (11.1%) |
| Material Moving | 556 (76.9%) | 167 (23.1%) |
| Total (Category) | 2,295 (80.1%) | 570 (19.9%) |
| Total (Overall) | 10,190 (53.0%) | 9,041 (47.0%) |
Employment Industries by Sex in Westfield
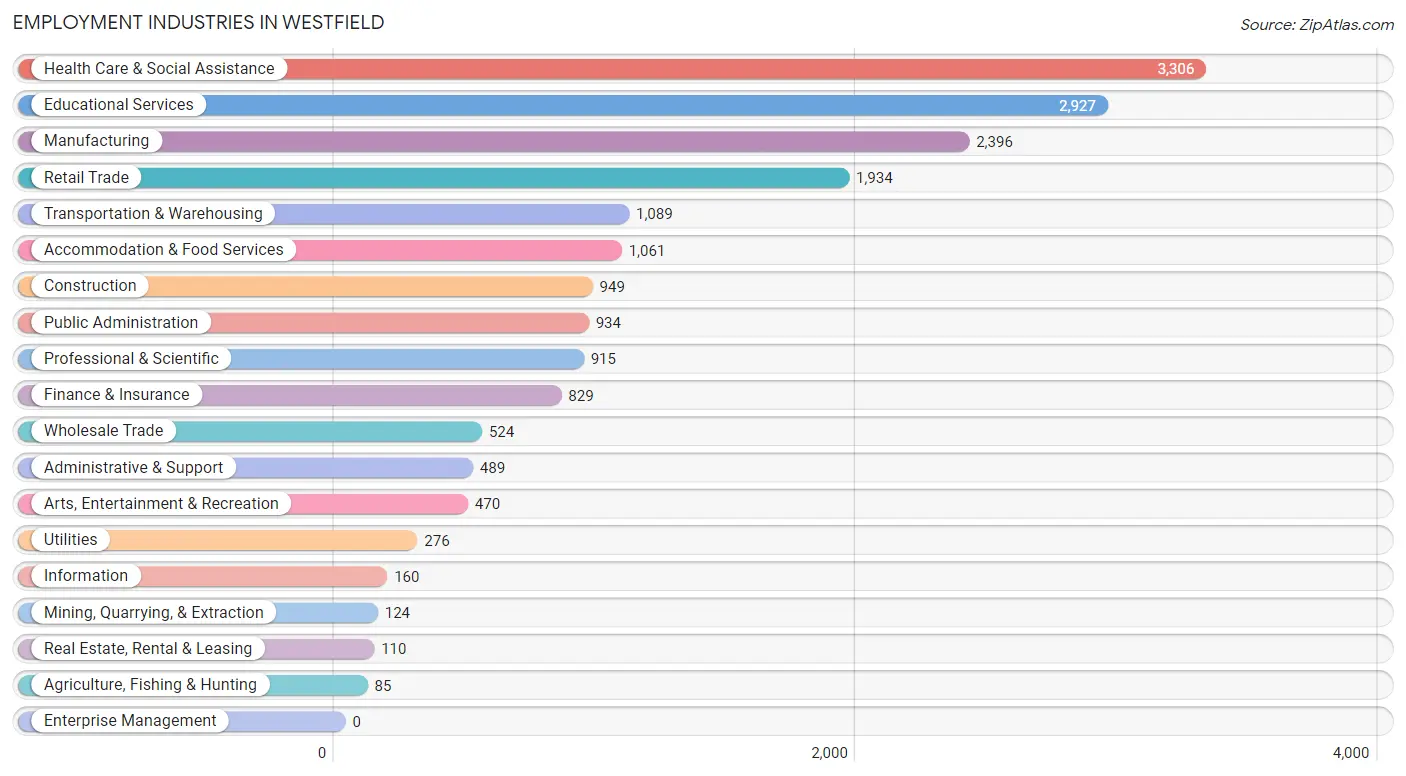
Employment Industries in Westfield
The major employment industries in Westfield include Health Care & Social Assistance (3,306 | 17.2%), Educational Services (2,927 | 15.2%), Manufacturing (2,396 | 12.5%), Retail Trade (1,934 | 10.1%), and Transportation & Warehousing (1,089 | 5.7%).
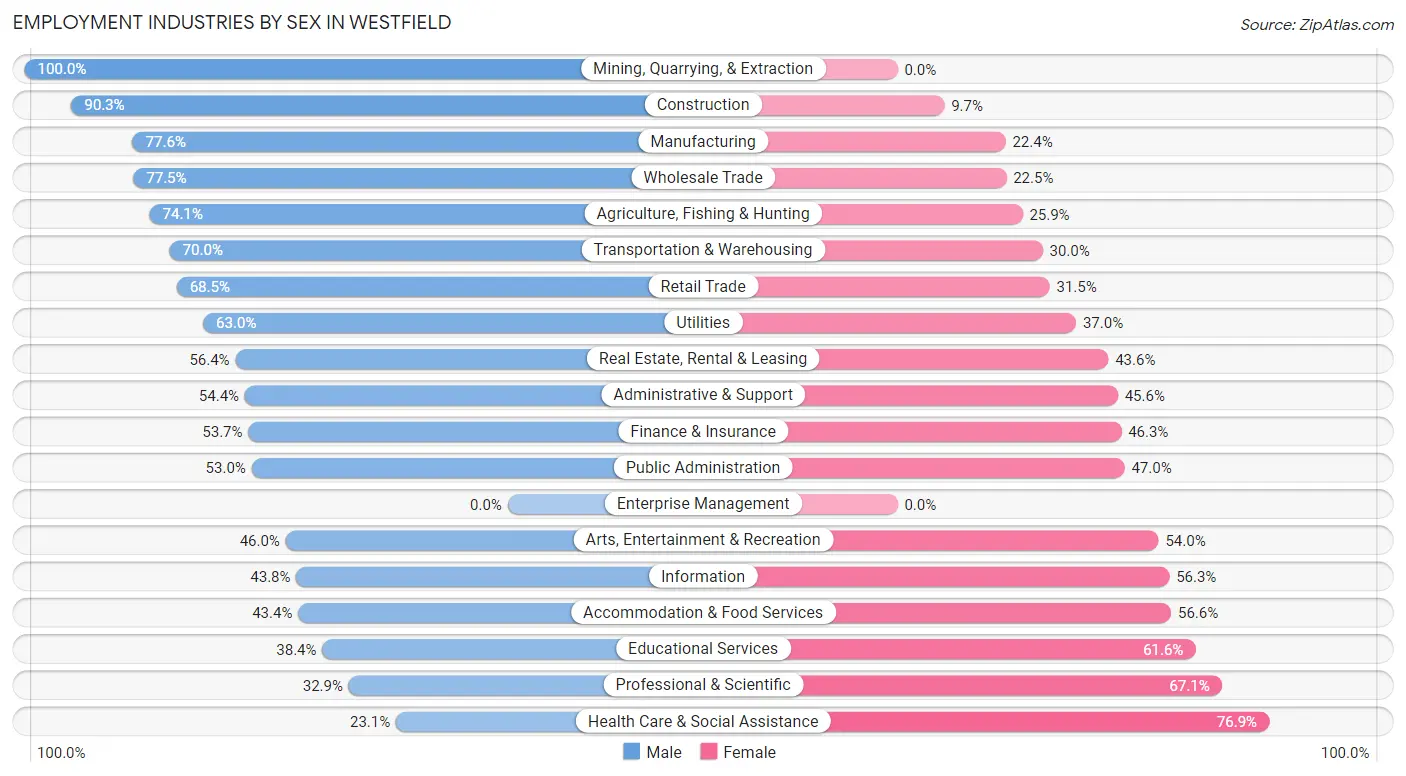
Employment Industries by Sex in Westfield
The Westfield industries that see more men than women are Mining, Quarrying, & Extraction (100.0%), Construction (90.3%), and Manufacturing (77.6%), whereas the industries that tend to have a higher number of women are Health Care & Social Assistance (76.9%), Professional & Scientific (67.1%), and Educational Services (61.6%).
| Industry | Male | Female |
| Agriculture, Fishing & Hunting | 63 (74.1%) | 22 (25.9%) |
| Mining, Quarrying, & Extraction | 124 (100.0%) | 0 (0.0%) |
| Construction | 857 (90.3%) | 92 (9.7%) |
| Manufacturing | 1,860 (77.6%) | 536 (22.4%) |
| Wholesale Trade | 406 (77.5%) | 118 (22.5%) |
| Retail Trade | 1,325 (68.5%) | 609 (31.5%) |
| Transportation & Warehousing | 762 (70.0%) | 327 (30.0%) |
| Utilities | 174 (63.0%) | 102 (37.0%) |
| Information | 70 (43.8%) | 90 (56.2%) |
| Finance & Insurance | 445 (53.7%) | 384 (46.3%) |
| Real Estate, Rental & Leasing | 62 (56.4%) | 48 (43.6%) |
| Professional & Scientific | 301 (32.9%) | 614 (67.1%) |
| Enterprise Management | 0 (0.0%) | 0 (0.0%) |
| Administrative & Support | 266 (54.4%) | 223 (45.6%) |
| Educational Services | 1,123 (38.4%) | 1,804 (61.6%) |
| Health Care & Social Assistance | 764 (23.1%) | 2,542 (76.9%) |
| Arts, Entertainment & Recreation | 216 (46.0%) | 254 (54.0%) |
| Accommodation & Food Services | 460 (43.4%) | 601 (56.6%) |
| Public Administration | 495 (53.0%) | 439 (47.0%) |
| Total | 10,190 (53.0%) | 9,041 (47.0%) |
Education in Westfield
School Enrollment in Westfield
The most common levels of schooling among the 10,998 students in Westfield are college / undergraduate (4,049 | 36.8%), high school (2,055 | 18.7%), and elementary school (1,823 | 16.6%).
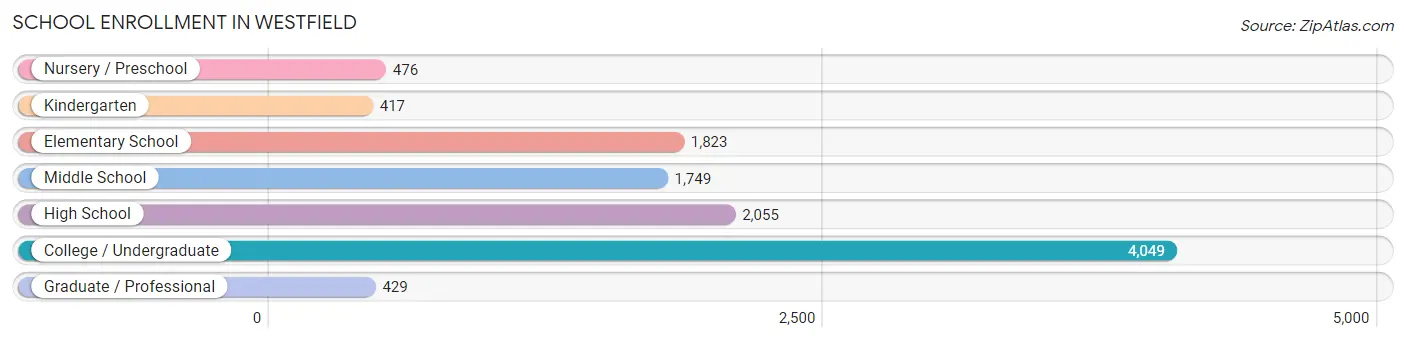
| School Level | # Students | % Students |
| Nursery / Preschool | 476 | 4.3% |
| Kindergarten | 417 | 3.8% |
| Elementary School | 1,823 | 16.6% |
| Middle School | 1,749 | 15.9% |
| High School | 2,055 | 18.7% |
| College / Undergraduate | 4,049 | 36.8% |
| Graduate / Professional | 429 | 3.9% |
| Total | 10,998 | 100.0% |
School Enrollment by Age by Funding Source in Westfield
Out of a total of 10,998 students who are enrolled in schools in Westfield, 2,178 (19.8%) attend a private institution, while the remaining 8,820 (80.2%) are enrolled in public schools. The age group of 35 years and over has the highest likelihood of being enrolled in private schools, with 220 (45.2% in the age bracket) enrolled. Conversely, the age group of 15 to 17 year olds has the lowest likelihood of being enrolled in a private school, with 1,405 (90.8% in the age bracket) attending a public institution.
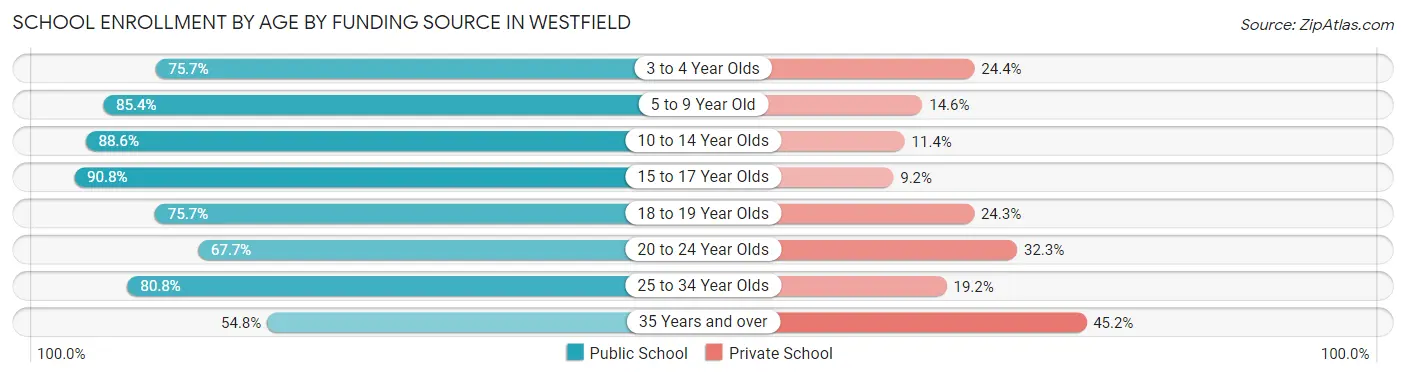
| Age Bracket | Public School | Private School |
| 3 to 4 Year Olds | 289 (75.6%) | 93 (24.3%) |
| 5 to 9 Year Old | 1,884 (85.4%) | 323 (14.6%) |
| 10 to 14 Year Olds | 1,904 (88.6%) | 244 (11.4%) |
| 15 to 17 Year Olds | 1,405 (90.8%) | 143 (9.2%) |
| 18 to 19 Year Olds | 1,189 (75.7%) | 381 (24.3%) |
| 20 to 24 Year Olds | 1,378 (67.7%) | 657 (32.3%) |
| 25 to 34 Year Olds | 502 (80.8%) | 119 (19.2%) |
| 35 Years and over | 267 (54.8%) | 220 (45.2%) |
| Total | 8,820 (80.2%) | 2,178 (19.8%) |
Educational Attainment by Field of Study in Westfield
Business (1,828 | 19.1%), education (1,226 | 12.8%), science & technology (922 | 9.6%), arts & humanities (789 | 8.2%), and psychology (729 | 7.6%) are the most common fields of study among 9,571 individuals in Westfield who have obtained a bachelor's degree or higher.
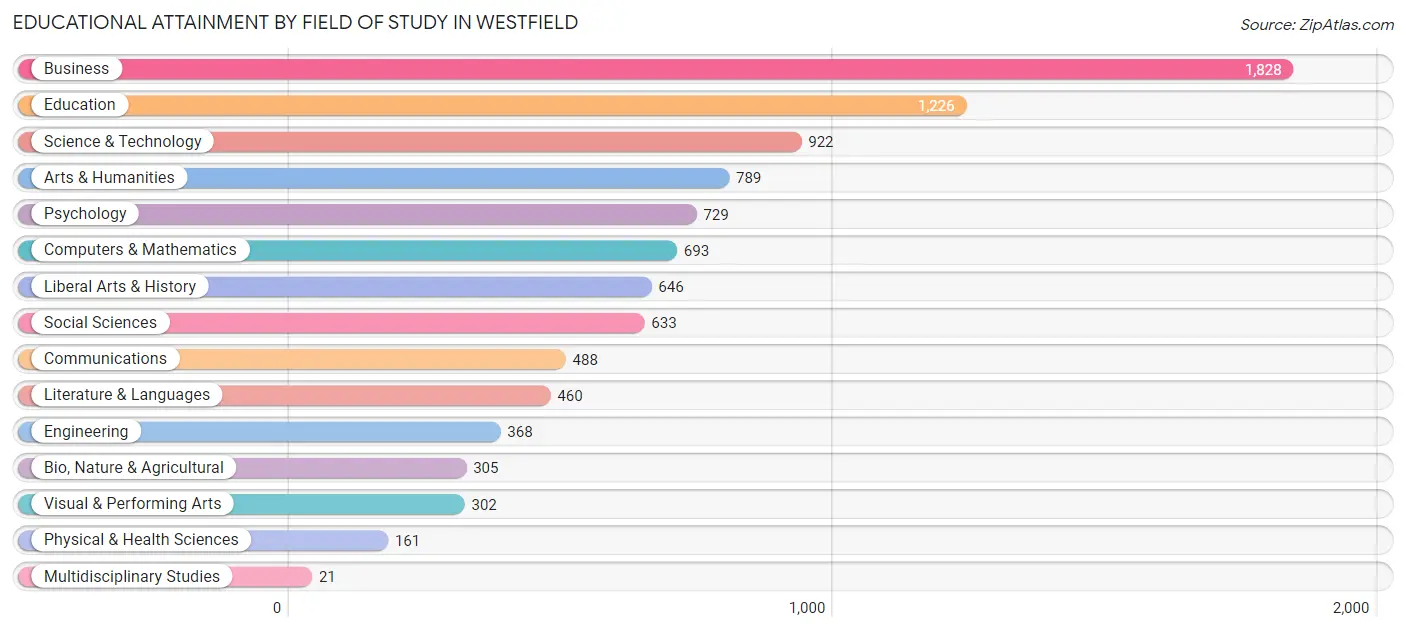
| Field of Study | # Graduates | % Graduates |
| Computers & Mathematics | 693 | 7.2% |
| Bio, Nature & Agricultural | 305 | 3.2% |
| Physical & Health Sciences | 161 | 1.7% |
| Psychology | 729 | 7.6% |
| Social Sciences | 633 | 6.6% |
| Engineering | 368 | 3.8% |
| Multidisciplinary Studies | 21 | 0.2% |
| Science & Technology | 922 | 9.6% |
| Business | 1,828 | 19.1% |
| Education | 1,226 | 12.8% |
| Literature & Languages | 460 | 4.8% |
| Liberal Arts & History | 646 | 6.8% |
| Visual & Performing Arts | 302 | 3.2% |
| Communications | 488 | 5.1% |
| Arts & Humanities | 789 | 8.2% |
| Total | 9,571 | 100.0% |
Transportation & Commute in Westfield
Vehicle Availability by Sex in Westfield
The most prevalent vehicle ownership categories in Westfield are males with 2 vehicles (4,391, accounting for 43.9%) and females with 2 vehicles (3,822, making up 51.4%).
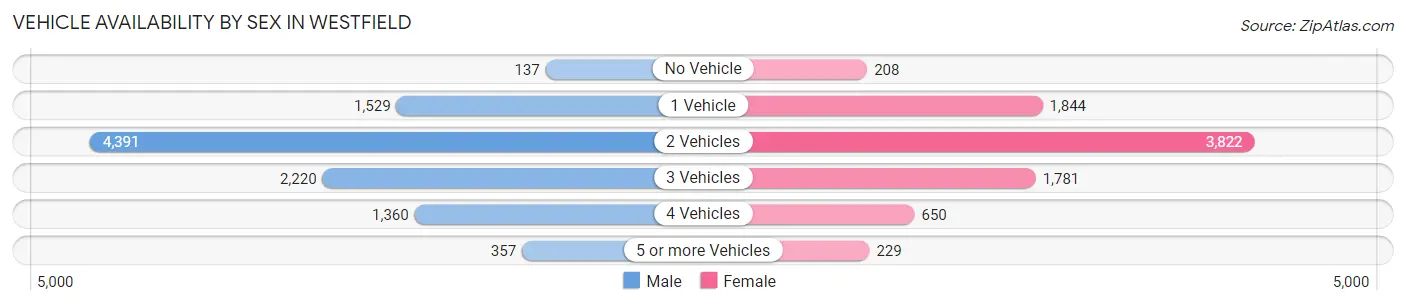
| Vehicles Available | Male | Female |
| No Vehicle | 137 (1.4%) | 208 (2.4%) |
| 1 Vehicle | 1,529 (15.3%) | 1,844 (21.6%) |
| 2 Vehicles | 4,391 (43.9%) | 3,822 (44.8%) |
| 3 Vehicles | 2,220 (22.2%) | 1,781 (20.9%) |
| 4 Vehicles | 1,360 (13.6%) | 650 (7.6%) |
| 5 or more Vehicles | 357 (3.6%) | 229 (2.7%) |
| Total | 9,994 (100.0%) | 8,534 (100.0%) |
Commute Time in Westfield
The most frequently occuring commute durations in Westfield are 5 to 9 minutes (2,634 commuters, 14.9%), 10 to 14 minutes (2,620 commuters, 14.8%), and 30 to 34 minutes (2,535 commuters, 14.3%).
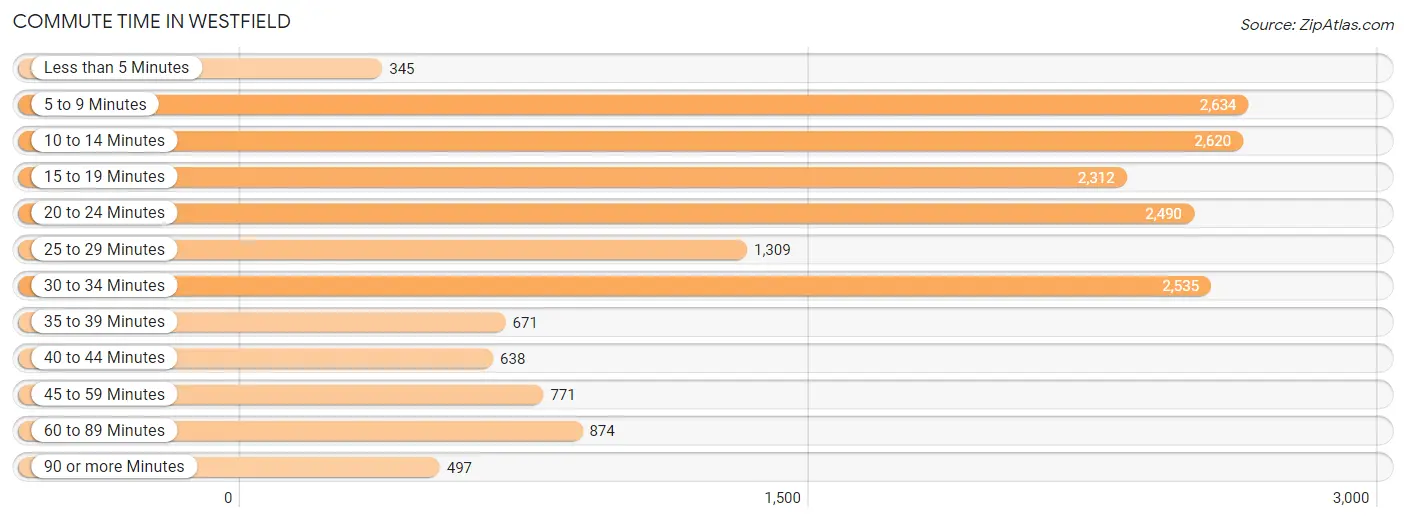
| Commute Time | # Commuters | % Commuters |
| Less than 5 Minutes | 345 | 1.9% |
| 5 to 9 Minutes | 2,634 | 14.9% |
| 10 to 14 Minutes | 2,620 | 14.8% |
| 15 to 19 Minutes | 2,312 | 13.1% |
| 20 to 24 Minutes | 2,490 | 14.1% |
| 25 to 29 Minutes | 1,309 | 7.4% |
| 30 to 34 Minutes | 2,535 | 14.3% |
| 35 to 39 Minutes | 671 | 3.8% |
| 40 to 44 Minutes | 638 | 3.6% |
| 45 to 59 Minutes | 771 | 4.4% |
| 60 to 89 Minutes | 874 | 4.9% |
| 90 or more Minutes | 497 | 2.8% |
Commute Time by Sex in Westfield
The most common commute times in Westfield are 5 to 9 minutes (1,490 commuters, 15.5%) for males and 20 to 24 minutes (1,360 commuters, 16.8%) for females.
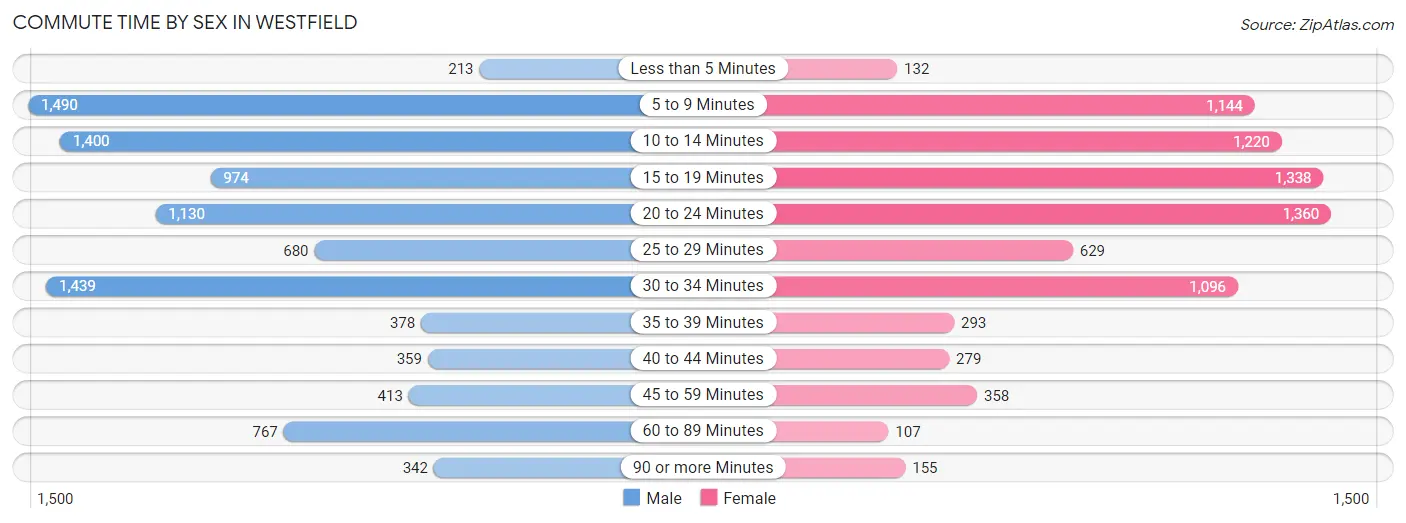
| Commute Time | Male | Female |
| Less than 5 Minutes | 213 (2.2%) | 132 (1.6%) |
| 5 to 9 Minutes | 1,490 (15.5%) | 1,144 (14.1%) |
| 10 to 14 Minutes | 1,400 (14.6%) | 1,220 (15.0%) |
| 15 to 19 Minutes | 974 (10.2%) | 1,338 (16.5%) |
| 20 to 24 Minutes | 1,130 (11.8%) | 1,360 (16.8%) |
| 25 to 29 Minutes | 680 (7.1%) | 629 (7.7%) |
| 30 to 34 Minutes | 1,439 (15.0%) | 1,096 (13.5%) |
| 35 to 39 Minutes | 378 (3.9%) | 293 (3.6%) |
| 40 to 44 Minutes | 359 (3.7%) | 279 (3.4%) |
| 45 to 59 Minutes | 413 (4.3%) | 358 (4.4%) |
| 60 to 89 Minutes | 767 (8.0%) | 107 (1.3%) |
| 90 or more Minutes | 342 (3.6%) | 155 (1.9%) |
Time of Departure to Work by Sex in Westfield
The most frequent times of departure to work in Westfield are 6:00 AM to 6:29 AM (1,449, 15.1%) for males and 7:00 AM to 7:29 AM (1,177, 14.5%) for females.
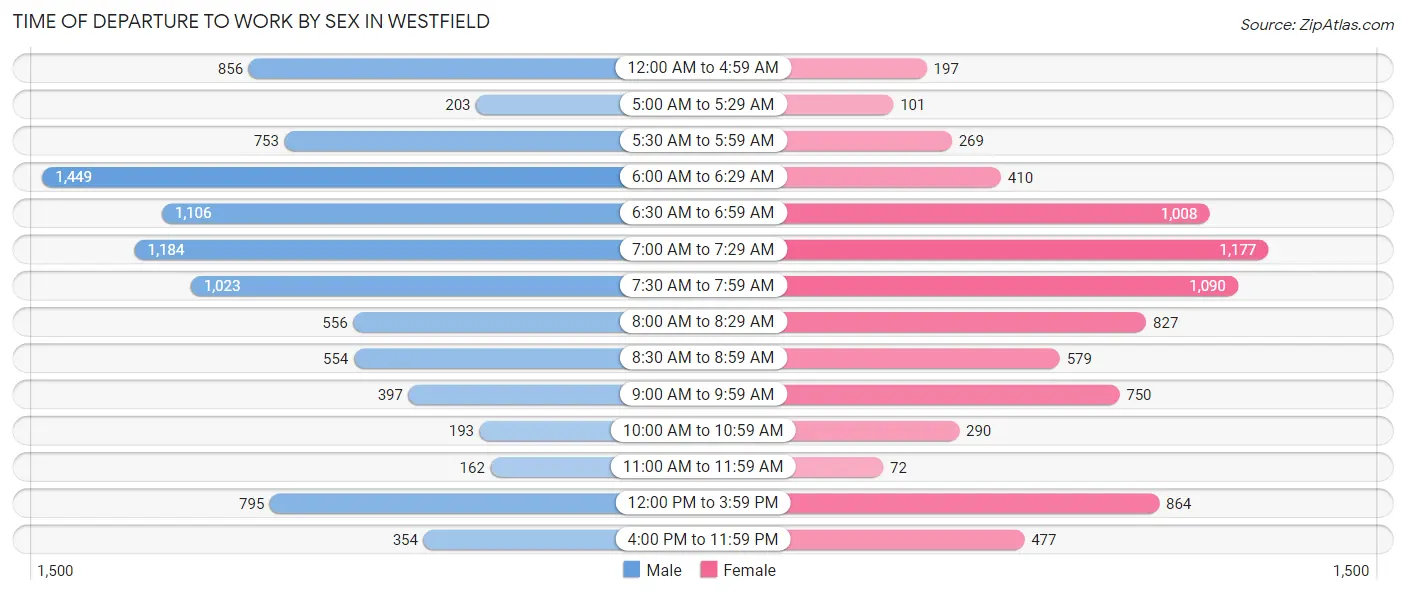
| Time of Departure | Male | Female |
| 12:00 AM to 4:59 AM | 856 (8.9%) | 197 (2.4%) |
| 5:00 AM to 5:29 AM | 203 (2.1%) | 101 (1.3%) |
| 5:30 AM to 5:59 AM | 753 (7.9%) | 269 (3.3%) |
| 6:00 AM to 6:29 AM | 1,449 (15.1%) | 410 (5.1%) |
| 6:30 AM to 6:59 AM | 1,106 (11.5%) | 1,008 (12.4%) |
| 7:00 AM to 7:29 AM | 1,184 (12.3%) | 1,177 (14.5%) |
| 7:30 AM to 7:59 AM | 1,023 (10.7%) | 1,090 (13.4%) |
| 8:00 AM to 8:29 AM | 556 (5.8%) | 827 (10.2%) |
| 8:30 AM to 8:59 AM | 554 (5.8%) | 579 (7.1%) |
| 9:00 AM to 9:59 AM | 397 (4.1%) | 750 (9.2%) |
| 10:00 AM to 10:59 AM | 193 (2.0%) | 290 (3.6%) |
| 11:00 AM to 11:59 AM | 162 (1.7%) | 72 (0.9%) |
| 12:00 PM to 3:59 PM | 795 (8.3%) | 864 (10.6%) |
| 4:00 PM to 11:59 PM | 354 (3.7%) | 477 (5.9%) |
| Total | 9,585 (100.0%) | 8,111 (100.0%) |
Housing Occupancy in Westfield
Occupancy by Ownership in Westfield
Of the total 15,435 dwellings in Westfield, owner-occupied units account for 10,256 (66.4%), while renter-occupied units make up 5,179 (33.6%).
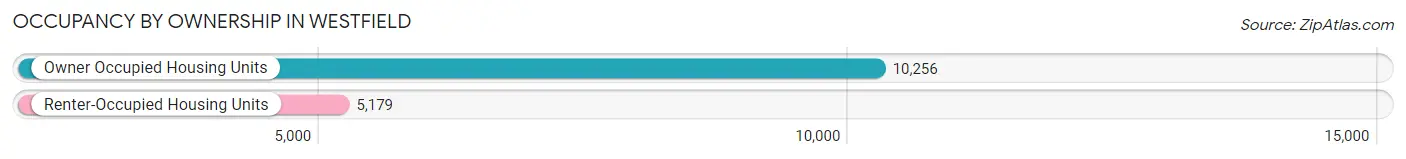
| Occupancy | # Housing Units | % Housing Units |
| Owner Occupied Housing Units | 10,256 | 66.4% |
| Renter-Occupied Housing Units | 5,179 | 33.6% |
| Total Occupied Housing Units | 15,435 | 100.0% |
Occupancy by Household Size in Westfield
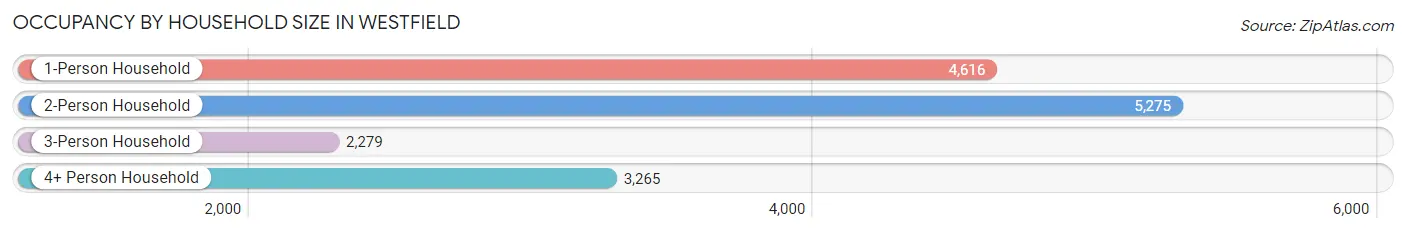
| Household Size | # Housing Units | % Housing Units |
| 1-Person Household | 4,616 | 29.9% |
| 2-Person Household | 5,275 | 34.2% |
| 3-Person Household | 2,279 | 14.8% |
| 4+ Person Household | 3,265 | 21.1% |
| Total Housing Units | 15,435 | 100.0% |
Occupancy by Ownership by Household Size in Westfield
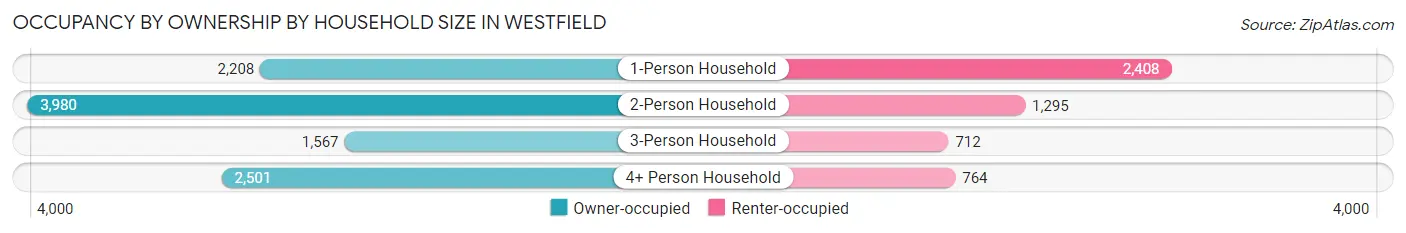
| Household Size | Owner-occupied | Renter-occupied |
| 1-Person Household | 2,208 (47.8%) | 2,408 (52.2%) |
| 2-Person Household | 3,980 (75.4%) | 1,295 (24.5%) |
| 3-Person Household | 1,567 (68.8%) | 712 (31.2%) |
| 4+ Person Household | 2,501 (76.6%) | 764 (23.4%) |
| Total Housing Units | 10,256 (66.4%) | 5,179 (33.6%) |
Occupancy by Educational Attainment in Westfield
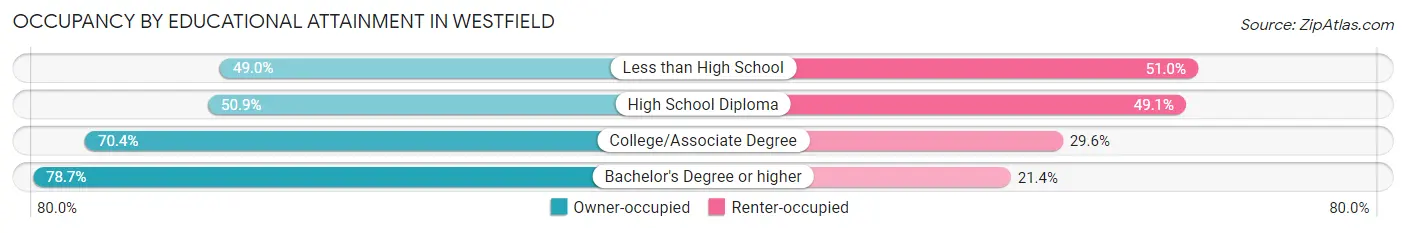
| Household Size | Owner-occupied | Renter-occupied |
| Less than High School | 705 (49.0%) | 734 (51.0%) |
| High School Diploma | 1,941 (50.9%) | 1,874 (49.1%) |
| College/Associate Degree | 3,396 (70.4%) | 1,427 (29.6%) |
| Bachelor's Degree or higher | 4,214 (78.6%) | 1,144 (21.3%) |
Occupancy by Age of Householder in Westfield
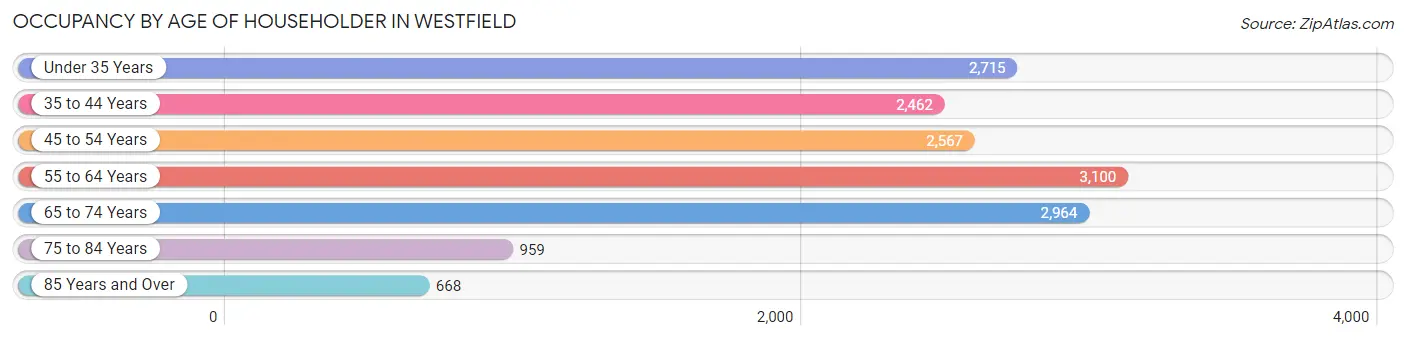
| Age Bracket | # Households | % Households |
| Under 35 Years | 2,715 | 17.6% |
| 35 to 44 Years | 2,462 | 16.0% |
| 45 to 54 Years | 2,567 | 16.6% |
| 55 to 64 Years | 3,100 | 20.1% |
| 65 to 74 Years | 2,964 | 19.2% |
| 75 to 84 Years | 959 | 6.2% |
| 85 Years and Over | 668 | 4.3% |
| Total | 15,435 | 100.0% |
Housing Finances in Westfield
Median Income by Occupancy in Westfield
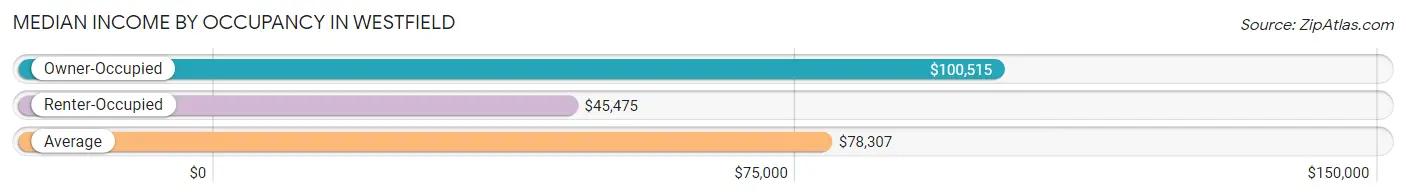
| Occupancy Type | # Households | Median Income |
| Owner-Occupied | 10,256 (66.4%) | $100,515 |
| Renter-Occupied | 5,179 (33.6%) | $45,475 |
| Average | 15,435 (100.0%) | $78,307 |
Occupancy by Householder Income Bracket in Westfield
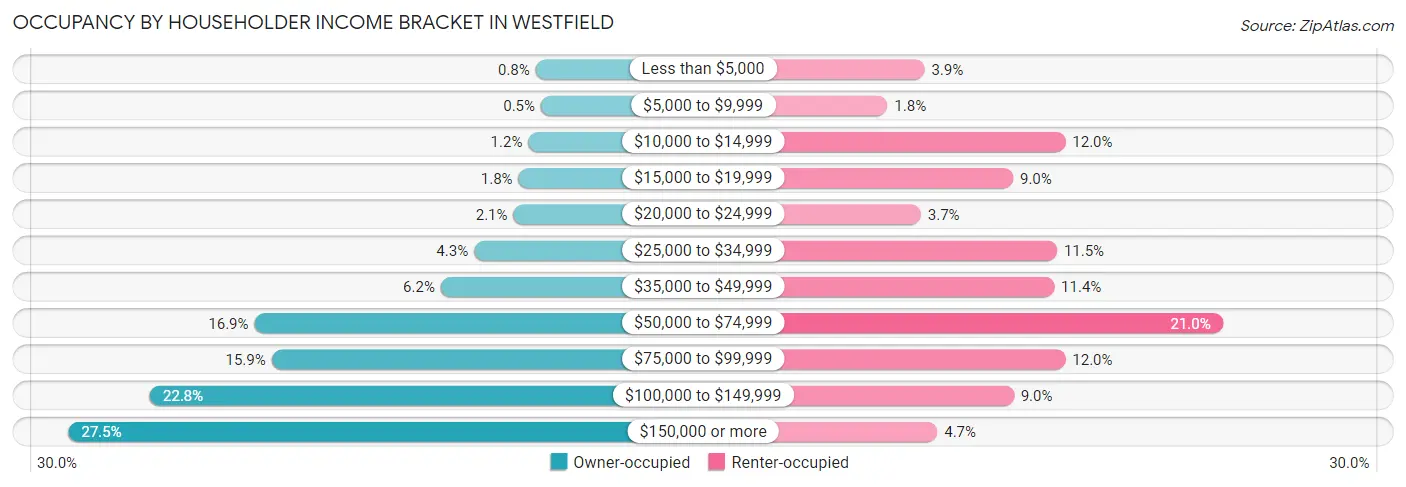
| Income Bracket | Owner-occupied | Renter-occupied |
| Less than $5,000 | 82 (0.8%) | 204 (3.9%) |
| $5,000 to $9,999 | 51 (0.5%) | 94 (1.8%) |
| $10,000 to $14,999 | 125 (1.2%) | 621 (12.0%) |
| $15,000 to $19,999 | 183 (1.8%) | 466 (9.0%) |
| $20,000 to $24,999 | 212 (2.1%) | 193 (3.7%) |
| $25,000 to $34,999 | 443 (4.3%) | 596 (11.5%) |
| $35,000 to $49,999 | 638 (6.2%) | 588 (11.4%) |
| $50,000 to $74,999 | 1,730 (16.9%) | 1,086 (21.0%) |
| $75,000 to $99,999 | 1,630 (15.9%) | 621 (12.0%) |
| $100,000 to $149,999 | 2,342 (22.8%) | 468 (9.0%) |
| $150,000 or more | 2,820 (27.5%) | 242 (4.7%) |
| Total | 10,256 (100.0%) | 5,179 (100.0%) |
Monthly Housing Cost Tiers in Westfield
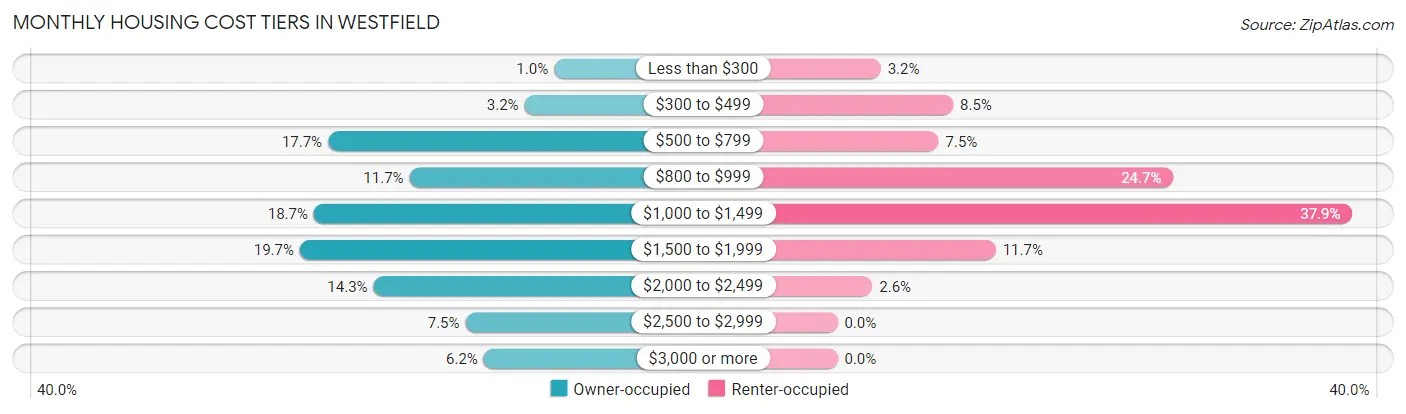
| Monthly Cost | Owner-occupied | Renter-occupied |
| Less than $300 | 104 (1.0%) | 165 (3.2%) |
| $300 to $499 | 327 (3.2%) | 441 (8.5%) |
| $500 to $799 | 1,811 (17.7%) | 386 (7.4%) |
| $800 to $999 | 1,196 (11.7%) | 1,281 (24.7%) |
| $1,000 to $1,499 | 1,918 (18.7%) | 1,964 (37.9%) |
| $1,500 to $1,999 | 2,024 (19.7%) | 604 (11.7%) |
| $2,000 to $2,499 | 1,468 (14.3%) | 133 (2.6%) |
| $2,500 to $2,999 | 773 (7.5%) | 0 (0.0%) |
| $3,000 or more | 635 (6.2%) | 0 (0.0%) |
| Total | 10,256 (100.0%) | 5,179 (100.0%) |
Physical Housing Characteristics in Westfield
Housing Structures in Westfield
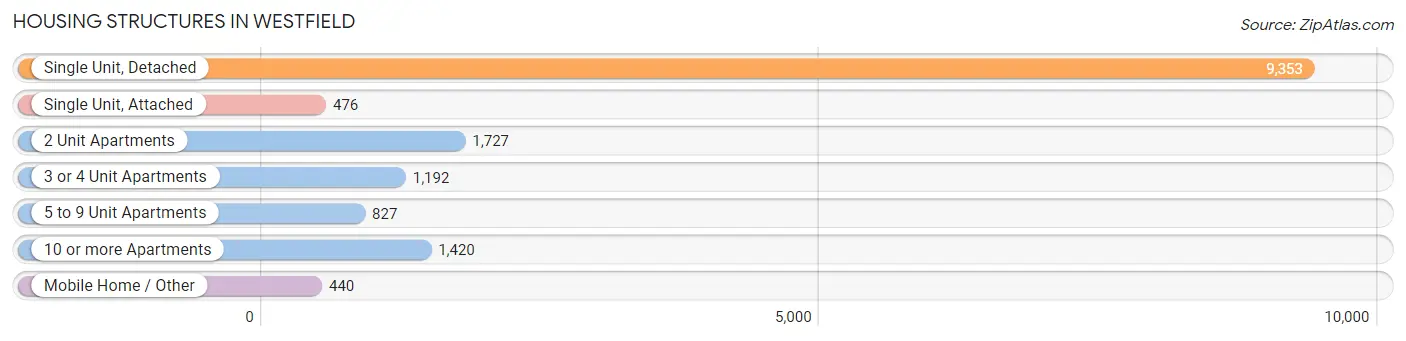
| Structure Type | # Housing Units | % Housing Units |
| Single Unit, Detached | 9,353 | 60.6% |
| Single Unit, Attached | 476 | 3.1% |
| 2 Unit Apartments | 1,727 | 11.2% |
| 3 or 4 Unit Apartments | 1,192 | 7.7% |
| 5 to 9 Unit Apartments | 827 | 5.4% |
| 10 or more Apartments | 1,420 | 9.2% |
| Mobile Home / Other | 440 | 2.9% |
| Total | 15,435 | 100.0% |
Housing Structures by Occupancy in Westfield
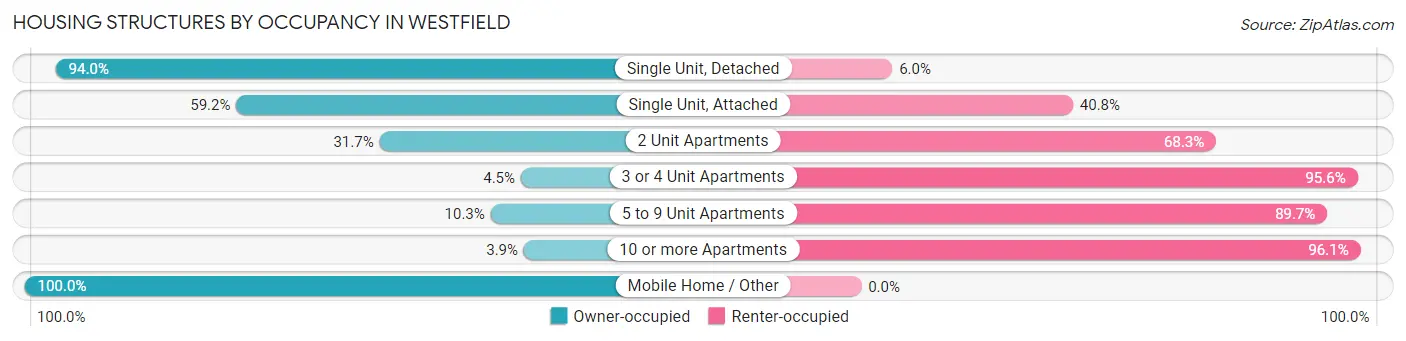
| Structure Type | Owner-occupied | Renter-occupied |
| Single Unit, Detached | 8,794 (94.0%) | 559 (6.0%) |
| Single Unit, Attached | 282 (59.2%) | 194 (40.8%) |
| 2 Unit Apartments | 547 (31.7%) | 1,180 (68.3%) |
| 3 or 4 Unit Apartments | 53 (4.4%) | 1,139 (95.6%) |
| 5 to 9 Unit Apartments | 85 (10.3%) | 742 (89.7%) |
| 10 or more Apartments | 55 (3.9%) | 1,365 (96.1%) |
| Mobile Home / Other | 440 (100.0%) | 0 (0.0%) |
| Total | 10,256 (66.4%) | 5,179 (33.6%) |
Housing Structures by Number of Rooms in Westfield
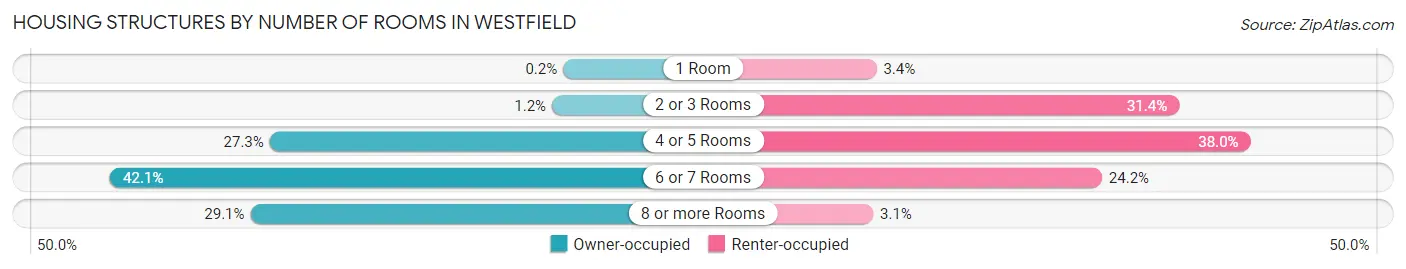
| Number of Rooms | Owner-occupied | Renter-occupied |
| 1 Room | 21 (0.2%) | 175 (3.4%) |
| 2 or 3 Rooms | 126 (1.2%) | 1,624 (31.4%) |
| 4 or 5 Rooms | 2,804 (27.3%) | 1,966 (38.0%) |
| 6 or 7 Rooms | 4,318 (42.1%) | 1,255 (24.2%) |
| 8 or more Rooms | 2,987 (29.1%) | 159 (3.1%) |
| Total | 10,256 (100.0%) | 5,179 (100.0%) |
Housing Structure by Heating Type in Westfield
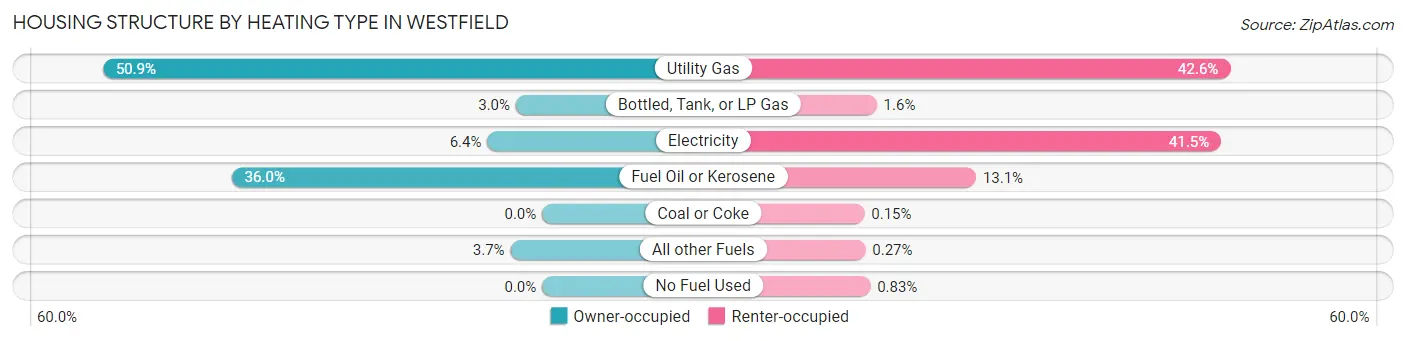
| Heating Type | Owner-occupied | Renter-occupied |
| Utility Gas | 5,224 (50.9%) | 2,204 (42.6%) |
| Bottled, Tank, or LP Gas | 312 (3.0%) | 82 (1.6%) |
| Electricity | 651 (6.4%) | 2,150 (41.5%) |
| Fuel Oil or Kerosene | 3,693 (36.0%) | 678 (13.1%) |
| Coal or Coke | 0 (0.0%) | 8 (0.2%) |
| All other Fuels | 376 (3.7%) | 14 (0.3%) |
| No Fuel Used | 0 (0.0%) | 43 (0.8%) |
| Total | 10,256 (100.0%) | 5,179 (100.0%) |
Household Vehicle Usage in Westfield
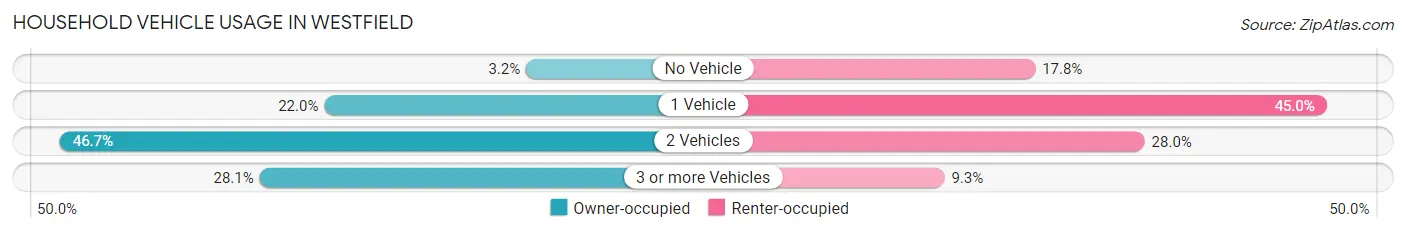
| Vehicles per Household | Owner-occupied | Renter-occupied |
| No Vehicle | 327 (3.2%) | 920 (17.8%) |
| 1 Vehicle | 2,259 (22.0%) | 2,329 (45.0%) |
| 2 Vehicles | 4,791 (46.7%) | 1,449 (28.0%) |
| 3 or more Vehicles | 2,879 (28.1%) | 481 (9.3%) |
| Total | 10,256 (100.0%) | 5,179 (100.0%) |
Real Estate & Mortgages in Westfield
Real Estate and Mortgage Overview in Westfield
| Characteristic | Without Mortgage | With Mortgage |
| Housing Units | 3,816 | 6,440 |
| Median Property Value | $272,200 | $287,600 |
| Median Household Income | $73,833 | $2,063 |
| Monthly Housing Costs | $774 | $635 |
| Real Estate Taxes | $4,625 | $120 |
Property Value by Mortgage Status in Westfield
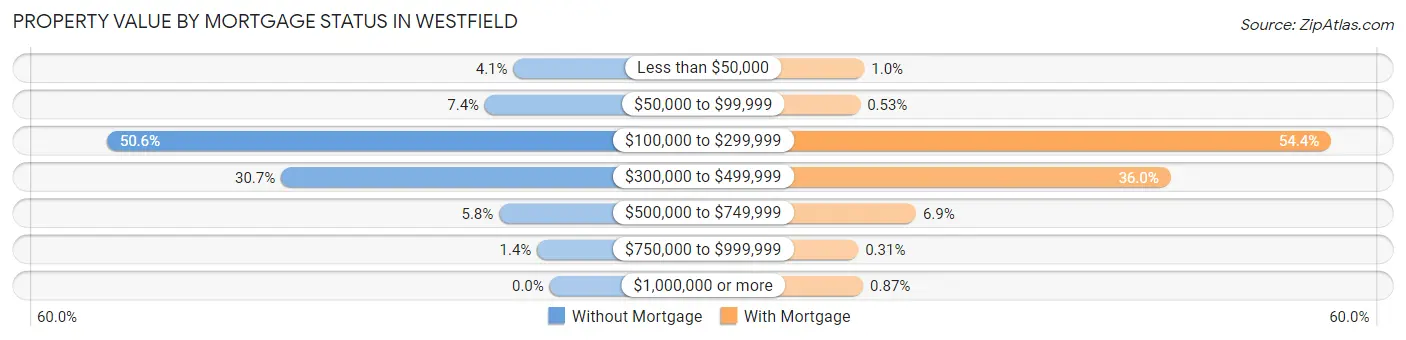
| Property Value | Without Mortgage | With Mortgage |
| Less than $50,000 | 158 (4.1%) | 65 (1.0%) |
| $50,000 to $99,999 | 282 (7.4%) | 34 (0.5%) |
| $100,000 to $299,999 | 1,931 (50.6%) | 3,500 (54.3%) |
| $300,000 to $499,999 | 1,171 (30.7%) | 2,320 (36.0%) |
| $500,000 to $749,999 | 220 (5.8%) | 445 (6.9%) |
| $750,000 to $999,999 | 54 (1.4%) | 20 (0.3%) |
| $1,000,000 or more | 0 (0.0%) | 56 (0.9%) |
| Total | 3,816 (100.0%) | 6,440 (100.0%) |
Household Income by Mortgage Status in Westfield
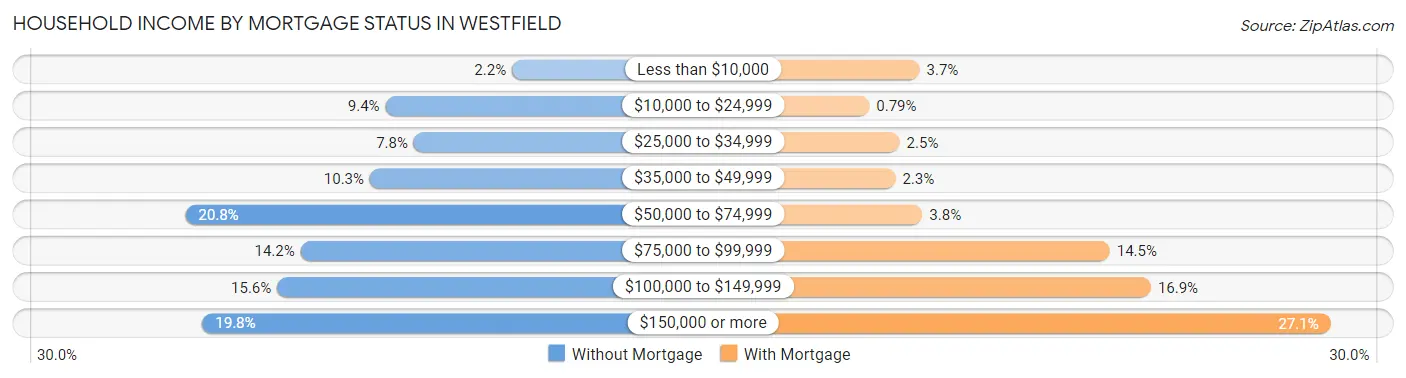
| Household Income | Without Mortgage | With Mortgage |
| Less than $10,000 | 82 (2.1%) | 236 (3.7%) |
| $10,000 to $24,999 | 358 (9.4%) | 51 (0.8%) |
| $25,000 to $34,999 | 296 (7.8%) | 162 (2.5%) |
| $35,000 to $49,999 | 392 (10.3%) | 147 (2.3%) |
| $50,000 to $74,999 | 794 (20.8%) | 246 (3.8%) |
| $75,000 to $99,999 | 543 (14.2%) | 936 (14.5%) |
| $100,000 to $149,999 | 594 (15.6%) | 1,087 (16.9%) |
| $150,000 or more | 757 (19.8%) | 1,748 (27.1%) |
| Total | 3,816 (100.0%) | 6,440 (100.0%) |
Property Value to Household Income Ratio in Westfield
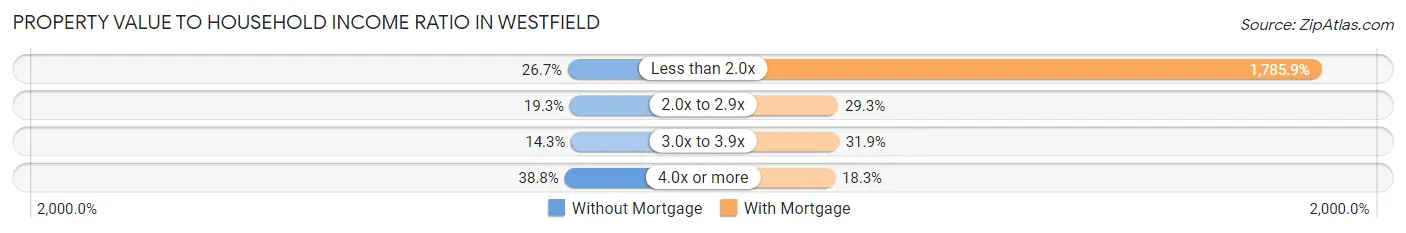
| Value-to-Income Ratio | Without Mortgage | With Mortgage |
| Less than 2.0x | 1,017 (26.7%) | 115,012 (1,785.9%) |
| 2.0x to 2.9x | 736 (19.3%) | 1,888 (29.3%) |
| 3.0x to 3.9x | 545 (14.3%) | 2,054 (31.9%) |
| 4.0x or more | 1,482 (38.8%) | 1,176 (18.3%) |
| Total | 3,816 (100.0%) | 6,440 (100.0%) |
Real Estate Taxes by Mortgage Status in Westfield
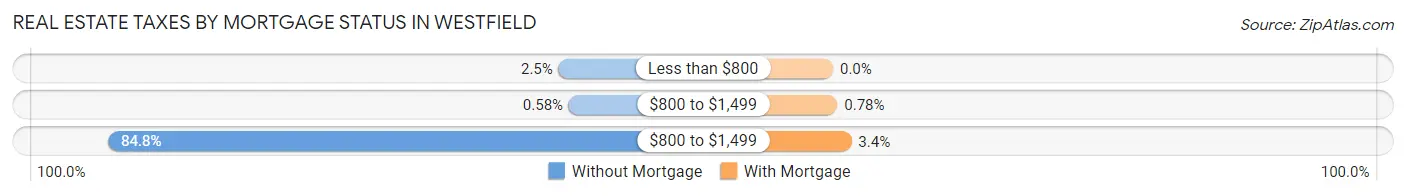
| Property Taxes | Without Mortgage | With Mortgage |
| Less than $800 | 94 (2.5%) | 0 (0.0%) |
| $800 to $1,499 | 22 (0.6%) | 50 (0.8%) |
| $800 to $1,499 | 3,234 (84.8%) | 216 (3.4%) |
| Total | 3,816 (100.0%) | 6,440 (100.0%) |
Health & Disability in Westfield
Health Insurance Coverage by Age in Westfield
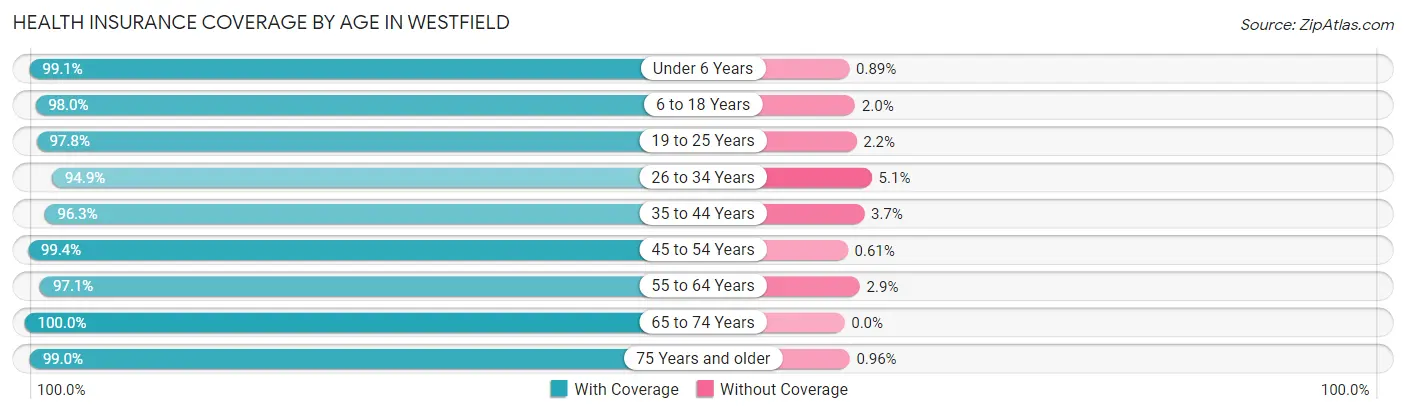
| Age Bracket | With Coverage | Without Coverage |
| Under 6 Years | 2,223 (99.1%) | 20 (0.9%) |
| 6 to 18 Years | 6,592 (98.0%) | 133 (2.0%) |
| 19 to 25 Years | 4,471 (97.8%) | 102 (2.2%) |
| 26 to 34 Years | 4,669 (94.9%) | 251 (5.1%) |
| 35 to 44 Years | 4,345 (96.3%) | 166 (3.7%) |
| 45 to 54 Years | 4,760 (99.4%) | 29 (0.6%) |
| 55 to 64 Years | 5,338 (97.1%) | 158 (2.9%) |
| 65 to 74 Years | 4,650 (100.0%) | 0 (0.0%) |
| 75 Years and older | 2,385 (99.0%) | 23 (1.0%) |
| Total | 39,433 (97.8%) | 882 (2.2%) |
Health Insurance Coverage by Citizenship Status in Westfield
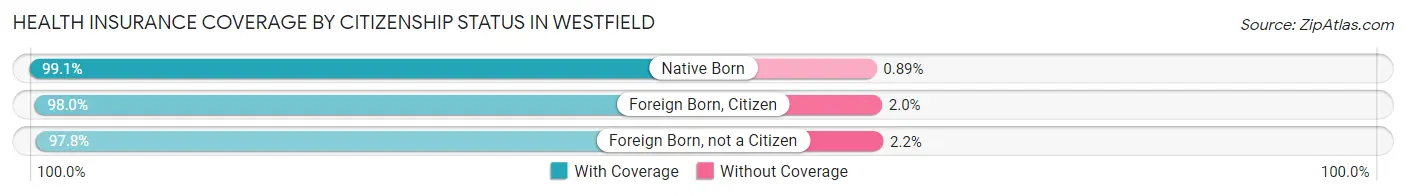
| Citizenship Status | With Coverage | Without Coverage |
| Native Born | 2,223 (99.1%) | 20 (0.9%) |
| Foreign Born, Citizen | 6,592 (98.0%) | 133 (2.0%) |
| Foreign Born, not a Citizen | 4,471 (97.8%) | 102 (2.2%) |
Health Insurance Coverage by Household Income in Westfield
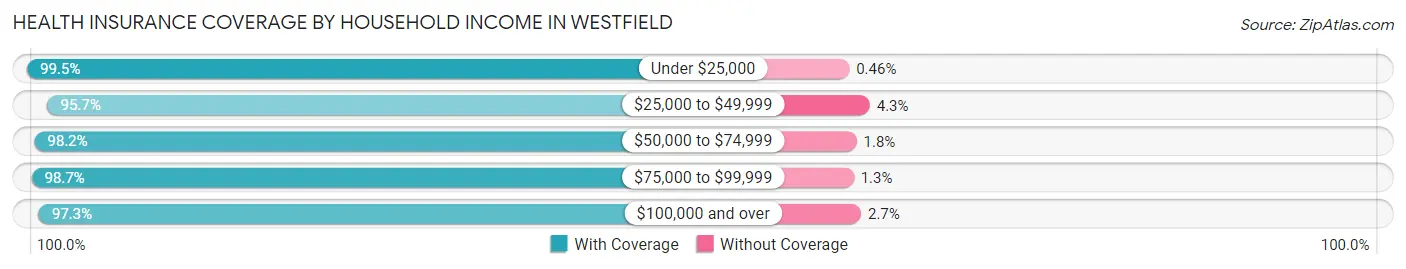
| Household Income | With Coverage | Without Coverage |
| Under $25,000 | 3,474 (99.5%) | 16 (0.5%) |
| $25,000 to $49,999 | 4,243 (95.7%) | 191 (4.3%) |
| $50,000 to $74,999 | 6,318 (98.2%) | 118 (1.8%) |
| $75,000 to $99,999 | 5,426 (98.7%) | 71 (1.3%) |
| $100,000 and over | 17,667 (97.3%) | 485 (2.7%) |
Public vs Private Health Insurance Coverage by Age in Westfield
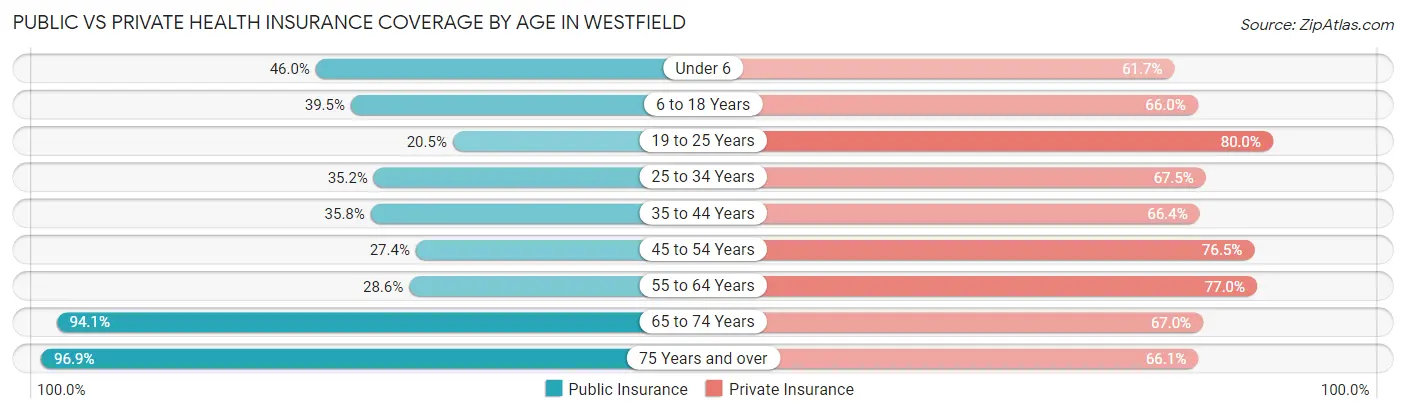
| Age Bracket | Public Insurance | Private Insurance |
| Under 6 | 1,031 (46.0%) | 1,384 (61.7%) |
| 6 to 18 Years | 2,653 (39.5%) | 4,441 (66.0%) |
| 19 to 25 Years | 939 (20.5%) | 3,658 (80.0%) |
| 25 to 34 Years | 1,732 (35.2%) | 3,323 (67.5%) |
| 35 to 44 Years | 1,614 (35.8%) | 2,995 (66.4%) |
| 45 to 54 Years | 1,312 (27.4%) | 3,665 (76.5%) |
| 55 to 64 Years | 1,574 (28.6%) | 4,234 (77.0%) |
| 65 to 74 Years | 4,374 (94.1%) | 3,117 (67.0%) |
| 75 Years and over | 2,334 (96.9%) | 1,592 (66.1%) |
| Total | 17,563 (43.6%) | 28,409 (70.5%) |
Disability Status by Sex by Age in Westfield
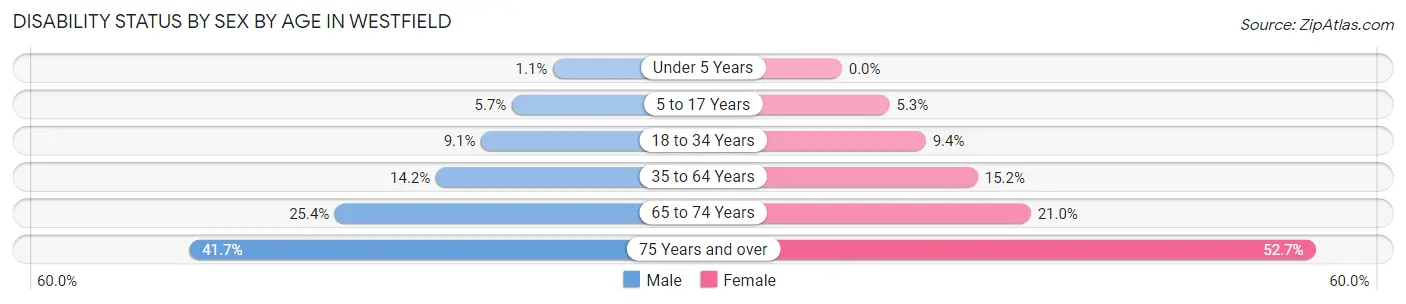
| Age Bracket | Male | Female |
| Under 5 Years | 8 (1.1%) | 0 (0.0%) |
| 5 to 17 Years | 182 (5.7%) | 159 (5.3%) |
| 18 to 34 Years | 447 (9.1%) | 524 (9.3%) |
| 35 to 64 Years | 1,067 (14.2%) | 1,101 (15.1%) |
| 65 to 74 Years | 521 (25.4%) | 547 (21.0%) |
| 75 Years and over | 372 (41.7%) | 799 (52.7%) |
Disability Class by Sex by Age in Westfield
Disability Class: Hearing Difficulty
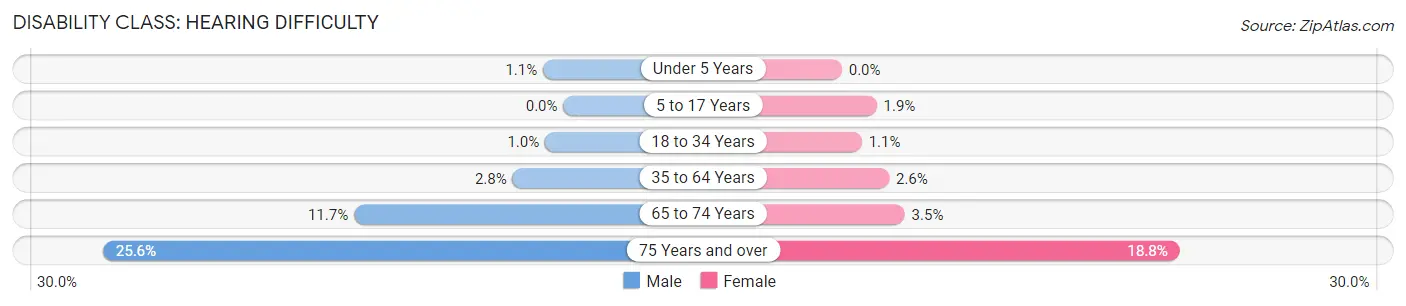
| Age Bracket | Male | Female |
| Under 5 Years | 8 (1.1%) | 0 (0.0%) |
| 5 to 17 Years | 0 (0.0%) | 58 (1.9%) |
| 18 to 34 Years | 50 (1.0%) | 62 (1.1%) |
| 35 to 64 Years | 213 (2.8%) | 191 (2.6%) |
| 65 to 74 Years | 239 (11.7%) | 91 (3.5%) |
| 75 Years and over | 229 (25.6%) | 285 (18.8%) |
Disability Class: Vision Difficulty
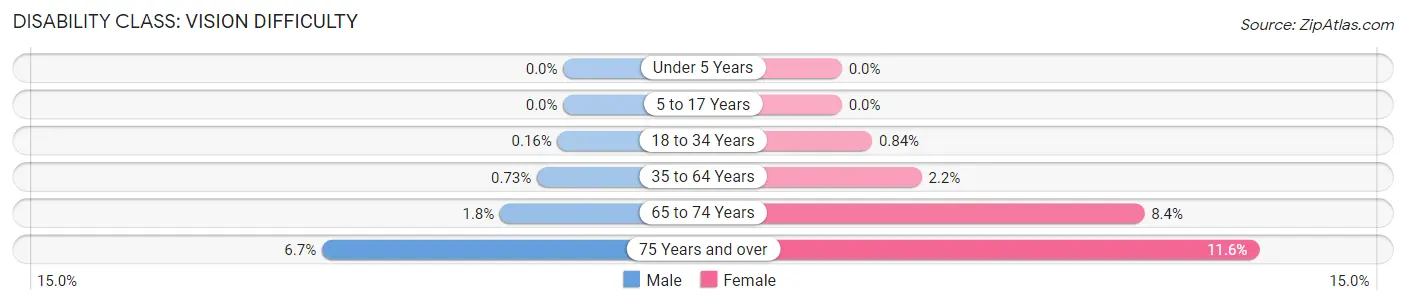
| Age Bracket | Male | Female |
| Under 5 Years | 0 (0.0%) | 0 (0.0%) |
| 5 to 17 Years | 0 (0.0%) | 0 (0.0%) |
| 18 to 34 Years | 8 (0.2%) | 47 (0.8%) |
| 35 to 64 Years | 55 (0.7%) | 161 (2.2%) |
| 65 to 74 Years | 36 (1.8%) | 219 (8.4%) |
| 75 Years and over | 60 (6.7%) | 176 (11.6%) |
Disability Class: Cognitive Difficulty
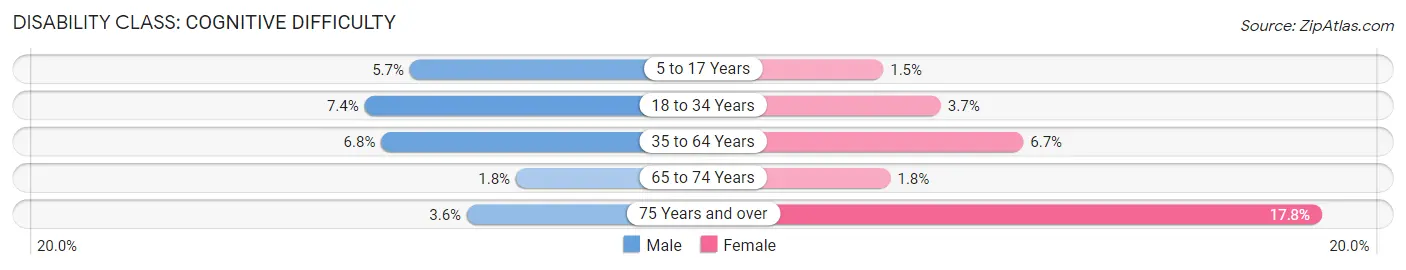
| Age Bracket | Male | Female |
| 5 to 17 Years | 182 (5.7%) | 46 (1.5%) |
| 18 to 34 Years | 361 (7.4%) | 206 (3.7%) |
| 35 to 64 Years | 509 (6.8%) | 490 (6.7%) |
| 65 to 74 Years | 36 (1.8%) | 47 (1.8%) |
| 75 Years and over | 32 (3.6%) | 270 (17.8%) |
Disability Class: Ambulatory Difficulty
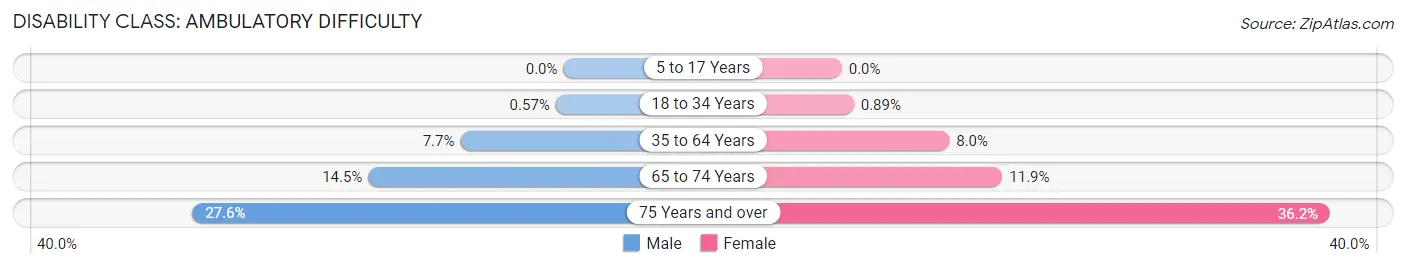
| Age Bracket | Male | Female |
| 5 to 17 Years | 0 (0.0%) | 0 (0.0%) |
| 18 to 34 Years | 28 (0.6%) | 50 (0.9%) |
| 35 to 64 Years | 576 (7.6%) | 580 (8.0%) |
| 65 to 74 Years | 297 (14.5%) | 310 (11.9%) |
| 75 Years and over | 246 (27.6%) | 549 (36.2%) |
Disability Class: Self-Care Difficulty
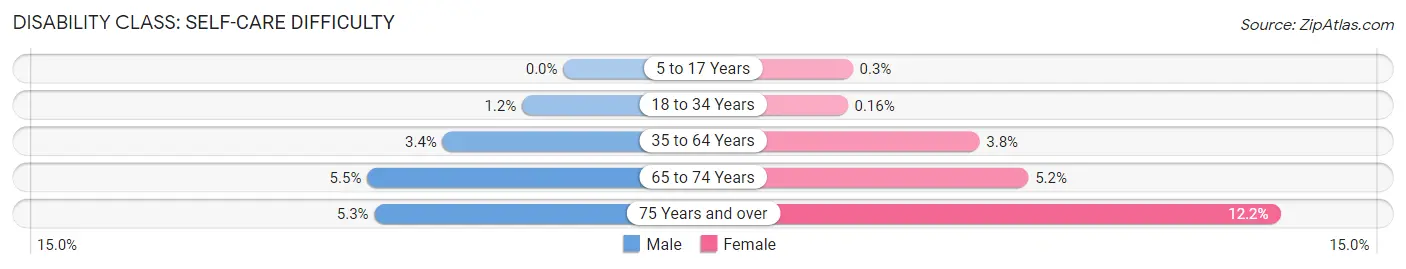
| Age Bracket | Male | Female |
| 5 to 17 Years | 0 (0.0%) | 9 (0.3%) |
| 18 to 34 Years | 56 (1.1%) | 9 (0.2%) |
| 35 to 64 Years | 253 (3.4%) | 278 (3.8%) |
| 65 to 74 Years | 112 (5.5%) | 135 (5.2%) |
| 75 Years and over | 47 (5.3%) | 185 (12.2%) |
Technology Access in Westfield
Computing Device Access in Westfield
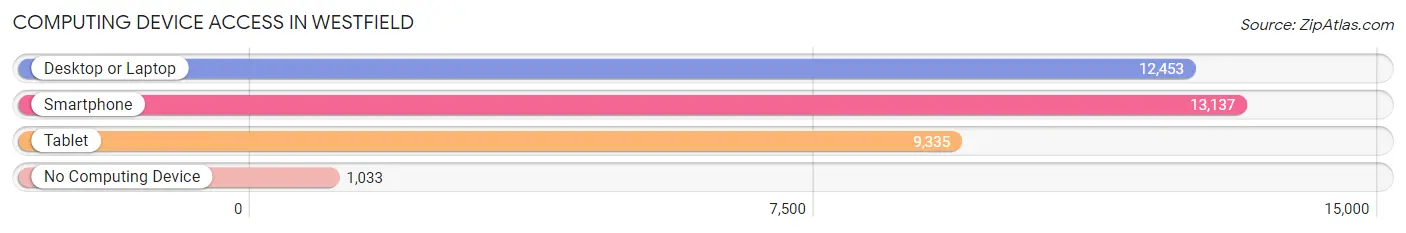
| Device Type | # Households | % Households |
| Desktop or Laptop | 12,453 | 80.7% |
| Smartphone | 13,137 | 85.1% |
| Tablet | 9,335 | 60.5% |
| No Computing Device | 1,033 | 6.7% |
| Total | 15,435 | 100.0% |
Internet Access in Westfield
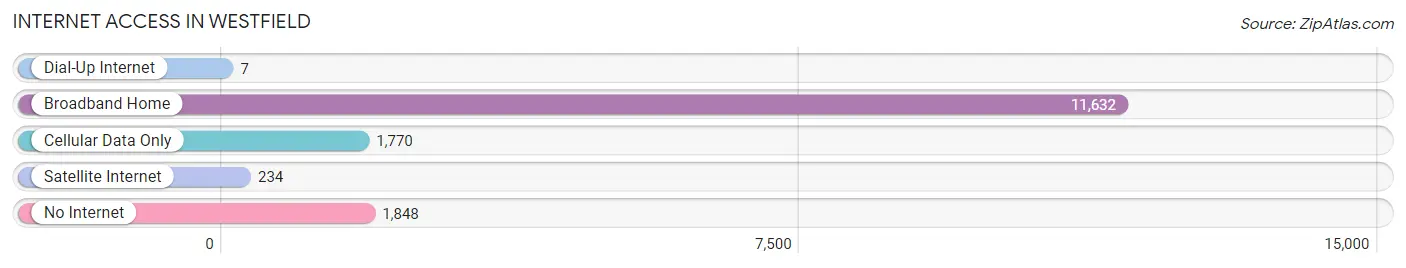
| Internet Type | # Households | % Households |
| Dial-Up Internet | 7 | 0.1% |
| Broadband Home | 11,632 | 75.4% |
| Cellular Data Only | 1,770 | 11.5% |
| Satellite Internet | 234 | 1.5% |
| No Internet | 1,848 | 12.0% |
| Total | 15,435 | 100.0% |
Westfield Summary
History
Westfield, Massachusetts is a city located in Hampden County in the western part of the state. It is situated in the Pioneer Valley region of Massachusetts, and is bordered by the towns of Southwick, Granville, and Russell. The city was first settled in 1660, and was officially incorporated in 1669.
Westfield was originally part of the Agawam Plantation, which was established in 1636. The Agawam Plantation was a large tract of land that was granted to William Pynchon, a prominent early settler of the Massachusetts Bay Colony. The Agawam Plantation was divided into several smaller townships in 1660, and Westfield was one of them.
The town of Westfield was named after the English town of Westfield, which was the hometown of many of the original settlers. The town quickly grew and prospered, and by the mid-18th century, it had become a thriving agricultural and industrial center. The town was known for its production of woolen goods, and it was also home to several mills and factories.
In the 19th century, Westfield became a popular summer resort destination. The town was home to several large hotels, and it was also a popular destination for wealthy Bostonians who wanted to escape the city during the summer months.
Geography
Westfield is located in the western part of Massachusetts, in Hampden County. It is situated in the Pioneer Valley region of the state, and is bordered by the towns of Southwick, Granville, and Russell. The city is located on the banks of the Westfield River, and is approximately 20 miles west of Springfield, the state’s third-largest city.
The city of Westfield covers an area of approximately 20 square miles, and is mostly flat. The highest point in the city is located at the intersection of Westfield Street and East Mountain Road, and is approximately 500 feet above sea level. The city is located in a temperate climate zone, and experiences four distinct seasons.
Economy
Westfield’s economy is largely based on the service industry. The city is home to several large retail stores, including Walmart, Target, and Kohl’s. The city is also home to several large medical centers, including Baystate Medical Center and Noble Hospital.
Westfield is also home to several large manufacturing companies, including Westfield Plastics and Westfield Steel. The city is also home to several large educational institutions, including Westfield State University and the Westfield Technical Academy.
Demographics
As of the 2010 census, the city of Westfield had a population of 41,094. The population is largely white (90.2%), with small percentages of African Americans (3.2%), Asians (2.2%), and Hispanics (2.1%). The median household income in the city is $60,945, and the median home value is $219,400. The city has a poverty rate of 8.7%.
Westfield is a largely residential city, with approximately 75% of the population living in single-family homes. The city is home to several large parks, including Stanley Park and the Westfield River State Park. The city is also home to several large cultural institutions, including the Westfield Athenaeum and the Westfield Historical Society.
Common Questions
What is Per Capita Income in Westfield?
Per Capita income in Westfield is $38,979.
What is the Median Family Income in Westfield?
Median Family Income in Westfield is $98,478.
What is the Median Household income in Westfield?
Median Household Income in Westfield is $78,307.
What is Income or Wage Gap in Westfield?
Income or Wage Gap in Westfield is 38.4%.
Women in Westfield earn 61.6 cents for every dollar earned by a man.
What is Family Income Deficit in Westfield?
Family Income Deficit in Westfield is $11,282.
Families that are below poverty line in Westfield earn $11,282 less on average than the poverty threshold level.
What is Inequality or Gini Index in Westfield?
Inequality or Gini Index in Westfield is 0.44.
What is the Total Population of Westfield?
Total Population of Westfield is 40,794.
What is the Total Male Population of Westfield?
Total Male Population of Westfield is 19,494.
What is the Total Female Population of Westfield?
Total Female Population of Westfield is 21,300.
What is the Ratio of Males per 100 Females in Westfield?
There are 91.52 Males per 100 Females in Westfield.
What is the Ratio of Females per 100 Males in Westfield?
There are 109.26 Females per 100 Males in Westfield.
What is the Median Population Age in Westfield?
Median Population Age in Westfield is 39.2 Years.
What is the Average Family Size in Westfield
Average Family Size in Westfield is 3.1 People.
What is the Average Household Size in Westfield
Average Household Size in Westfield is 2.5 People.
How Large is the Labor Force in Westfield?
There are 20,212 People in the Labor Forcein in Westfield.
What is the Percentage of People in the Labor Force in Westfield?
59.5% of People are in the Labor Force in Westfield.
What is the Unemployment Rate in Westfield?
Unemployment Rate in Westfield is 4.5%.