Cities with the Highest Percentage of Population Employed in Production in Massachusetts
RELATED REPORTS & OPTIONS
Production
Massachusetts
Compare Cities
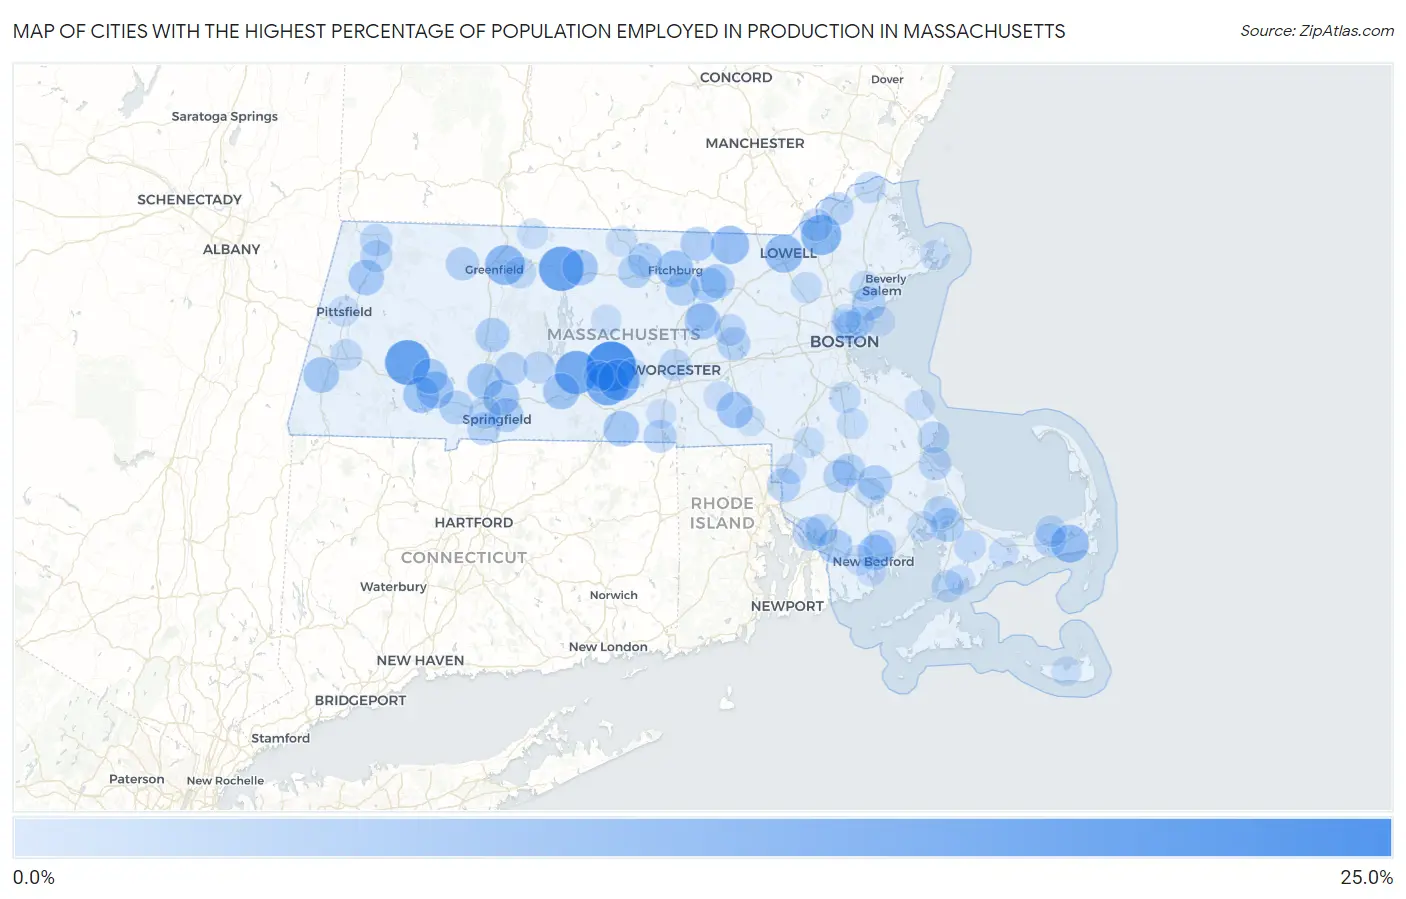
Map of Cities with the Highest Percentage of Population Employed in Production in Massachusetts
0.0%
25.0%
Cities with the Highest Percentage of Population Employed in Production in Massachusetts
| City | % Employed | vs State | vs National | |
| 1. | North Brookfield | 23.2% | 3.8%(+19.3)#1 | 5.5%(+17.7)#1,565 |
| 2. | Chester | 18.4% | 3.8%(+14.6)#2 | 5.5%(+13.0)#2,757 |
| 3. | Orange | 18.0% | 3.8%(+14.2)#3 | 5.5%(+12.6)#2,927 |
| 4. | Ware | 16.6% | 3.8%(+12.8)#4 | 5.5%(+11.2)#3,559 |
| 5. | Brookfield | 16.6% | 3.8%(+12.7)#5 | 5.5%(+11.1)#3,574 |
| 6. | East Brookfield | 14.7% | 3.8%(+10.9)#6 | 5.5%(+9.26)#4,594 |
| 7. | Lawrence | 13.6% | 3.8%(+9.73)#7 | 5.5%(+8.10)#5,315 |
| 8. | Turners Falls | 13.0% | 3.8%(+9.21)#8 | 5.5%(+7.57)#5,748 |
| 9. | East Pepperell | 11.5% | 3.8%(+7.69)#9 | 5.5%(+6.06)#7,101 |
| 10. | Lowell | 11.3% | 3.8%(+7.50)#10 | 5.5%(+5.86)#7,292 |
| 11. | Harwich Center | 11.2% | 3.8%(+7.39)#11 | 5.5%(+5.76)#7,406 |
| 12. | Russell | 10.2% | 3.8%(+6.42)#12 | 5.5%(+4.78)#8,427 |
| 13. | Fitchburg | 9.9% | 3.8%(+6.03)#13 | 5.5%(+4.39)#8,913 |
| 14. | Palmer Town | 9.6% | 3.8%(+5.81)#14 | 5.5%(+4.17)#9,167 |
| 15. | Hopedale | 9.6% | 3.8%(+5.72)#15 | 5.5%(+4.09)#9,266 |
| 16. | Blandford | 9.6% | 3.8%(+5.72)#16 | 5.5%(+4.08)#9,275 |
| 17. | Athol | 9.2% | 3.8%(+5.37)#17 | 5.5%(+3.74)#9,696 |
| 18. | Clinton | 9.2% | 3.8%(+5.35)#18 | 5.5%(+3.71)#9,733 |
| 19. | Holyoke | 9.2% | 3.8%(+5.33)#19 | 5.5%(+3.69)#9,752 |
| 20. | Chicopee | 9.2% | 3.8%(+5.33)#20 | 5.5%(+3.69)#9,754 |
| 21. | Southbridge Town | 9.1% | 3.8%(+5.25)#21 | 5.5%(+3.62)#9,884 |
| 22. | Housatonic | 9.0% | 3.8%(+5.14)#22 | 5.5%(+3.50)#10,011 |
| 23. | Cheshire | 8.9% | 3.8%(+5.07)#23 | 5.5%(+3.43)#10,099 |
| 24. | Huntington | 8.6% | 3.8%(+4.77)#24 | 5.5%(+3.13)#10,499 |
| 25. | New Bedford | 8.5% | 3.8%(+4.67)#25 | 5.5%(+3.03)#10,647 |
| 26. | Shirley | 8.3% | 3.8%(+4.49)#26 | 5.5%(+2.85)#10,925 |
| 27. | Fall River | 7.8% | 3.8%(+3.94)#27 | 5.5%(+2.30)#11,723 |
| 28. | Middleborough Center | 7.7% | 3.8%(+3.90)#28 | 5.5%(+2.26)#11,775 |
| 29. | Hatfield | 7.7% | 3.8%(+3.85)#29 | 5.5%(+2.21)#11,864 |
| 30. | Devens | 7.6% | 3.8%(+3.81)#30 | 5.5%(+2.18)#11,915 |
| 31. | South Ashburnham | 7.5% | 3.8%(+3.72)#31 | 5.5%(+2.08)#12,080 |
| 32. | Springfield | 7.5% | 3.8%(+3.70)#32 | 5.5%(+2.06)#12,113 |
| 33. | Townsend | 7.5% | 3.8%(+3.64)#33 | 5.5%(+2.01)#12,199 |
| 34. | Ocean Grove | 7.3% | 3.8%(+3.51)#34 | 5.5%(+1.88)#12,398 |
| 35. | Lynn | 7.3% | 3.8%(+3.48)#35 | 5.5%(+1.84)#12,476 |
| 36. | Westfield | 7.2% | 3.8%(+3.36)#36 | 5.5%(+1.73)#12,646 |
| 37. | Leominster | 7.1% | 3.8%(+3.24)#37 | 5.5%(+1.60)#12,864 |
| 38. | Buzzards Bay | 7.1% | 3.8%(+3.23)#38 | 5.5%(+1.59)#12,889 |
| 39. | Gardner | 7.0% | 3.8%(+3.19)#39 | 5.5%(+1.55)#12,951 |
| 40. | North Seekonk | 6.9% | 3.8%(+3.07)#40 | 5.5%(+1.44)#13,142 |
| 41. | Taunton | 6.7% | 3.8%(+2.89)#41 | 5.5%(+1.26)#13,440 |
| 42. | Shelburne Falls | 6.7% | 3.8%(+2.86)#42 | 5.5%(+1.22)#13,508 |
| 43. | Chelsea | 6.6% | 3.8%(+2.73)#43 | 5.5%(+1.09)#13,739 |
| 44. | White Island Shores | 6.5% | 3.8%(+2.69)#44 | 5.5%(+1.06)#13,801 |
| 45. | Acushnet Center | 6.5% | 3.8%(+2.69)#45 | 5.5%(+1.05)#13,822 |
| 46. | Haverhill | 6.4% | 3.8%(+2.61)#46 | 5.5%(+0.970)#13,944 |
| 47. | Marlborough | 6.4% | 3.8%(+2.60)#47 | 5.5%(+0.968)#13,947 |
| 48. | Granby | 6.4% | 3.8%(+2.58)#48 | 5.5%(+0.943)#13,992 |
| 49. | Webster | 6.4% | 3.8%(+2.54)#49 | 5.5%(+0.901)#14,054 |
| 50. | Raynham Center | 6.3% | 3.8%(+2.50)#50 | 5.5%(+0.868)#14,120 |
| 51. | South Dennis | 6.3% | 3.8%(+2.50)#51 | 5.5%(+0.862)#14,125 |
| 52. | Plymouth | 6.3% | 3.8%(+2.48)#52 | 5.5%(+0.840)#14,165 |
| 53. | Agawam Town | 6.3% | 3.8%(+2.45)#53 | 5.5%(+0.809)#14,221 |
| 54. | Methuen Town | 6.3% | 3.8%(+2.43)#54 | 5.5%(+0.789)#14,253 |
| 55. | North Adams | 5.9% | 3.8%(+2.06)#55 | 5.5%(+0.421)#14,922 |
| 56. | Somerset | 5.8% | 3.8%(+1.97)#56 | 5.5%(+0.330)#15,108 |
| 57. | West Springfield Town | 5.8% | 3.8%(+1.96)#57 | 5.5%(+0.321)#15,126 |
| 58. | Adams | 5.7% | 3.8%(+1.87)#58 | 5.5%(+0.236)#15,309 |
| 59. | Falmouth | 5.7% | 3.8%(+1.83)#59 | 5.5%(+0.193)#15,404 |
| 60. | Duxbury | 5.5% | 3.8%(+1.68)#60 | 5.5%(+0.043)#15,689 |
| 61. | Belchertown | 5.5% | 3.8%(+1.62)#61 | 5.5%(-0.014)#15,788 |
| 62. | Worcester | 5.4% | 3.8%(+1.61)#62 | 5.5%(-0.029)#15,825 |
| 63. | Hudson | 5.4% | 3.8%(+1.58)#63 | 5.5%(-0.060)#15,885 |
| 64. | Forestdale | 5.3% | 3.8%(+1.48)#64 | 5.5%(-0.153)#16,071 |
| 65. | Millers Falls | 5.2% | 3.8%(+1.39)#65 | 5.5%(-0.245)#16,242 |
| 66. | Lee | 5.2% | 3.8%(+1.34)#66 | 5.5%(-0.298)#16,355 |
| 67. | East Dennis | 5.1% | 3.8%(+1.24)#67 | 5.5%(-0.395)#16,516 |
| 68. | Amesbury Town | 5.1% | 3.8%(+1.24)#68 | 5.5%(-0.401)#16,526 |
| 69. | Randolph Town | 4.9% | 3.8%(+1.09)#69 | 5.5%(-0.547)#16,805 |
| 70. | Pinehurst | 4.8% | 3.8%(+0.982)#70 | 5.5%(-0.654)#17,017 |
| 71. | Mansfield Center | 4.6% | 3.8%(+0.816)#71 | 5.5%(-0.821)#17,363 |
| 72. | Brockton | 4.6% | 3.8%(+0.749)#72 | 5.5%(-0.887)#17,496 |
| 73. | Peabody | 4.6% | 3.8%(+0.720)#73 | 5.5%(-0.916)#17,543 |
| 74. | Everett | 4.5% | 3.8%(+0.629)#74 | 5.5%(-1.01)#17,725 |
| 75. | West Brookfield | 4.4% | 3.8%(+0.560)#75 | 5.5%(-1.08)#17,876 |
| 76. | Greenfield | 4.3% | 3.8%(+0.496)#76 | 5.5%(-1.14)#18,042 |
| 77. | Pittsfield | 4.3% | 3.8%(+0.492)#77 | 5.5%(-1.14)#18,050 |
| 78. | Attleboro | 4.3% | 3.8%(+0.452)#78 | 5.5%(-1.18)#18,135 |
| 79. | Northfield | 4.2% | 3.8%(+0.412)#79 | 5.5%(-1.22)#18,213 |
| 80. | Winchendon | 4.2% | 3.8%(+0.404)#80 | 5.5%(-1.23)#18,231 |
| 81. | North Attleborough | 4.2% | 3.8%(+0.326)#81 | 5.5%(-1.31)#18,395 |
| 82. | Smith Mills | 4.1% | 3.8%(+0.262)#82 | 5.5%(-1.37)#18,536 |
| 83. | Barre | 4.0% | 3.8%(+0.189)#83 | 5.5%(-1.45)#18,693 |
| 84. | Wareham Center | 4.0% | 3.8%(+0.185)#84 | 5.5%(-1.45)#18,703 |
| 85. | Spencer | 4.0% | 3.8%(+0.185)#85 | 5.5%(-1.45)#18,705 |
| 86. | Marshfield Hills | 4.0% | 3.8%(+0.136)#86 | 5.5%(-1.50)#18,800 |
| 87. | Gloucester | 3.9% | 3.8%(+0.095)#87 | 5.5%(-1.54)#18,880 |
| 88. | Upton | 3.9% | 3.8%(+0.057)#88 | 5.5%(-1.58)#18,966 |
| 89. | Bliss Corner | 3.9% | 3.8%(+0.034)#89 | 5.5%(-1.60)#19,016 |
| 90. | Barnstable Town | 3.8% | 3.8%(+0.011)#90 | 5.5%(-1.63)#19,075 |
| 91. | East Falmouth | 3.7% | 3.8%(-0.089)#91 | 5.5%(-1.73)#19,277 |
| 92. | Lenox Dale | 3.7% | 3.8%(-0.162)#92 | 5.5%(-1.80)#19,428 |
| 93. | North Lakeville | 3.7% | 3.8%(-0.173)#93 | 5.5%(-1.81)#19,445 |
| 94. | Nahant | 3.7% | 3.8%(-0.175)#94 | 5.5%(-1.81)#19,454 |
| 95. | Nantucket | 3.6% | 3.8%(-0.194)#95 | 5.5%(-1.83)#19,484 |
| 96. | Revere | 3.6% | 3.8%(-0.239)#96 | 5.5%(-1.88)#19,587 |
| 97. | South Lancaster | 3.6% | 3.8%(-0.251)#97 | 5.5%(-1.89)#19,617 |
| 98. | Oxford | 3.6% | 3.8%(-0.269)#98 | 5.5%(-1.91)#19,672 |
| 99. | Bellingham | 3.5% | 3.8%(-0.293)#99 | 5.5%(-1.93)#19,708 |
| 100. | Malden | 3.5% | 3.8%(-0.305)#100 | 5.5%(-1.94)#19,739 |
Common Questions
What are the Top 10 Cities with the Highest Percentage of Population Employed in Production in Massachusetts?
Top 10 Cities with the Highest Percentage of Population Employed in Production in Massachusetts are:
#1
23.2%
#2
18.4%
#3
18.0%
#4
16.6%
#5
16.6%
#6
14.7%
#7
13.6%
#8
13.0%
#9
11.5%
#10
11.3%
What city has the Highest Percentage of Population Employed in Production in Massachusetts?
North Brookfield has the Highest Percentage of Population Employed in Production in Massachusetts with 23.2%.
What is the Percentage of Population Employed in Production in the State of Massachusetts?
Percentage of Population Employed in Production in Massachusetts is 3.8%.
What is the Percentage of Population Employed in Production in the United States?
Percentage of Population Employed in Production in the United States is 5.5%.