Medfield, MA Map & Demographics
Medfield Map
Medfield Overview
$88,888
PER CAPITA INCOME
$239,919
AVG FAMILY INCOME
$181,125
AVG HOUSEHOLD INCOME
54.9%
WAGE / INCOME GAP [ % ]
45.1¢/ $1
WAGE / INCOME GAP [ $ ]
0.48
INEQUALITY / GINI INDEX
6,318
TOTAL POPULATION
3,075
MALE POPULATION
3,243
FEMALE POPULATION
94.82
MALES / 100 FEMALES
105.46
FEMALES / 100 MALES
45.9
MEDIAN AGE
3.1
AVG FAMILY SIZE
2.6
AVG HOUSEHOLD SIZE
3,461
LABOR FORCE [ PEOPLE ]
69.1%
PERCENT IN LABOR FORCE
5.5%
UNEMPLOYMENT RATE
Medfield Zip Codes
Income in Medfield
Income Overview in Medfield
Per Capita Income in Medfield is $88,888, while median incomes of families and households are $239,919 and $181,125 respectively.
| Characteristic | Number | Measure |
| Per Capita Income | 6,318 | $88,888 |
| Median Family Income | 1,732 | $239,919 |
| Mean Family Income | 1,732 | $288,679 |
| Median Household Income | 2,453 | $181,125 |
| Mean Household Income | 2,453 | $226,505 |
| Income Deficit | 1,732 | $0 |
| Wage / Income Gap (%) | 6,318 | 54.95% |
| Wage / Income Gap ($) | 6,318 | 45.05¢ per $1 |
| Gini / Inequality Index | 6,318 | 0.48 |
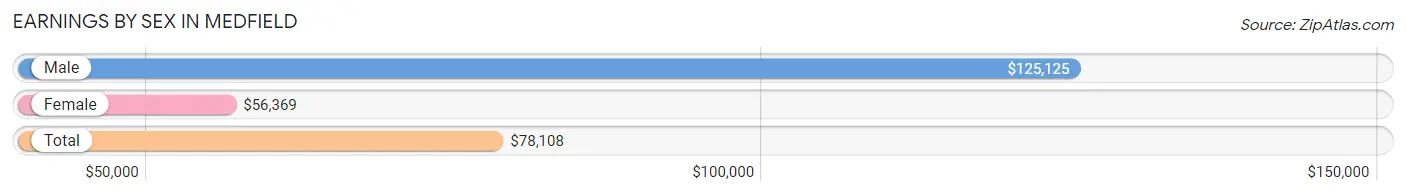
Earnings by Sex in Medfield
Average Earnings in Medfield are $78,108, $125,125 for men and $56,369 for women, a difference of 54.9%.
| Sex | Number | Average Earnings |
| Male | 1,844 (50.4%) | $125,125 |
| Female | 1,812 (49.6%) | $56,369 |
| Total | 3,656 (100.0%) | $78,108 |
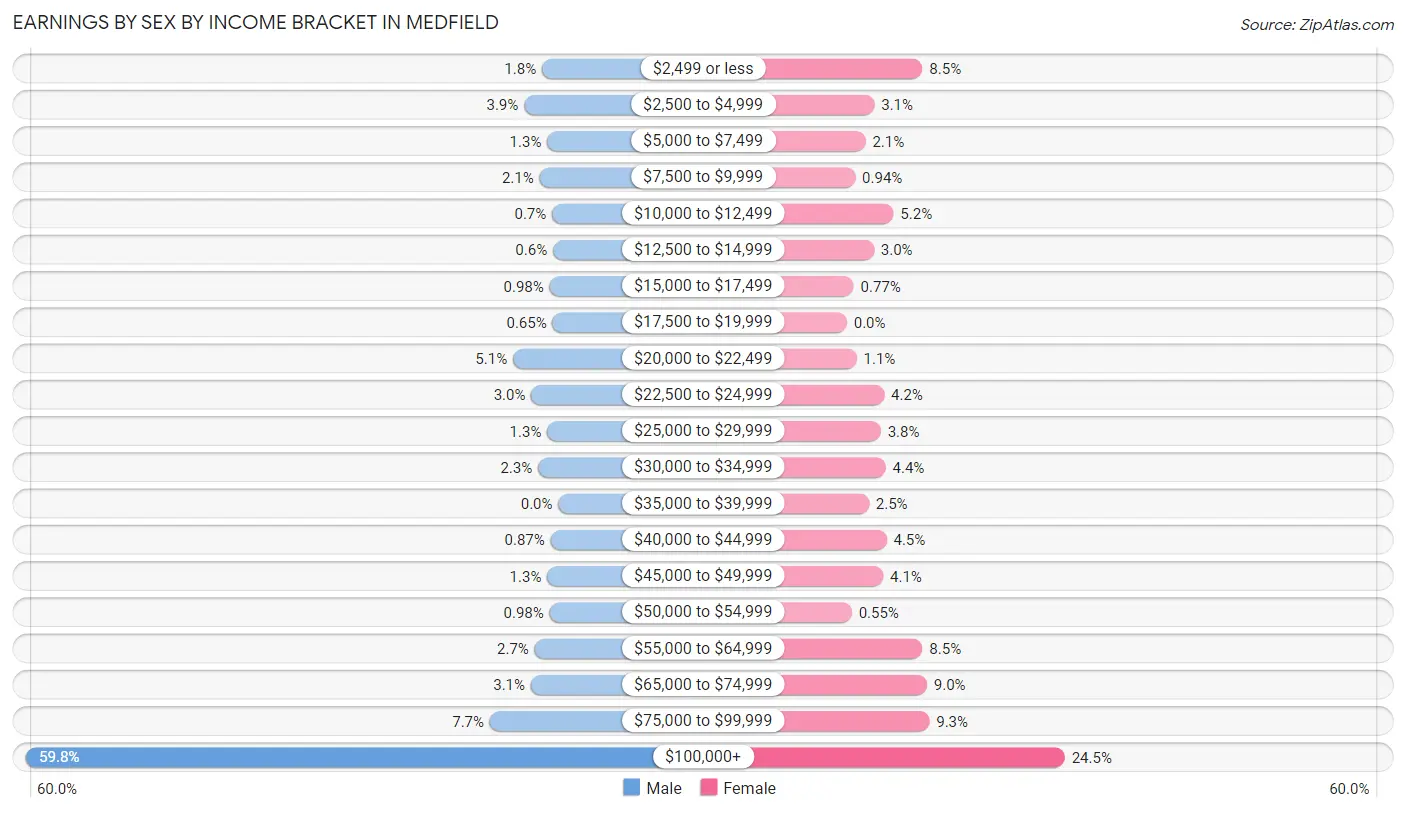
Earnings by Sex by Income Bracket in Medfield
The most common earnings brackets in Medfield are $100,000+ for men (1,103 | 59.8%) and $100,000+ for women (444 | 24.5%).
| Income | Male | Female |
| $2,499 or less | 34 (1.8%) | 154 (8.5%) |
| $2,500 to $4,999 | 71 (3.8%) | 56 (3.1%) |
| $5,000 to $7,499 | 23 (1.3%) | 38 (2.1%) |
| $7,500 to $9,999 | 39 (2.1%) | 17 (0.9%) |
| $10,000 to $12,499 | 13 (0.7%) | 95 (5.2%) |
| $12,500 to $14,999 | 11 (0.6%) | 55 (3.0%) |
| $15,000 to $17,499 | 18 (1.0%) | 14 (0.8%) |
| $17,500 to $19,999 | 12 (0.6%) | 0 (0.0%) |
| $20,000 to $22,499 | 94 (5.1%) | 20 (1.1%) |
| $22,500 to $24,999 | 56 (3.0%) | 76 (4.2%) |
| $25,000 to $29,999 | 23 (1.3%) | 69 (3.8%) |
| $30,000 to $34,999 | 42 (2.3%) | 79 (4.4%) |
| $35,000 to $39,999 | 0 (0.0%) | 45 (2.5%) |
| $40,000 to $44,999 | 16 (0.9%) | 81 (4.5%) |
| $45,000 to $49,999 | 23 (1.3%) | 74 (4.1%) |
| $50,000 to $54,999 | 18 (1.0%) | 10 (0.5%) |
| $55,000 to $64,999 | 49 (2.7%) | 154 (8.5%) |
| $65,000 to $74,999 | 57 (3.1%) | 163 (9.0%) |
| $75,000 to $99,999 | 142 (7.7%) | 168 (9.3%) |
| $100,000+ | 1,103 (59.8%) | 444 (24.5%) |
| Total | 1,844 (100.0%) | 1,812 (100.0%) |
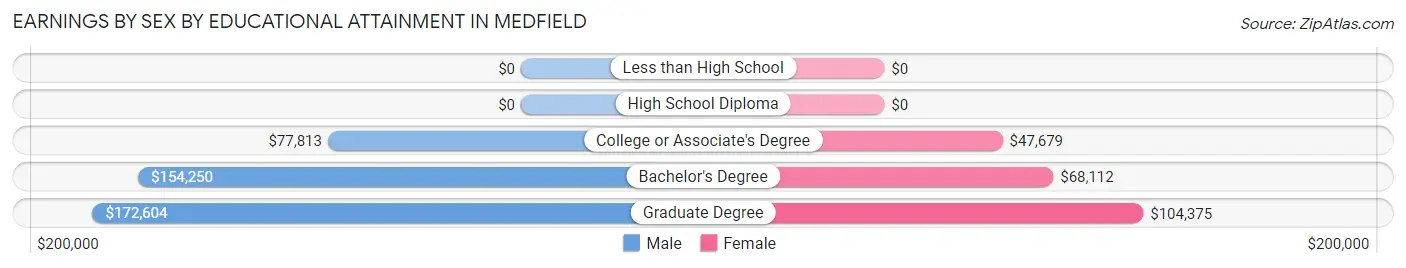
Earnings by Sex by Educational Attainment in Medfield
Average earnings in Medfield are $140,757 for men and $63,889 for women, a difference of 54.6%. Men with an educational attainment of graduate degree enjoy the highest average annual earnings of $172,604, while those with college or associate's degree education earn the least with $77,813. Women with an educational attainment of graduate degree earn the most with the average annual earnings of $104,375, while those with college or associate's degree education have the smallest earnings of $47,679.
| Educational Attainment | Male Income | Female Income |
| Less than High School | - | - |
| High School Diploma | - | - |
| College or Associate's Degree | $77,813 | $47,679 |
| Bachelor's Degree | $154,250 | $68,112 |
| Graduate Degree | $172,604 | $104,375 |
| Total | $140,757 | $63,889 |
Family Income in Medfield
Family Income Brackets in Medfield
According to the Medfield family income data, there are 1,062 families falling into the $200,000+ income range, which is the most common income bracket and makes up 61.3% of all families.
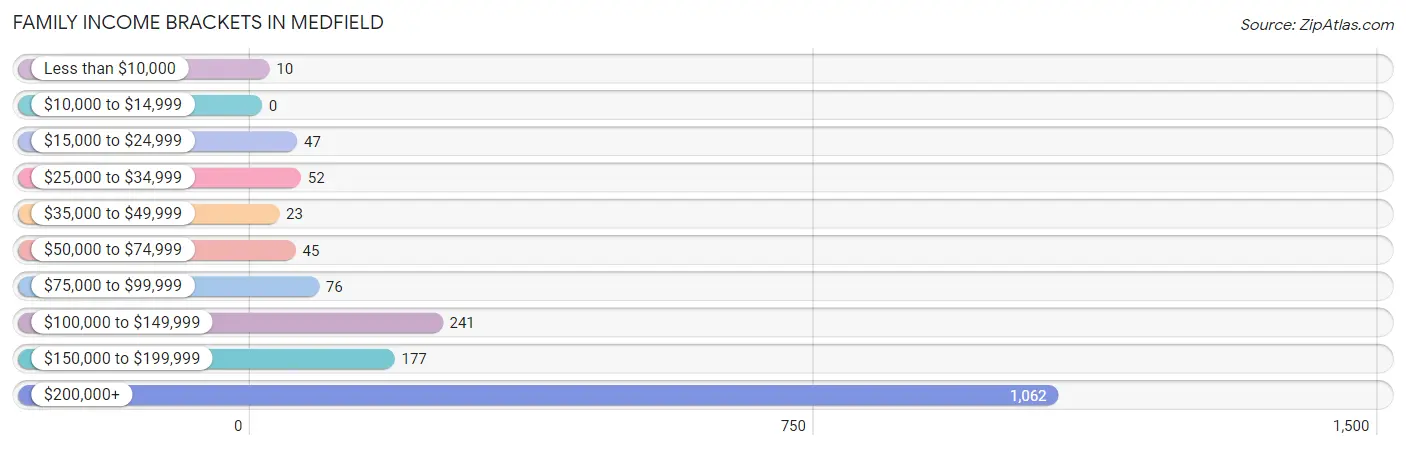
| Income Bracket | # Families | % Families |
| Less than $10,000 | 10 | 0.6% |
| $10,000 to $14,999 | 0 | 0.0% |
| $15,000 to $24,999 | 47 | 2.7% |
| $25,000 to $34,999 | 52 | 3.0% |
| $35,000 to $49,999 | 23 | 1.3% |
| $50,000 to $74,999 | 45 | 2.6% |
| $75,000 to $99,999 | 76 | 4.4% |
| $100,000 to $149,999 | 241 | 13.9% |
| $150,000 to $199,999 | 177 | 10.2% |
| $200,000+ | 1,062 | 61.3% |
Family Income by Famaliy Size in Medfield
4-person families (377 | 21.8%) account for the highest median family income in Medfield with $250,001 per family, while 2-person families (784 | 45.3%) have the highest median income of $88,958 per family member.
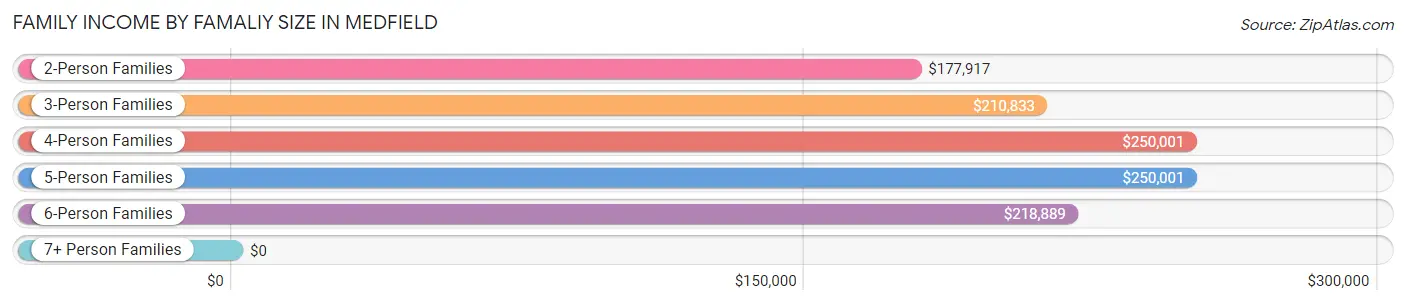
| Income Bracket | # Families | Median Income |
| 2-Person Families | 784 (45.3%) | $177,917 |
| 3-Person Families | 376 (21.7%) | $210,833 |
| 4-Person Families | 377 (21.8%) | $250,001 |
| 5-Person Families | 150 (8.7%) | $250,001 |
| 6-Person Families | 28 (1.6%) | $218,889 |
| 7+ Person Families | 17 (1.0%) | $0 |
| Total | 1,732 (100.0%) | $239,919 |
Family Income by Number of Earners in Medfield
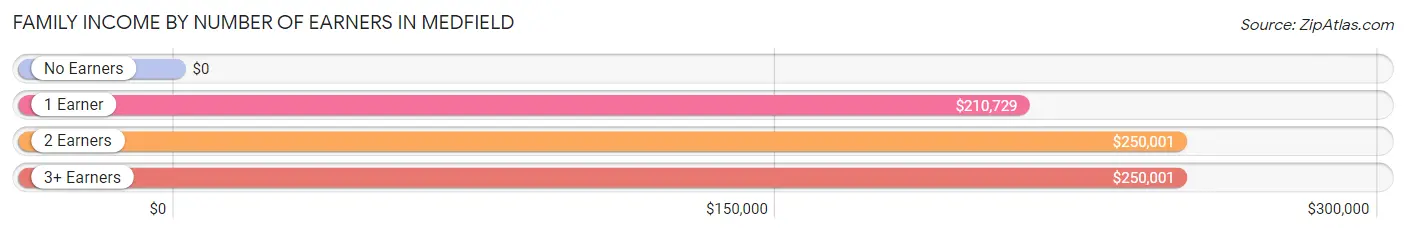
| Number of Earners | # Families | Median Income |
| No Earners | 159 (9.2%) | $0 |
| 1 Earner | 481 (27.8%) | $210,729 |
| 2 Earners | 808 (46.7%) | $250,001 |
| 3+ Earners | 284 (16.4%) | $250,001 |
| Total | 1,732 (100.0%) | $239,919 |
Household Income in Medfield
Household Income Brackets in Medfield
With 1,146 households falling in the category, the $200,000+ income range is the most frequent in Medfield, accounting for 46.7% of all households. In contrast, only 64 households (2.6%) fall into the $10,000 to $14,999 income bracket, making it the least populous group.
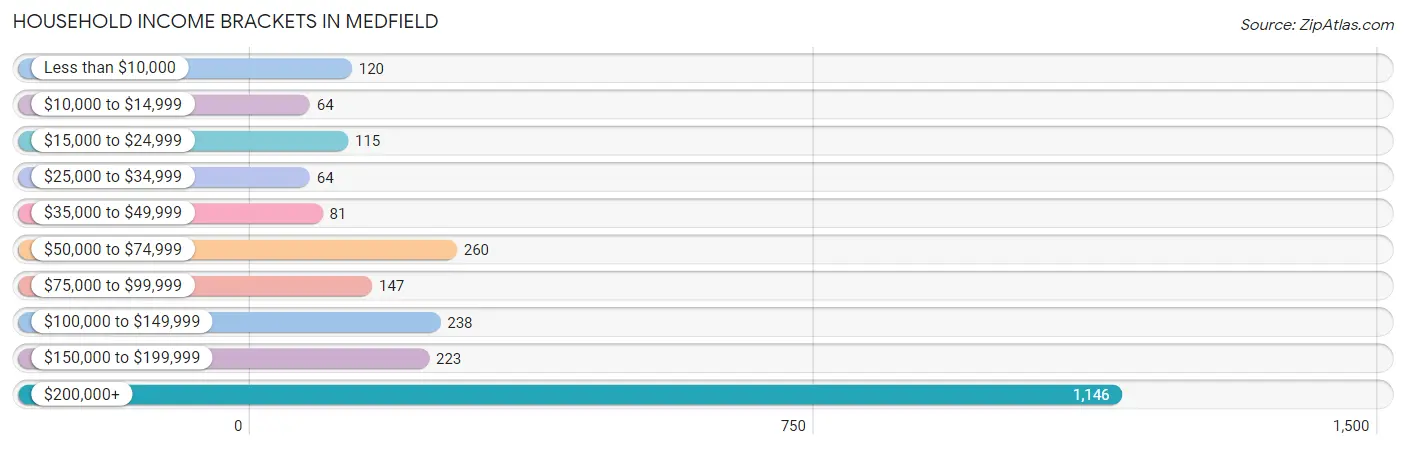
| Income Bracket | # Households | % Households |
| Less than $10,000 | 120 | 4.9% |
| $10,000 to $14,999 | 64 | 2.6% |
| $15,000 to $24,999 | 115 | 4.7% |
| $25,000 to $34,999 | 64 | 2.6% |
| $35,000 to $49,999 | 81 | 3.3% |
| $50,000 to $74,999 | 260 | 10.6% |
| $75,000 to $99,999 | 147 | 6.0% |
| $100,000 to $149,999 | 238 | 9.7% |
| $150,000 to $199,999 | 223 | 9.1% |
| $200,000+ | 1,146 | 46.7% |
Household Income by Householder Age in Medfield
The median household income in Medfield is $181,125, with the highest median household income of $239,315 found in the 45 to 64 years age bracket for the primary householder. A total of 1,137 households (46.4%) fall into this category.
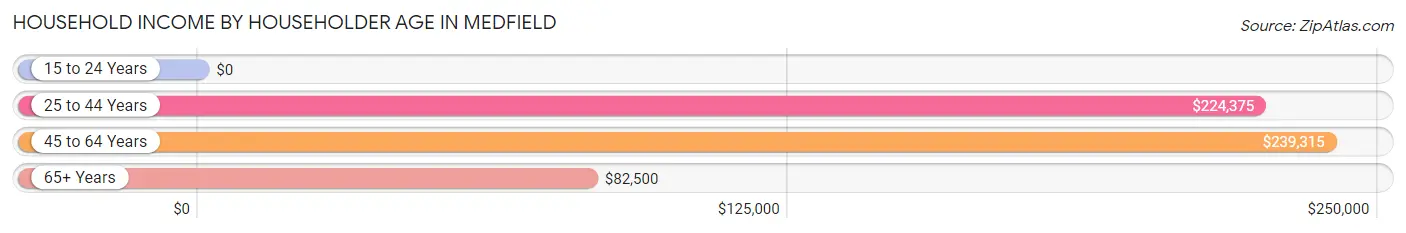
| Income Bracket | # Households | Median Income |
| 15 to 24 Years | 0 (0.0%) | $0 |
| 25 to 44 Years | 562 (22.9%) | $224,375 |
| 45 to 64 Years | 1,137 (46.4%) | $239,315 |
| 65+ Years | 754 (30.7%) | $82,500 |
| Total | 2,453 (100.0%) | $181,125 |
Poverty in Medfield
Income Below Poverty by Sex and Age in Medfield
With 4.2% poverty level for males and 3.8% for females among the residents of Medfield, 25 to 34 year old males and 75 year old and over females are the most vulnerable to poverty, with 53 males (20.0%) and 49 females (15.9%) in their respective age groups living below the poverty level.
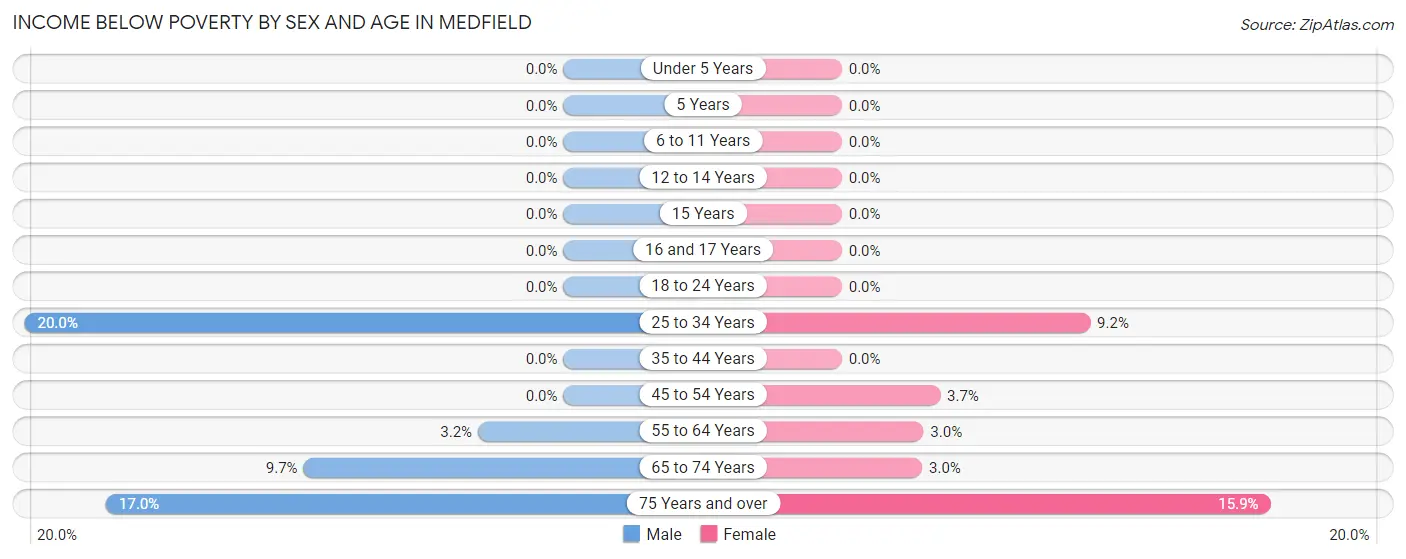
| Age Bracket | Male | Female |
| Under 5 Years | 0 (0.0%) | 0 (0.0%) |
| 5 Years | 0 (0.0%) | 0 (0.0%) |
| 6 to 11 Years | 0 (0.0%) | 0 (0.0%) |
| 12 to 14 Years | 0 (0.0%) | 0 (0.0%) |
| 15 Years | 0 (0.0%) | 0 (0.0%) |
| 16 and 17 Years | 0 (0.0%) | 0 (0.0%) |
| 18 to 24 Years | 0 (0.0%) | 0 (0.0%) |
| 25 to 34 Years | 53 (20.0%) | 27 (9.2%) |
| 35 to 44 Years | 0 (0.0%) | 0 (0.0%) |
| 45 to 54 Years | 0 (0.0%) | 15 (3.6%) |
| 55 to 64 Years | 22 (3.2%) | 20 (3.0%) |
| 65 to 74 Years | 25 (9.7%) | 10 (3.0%) |
| 75 Years and over | 27 (17.0%) | 49 (15.9%) |
| Total | 127 (4.2%) | 121 (3.8%) |
Income Above Poverty by Sex and Age in Medfield
According to the poverty statistics in Medfield, males aged under 5 years and females aged under 5 years are the age groups that are most secure financially, with 100.0% of males and 100.0% of females in these age groups living above the poverty line.
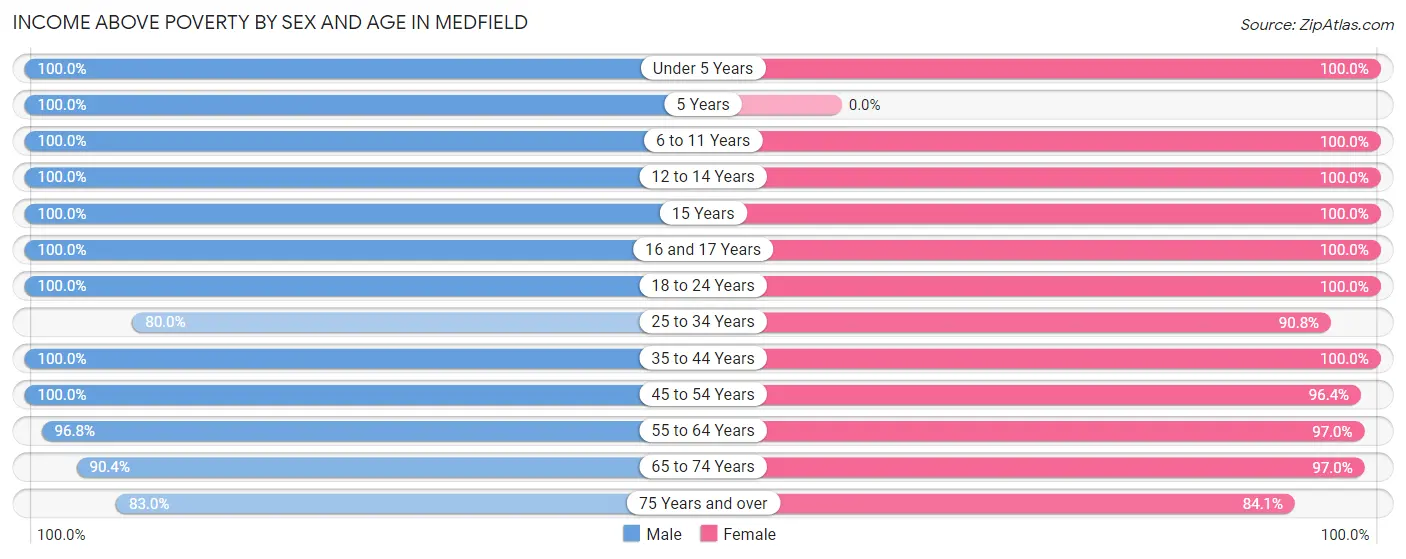
| Age Bracket | Male | Female |
| Under 5 Years | 248 (100.0%) | 217 (100.0%) |
| 5 Years | 34 (100.0%) | 0 (0.0%) |
| 6 to 11 Years | 215 (100.0%) | 208 (100.0%) |
| 12 to 14 Years | 196 (100.0%) | 163 (100.0%) |
| 15 Years | 9 (100.0%) | 19 (100.0%) |
| 16 and 17 Years | 23 (100.0%) | 71 (100.0%) |
| 18 to 24 Years | 228 (100.0%) | 204 (100.0%) |
| 25 to 34 Years | 212 (80.0%) | 266 (90.8%) |
| 35 to 44 Years | 343 (100.0%) | 333 (100.0%) |
| 45 to 54 Years | 387 (100.0%) | 396 (96.4%) |
| 55 to 64 Years | 672 (96.8%) | 639 (97.0%) |
| 65 to 74 Years | 234 (90.3%) | 326 (97.0%) |
| 75 Years and over | 132 (83.0%) | 259 (84.1%) |
| Total | 2,933 (95.9%) | 3,101 (96.2%) |
Income Below Poverty Among Married-Couple Families in Medfield
The poverty statistics for married-couple families in Medfield show that 0.7% or 11 of the total 1,471 families live below the poverty line. Families with no children have the highest poverty rate of 1.3%, comprising of 11 families. On the other hand, families with 1 or 2 children have the lowest poverty rate of 0.0%, which includes 0 families.
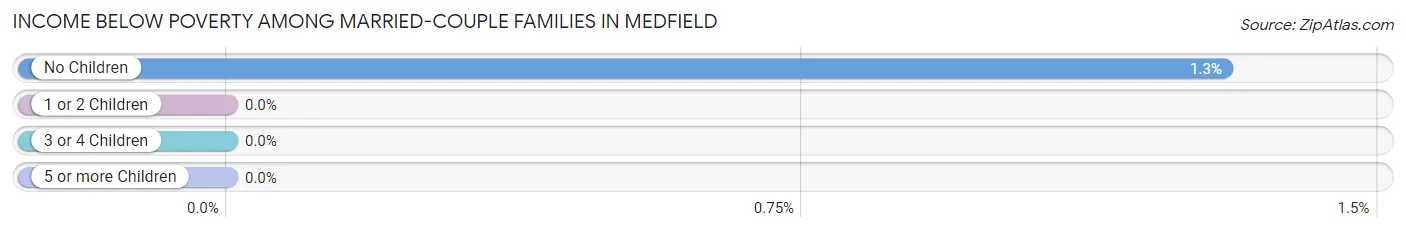
| Children | Above Poverty | Below Poverty |
| No Children | 835 (98.7%) | 11 (1.3%) |
| 1 or 2 Children | 510 (100.0%) | 0 (0.0%) |
| 3 or 4 Children | 98 (100.0%) | 0 (0.0%) |
| 5 or more Children | 17 (100.0%) | 0 (0.0%) |
| Total | 1,460 (99.3%) | 11 (0.7%) |
Income Below Poverty Among Single-Parent Households in Medfield
| Children | Single Father | Single Mother |
| No Children | 0 (0.0%) | 0 (0.0%) |
| 1 or 2 Children | 0 (0.0%) | 0 (0.0%) |
| 3 or 4 Children | 0 (0.0%) | 0 (0.0%) |
| 5 or more Children | 0 (0.0%) | 0 (0.0%) |
| Total | 0 (0.0%) | 0 (0.0%) |
Income Below Poverty Among Married-Couple vs Single-Parent Households in Medfield
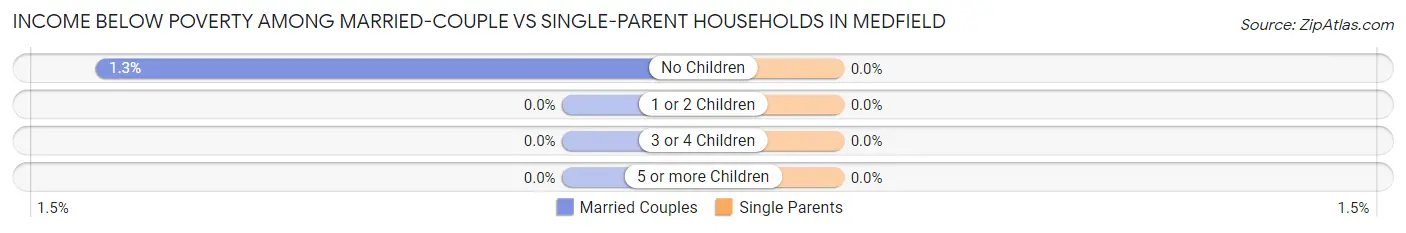
| Children | Married-Couple Families | Single-Parent Households |
| No Children | 11 (1.3%) | 0 (0.0%) |
| 1 or 2 Children | 0 (0.0%) | 0 (0.0%) |
| 3 or 4 Children | 0 (0.0%) | 0 (0.0%) |
| 5 or more Children | 0 (0.0%) | 0 (0.0%) |
| Total | 11 (0.7%) | 0 (0.0%) |
Race in Medfield
The most populous races in Medfield are White / Caucasian (5,416 | 85.7%), Two or more Races (535 | 8.5%), and Hispanic or Latino (373 | 5.9%).
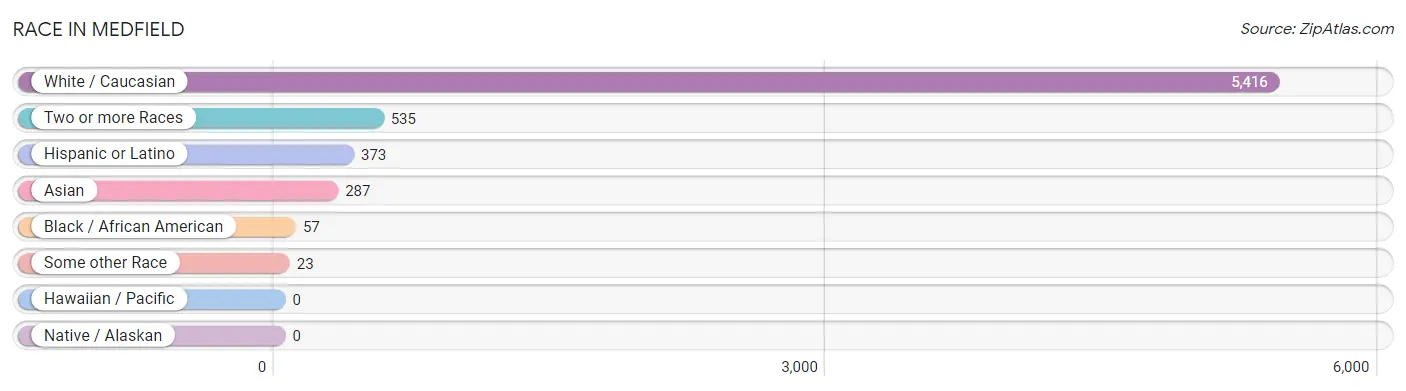
| Race | # Population | % Population |
| Asian | 287 | 4.5% |
| Black / African American | 57 | 0.9% |
| Hawaiian / Pacific | 0 | 0.0% |
| Hispanic or Latino | 373 | 5.9% |
| Native / Alaskan | 0 | 0.0% |
| White / Caucasian | 5,416 | 85.7% |
| Two or more Races | 535 | 8.5% |
| Some other Race | 23 | 0.4% |
| Total | 6,318 | 100.0% |
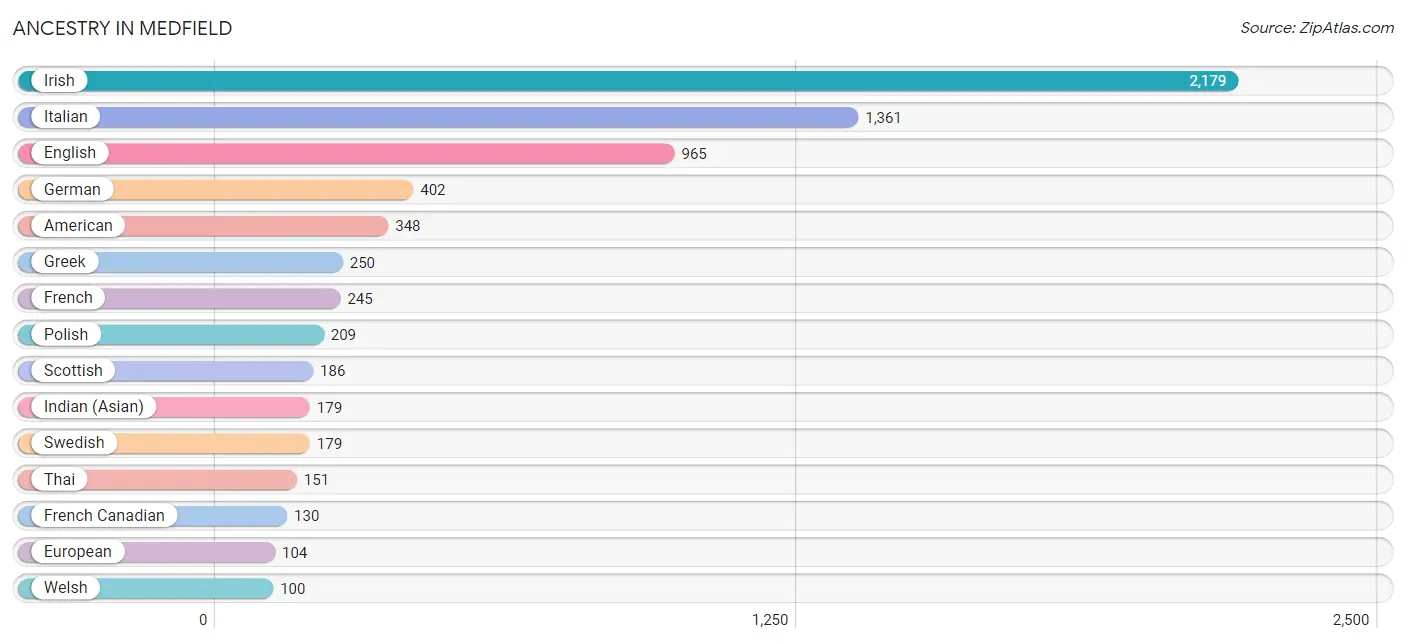
Ancestry in Medfield
The most populous ancestries reported in Medfield are Irish (2,179 | 34.5%), Italian (1,361 | 21.5%), English (965 | 15.3%), German (402 | 6.4%), and American (348 | 5.5%), together accounting for 83.2% of all Medfield residents.
| Ancestry | # Population | % Population |
| American | 348 | 5.5% |
| Armenian | 55 | 0.9% |
| Austrian | 11 | 0.2% |
| Belgian | 1 | 0.0% |
| Brazilian | 26 | 0.4% |
| British | 32 | 0.5% |
| Burmese | 76 | 1.2% |
| Cambodian | 1 | 0.0% |
| Canadian | 46 | 0.7% |
| Central American | 48 | 0.8% |
| Cherokee | 13 | 0.2% |
| Costa Rican | 48 | 0.8% |
| Croatian | 16 | 0.3% |
| Cuban | 79 | 1.3% |
| Dominican | 23 | 0.4% |
| Eastern European | 11 | 0.2% |
| English | 965 | 15.3% |
| European | 104 | 1.7% |
| Finnish | 15 | 0.2% |
| French | 245 | 3.9% |
| French Canadian | 130 | 2.1% |
| German | 402 | 6.4% |
| Greek | 250 | 4.0% |
| Hungarian | 7 | 0.1% |
| Indian (Asian) | 179 | 2.8% |
| Irish | 2,179 | 34.5% |
| Italian | 1,361 | 21.5% |
| Laotian | 58 | 0.9% |
| Latvian | 17 | 0.3% |
| Lithuanian | 67 | 1.1% |
| Mexican | 23 | 0.4% |
| Northern European | 10 | 0.2% |
| Polish | 209 | 3.3% |
| Portuguese | 84 | 1.3% |
| Puerto Rican | 99 | 1.6% |
| Russian | 65 | 1.0% |
| Scandinavian | 48 | 0.8% |
| Scotch-Irish | 84 | 1.3% |
| Scottish | 186 | 2.9% |
| Slovak | 19 | 0.3% |
| South American | 38 | 0.6% |
| Spaniard | 34 | 0.5% |
| Spanish | 29 | 0.5% |
| Swedish | 179 | 2.8% |
| Swiss | 15 | 0.2% |
| Thai | 151 | 2.4% |
| Turkish | 10 | 0.2% |
| Ukrainian | 19 | 0.3% |
| Venezuelan | 38 | 0.6% |
| Welsh | 100 | 1.6% | View All 50 Rows |
Immigrants in Medfield
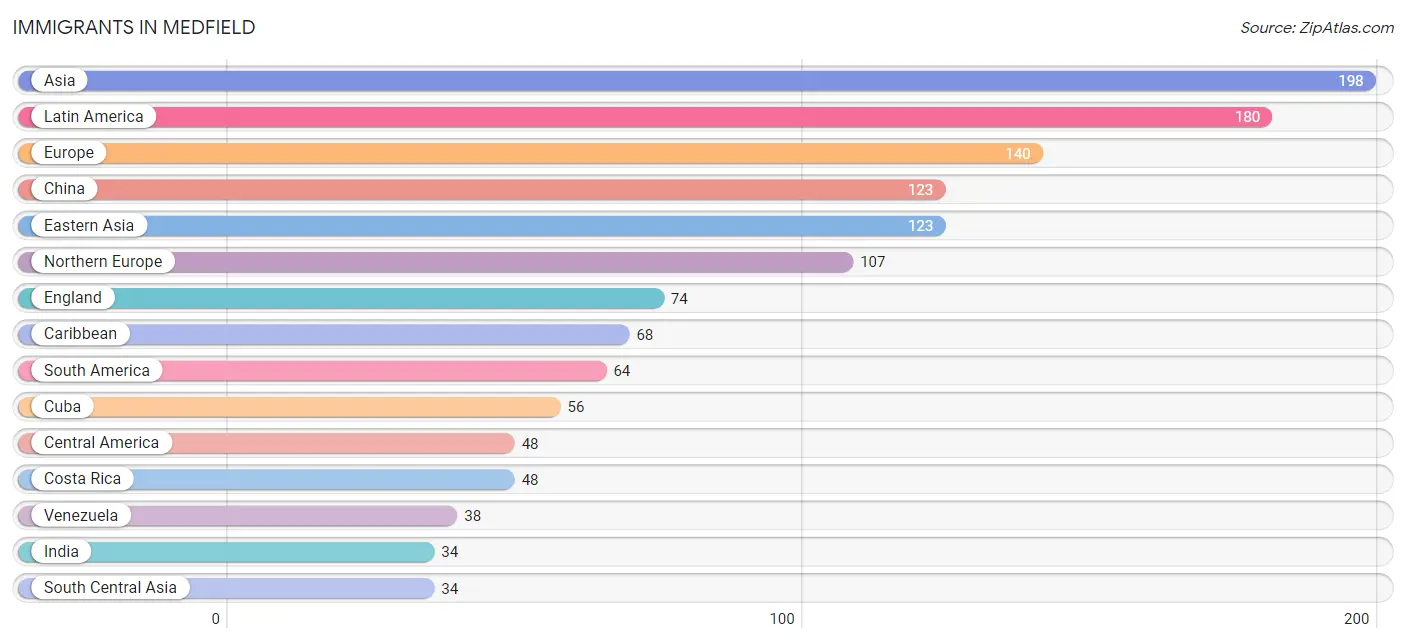
The most numerous immigrant groups reported in Medfield came from Asia (198 | 3.1%), Latin America (180 | 2.9%), Europe (140 | 2.2%), China (123 | 1.9%), and Eastern Asia (123 | 1.9%), together accounting for 12.1% of all Medfield residents.
| Immigration Origin | # Population | % Population |
| Africa | 21 | 0.3% |
| Asia | 198 | 3.1% |
| Brazil | 26 | 0.4% |
| Caribbean | 68 | 1.1% |
| Central America | 48 | 0.8% |
| China | 123 | 1.9% |
| Costa Rica | 48 | 0.8% |
| Cuba | 56 | 0.9% |
| Dominican Republic | 12 | 0.2% |
| Eastern Africa | 21 | 0.3% |
| Eastern Asia | 123 | 1.9% |
| Eastern Europe | 10 | 0.2% |
| England | 74 | 1.2% |
| Europe | 140 | 2.2% |
| Germany | 5 | 0.1% |
| Greece | 18 | 0.3% |
| India | 34 | 0.5% |
| Indonesia | 31 | 0.5% |
| Ireland | 22 | 0.4% |
| Latin America | 180 | 2.9% |
| Northern Europe | 107 | 1.7% |
| South America | 64 | 1.0% |
| South Central Asia | 34 | 0.5% |
| South Eastern Asia | 31 | 0.5% |
| Southern Europe | 18 | 0.3% |
| Taiwan | 10 | 0.2% |
| Turkey | 10 | 0.2% |
| Ukraine | 10 | 0.2% |
| Venezuela | 38 | 0.6% |
| Western Asia | 10 | 0.2% |
| Western Europe | 5 | 0.1% | View All 31 Rows |
Sex and Age in Medfield
Sex and Age in Medfield
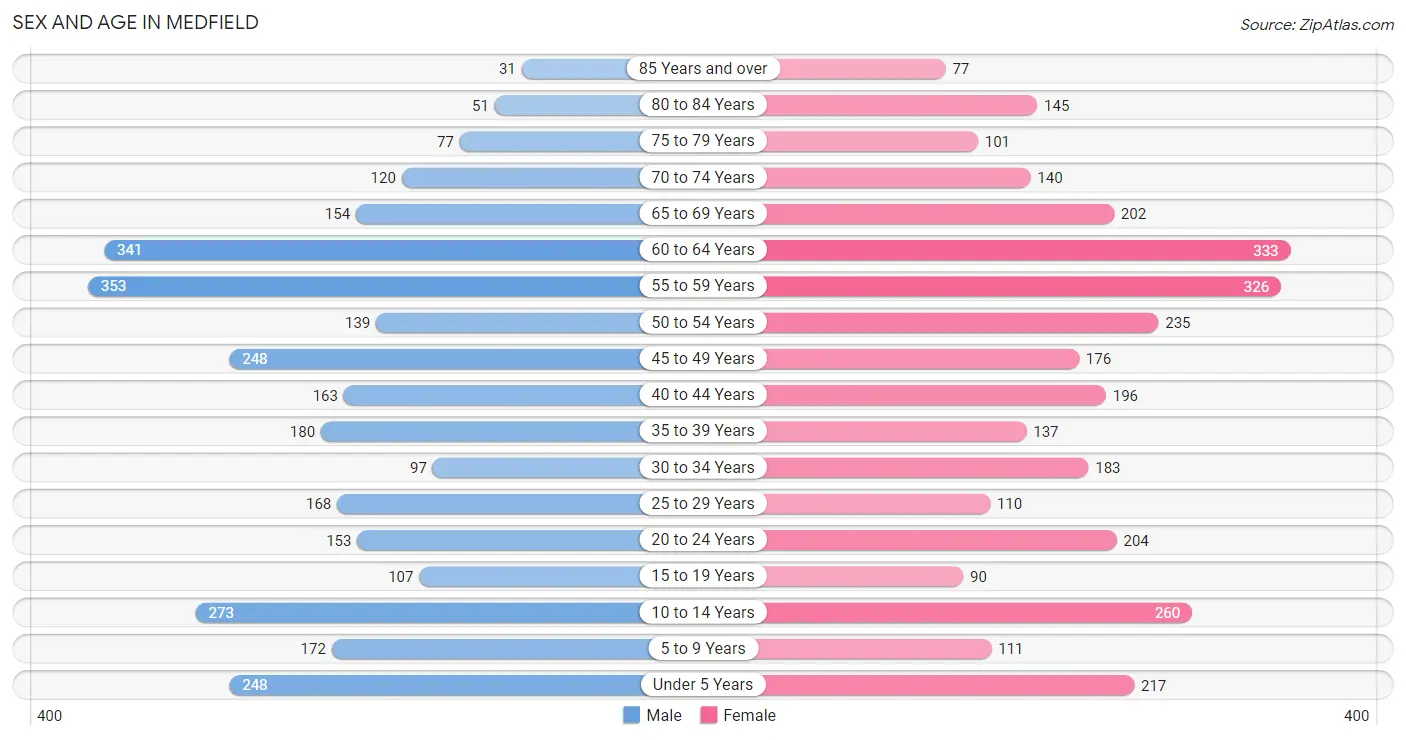
The most populous age groups in Medfield are 55 to 59 Years (353 | 11.5%) for men and 60 to 64 Years (333 | 10.3%) for women.
| Age Bracket | Male | Female |
| Under 5 Years | 248 (8.1%) | 217 (6.7%) |
| 5 to 9 Years | 172 (5.6%) | 111 (3.4%) |
| 10 to 14 Years | 273 (8.9%) | 260 (8.0%) |
| 15 to 19 Years | 107 (3.5%) | 90 (2.8%) |
| 20 to 24 Years | 153 (5.0%) | 204 (6.3%) |
| 25 to 29 Years | 168 (5.5%) | 110 (3.4%) |
| 30 to 34 Years | 97 (3.2%) | 183 (5.6%) |
| 35 to 39 Years | 180 (5.9%) | 137 (4.2%) |
| 40 to 44 Years | 163 (5.3%) | 196 (6.0%) |
| 45 to 49 Years | 248 (8.1%) | 176 (5.4%) |
| 50 to 54 Years | 139 (4.5%) | 235 (7.2%) |
| 55 to 59 Years | 353 (11.5%) | 326 (10.1%) |
| 60 to 64 Years | 341 (11.1%) | 333 (10.3%) |
| 65 to 69 Years | 154 (5.0%) | 202 (6.2%) |
| 70 to 74 Years | 120 (3.9%) | 140 (4.3%) |
| 75 to 79 Years | 77 (2.5%) | 101 (3.1%) |
| 80 to 84 Years | 51 (1.7%) | 145 (4.5%) |
| 85 Years and over | 31 (1.0%) | 77 (2.4%) |
| Total | 3,075 (100.0%) | 3,243 (100.0%) |
Families and Households in Medfield
Median Family Size in Medfield
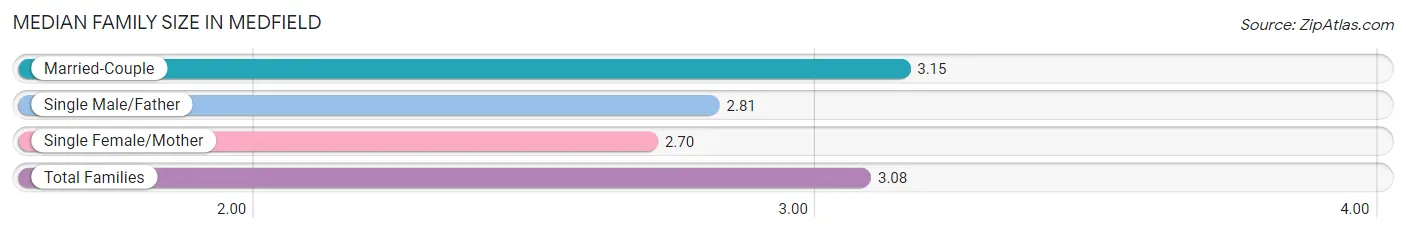
The median family size in Medfield is 3.08 persons per family, with married-couple families (1,471 | 84.9%) accounting for the largest median family size of 3.15 persons per family. On the other hand, single female/mother families (214 | 12.4%) represent the smallest median family size with 2.70 persons per family.
| Family Type | # Families | Family Size |
| Married-Couple | 1,471 (84.9%) | 3.15 |
| Single Male/Father | 47 (2.7%) | 2.81 |
| Single Female/Mother | 214 (12.4%) | 2.70 |
| Total Families | 1,732 (100.0%) | 3.08 |
Median Household Size in Medfield
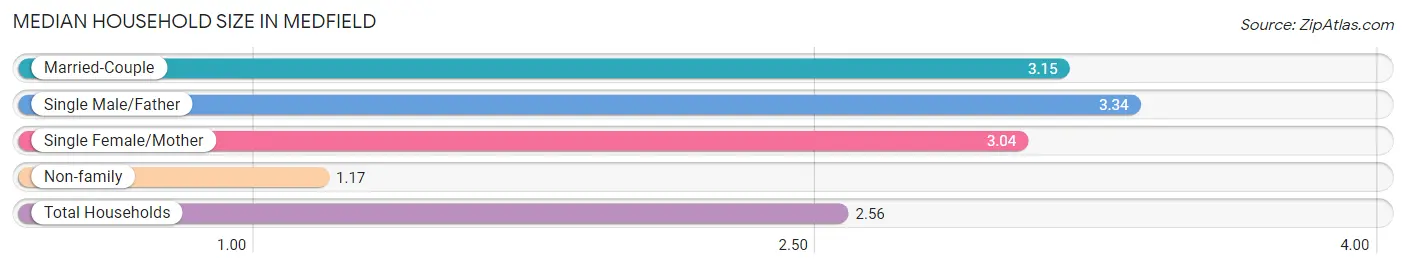
The median household size in Medfield is 2.56 persons per household, with single male/father households (47 | 1.9%) accounting for the largest median household size of 3.34 persons per household. non-family households (721 | 29.4%) represent the smallest median household size with 1.17 persons per household.
| Household Type | # Households | Household Size |
| Married-Couple | 1,471 (60.0%) | 3.15 |
| Single Male/Father | 47 (1.9%) | 3.34 |
| Single Female/Mother | 214 (8.7%) | 3.04 |
| Non-family | 721 (29.4%) | 1.17 |
| Total Households | 2,453 (100.0%) | 2.56 |
Household Size by Marriage Status in Medfield
Out of a total of 2,453 households in Medfield, 1,732 (70.6%) are family households, while 721 (29.4%) are nonfamily households. The most numerous type of family households are 2-person households, comprising 730, and the most common type of nonfamily households are 1-person households, comprising 595.
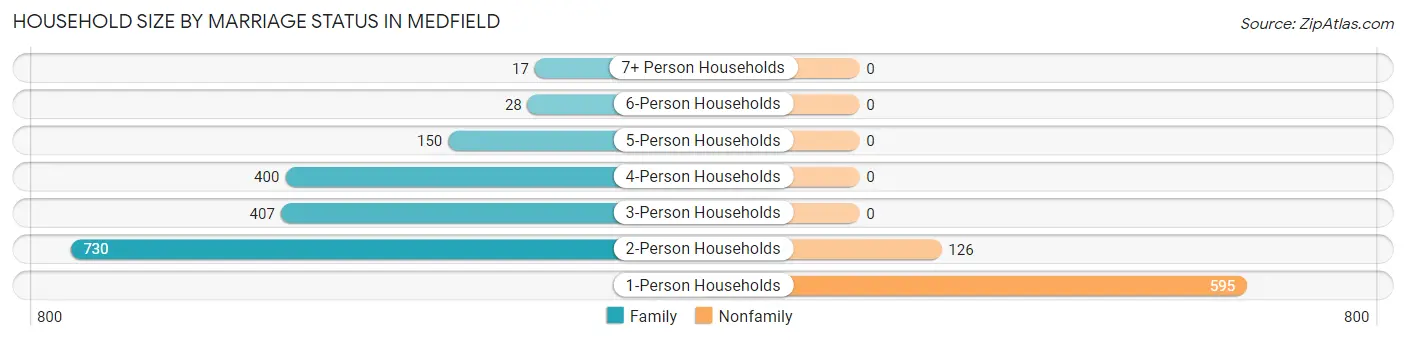
| Household Size | Family Households | Nonfamily Households |
| 1-Person Households | - | 595 (24.3%) |
| 2-Person Households | 730 (29.8%) | 126 (5.1%) |
| 3-Person Households | 407 (16.6%) | 0 (0.0%) |
| 4-Person Households | 400 (16.3%) | 0 (0.0%) |
| 5-Person Households | 150 (6.1%) | 0 (0.0%) |
| 6-Person Households | 28 (1.1%) | 0 (0.0%) |
| 7+ Person Households | 17 (0.7%) | 0 (0.0%) |
| Total | 1,732 (70.6%) | 721 (29.4%) |
Female Fertility in Medfield
Fertility by Age in Medfield
Average fertility rate in Medfield is 62.0 births per 1,000 women. Women in the age bracket of 20 to 34 years have the highest fertility rate with 123.0 births per 1,000 women. Women in the age bracket of 20 to 34 years acount for 87.1% of all women with births.
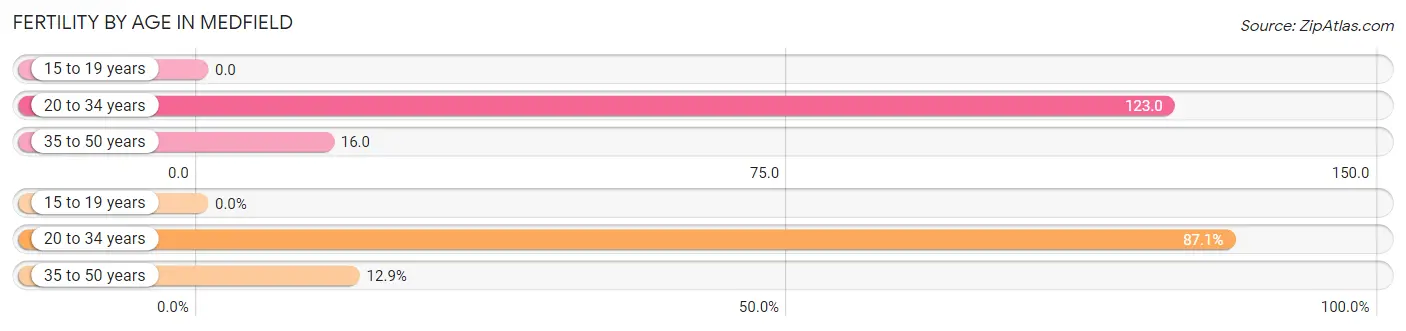
| Age Bracket | Women with Births | Births / 1,000 Women |
| 15 to 19 years | 0 (0.0%) | 0.0 |
| 20 to 34 years | 61 (87.1%) | 123.0 |
| 35 to 50 years | 9 (12.9%) | 16.0 |
| Total | 70 (100.0%) | 62.0 |
Fertility by Age by Marriage Status in Medfield
84.3% of women with births (70) in Medfield are married. The highest percentage of unmarried women with births falls into 20 to 34 years age bracket with 18.0% of them unmarried at the time of birth, while the lowest percentage of unmarried women with births belong to 35 to 50 years age bracket with 0.0% of them unmarried.
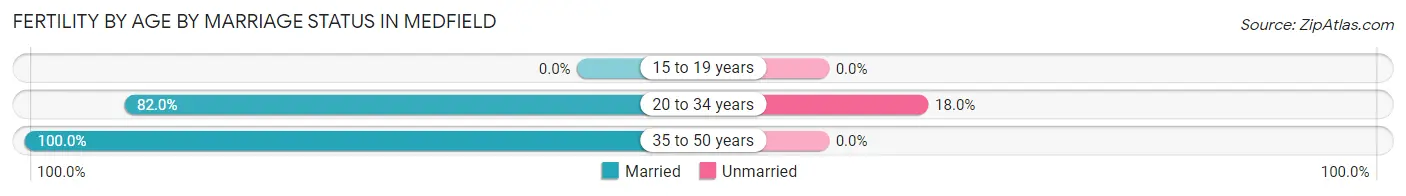
| Age Bracket | Married | Unmarried |
| 15 to 19 years | 0 (0.0%) | 0 (0.0%) |
| 20 to 34 years | 50 (82.0%) | 11 (18.0%) |
| 35 to 50 years | 9 (100.0%) | 0 (0.0%) |
| Total | 59 (84.3%) | 11 (15.7%) |
Fertility by Education in Medfield
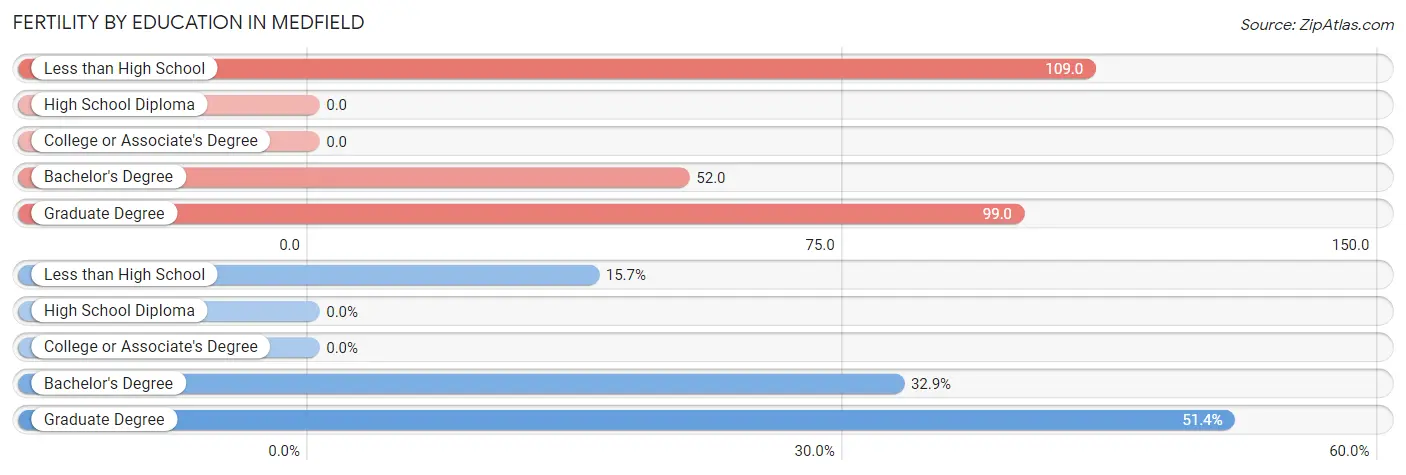
| Educational Attainment | Women with Births | Births / 1,000 Women |
| Less than High School | 11 (15.7%) | 109.0 |
| High School Diploma | 0 (0.0%) | 0.0 |
| College or Associate's Degree | 0 (0.0%) | 0.0 |
| Bachelor's Degree | 23 (32.9%) | 52.0 |
| Graduate Degree | 36 (51.4%) | 99.0 |
| Total | 70 (100.0%) | 62.0 |
Fertility by Education by Marriage Status in Medfield
15.7% of women with births in Medfield are unmarried. Women with the educational attainment of bachelor's degree are most likely to be married with 100.0% of them married at childbirth, while women with the educational attainment of less than high school are least likely to be married with 100.0% of them unmarried at childbirth.
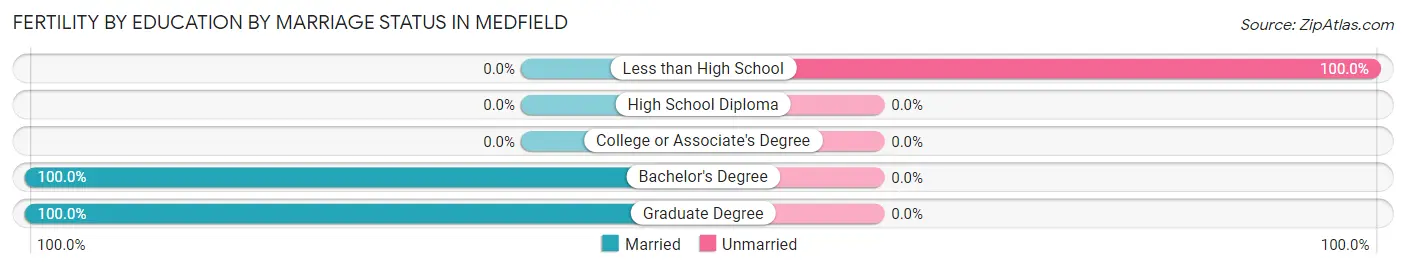
| Educational Attainment | Married | Unmarried |
| Less than High School | 0 (0.0%) | 11 (100.0%) |
| High School Diploma | 0 (0.0%) | 0 (0.0%) |
| College or Associate's Degree | 0 (0.0%) | 0 (0.0%) |
| Bachelor's Degree | 23 (100.0%) | 0 (0.0%) |
| Graduate Degree | 36 (100.0%) | 0 (0.0%) |
| Total | 59 (84.3%) | 11 (15.7%) |
Employment Characteristics in Medfield
Employment by Class of Employer in Medfield
Among the 3,248 employed individuals in Medfield, private company employees (2,193 | 67.5%), not-for-profit organizations (339 | 10.4%), and self-employed (not incorporated) (270 | 8.3%) make up the most common classes of employment.
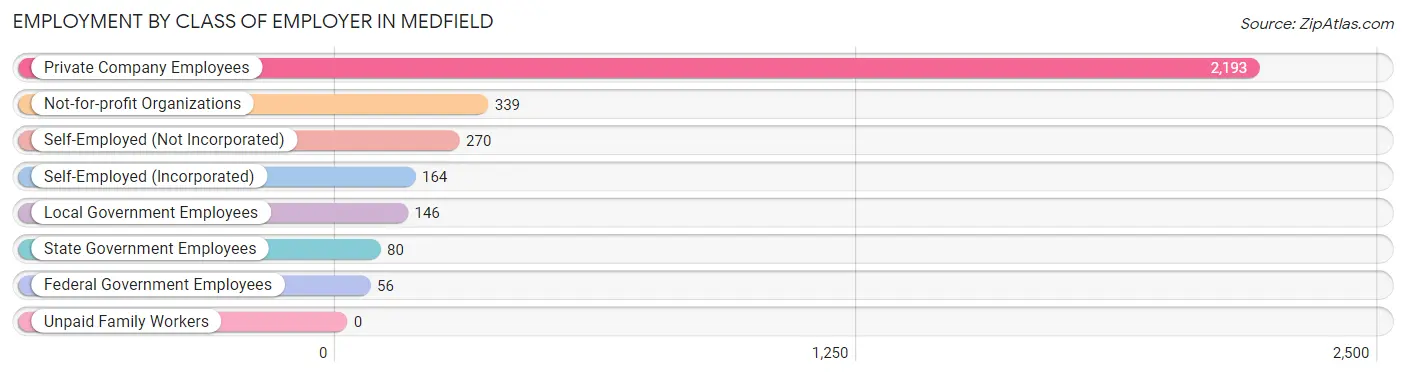
| Employer Class | # Employees | % Employees |
| Private Company Employees | 2,193 | 67.5% |
| Self-Employed (Incorporated) | 164 | 5.1% |
| Self-Employed (Not Incorporated) | 270 | 8.3% |
| Not-for-profit Organizations | 339 | 10.4% |
| Local Government Employees | 146 | 4.5% |
| State Government Employees | 80 | 2.5% |
| Federal Government Employees | 56 | 1.7% |
| Unpaid Family Workers | 0 | 0.0% |
| Total | 3,248 | 100.0% |
Employment Status by Age in Medfield
According to the labor force statistics for Medfield, out of the total population over 16 years of age (5,009), 69.1% or 3,461 individuals are in the labor force, with 5.5% or 190 of them unemployed. The age group with the highest labor force participation rate is 25 to 29 years, with 91.7% or 255 individuals in the labor force. Within the labor force, the 75 years and over age range has the highest percentage of unemployed individuals, with 12.4% or 11 of them being unemployed.
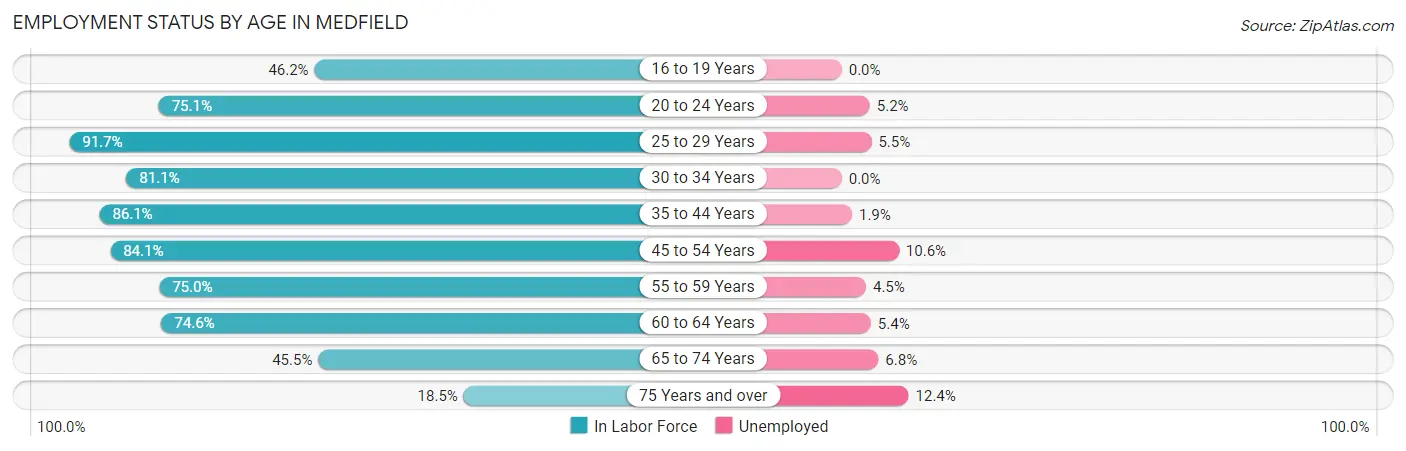
| Age Bracket | In Labor Force | Unemployed |
| 16 to 19 Years | 78 (46.2%) | 0 (0.0%) |
| 20 to 24 Years | 268 (75.1%) | 14 (5.2%) |
| 25 to 29 Years | 255 (91.7%) | 14 (5.5%) |
| 30 to 34 Years | 227 (81.1%) | 0 (0.0%) |
| 35 to 44 Years | 582 (86.1%) | 11 (1.9%) |
| 45 to 54 Years | 671 (84.1%) | 71 (10.6%) |
| 55 to 59 Years | 509 (75.0%) | 23 (4.5%) |
| 60 to 64 Years | 503 (74.6%) | 27 (5.4%) |
| 65 to 74 Years | 280 (45.5%) | 19 (6.8%) |
| 75 Years and over | 89 (18.5%) | 11 (12.4%) |
| Total | 3,461 (69.1%) | 190 (5.5%) |
Employment Status by Educational Attainment in Medfield
According to labor force statistics for Medfield, 81.2% of individuals (2,749) out of the total population between 25 and 64 years of age (3,385) are in the labor force, with 5.3% or 146 of them being unemployed. The group with the highest labor force participation rate are those with the educational attainment of bachelor's degree or higher, with 84.0% or 2,124 individuals in the labor force. Within the labor force, individuals with less than high school education have the highest percentage of unemployment, with 95.2% or 59 of them being unemployed.
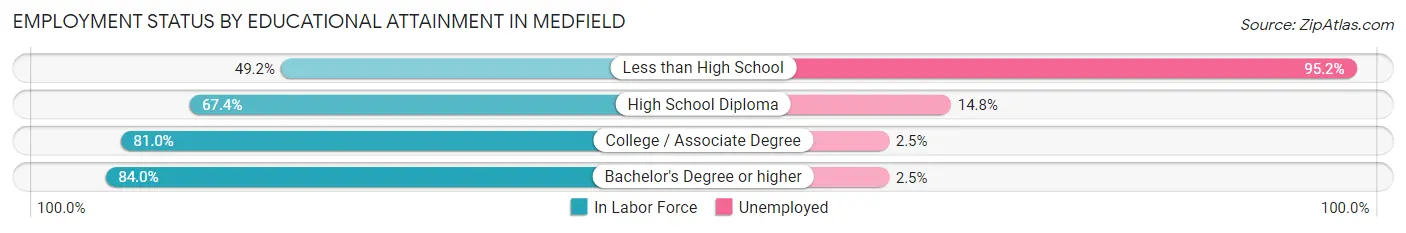
| Educational Attainment | In Labor Force | Unemployed |
| Less than High School | 62 (49.2%) | 120 (95.2%) |
| High School Diploma | 155 (67.4%) | 34 (14.8%) |
| College / Associate Degree | 406 (81.0%) | 13 (2.5%) |
| Bachelor's Degree or higher | 2,124 (84.0%) | 63 (2.5%) |
| Total | 2,749 (81.2%) | 179 (5.3%) |
Employment Occupations by Sex in Medfield
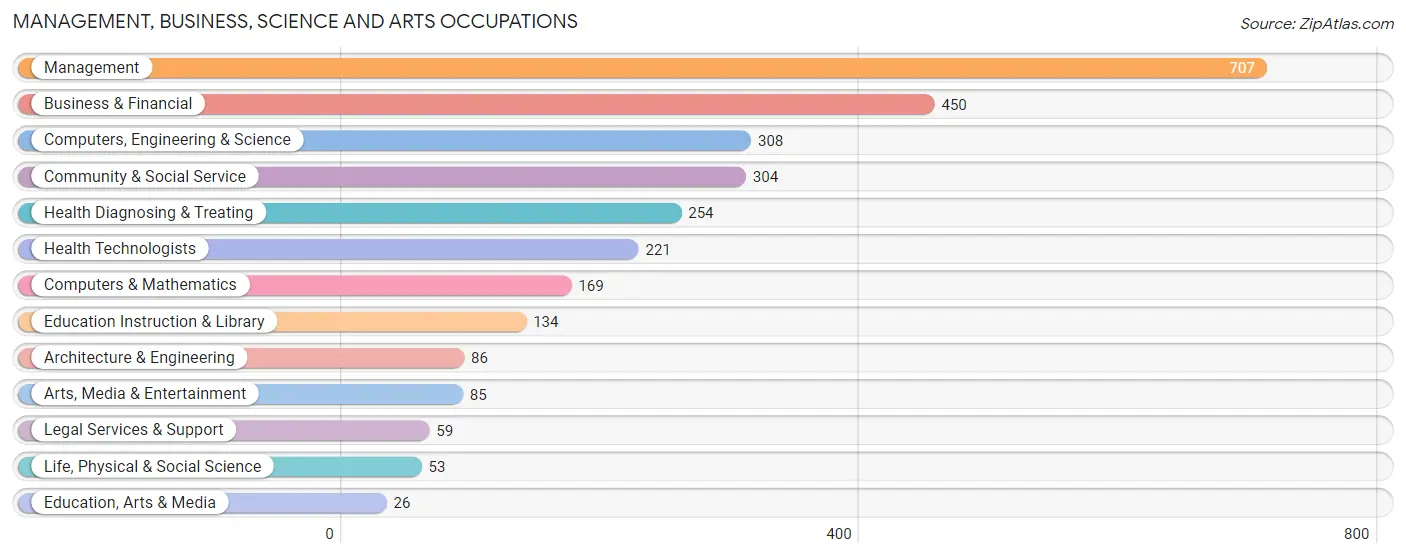
Management, Business, Science and Arts Occupations
The most common Management, Business, Science and Arts occupations in Medfield are Management (707 | 21.6%), Business & Financial (450 | 13.8%), Computers, Engineering & Science (308 | 9.4%), Community & Social Service (304 | 9.3%), and Health Diagnosing & Treating (254 | 7.8%).
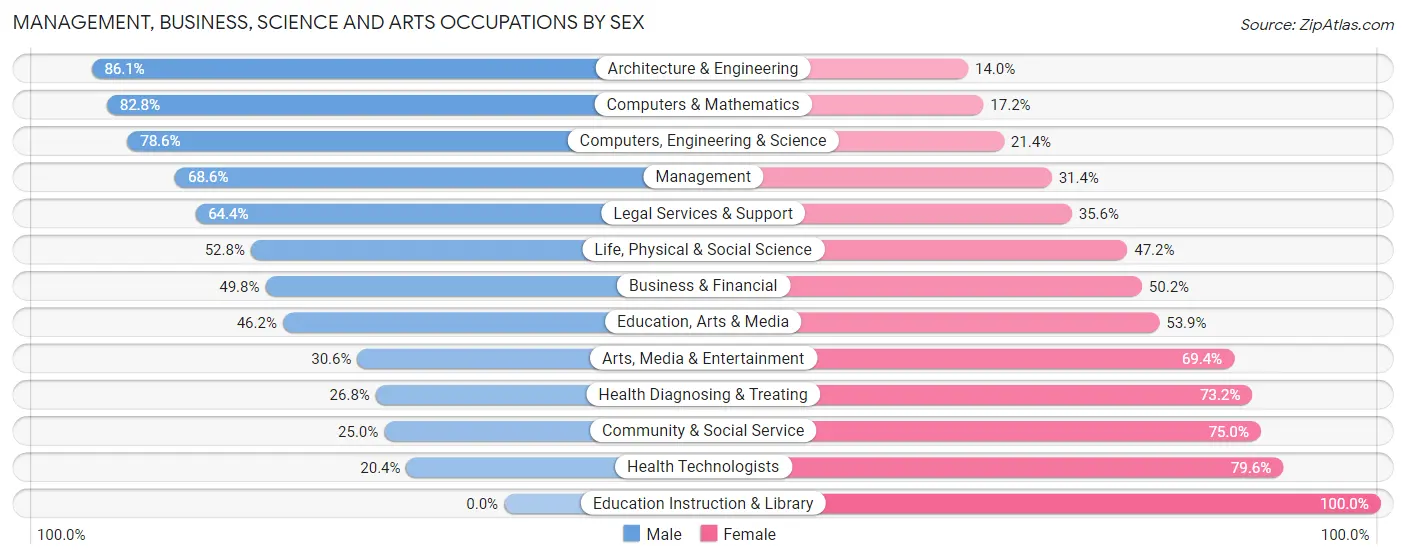
Management, Business, Science and Arts Occupations by Sex
Within the Management, Business, Science and Arts occupations in Medfield, the most male-oriented occupations are Architecture & Engineering (86.1%), Computers & Mathematics (82.8%), and Computers, Engineering & Science (78.6%), while the most female-oriented occupations are Education Instruction & Library (100.0%), Health Technologists (79.6%), and Community & Social Service (75.0%).
| Occupation | Male | Female |
| Management | 485 (68.6%) | 222 (31.4%) |
| Business & Financial | 224 (49.8%) | 226 (50.2%) |
| Computers, Engineering & Science | 242 (78.6%) | 66 (21.4%) |
| Computers & Mathematics | 140 (82.8%) | 29 (17.2%) |
| Architecture & Engineering | 74 (86.1%) | 12 (14.0%) |
| Life, Physical & Social Science | 28 (52.8%) | 25 (47.2%) |
| Community & Social Service | 76 (25.0%) | 228 (75.0%) |
| Education, Arts & Media | 12 (46.2%) | 14 (53.8%) |
| Legal Services & Support | 38 (64.4%) | 21 (35.6%) |
| Education Instruction & Library | 0 (0.0%) | 134 (100.0%) |
| Arts, Media & Entertainment | 26 (30.6%) | 59 (69.4%) |
| Health Diagnosing & Treating | 68 (26.8%) | 186 (73.2%) |
| Health Technologists | 45 (20.4%) | 176 (79.6%) |
| Total (Category) | 1,095 (54.1%) | 928 (45.9%) |
| Total (Overall) | 1,663 (50.8%) | 1,609 (49.2%) |
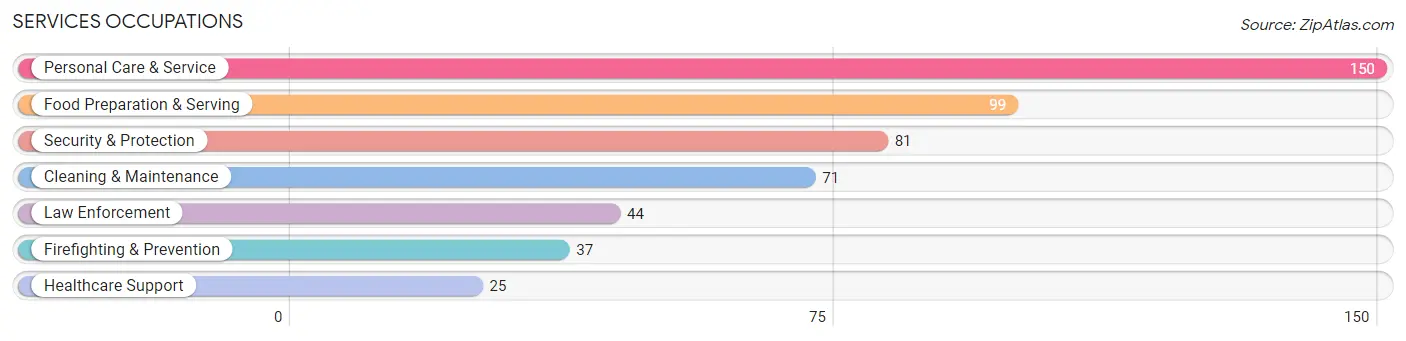
Services Occupations
The most common Services occupations in Medfield are Personal Care & Service (150 | 4.6%), Food Preparation & Serving (99 | 3.0%), Security & Protection (81 | 2.5%), Cleaning & Maintenance (71 | 2.2%), and Law Enforcement (44 | 1.3%).
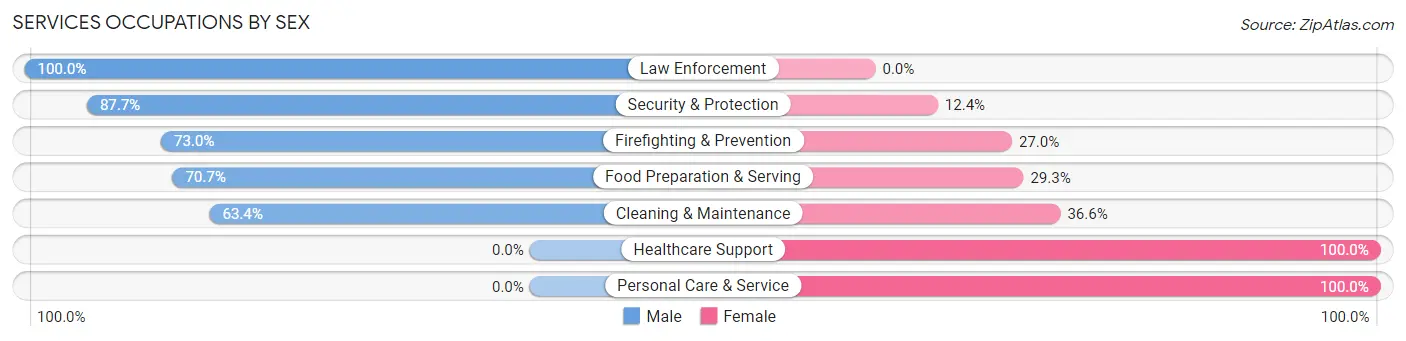
Services Occupations by Sex
Within the Services occupations in Medfield, the most male-oriented occupations are Law Enforcement (100.0%), Security & Protection (87.6%), and Firefighting & Prevention (73.0%), while the most female-oriented occupations are Healthcare Support (100.0%), Personal Care & Service (100.0%), and Cleaning & Maintenance (36.6%).
| Occupation | Male | Female |
| Healthcare Support | 0 (0.0%) | 25 (100.0%) |
| Security & Protection | 71 (87.6%) | 10 (12.3%) |
| Firefighting & Prevention | 27 (73.0%) | 10 (27.0%) |
| Law Enforcement | 44 (100.0%) | 0 (0.0%) |
| Food Preparation & Serving | 70 (70.7%) | 29 (29.3%) |
| Cleaning & Maintenance | 45 (63.4%) | 26 (36.6%) |
| Personal Care & Service | 0 (0.0%) | 150 (100.0%) |
| Total (Category) | 186 (43.7%) | 240 (56.3%) |
| Total (Overall) | 1,663 (50.8%) | 1,609 (49.2%) |
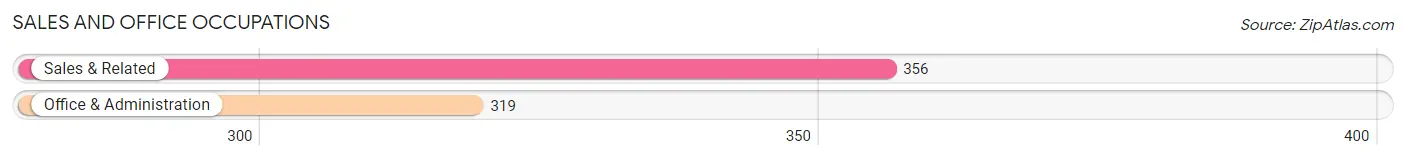
Sales and Office Occupations
The most common Sales and Office occupations in Medfield are Sales & Related (356 | 10.9%), and Office & Administration (319 | 9.8%).
Sales and Office Occupations by Sex
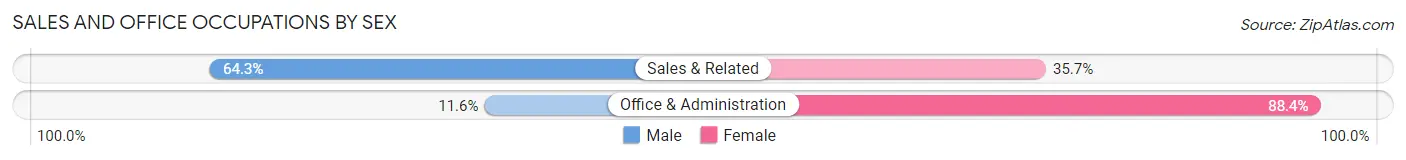
| Occupation | Male | Female |
| Sales & Related | 229 (64.3%) | 127 (35.7%) |
| Office & Administration | 37 (11.6%) | 282 (88.4%) |
| Total (Category) | 266 (39.4%) | 409 (60.6%) |
| Total (Overall) | 1,663 (50.8%) | 1,609 (49.2%) |
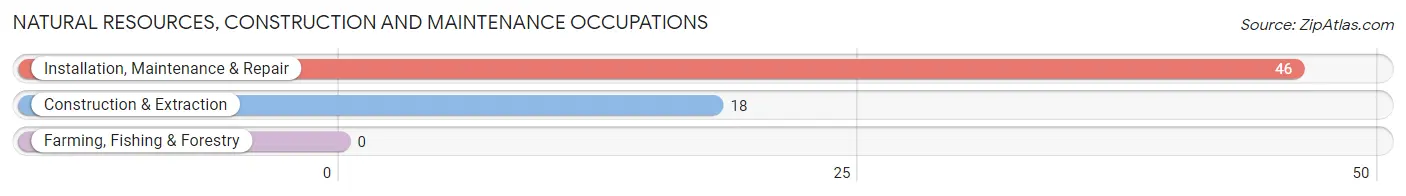
Natural Resources, Construction and Maintenance Occupations
The most common Natural Resources, Construction and Maintenance occupations in Medfield are Installation, Maintenance & Repair (46 | 1.4%), and Construction & Extraction (18 | 0.5%).
Natural Resources, Construction and Maintenance Occupations by Sex
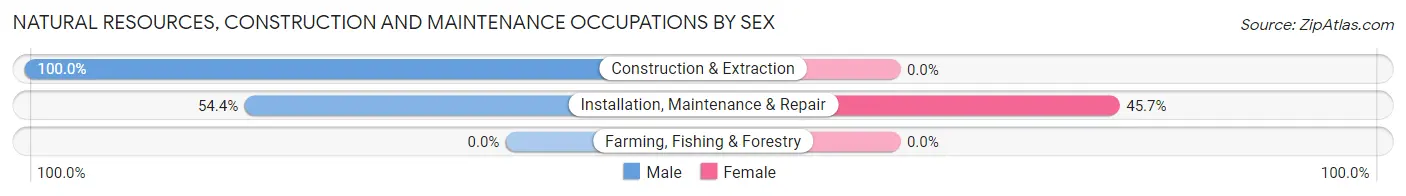
| Occupation | Male | Female |
| Farming, Fishing & Forestry | 0 (0.0%) | 0 (0.0%) |
| Construction & Extraction | 18 (100.0%) | 0 (0.0%) |
| Installation, Maintenance & Repair | 25 (54.3%) | 21 (45.7%) |
| Total (Category) | 43 (67.2%) | 21 (32.8%) |
| Total (Overall) | 1,663 (50.8%) | 1,609 (49.2%) |
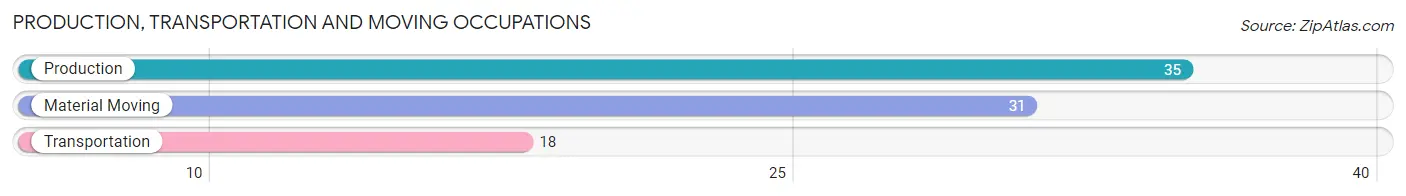
Production, Transportation and Moving Occupations
The most common Production, Transportation and Moving occupations in Medfield are Production (35 | 1.1%), Material Moving (31 | 0.9%), and Transportation (18 | 0.5%).
Production, Transportation and Moving Occupations by Sex
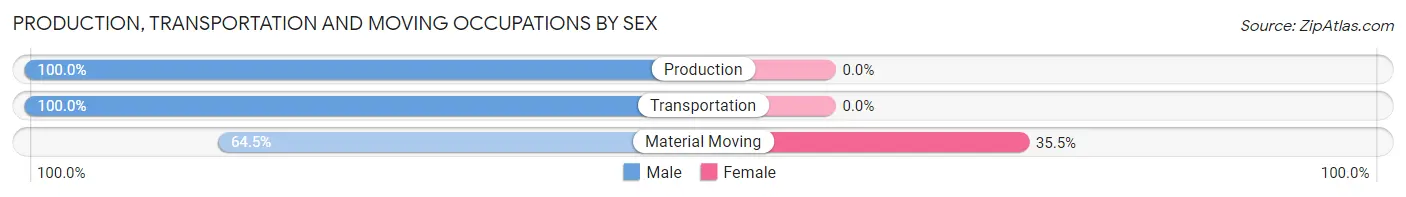
| Occupation | Male | Female |
| Production | 35 (100.0%) | 0 (0.0%) |
| Transportation | 18 (100.0%) | 0 (0.0%) |
| Material Moving | 20 (64.5%) | 11 (35.5%) |
| Total (Category) | 73 (86.9%) | 11 (13.1%) |
| Total (Overall) | 1,663 (50.8%) | 1,609 (49.2%) |
Employment Industries by Sex in Medfield
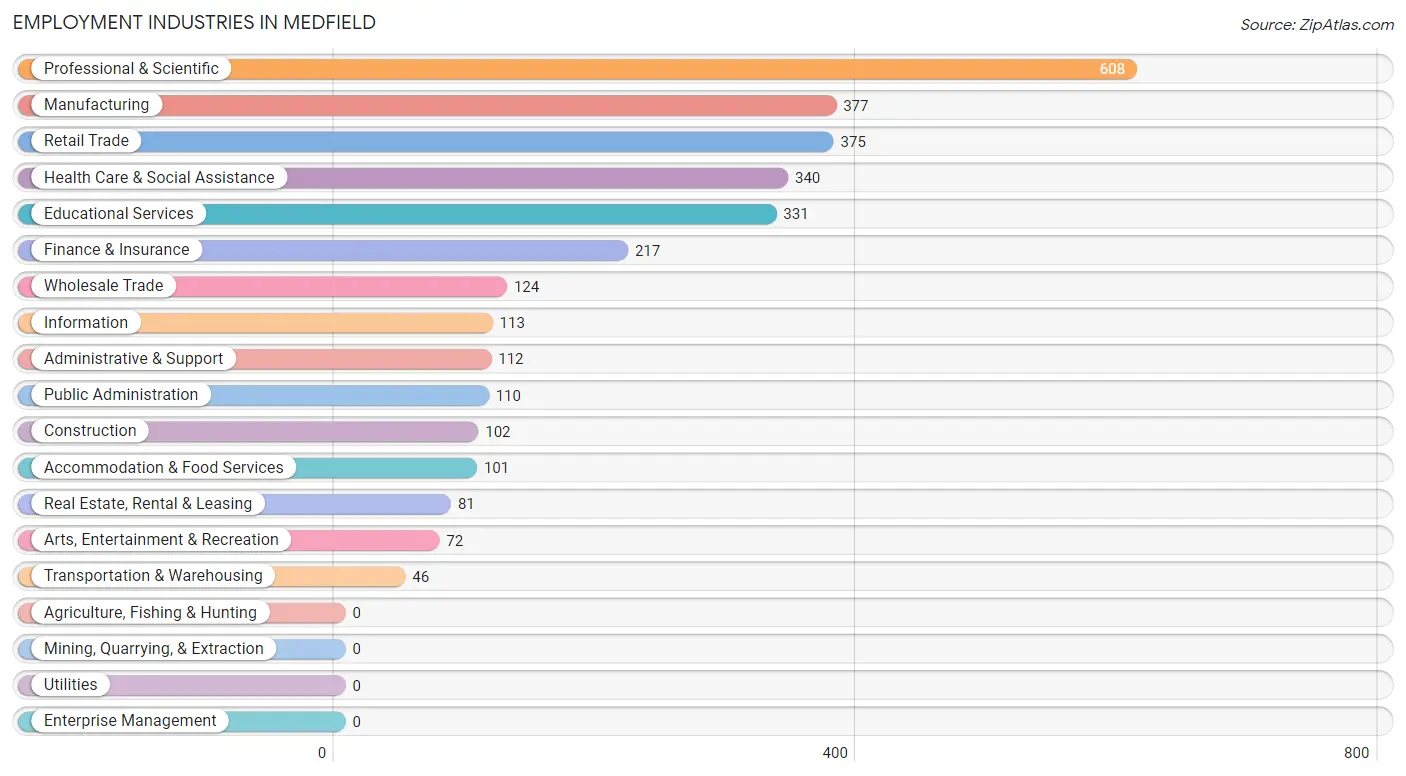
Employment Industries in Medfield
The major employment industries in Medfield include Professional & Scientific (608 | 18.6%), Manufacturing (377 | 11.5%), Retail Trade (375 | 11.5%), Health Care & Social Assistance (340 | 10.4%), and Educational Services (331 | 10.1%).
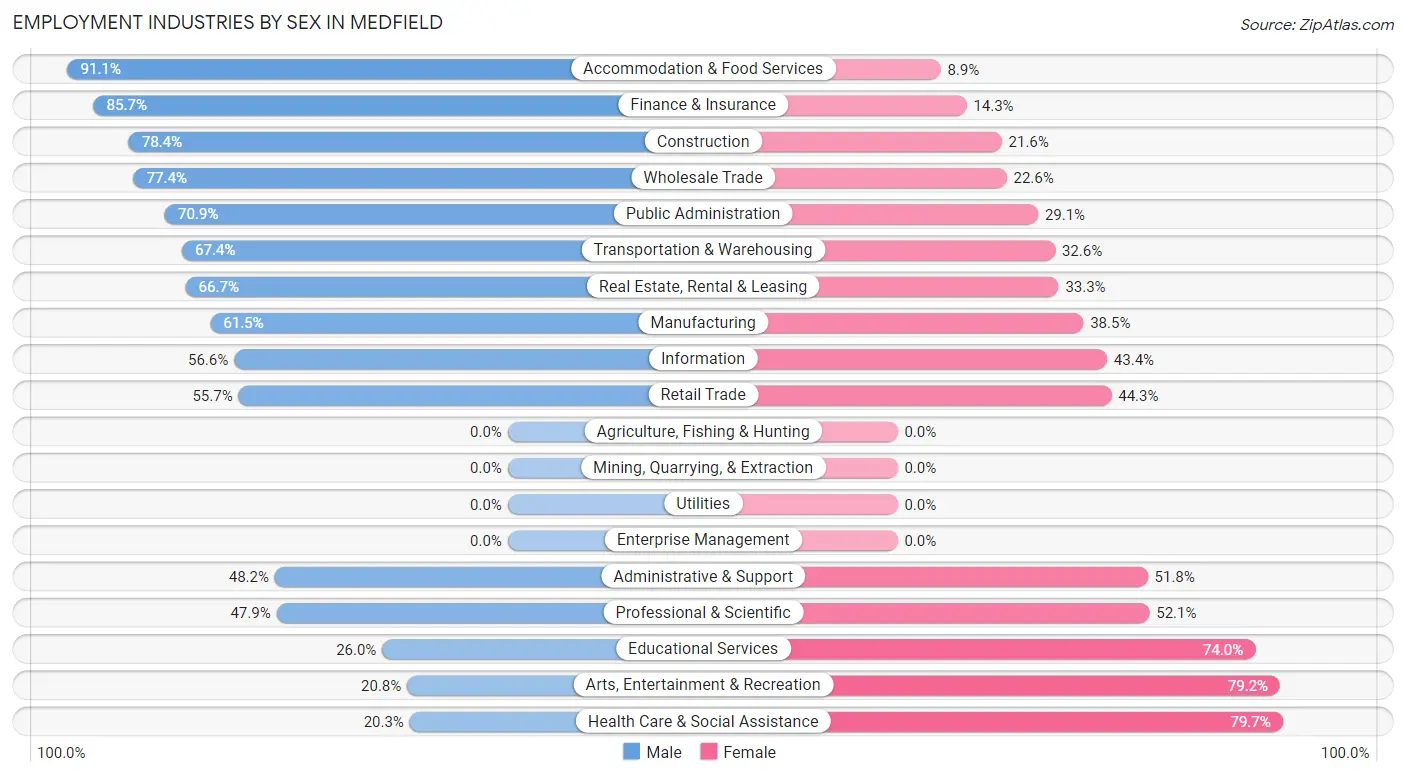
Employment Industries by Sex in Medfield
The Medfield industries that see more men than women are Accommodation & Food Services (91.1%), Finance & Insurance (85.7%), and Construction (78.4%), whereas the industries that tend to have a higher number of women are Health Care & Social Assistance (79.7%), Arts, Entertainment & Recreation (79.2%), and Educational Services (74.0%).
| Industry | Male | Female |
| Agriculture, Fishing & Hunting | 0 (0.0%) | 0 (0.0%) |
| Mining, Quarrying, & Extraction | 0 (0.0%) | 0 (0.0%) |
| Construction | 80 (78.4%) | 22 (21.6%) |
| Manufacturing | 232 (61.5%) | 145 (38.5%) |
| Wholesale Trade | 96 (77.4%) | 28 (22.6%) |
| Retail Trade | 209 (55.7%) | 166 (44.3%) |
| Transportation & Warehousing | 31 (67.4%) | 15 (32.6%) |
| Utilities | 0 (0.0%) | 0 (0.0%) |
| Information | 64 (56.6%) | 49 (43.4%) |
| Finance & Insurance | 186 (85.7%) | 31 (14.3%) |
| Real Estate, Rental & Leasing | 54 (66.7%) | 27 (33.3%) |
| Professional & Scientific | 291 (47.9%) | 317 (52.1%) |
| Enterprise Management | 0 (0.0%) | 0 (0.0%) |
| Administrative & Support | 54 (48.2%) | 58 (51.8%) |
| Educational Services | 86 (26.0%) | 245 (74.0%) |
| Health Care & Social Assistance | 69 (20.3%) | 271 (79.7%) |
| Arts, Entertainment & Recreation | 15 (20.8%) | 57 (79.2%) |
| Accommodation & Food Services | 92 (91.1%) | 9 (8.9%) |
| Public Administration | 78 (70.9%) | 32 (29.1%) |
| Total | 1,663 (50.8%) | 1,609 (49.2%) |
Education in Medfield
School Enrollment in Medfield
The most common levels of schooling among the 1,275 students in Medfield are middle school (396 | 31.1%), elementary school (266 | 20.9%), and high school (251 | 19.7%).
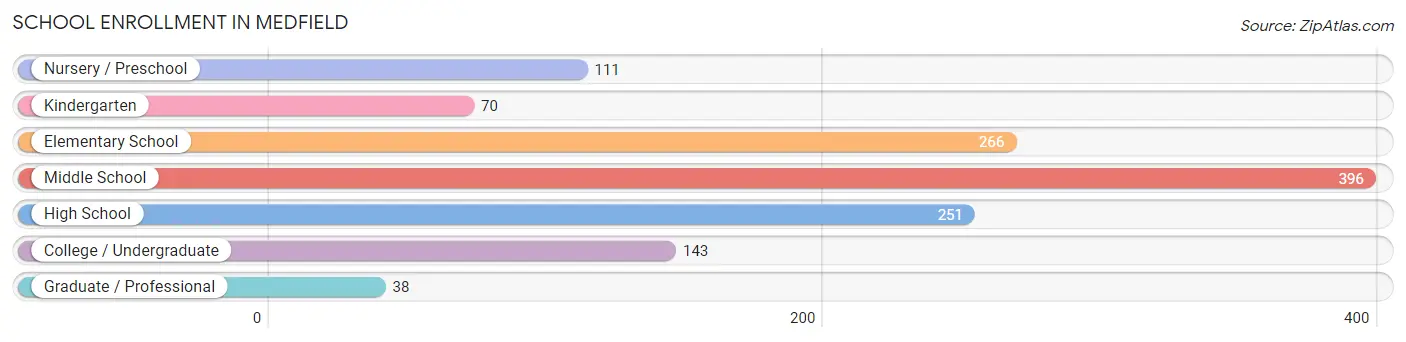
| School Level | # Students | % Students |
| Nursery / Preschool | 111 | 8.7% |
| Kindergarten | 70 | 5.5% |
| Elementary School | 266 | 20.9% |
| Middle School | 396 | 31.1% |
| High School | 251 | 19.7% |
| College / Undergraduate | 143 | 11.2% |
| Graduate / Professional | 38 | 3.0% |
| Total | 1,275 | 100.0% |
School Enrollment by Age by Funding Source in Medfield
Out of a total of 1,275 students who are enrolled in schools in Medfield, 228 (17.9%) attend a private institution, while the remaining 1,047 (82.1%) are enrolled in public schools. The age group of 25 to 34 year olds has the highest likelihood of being enrolled in private schools, with 24 (100.0% in the age bracket) enrolled. Conversely, the age group of 5 to 9 year old has the lowest likelihood of being enrolled in a private school, with 283 (100.0% in the age bracket) attending a public institution.
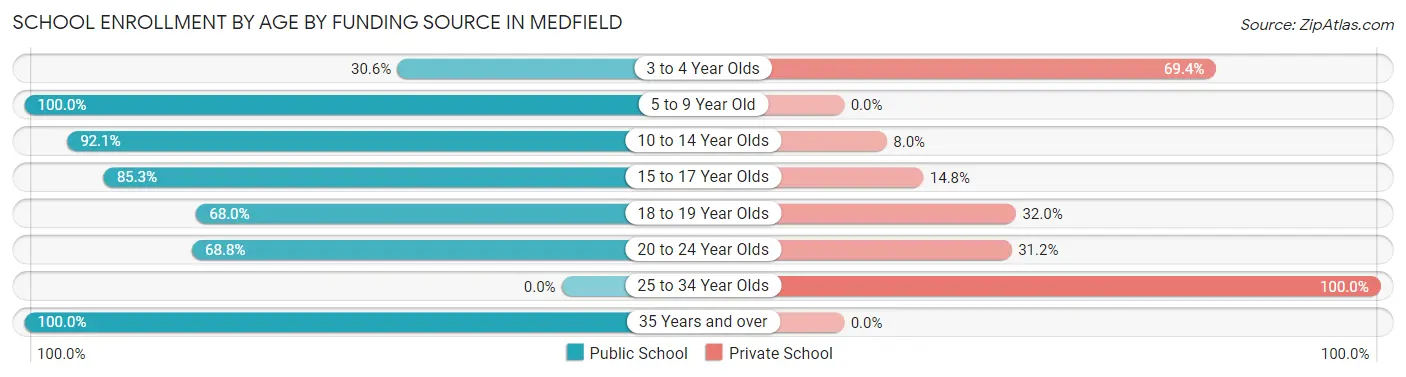
| Age Bracket | Public School | Private School |
| 3 to 4 Year Olds | 34 (30.6%) | 77 (69.4%) |
| 5 to 9 Year Old | 283 (100.0%) | 0 (0.0%) |
| 10 to 14 Year Olds | 475 (92.0%) | 41 (8.0%) |
| 15 to 17 Year Olds | 104 (85.3%) | 18 (14.7%) |
| 18 to 19 Year Olds | 51 (68.0%) | 24 (32.0%) |
| 20 to 24 Year Olds | 97 (68.8%) | 44 (31.2%) |
| 25 to 34 Year Olds | 0 (0.0%) | 24 (100.0%) |
| 35 Years and over | 3 (100.0%) | 0 (0.0%) |
| Total | 1,047 (82.1%) | 228 (17.9%) |
Educational Attainment by Field of Study in Medfield
Business (819 | 22.7%), social sciences (451 | 12.5%), engineering (319 | 8.8%), science & technology (317 | 8.8%), and education (284 | 7.9%) are the most common fields of study among 3,607 individuals in Medfield who have obtained a bachelor's degree or higher.
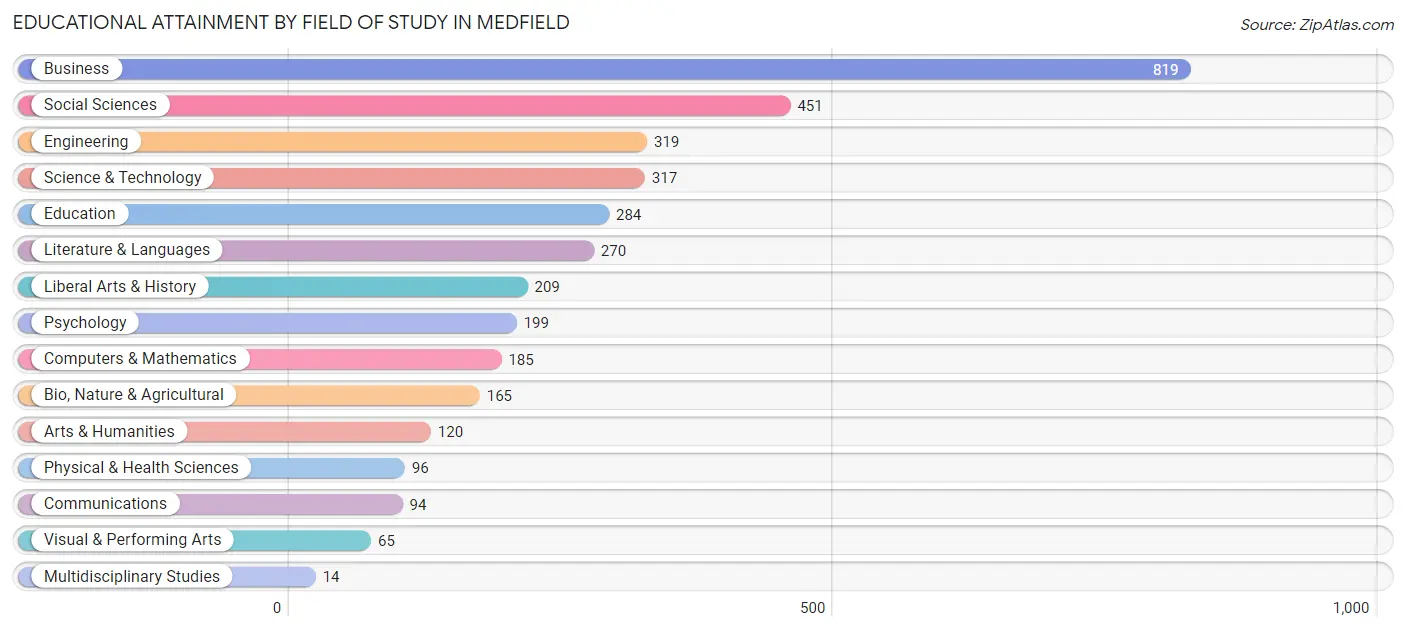
| Field of Study | # Graduates | % Graduates |
| Computers & Mathematics | 185 | 5.1% |
| Bio, Nature & Agricultural | 165 | 4.6% |
| Physical & Health Sciences | 96 | 2.7% |
| Psychology | 199 | 5.5% |
| Social Sciences | 451 | 12.5% |
| Engineering | 319 | 8.8% |
| Multidisciplinary Studies | 14 | 0.4% |
| Science & Technology | 317 | 8.8% |
| Business | 819 | 22.7% |
| Education | 284 | 7.9% |
| Literature & Languages | 270 | 7.5% |
| Liberal Arts & History | 209 | 5.8% |
| Visual & Performing Arts | 65 | 1.8% |
| Communications | 94 | 2.6% |
| Arts & Humanities | 120 | 3.3% |
| Total | 3,607 | 100.0% |
Transportation & Commute in Medfield
Vehicle Availability by Sex in Medfield
The most prevalent vehicle ownership categories in Medfield are males with 2 vehicles (992, accounting for 59.7%) and females with 2 vehicles (781, making up 62.6%).
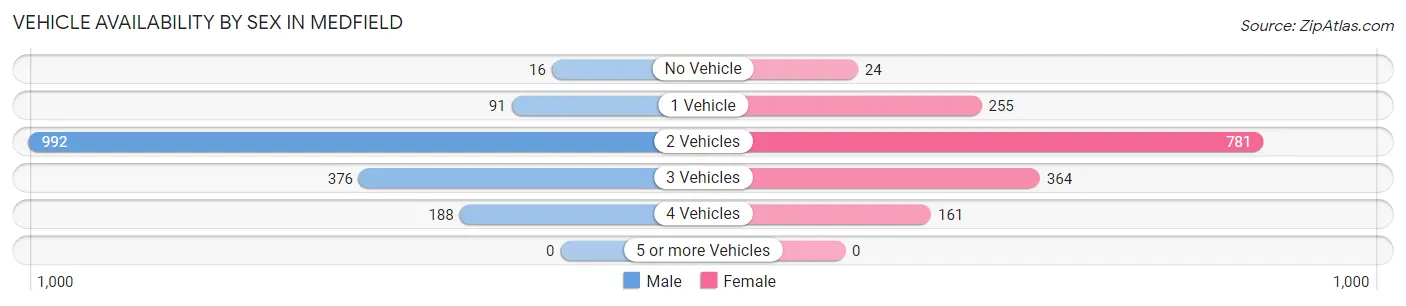
| Vehicles Available | Male | Female |
| No Vehicle | 16 (1.0%) | 24 (1.5%) |
| 1 Vehicle | 91 (5.5%) | 255 (16.1%) |
| 2 Vehicles | 992 (59.7%) | 781 (49.3%) |
| 3 Vehicles | 376 (22.6%) | 364 (23.0%) |
| 4 Vehicles | 188 (11.3%) | 161 (10.2%) |
| 5 or more Vehicles | 0 (0.0%) | 0 (0.0%) |
| Total | 1,663 (100.0%) | 1,585 (100.0%) |
Commute Time in Medfield
The most frequently occuring commute durations in Medfield are 45 to 59 minutes (430 commuters, 19.8%), 60 to 89 minutes (389 commuters, 17.9%), and 30 to 34 minutes (297 commuters, 13.7%).
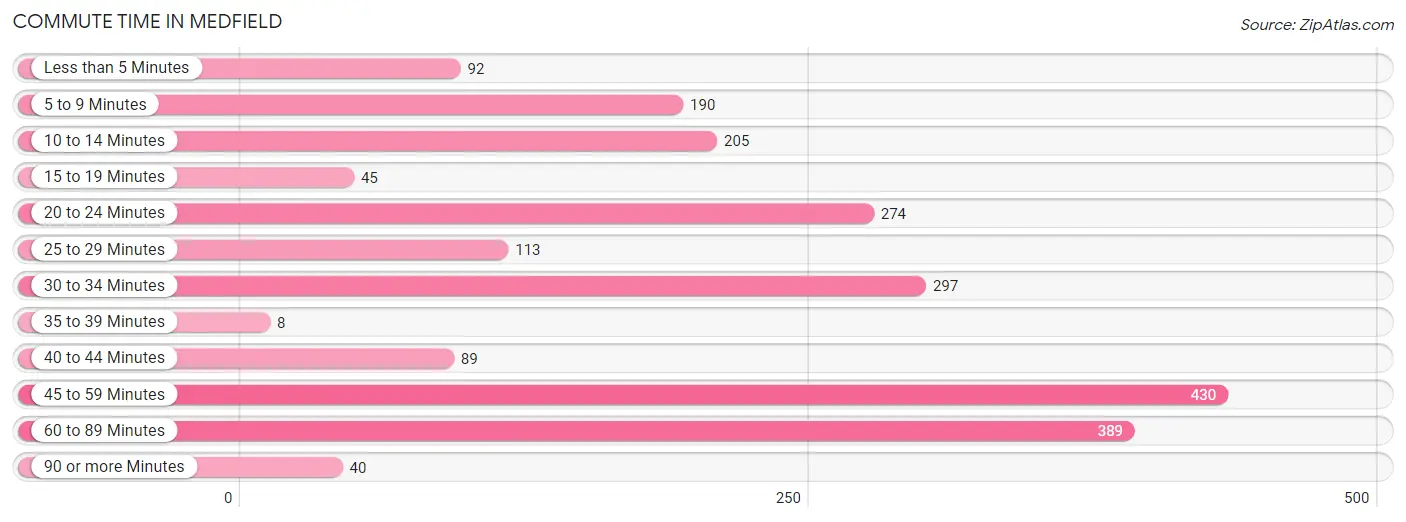
| Commute Time | # Commuters | % Commuters |
| Less than 5 Minutes | 92 | 4.2% |
| 5 to 9 Minutes | 190 | 8.7% |
| 10 to 14 Minutes | 205 | 9.4% |
| 15 to 19 Minutes | 45 | 2.1% |
| 20 to 24 Minutes | 274 | 12.6% |
| 25 to 29 Minutes | 113 | 5.2% |
| 30 to 34 Minutes | 297 | 13.7% |
| 35 to 39 Minutes | 8 | 0.4% |
| 40 to 44 Minutes | 89 | 4.1% |
| 45 to 59 Minutes | 430 | 19.8% |
| 60 to 89 Minutes | 389 | 17.9% |
| 90 or more Minutes | 40 | 1.8% |
Commute Time by Sex in Medfield
The most common commute times in Medfield are 60 to 89 minutes (285 commuters, 27.4%) for males and 20 to 24 minutes (182 commuters, 16.1%) for females.
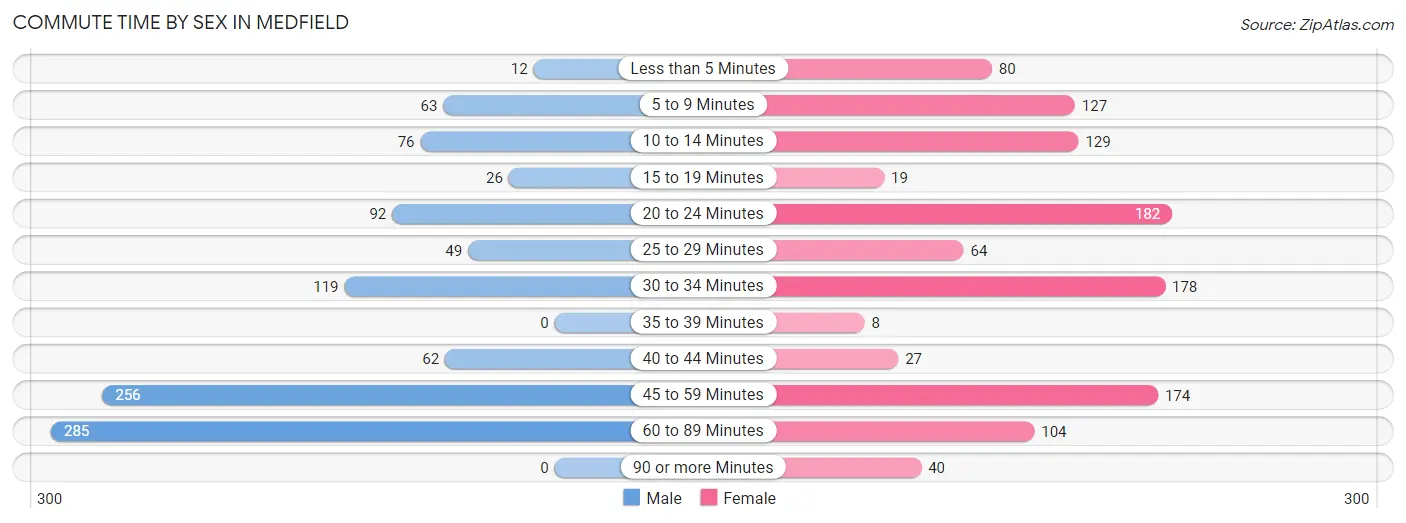
| Commute Time | Male | Female |
| Less than 5 Minutes | 12 (1.1%) | 80 (7.1%) |
| 5 to 9 Minutes | 63 (6.1%) | 127 (11.2%) |
| 10 to 14 Minutes | 76 (7.3%) | 129 (11.4%) |
| 15 to 19 Minutes | 26 (2.5%) | 19 (1.7%) |
| 20 to 24 Minutes | 92 (8.8%) | 182 (16.1%) |
| 25 to 29 Minutes | 49 (4.7%) | 64 (5.7%) |
| 30 to 34 Minutes | 119 (11.4%) | 178 (15.7%) |
| 35 to 39 Minutes | 0 (0.0%) | 8 (0.7%) |
| 40 to 44 Minutes | 62 (6.0%) | 27 (2.4%) |
| 45 to 59 Minutes | 256 (24.6%) | 174 (15.4%) |
| 60 to 89 Minutes | 285 (27.4%) | 104 (9.2%) |
| 90 or more Minutes | 0 (0.0%) | 40 (3.5%) |
Time of Departure to Work by Sex in Medfield
The most frequent times of departure to work in Medfield are 7:00 AM to 7:29 AM (271, 26.1%) for males and 7:00 AM to 7:29 AM (274, 24.2%) for females.
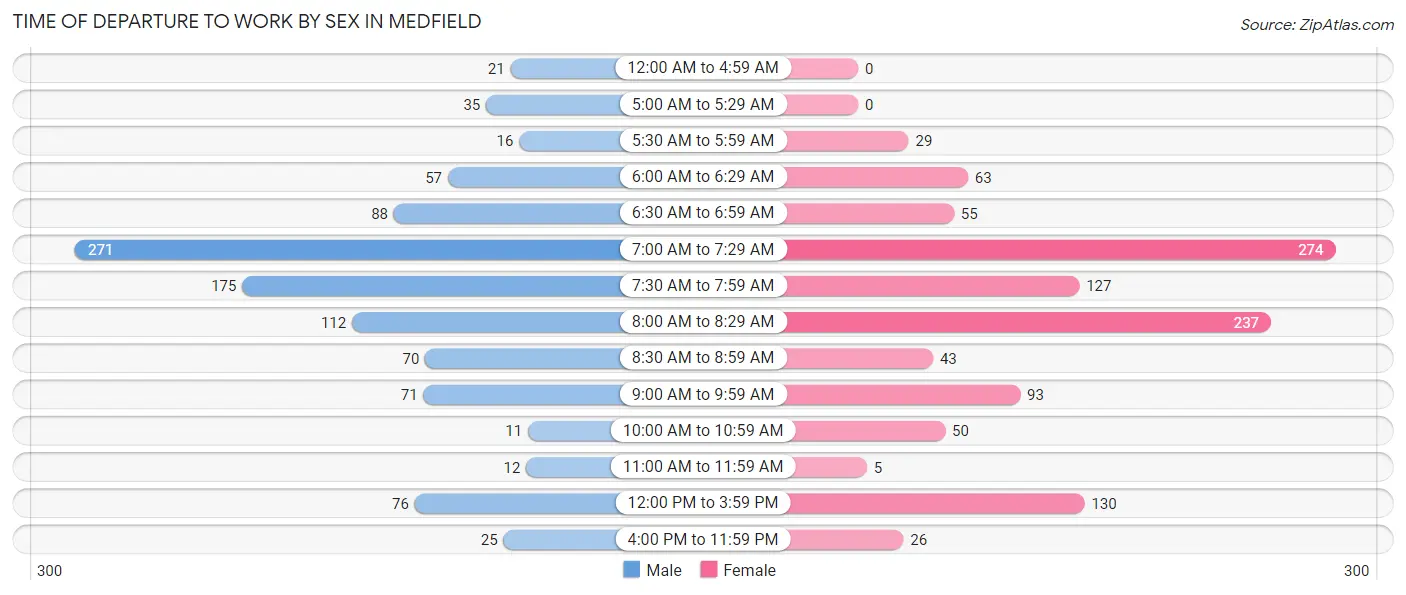
| Time of Departure | Male | Female |
| 12:00 AM to 4:59 AM | 21 (2.0%) | 0 (0.0%) |
| 5:00 AM to 5:29 AM | 35 (3.4%) | 0 (0.0%) |
| 5:30 AM to 5:59 AM | 16 (1.5%) | 29 (2.6%) |
| 6:00 AM to 6:29 AM | 57 (5.5%) | 63 (5.6%) |
| 6:30 AM to 6:59 AM | 88 (8.5%) | 55 (4.9%) |
| 7:00 AM to 7:29 AM | 271 (26.1%) | 274 (24.2%) |
| 7:30 AM to 7:59 AM | 175 (16.8%) | 127 (11.2%) |
| 8:00 AM to 8:29 AM | 112 (10.8%) | 237 (20.9%) |
| 8:30 AM to 8:59 AM | 70 (6.7%) | 43 (3.8%) |
| 9:00 AM to 9:59 AM | 71 (6.8%) | 93 (8.2%) |
| 10:00 AM to 10:59 AM | 11 (1.1%) | 50 (4.4%) |
| 11:00 AM to 11:59 AM | 12 (1.1%) | 5 (0.4%) |
| 12:00 PM to 3:59 PM | 76 (7.3%) | 130 (11.5%) |
| 4:00 PM to 11:59 PM | 25 (2.4%) | 26 (2.3%) |
| Total | 1,040 (100.0%) | 1,132 (100.0%) |
Housing Occupancy in Medfield
Occupancy by Ownership in Medfield
Of the total 2,453 dwellings in Medfield, owner-occupied units account for 2,044 (83.3%), while renter-occupied units make up 409 (16.7%).
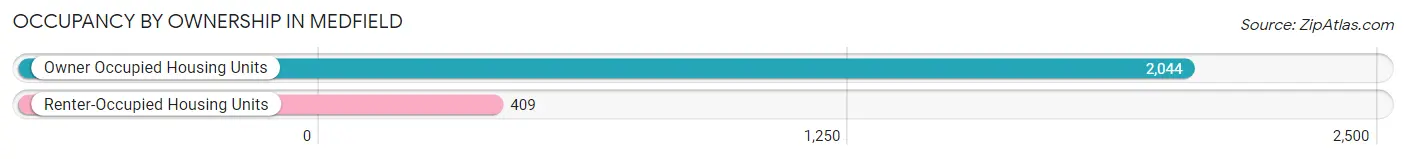
| Occupancy | # Housing Units | % Housing Units |
| Owner Occupied Housing Units | 2,044 | 83.3% |
| Renter-Occupied Housing Units | 409 | 16.7% |
| Total Occupied Housing Units | 2,453 | 100.0% |
Occupancy by Household Size in Medfield
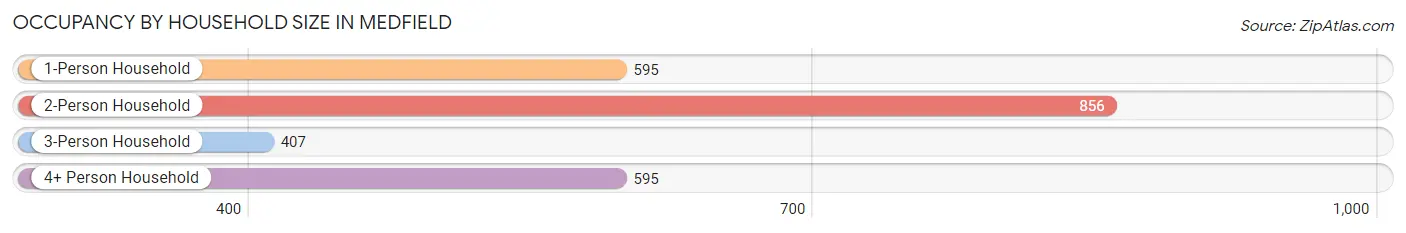
| Household Size | # Housing Units | % Housing Units |
| 1-Person Household | 595 | 24.3% |
| 2-Person Household | 856 | 34.9% |
| 3-Person Household | 407 | 16.6% |
| 4+ Person Household | 595 | 24.3% |
| Total Housing Units | 2,453 | 100.0% |
Occupancy by Ownership by Household Size in Medfield
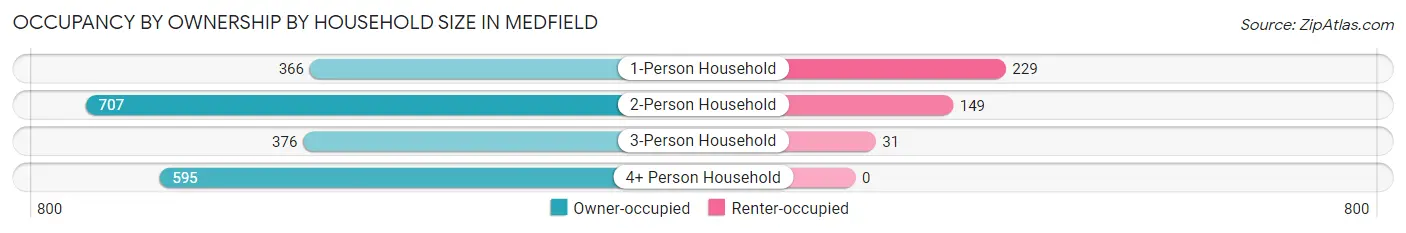
| Household Size | Owner-occupied | Renter-occupied |
| 1-Person Household | 366 (61.5%) | 229 (38.5%) |
| 2-Person Household | 707 (82.6%) | 149 (17.4%) |
| 3-Person Household | 376 (92.4%) | 31 (7.6%) |
| 4+ Person Household | 595 (100.0%) | 0 (0.0%) |
| Total Housing Units | 2,044 (83.3%) | 409 (16.7%) |
Occupancy by Educational Attainment in Medfield
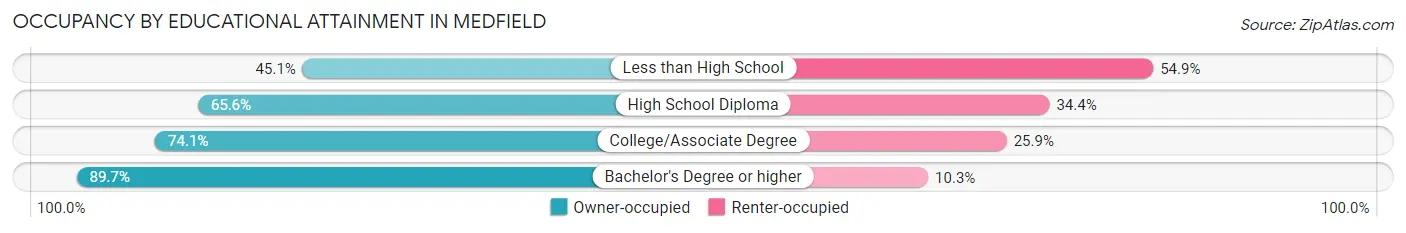
| Household Size | Owner-occupied | Renter-occupied |
| Less than High School | 32 (45.1%) | 39 (54.9%) |
| High School Diploma | 149 (65.6%) | 78 (34.4%) |
| College/Associate Degree | 332 (74.1%) | 116 (25.9%) |
| Bachelor's Degree or higher | 1,531 (89.7%) | 176 (10.3%) |
Occupancy by Age of Householder in Medfield
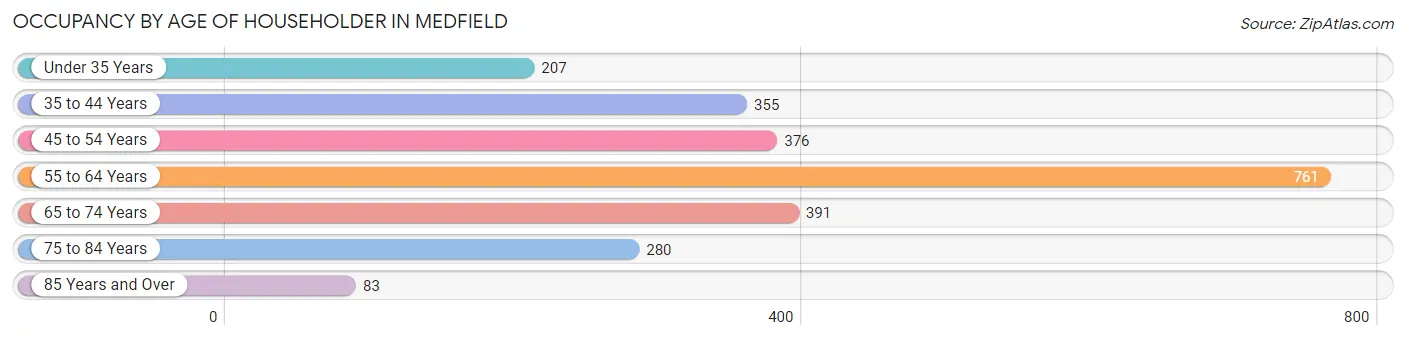
| Age Bracket | # Households | % Households |
| Under 35 Years | 207 | 8.4% |
| 35 to 44 Years | 355 | 14.5% |
| 45 to 54 Years | 376 | 15.3% |
| 55 to 64 Years | 761 | 31.0% |
| 65 to 74 Years | 391 | 15.9% |
| 75 to 84 Years | 280 | 11.4% |
| 85 Years and Over | 83 | 3.4% |
| Total | 2,453 | 100.0% |
Housing Finances in Medfield
Median Income by Occupancy in Medfield
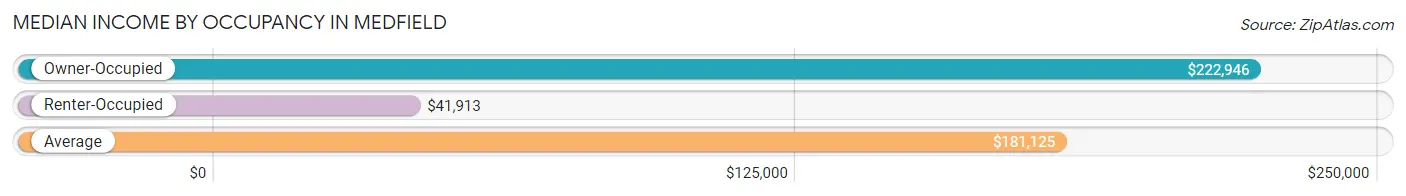
| Occupancy Type | # Households | Median Income |
| Owner-Occupied | 2,044 (83.3%) | $222,946 |
| Renter-Occupied | 409 (16.7%) | $41,913 |
| Average | 2,453 (100.0%) | $181,125 |
Occupancy by Householder Income Bracket in Medfield
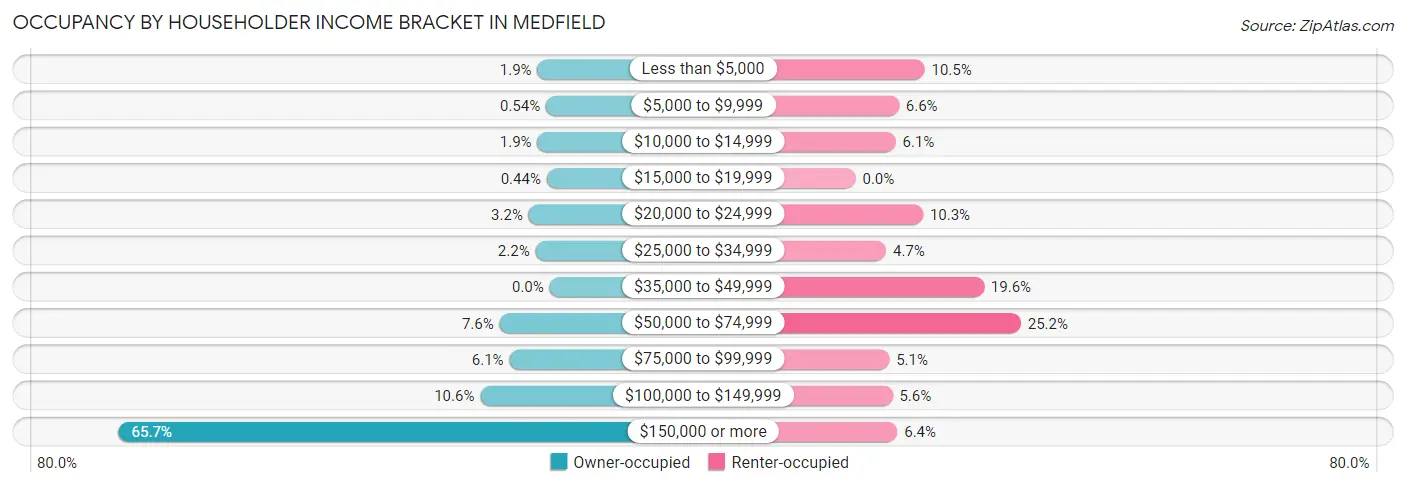
| Income Bracket | Owner-occupied | Renter-occupied |
| Less than $5,000 | 38 (1.9%) | 43 (10.5%) |
| $5,000 to $9,999 | 11 (0.5%) | 27 (6.6%) |
| $10,000 to $14,999 | 38 (1.9%) | 25 (6.1%) |
| $15,000 to $19,999 | 9 (0.4%) | 0 (0.0%) |
| $20,000 to $24,999 | 65 (3.2%) | 42 (10.3%) |
| $25,000 to $34,999 | 44 (2.1%) | 19 (4.6%) |
| $35,000 to $49,999 | 0 (0.0%) | 80 (19.6%) |
| $50,000 to $74,999 | 156 (7.6%) | 103 (25.2%) |
| $75,000 to $99,999 | 125 (6.1%) | 21 (5.1%) |
| $100,000 to $149,999 | 216 (10.6%) | 23 (5.6%) |
| $150,000 or more | 1,342 (65.7%) | 26 (6.4%) |
| Total | 2,044 (100.0%) | 409 (100.0%) |
Monthly Housing Cost Tiers in Medfield
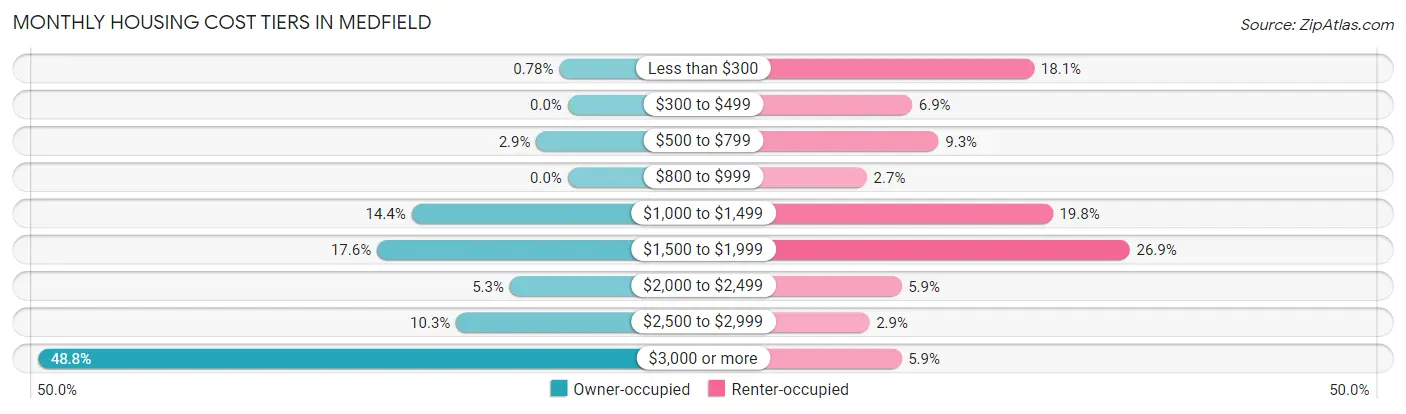
| Monthly Cost | Owner-occupied | Renter-occupied |
| Less than $300 | 16 (0.8%) | 74 (18.1%) |
| $300 to $499 | 0 (0.0%) | 28 (6.9%) |
| $500 to $799 | 59 (2.9%) | 38 (9.3%) |
| $800 to $999 | 0 (0.0%) | 11 (2.7%) |
| $1,000 to $1,499 | 294 (14.4%) | 81 (19.8%) |
| $1,500 to $1,999 | 359 (17.6%) | 110 (26.9%) |
| $2,000 to $2,499 | 109 (5.3%) | 24 (5.9%) |
| $2,500 to $2,999 | 210 (10.3%) | 12 (2.9%) |
| $3,000 or more | 997 (48.8%) | 24 (5.9%) |
| Total | 2,044 (100.0%) | 409 (100.0%) |
Physical Housing Characteristics in Medfield
Housing Structures in Medfield
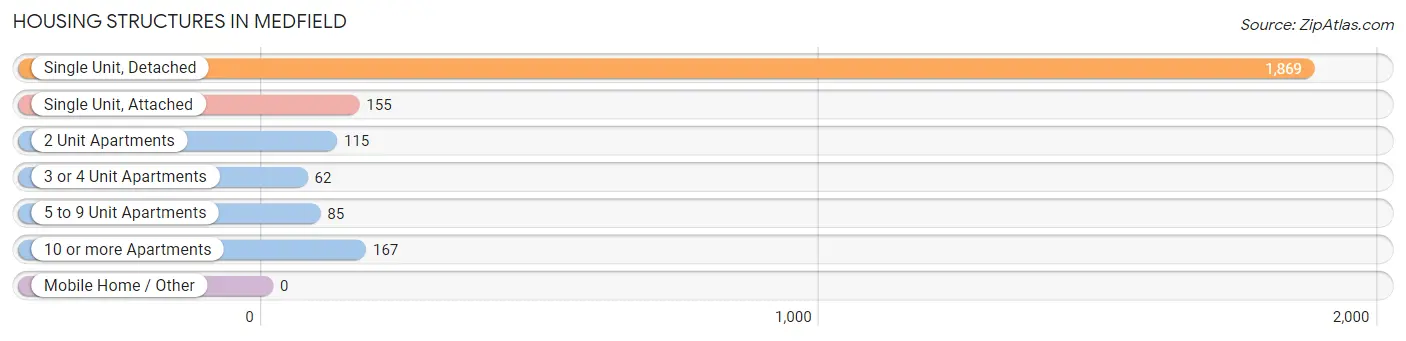
| Structure Type | # Housing Units | % Housing Units |
| Single Unit, Detached | 1,869 | 76.2% |
| Single Unit, Attached | 155 | 6.3% |
| 2 Unit Apartments | 115 | 4.7% |
| 3 or 4 Unit Apartments | 62 | 2.5% |
| 5 to 9 Unit Apartments | 85 | 3.5% |
| 10 or more Apartments | 167 | 6.8% |
| Mobile Home / Other | 0 | 0.0% |
| Total | 2,453 | 100.0% |
Housing Structures by Occupancy in Medfield
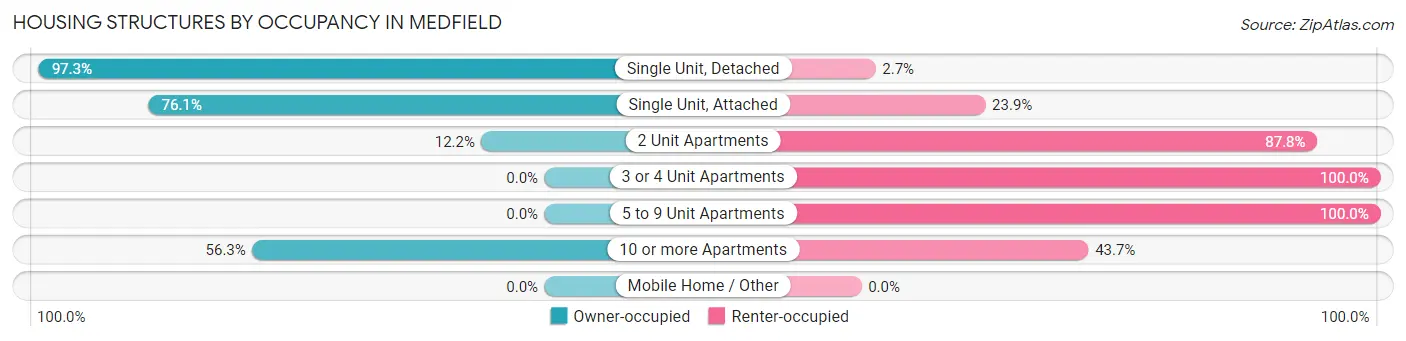
| Structure Type | Owner-occupied | Renter-occupied |
| Single Unit, Detached | 1,818 (97.3%) | 51 (2.7%) |
| Single Unit, Attached | 118 (76.1%) | 37 (23.9%) |
| 2 Unit Apartments | 14 (12.2%) | 101 (87.8%) |
| 3 or 4 Unit Apartments | 0 (0.0%) | 62 (100.0%) |
| 5 to 9 Unit Apartments | 0 (0.0%) | 85 (100.0%) |
| 10 or more Apartments | 94 (56.3%) | 73 (43.7%) |
| Mobile Home / Other | 0 (0.0%) | 0 (0.0%) |
| Total | 2,044 (83.3%) | 409 (16.7%) |
Housing Structures by Number of Rooms in Medfield
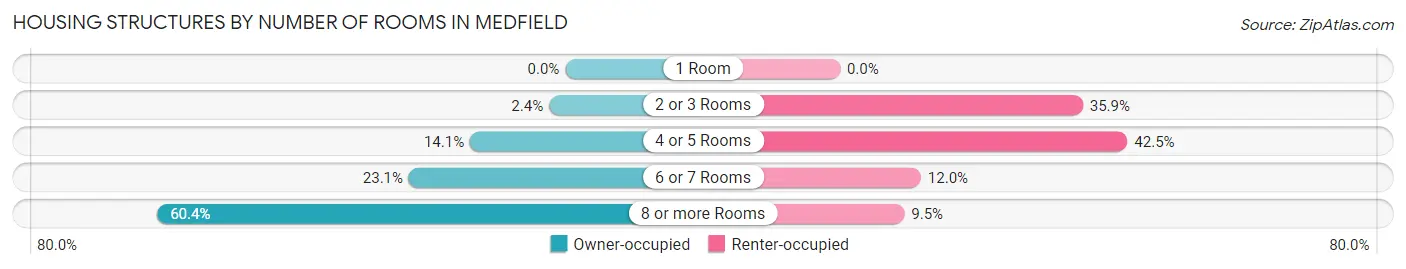
| Number of Rooms | Owner-occupied | Renter-occupied |
| 1 Room | 0 (0.0%) | 0 (0.0%) |
| 2 or 3 Rooms | 49 (2.4%) | 147 (35.9%) |
| 4 or 5 Rooms | 288 (14.1%) | 174 (42.5%) |
| 6 or 7 Rooms | 473 (23.1%) | 49 (12.0%) |
| 8 or more Rooms | 1,234 (60.4%) | 39 (9.5%) |
| Total | 2,044 (100.0%) | 409 (100.0%) |
Housing Structure by Heating Type in Medfield
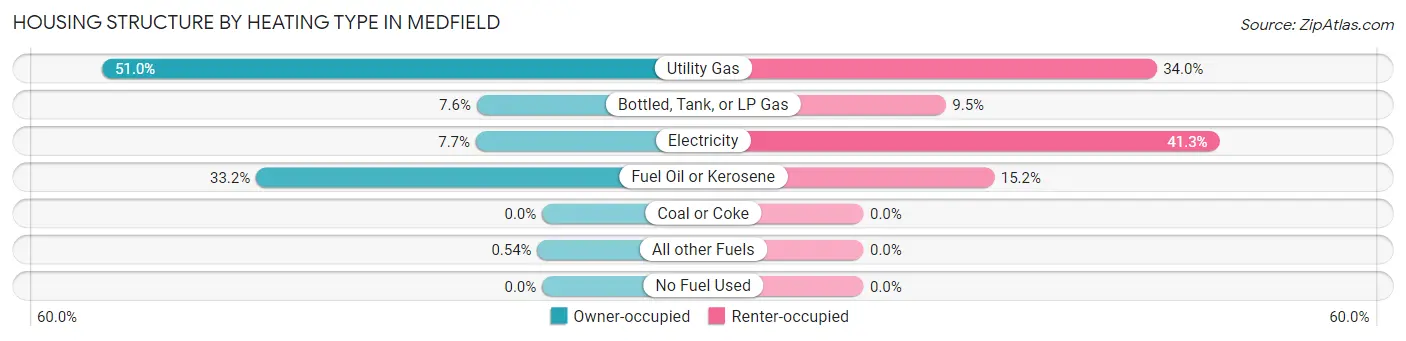
| Heating Type | Owner-occupied | Renter-occupied |
| Utility Gas | 1,043 (51.0%) | 139 (34.0%) |
| Bottled, Tank, or LP Gas | 155 (7.6%) | 39 (9.5%) |
| Electricity | 157 (7.7%) | 169 (41.3%) |
| Fuel Oil or Kerosene | 678 (33.2%) | 62 (15.2%) |
| Coal or Coke | 0 (0.0%) | 0 (0.0%) |
| All other Fuels | 11 (0.5%) | 0 (0.0%) |
| No Fuel Used | 0 (0.0%) | 0 (0.0%) |
| Total | 2,044 (100.0%) | 409 (100.0%) |
Household Vehicle Usage in Medfield
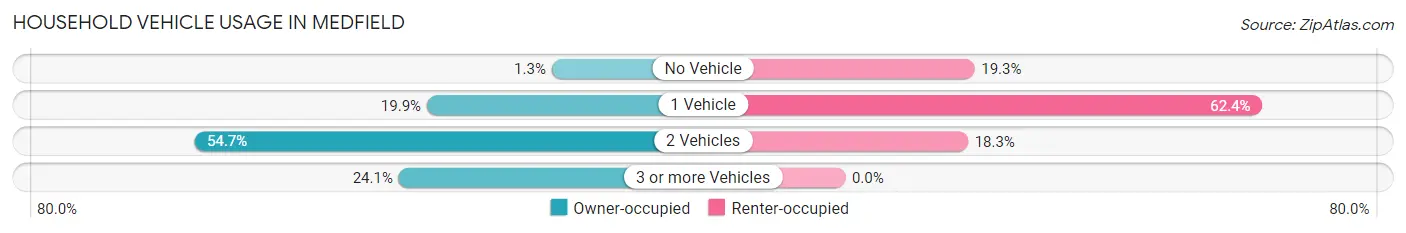
| Vehicles per Household | Owner-occupied | Renter-occupied |
| No Vehicle | 26 (1.3%) | 79 (19.3%) |
| 1 Vehicle | 407 (19.9%) | 255 (62.4%) |
| 2 Vehicles | 1,118 (54.7%) | 75 (18.3%) |
| 3 or more Vehicles | 493 (24.1%) | 0 (0.0%) |
| Total | 2,044 (100.0%) | 409 (100.0%) |
Real Estate & Mortgages in Medfield
Real Estate and Mortgage Overview in Medfield
| Characteristic | Without Mortgage | With Mortgage |
| Housing Units | 637 | 1,407 |
| Median Property Value | $720,100 | $748,900 |
| Median Household Income | $103,882 | $1,067 |
| Monthly Housing Costs | $1,501 | $965 |
| Real Estate Taxes | $10,001 | $0 |
Property Value by Mortgage Status in Medfield
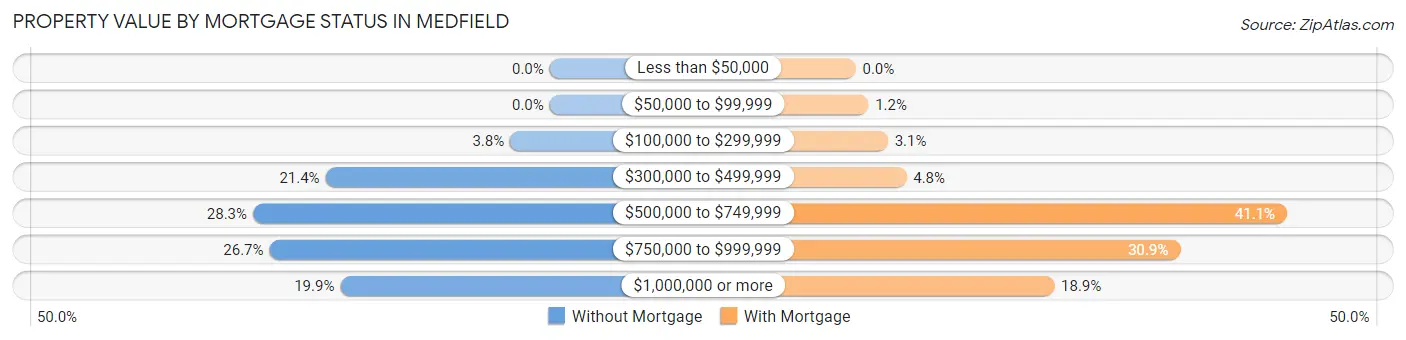
| Property Value | Without Mortgage | With Mortgage |
| Less than $50,000 | 0 (0.0%) | 0 (0.0%) |
| $50,000 to $99,999 | 0 (0.0%) | 17 (1.2%) |
| $100,000 to $299,999 | 24 (3.8%) | 43 (3.1%) |
| $300,000 to $499,999 | 136 (21.3%) | 68 (4.8%) |
| $500,000 to $749,999 | 180 (28.3%) | 578 (41.1%) |
| $750,000 to $999,999 | 170 (26.7%) | 435 (30.9%) |
| $1,000,000 or more | 127 (19.9%) | 266 (18.9%) |
| Total | 637 (100.0%) | 1,407 (100.0%) |
Household Income by Mortgage Status in Medfield
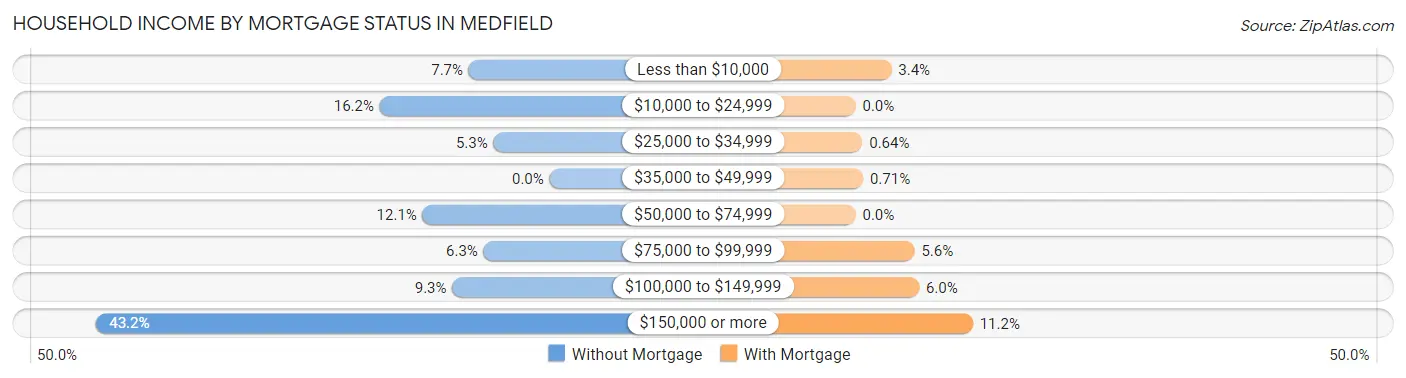
| Household Income | Without Mortgage | With Mortgage |
| Less than $10,000 | 49 (7.7%) | 48 (3.4%) |
| $10,000 to $24,999 | 103 (16.2%) | 0 (0.0%) |
| $25,000 to $34,999 | 34 (5.3%) | 9 (0.6%) |
| $35,000 to $49,999 | 0 (0.0%) | 10 (0.7%) |
| $50,000 to $74,999 | 77 (12.1%) | 0 (0.0%) |
| $75,000 to $99,999 | 40 (6.3%) | 79 (5.6%) |
| $100,000 to $149,999 | 59 (9.3%) | 85 (6.0%) |
| $150,000 or more | 275 (43.2%) | 157 (11.2%) |
| Total | 637 (100.0%) | 1,407 (100.0%) |
Property Value to Household Income Ratio in Medfield
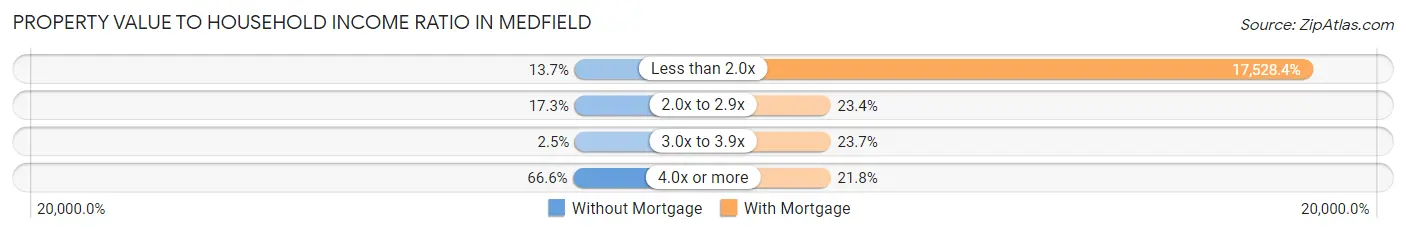
| Value-to-Income Ratio | Without Mortgage | With Mortgage |
| Less than 2.0x | 87 (13.7%) | 246,625 (17,528.4%) |
| 2.0x to 2.9x | 110 (17.3%) | 329 (23.4%) |
| 3.0x to 3.9x | 16 (2.5%) | 334 (23.7%) |
| 4.0x or more | 424 (66.6%) | 306 (21.7%) |
| Total | 637 (100.0%) | 1,407 (100.0%) |
Real Estate Taxes by Mortgage Status in Medfield
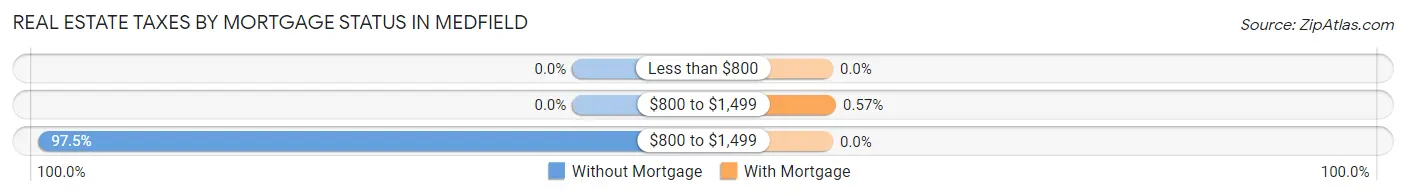
| Property Taxes | Without Mortgage | With Mortgage |
| Less than $800 | 0 (0.0%) | 0 (0.0%) |
| $800 to $1,499 | 0 (0.0%) | 8 (0.6%) |
| $800 to $1,499 | 621 (97.5%) | 0 (0.0%) |
| Total | 637 (100.0%) | 1,407 (100.0%) |
Health & Disability in Medfield
Health Insurance Coverage by Age in Medfield
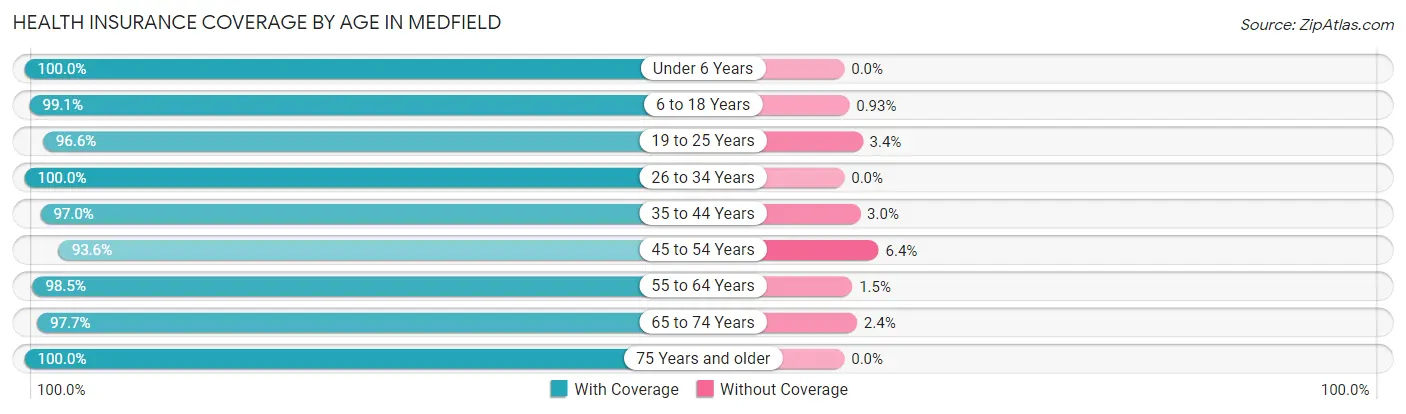
| Age Bracket | With Coverage | Without Coverage |
| Under 6 Years | 499 (100.0%) | 0 (0.0%) |
| 6 to 18 Years | 957 (99.1%) | 9 (0.9%) |
| 19 to 25 Years | 423 (96.6%) | 15 (3.4%) |
| 26 to 34 Years | 490 (100.0%) | 0 (0.0%) |
| 35 to 44 Years | 656 (97.0%) | 20 (3.0%) |
| 45 to 54 Years | 747 (93.6%) | 51 (6.4%) |
| 55 to 64 Years | 1,333 (98.5%) | 20 (1.5%) |
| 65 to 74 Years | 581 (97.7%) | 14 (2.4%) |
| 75 Years and older | 467 (100.0%) | 0 (0.0%) |
| Total | 6,153 (98.0%) | 129 (2.1%) |
Health Insurance Coverage by Citizenship Status in Medfield
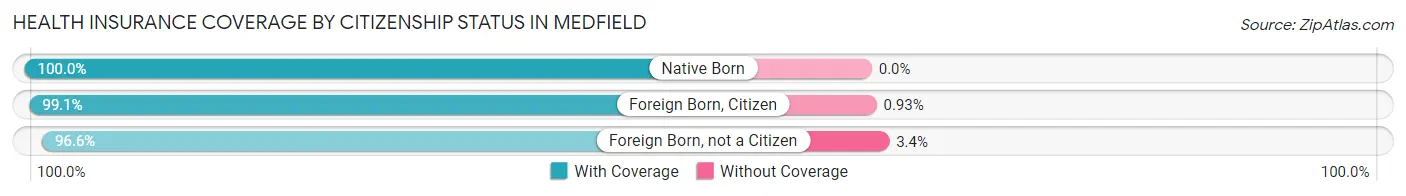
| Citizenship Status | With Coverage | Without Coverage |
| Native Born | 499 (100.0%) | 0 (0.0%) |
| Foreign Born, Citizen | 957 (99.1%) | 9 (0.9%) |
| Foreign Born, not a Citizen | 423 (96.6%) | 15 (3.4%) |
Health Insurance Coverage by Household Income in Medfield
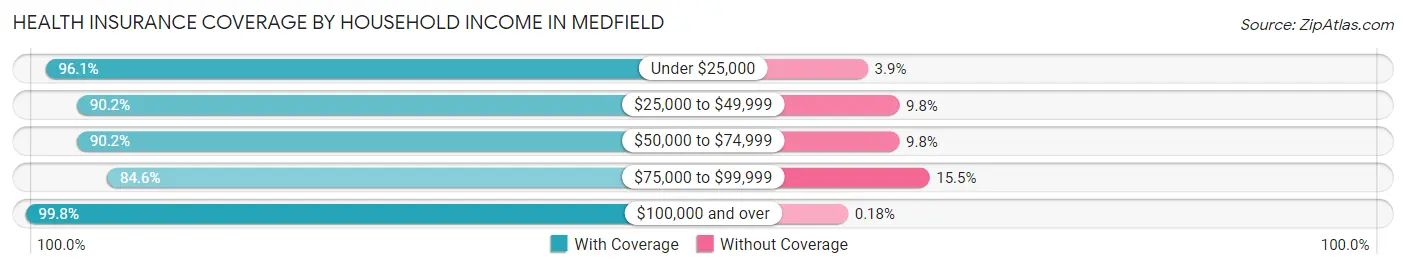
| Household Income | With Coverage | Without Coverage |
| Under $25,000 | 344 (96.1%) | 14 (3.9%) |
| $25,000 to $49,999 | 184 (90.2%) | 20 (9.8%) |
| $50,000 to $74,999 | 442 (90.2%) | 48 (9.8%) |
| $75,000 to $99,999 | 208 (84.6%) | 38 (15.4%) |
| $100,000 and over | 4,974 (99.8%) | 9 (0.2%) |
Public vs Private Health Insurance Coverage by Age in Medfield
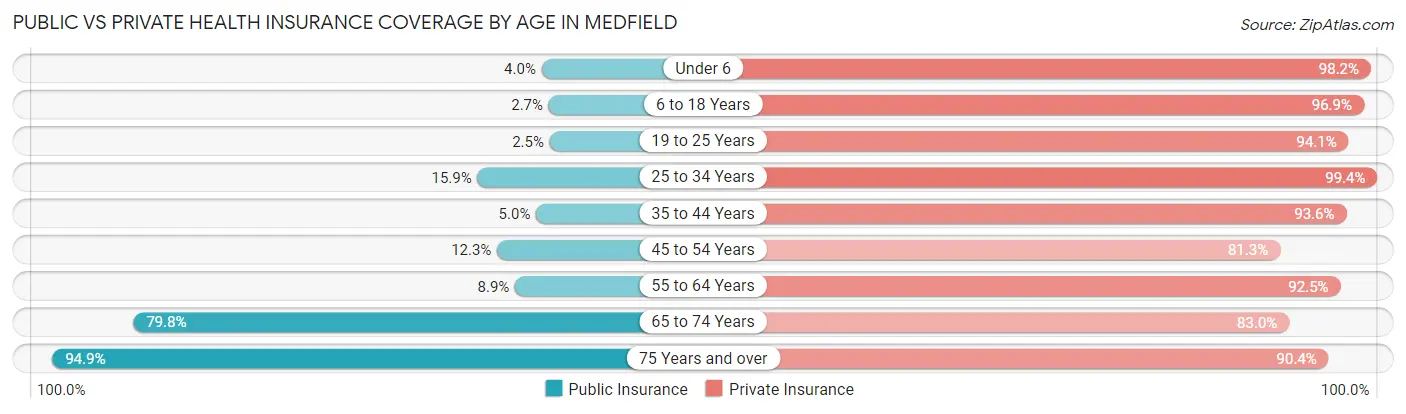
| Age Bracket | Public Insurance | Private Insurance |
| Under 6 | 20 (4.0%) | 490 (98.2%) |
| 6 to 18 Years | 26 (2.7%) | 936 (96.9%) |
| 19 to 25 Years | 11 (2.5%) | 412 (94.1%) |
| 25 to 34 Years | 78 (15.9%) | 487 (99.4%) |
| 35 to 44 Years | 34 (5.0%) | 633 (93.6%) |
| 45 to 54 Years | 98 (12.3%) | 649 (81.3%) |
| 55 to 64 Years | 121 (8.9%) | 1,252 (92.5%) |
| 65 to 74 Years | 475 (79.8%) | 494 (83.0%) |
| 75 Years and over | 443 (94.9%) | 422 (90.4%) |
| Total | 1,306 (20.8%) | 5,775 (91.9%) |
Disability Status by Sex by Age in Medfield
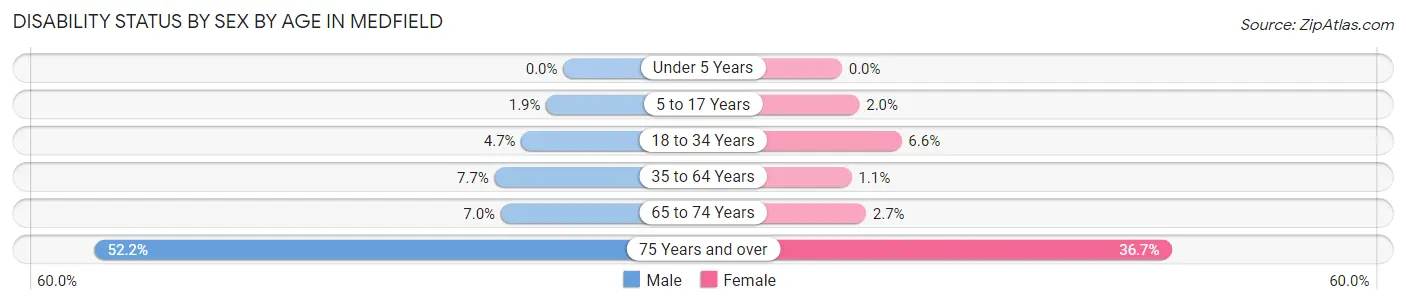
| Age Bracket | Male | Female |
| Under 5 Years | 0 (0.0%) | 0 (0.0%) |
| 5 to 17 Years | 9 (1.9%) | 9 (1.9%) |
| 18 to 34 Years | 23 (4.7%) | 33 (6.6%) |
| 35 to 64 Years | 109 (7.6%) | 15 (1.1%) |
| 65 to 74 Years | 18 (7.0%) | 9 (2.7%) |
| 75 Years and over | 83 (52.2%) | 113 (36.7%) |
Disability Class by Sex by Age in Medfield
Disability Class: Hearing Difficulty
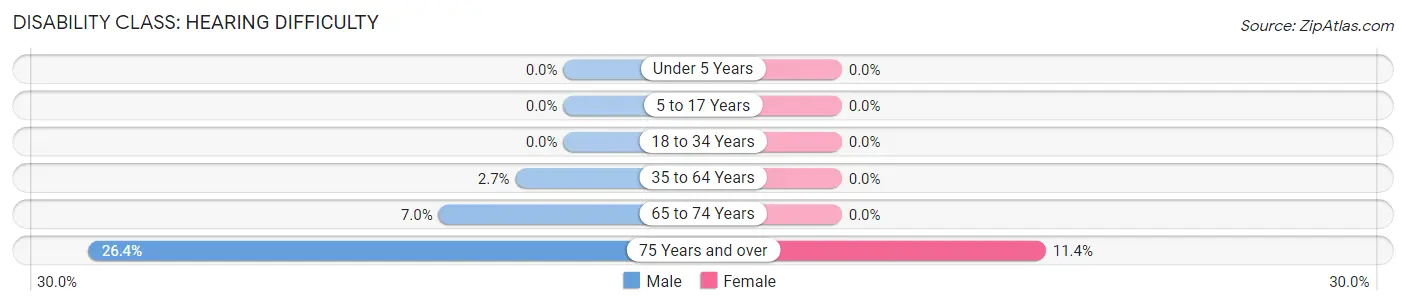
| Age Bracket | Male | Female |
| Under 5 Years | 0 (0.0%) | 0 (0.0%) |
| 5 to 17 Years | 0 (0.0%) | 0 (0.0%) |
| 18 to 34 Years | 0 (0.0%) | 0 (0.0%) |
| 35 to 64 Years | 38 (2.7%) | 0 (0.0%) |
| 65 to 74 Years | 18 (7.0%) | 0 (0.0%) |
| 75 Years and over | 42 (26.4%) | 35 (11.4%) |
Disability Class: Vision Difficulty
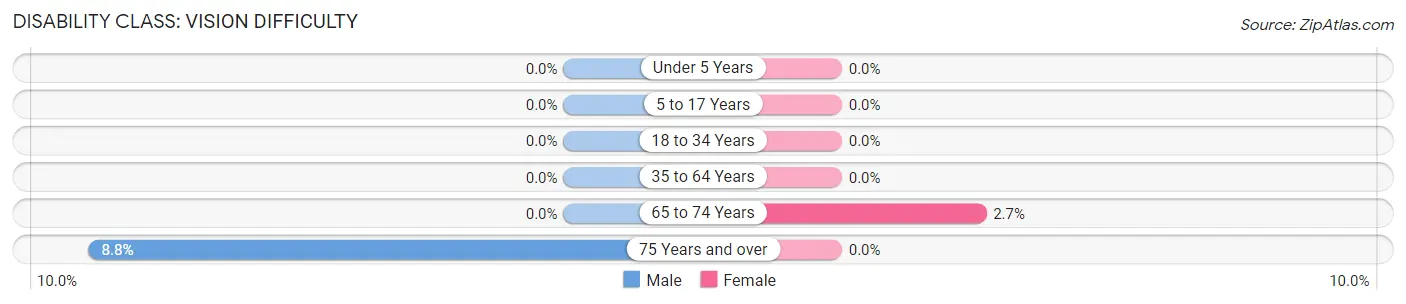
| Age Bracket | Male | Female |
| Under 5 Years | 0 (0.0%) | 0 (0.0%) |
| 5 to 17 Years | 0 (0.0%) | 0 (0.0%) |
| 18 to 34 Years | 0 (0.0%) | 0 (0.0%) |
| 35 to 64 Years | 0 (0.0%) | 0 (0.0%) |
| 65 to 74 Years | 0 (0.0%) | 9 (2.7%) |
| 75 Years and over | 14 (8.8%) | 0 (0.0%) |
Disability Class: Cognitive Difficulty
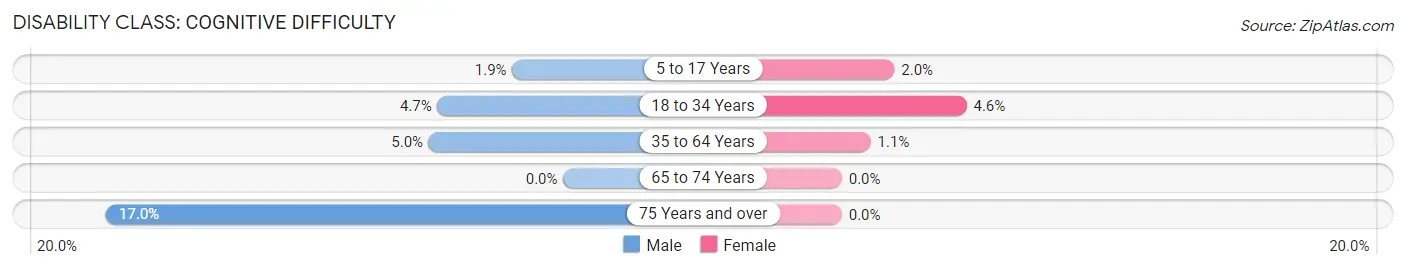
| Age Bracket | Male | Female |
| 5 to 17 Years | 9 (1.9%) | 9 (1.9%) |
| 18 to 34 Years | 23 (4.7%) | 23 (4.6%) |
| 35 to 64 Years | 71 (5.0%) | 15 (1.1%) |
| 65 to 74 Years | 0 (0.0%) | 0 (0.0%) |
| 75 Years and over | 27 (17.0%) | 0 (0.0%) |
Disability Class: Ambulatory Difficulty
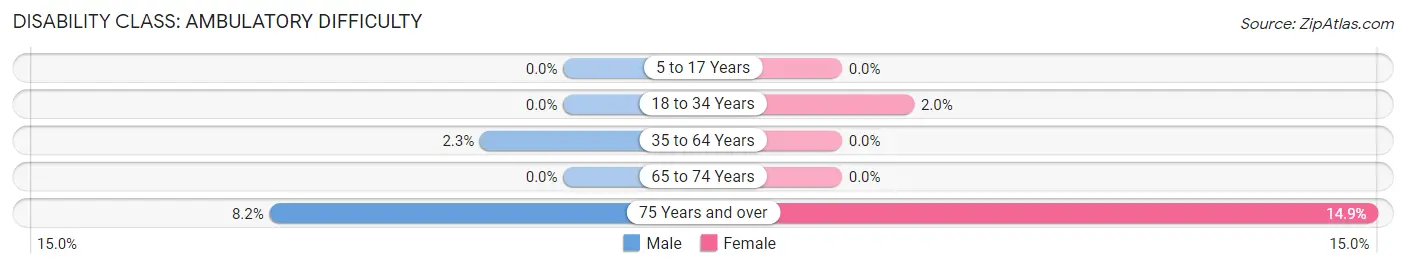
| Age Bracket | Male | Female |
| 5 to 17 Years | 0 (0.0%) | 0 (0.0%) |
| 18 to 34 Years | 0 (0.0%) | 10 (2.0%) |
| 35 to 64 Years | 33 (2.3%) | 0 (0.0%) |
| 65 to 74 Years | 0 (0.0%) | 0 (0.0%) |
| 75 Years and over | 13 (8.2%) | 46 (14.9%) |
Disability Class: Self-Care Difficulty
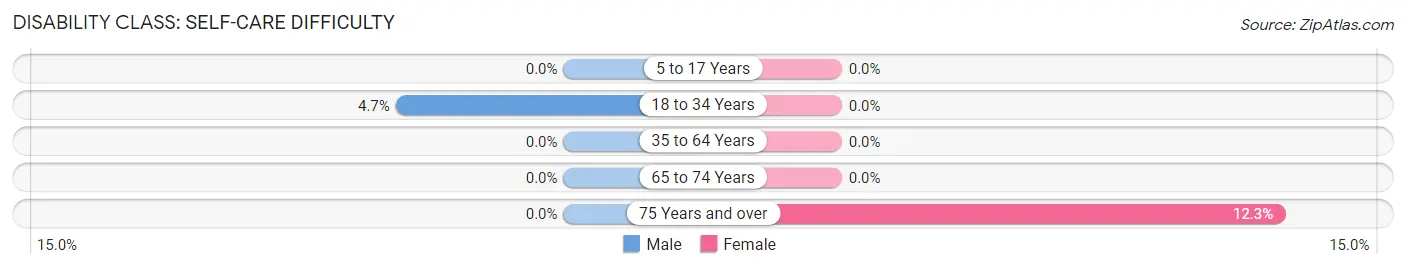
| Age Bracket | Male | Female |
| 5 to 17 Years | 0 (0.0%) | 0 (0.0%) |
| 18 to 34 Years | 23 (4.7%) | 0 (0.0%) |
| 35 to 64 Years | 0 (0.0%) | 0 (0.0%) |
| 65 to 74 Years | 0 (0.0%) | 0 (0.0%) |
| 75 Years and over | 0 (0.0%) | 38 (12.3%) |
Technology Access in Medfield
Computing Device Access in Medfield
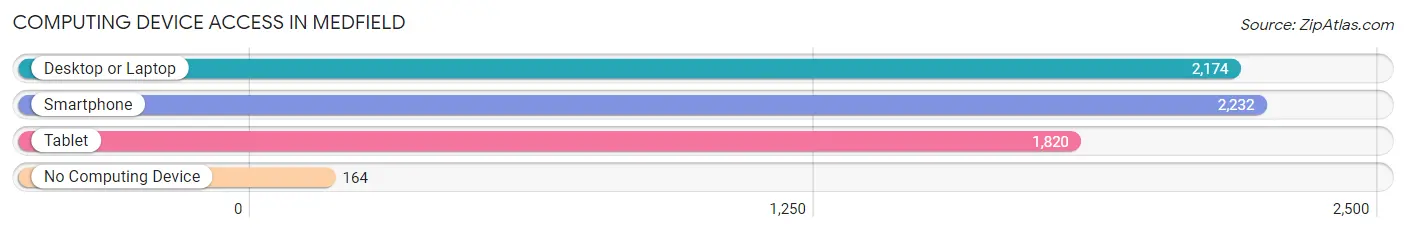
| Device Type | # Households | % Households |
| Desktop or Laptop | 2,174 | 88.6% |
| Smartphone | 2,232 | 91.0% |
| Tablet | 1,820 | 74.2% |
| No Computing Device | 164 | 6.7% |
| Total | 2,453 | 100.0% |
Internet Access in Medfield
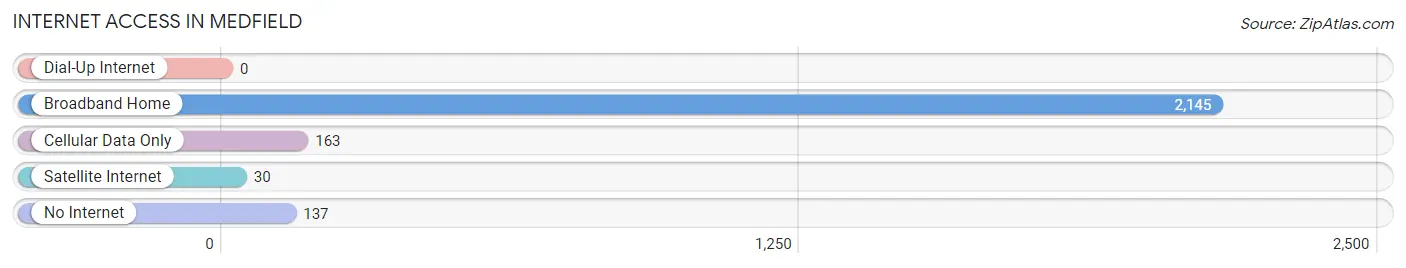
| Internet Type | # Households | % Households |
| Dial-Up Internet | 0 | 0.0% |
| Broadband Home | 2,145 | 87.4% |
| Cellular Data Only | 163 | 6.6% |
| Satellite Internet | 30 | 1.2% |
| No Internet | 137 | 5.6% |
| Total | 2,453 | 100.0% |
Medfield Summary
Medfield, Massachusetts is a small town located in Norfolk County, about 20 miles southwest of Boston. It is a rural community with a population of about 12,000 people. The town was first settled in 1650 and incorporated in 1651. It is known for its historic buildings, scenic views, and its proximity to Boston.
Geography
Medfield is located in the eastern part of Norfolk County, about 20 miles southwest of Boston. It is bordered by the towns of Millis, Norfolk, Walpole, Dover, and Sherborn. The town is situated on the Charles River, which forms its eastern boundary. The town is mostly rural, with a few small villages and hamlets. The highest point in the town is the summit of Pine Hill, which is about 500 feet above sea level.
The town is divided into two distinct parts: the uplands and the lowlands. The uplands are located in the western part of the town and are characterized by rolling hills and woodlands. The lowlands are located in the eastern part of the town and are characterized by flat, marshy land.
Economy
Medfield has a diverse economy, with a mix of small businesses, manufacturing, and agriculture. The town is home to several small businesses, including a variety of restaurants, retail stores, and professional services. The town also has a number of manufacturing companies, including a plastics manufacturer, a metal fabricator, and a printing company.
Agriculture is an important part of the town’s economy. The town is home to several farms, including dairy farms, vegetable farms, and apple orchards. The town also has a number of nurseries and greenhouses.
Demographics
As of the 2010 census, the population of Medfield was 12,024. The population is predominantly white (94.3%), with a small percentage of African Americans (2.2%), Asians (1.7%), and Hispanics (1.3%). The median household income is $118,846, and the median home value is $541,000.
The town is served by the Medfield Public Schools, which includes four elementary schools, one middle school, and one high school. The town also has a number of private schools, including a Catholic school and a Montessori school.
History
Medfield was first settled in 1650 by a group of English settlers from Dedham. The town was officially incorporated in 1651 and was named after the town of Medfield in England. The town was an agricultural community for much of its history, with a number of farms and orchards.
In the 19th century, the town began to industrialize, with the construction of several mills and factories. The town also became a popular summer resort, with several hotels and inns. In the 20th century, the town began to develop into a suburban community, with the construction of several housing developments.
Today, Medfield is a small, rural community with a mix of residential, commercial, and industrial development. The town is known for its historic buildings, scenic views, and its proximity to Boston.
Common Questions
What is Per Capita Income in Medfield?
Per Capita income in Medfield is $88,888.
What is the Median Family Income in Medfield?
Median Family Income in Medfield is $239,919.
What is the Median Household income in Medfield?
Median Household Income in Medfield is $181,125.
What is Income or Wage Gap in Medfield?
Income or Wage Gap in Medfield is 54.9%.
Women in Medfield earn 45.1 cents for every dollar earned by a man.
What is Inequality or Gini Index in Medfield?
Inequality or Gini Index in Medfield is 0.48.
What is the Total Population of Medfield?
Total Population of Medfield is 6,318.
What is the Total Male Population of Medfield?
Total Male Population of Medfield is 3,075.
What is the Total Female Population of Medfield?
Total Female Population of Medfield is 3,243.
What is the Ratio of Males per 100 Females in Medfield?
There are 94.82 Males per 100 Females in Medfield.
What is the Ratio of Females per 100 Males in Medfield?
There are 105.46 Females per 100 Males in Medfield.
What is the Median Population Age in Medfield?
Median Population Age in Medfield is 45.9 Years.
What is the Average Family Size in Medfield
Average Family Size in Medfield is 3.1 People.
What is the Average Household Size in Medfield
Average Household Size in Medfield is 2.6 People.
How Large is the Labor Force in Medfield?
There are 3,461 People in the Labor Forcein in Medfield.
What is the Percentage of People in the Labor Force in Medfield?
69.1% of People are in the Labor Force in Medfield.
What is the Unemployment Rate in Medfield?
Unemployment Rate in Medfield is 5.5%.