Haverhill, MA Map & Demographics
Haverhill Map
Haverhill Overview
$39,770
PER CAPITA INCOME
$98,467
AVG FAMILY INCOME
$81,989
AVG HOUSEHOLD INCOME
30.5%
WAGE / INCOME GAP [ % ]
69.5¢/ $1
WAGE / INCOME GAP [ $ ]
$11,340
FAMILY INCOME DEFICIT
0.42
INEQUALITY / GINI INDEX
67,273
TOTAL POPULATION
32,942
MALE POPULATION
34,331
FEMALE POPULATION
95.95
MALES / 100 FEMALES
104.22
FEMALES / 100 MALES
37.9
MEDIAN AGE
3.1
AVG FAMILY SIZE
2.5
AVG HOUSEHOLD SIZE
38,112
LABOR FORCE [ PEOPLE ]
69.8%
PERCENT IN LABOR FORCE
6.0%
UNEMPLOYMENT RATE
Income in Haverhill
Income Overview in Haverhill
Per Capita Income in Haverhill is $39,770, while median incomes of families and households are $98,467 and $81,989 respectively.
| Characteristic | Number | Measure |
| Per Capita Income | 67,273 | $39,770 |
| Median Family Income | 16,585 | $98,467 |
| Mean Family Income | 16,585 | $114,288 |
| Median Household Income | 25,976 | $81,989 |
| Mean Household Income | 25,976 | $101,822 |
| Income Deficit | 16,585 | $11,340 |
| Wage / Income Gap (%) | 67,273 | 30.49% |
| Wage / Income Gap ($) | 67,273 | 69.51¢ per $1 |
| Gini / Inequality Index | 67,273 | 0.42 |
Earnings by Sex in Haverhill
Average Earnings in Haverhill are $45,778, $54,924 for men and $38,178 for women, a difference of 30.5%.
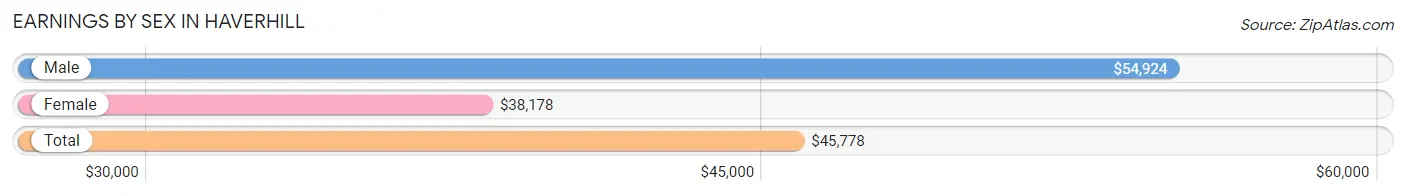
| Sex | Number | Average Earnings |
| Male | 19,145 (49.8%) | $54,924 |
| Female | 19,329 (50.2%) | $38,178 |
| Total | 38,474 (100.0%) | $45,778 |
Earnings by Sex by Income Bracket in Haverhill
The most common earnings brackets in Haverhill are $100,000+ for men (3,675 | 19.2%) and $75,000 to $99,999 for women (2,254 | 11.7%).
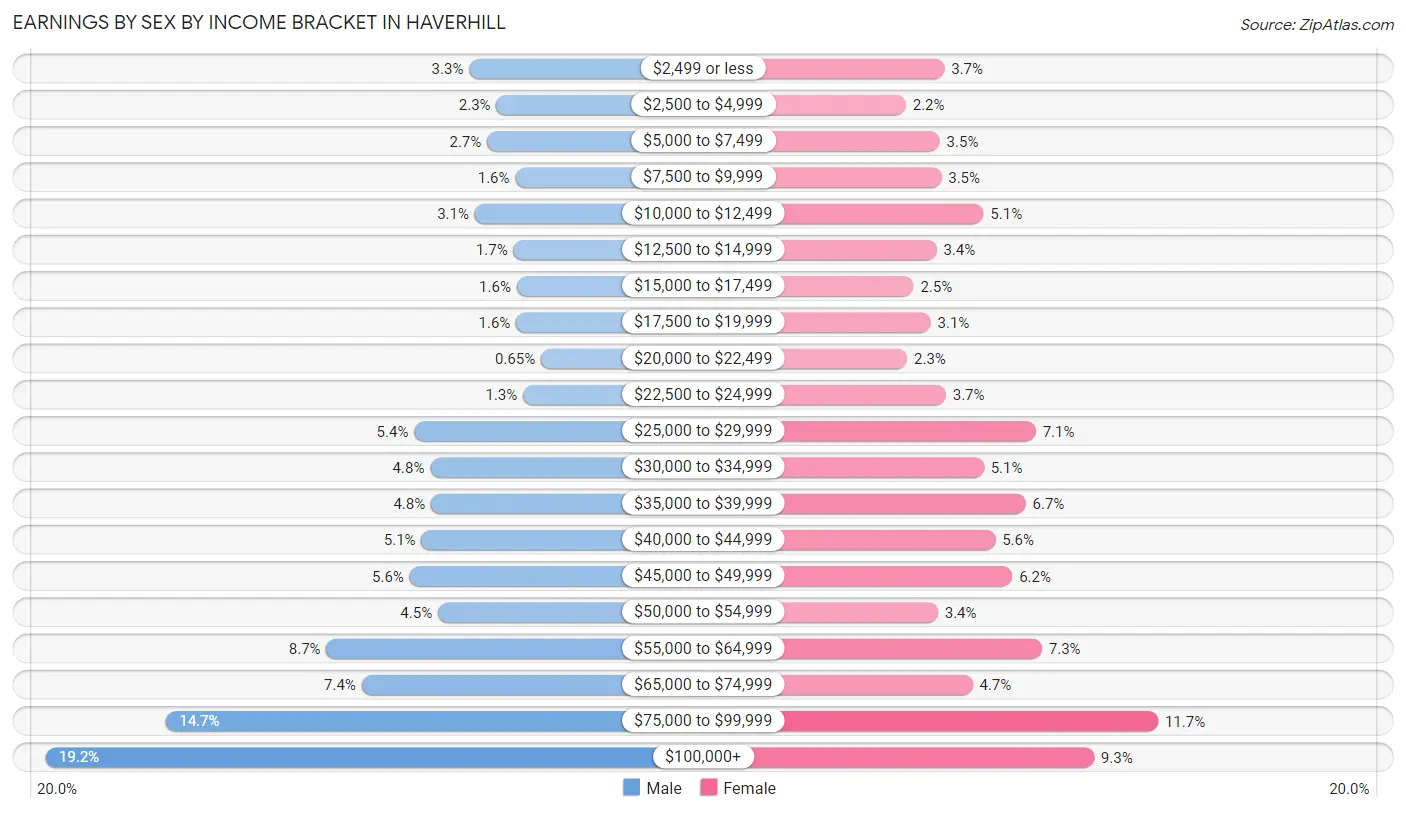
| Income | Male | Female |
| $2,499 or less | 640 (3.3%) | 705 (3.6%) |
| $2,500 to $4,999 | 444 (2.3%) | 428 (2.2%) |
| $5,000 to $7,499 | 512 (2.7%) | 673 (3.5%) |
| $7,500 to $9,999 | 309 (1.6%) | 685 (3.5%) |
| $10,000 to $12,499 | 600 (3.1%) | 990 (5.1%) |
| $12,500 to $14,999 | 322 (1.7%) | 649 (3.4%) |
| $15,000 to $17,499 | 299 (1.6%) | 483 (2.5%) |
| $17,500 to $19,999 | 302 (1.6%) | 607 (3.1%) |
| $20,000 to $22,499 | 124 (0.6%) | 437 (2.3%) |
| $22,500 to $24,999 | 252 (1.3%) | 718 (3.7%) |
| $25,000 to $29,999 | 1,034 (5.4%) | 1,368 (7.1%) |
| $30,000 to $34,999 | 919 (4.8%) | 991 (5.1%) |
| $35,000 to $39,999 | 913 (4.8%) | 1,295 (6.7%) |
| $40,000 to $44,999 | 983 (5.1%) | 1,075 (5.6%) |
| $45,000 to $49,999 | 1,066 (5.6%) | 1,198 (6.2%) |
| $50,000 to $54,999 | 864 (4.5%) | 659 (3.4%) |
| $55,000 to $64,999 | 1,664 (8.7%) | 1,413 (7.3%) |
| $65,000 to $74,999 | 1,411 (7.4%) | 911 (4.7%) |
| $75,000 to $99,999 | 2,812 (14.7%) | 2,254 (11.7%) |
| $100,000+ | 3,675 (19.2%) | 1,790 (9.3%) |
| Total | 19,145 (100.0%) | 19,329 (100.0%) |
Earnings by Sex by Educational Attainment in Haverhill
Average earnings in Haverhill are $62,899 for men and $43,162 for women, a difference of 31.4%. Men with an educational attainment of graduate degree enjoy the highest average annual earnings of $103,382, while those with less than high school education earn the least with $42,413. Women with an educational attainment of graduate degree earn the most with the average annual earnings of $78,522, while those with less than high school education have the smallest earnings of $27,700.
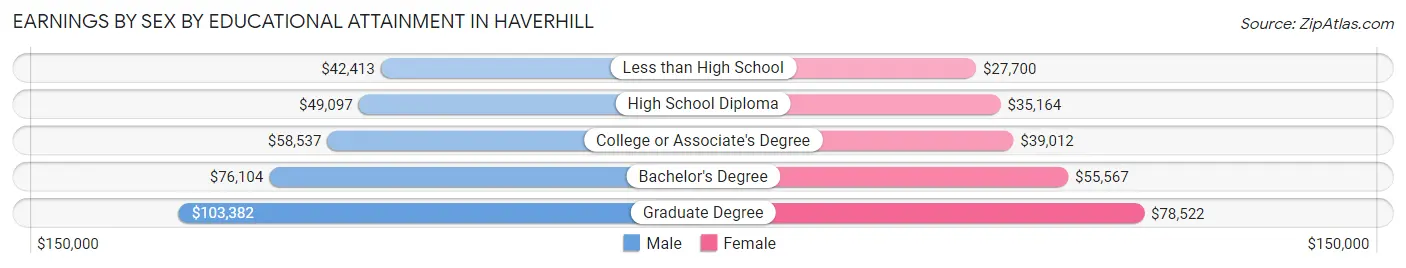
| Educational Attainment | Male Income | Female Income |
| Less than High School | $42,413 | $27,700 |
| High School Diploma | $49,097 | $35,164 |
| College or Associate's Degree | $58,537 | $39,012 |
| Bachelor's Degree | $76,104 | $55,567 |
| Graduate Degree | $103,382 | $78,522 |
| Total | $62,899 | $43,162 |
Family Income in Haverhill
Family Income Brackets in Haverhill
According to the Haverhill family income data, there are 3,715 families falling into the $100,000 to $149,999 income range, which is the most common income bracket and makes up 22.4% of all families. Conversely, the $10,000 to $14,999 income bracket is the least frequent group with only 381 families (2.3%) belonging to this category.
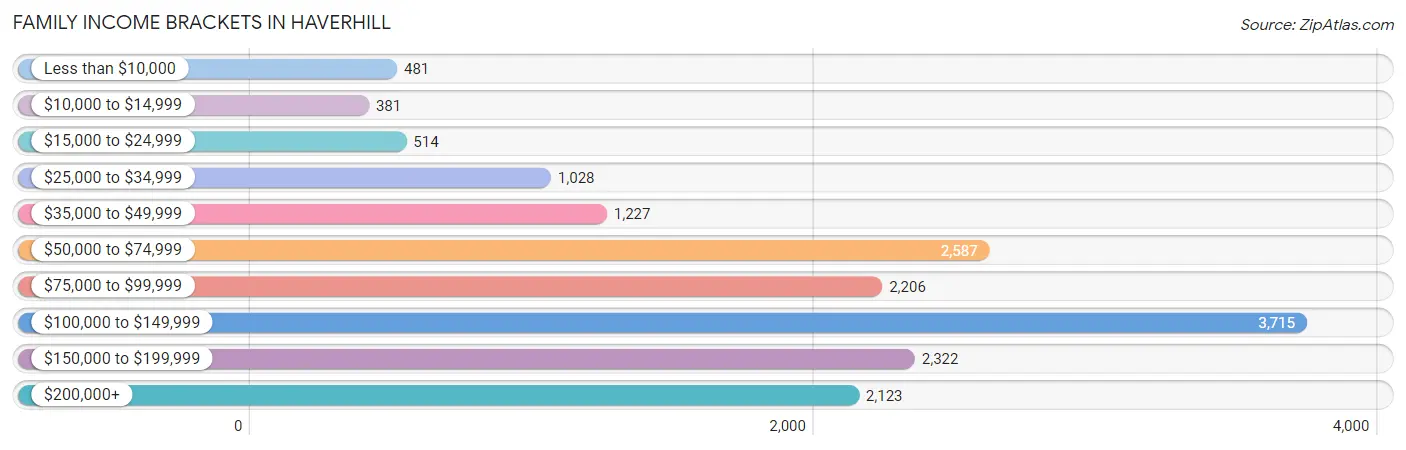
| Income Bracket | # Families | % Families |
| Less than $10,000 | 481 | 2.9% |
| $10,000 to $14,999 | 381 | 2.3% |
| $15,000 to $24,999 | 514 | 3.1% |
| $25,000 to $34,999 | 1,028 | 6.2% |
| $35,000 to $49,999 | 1,227 | 7.4% |
| $50,000 to $74,999 | 2,587 | 15.6% |
| $75,000 to $99,999 | 2,206 | 13.3% |
| $100,000 to $149,999 | 3,715 | 22.4% |
| $150,000 to $199,999 | 2,322 | 14.0% |
| $200,000+ | 2,123 | 12.8% |
Family Income by Famaliy Size in Haverhill
7+ person families (338 | 2.0%) account for the highest median family income in Haverhill with $157,188 per family, while 2-person families (7,024 | 42.3%) have the highest median income of $41,402 per family member.
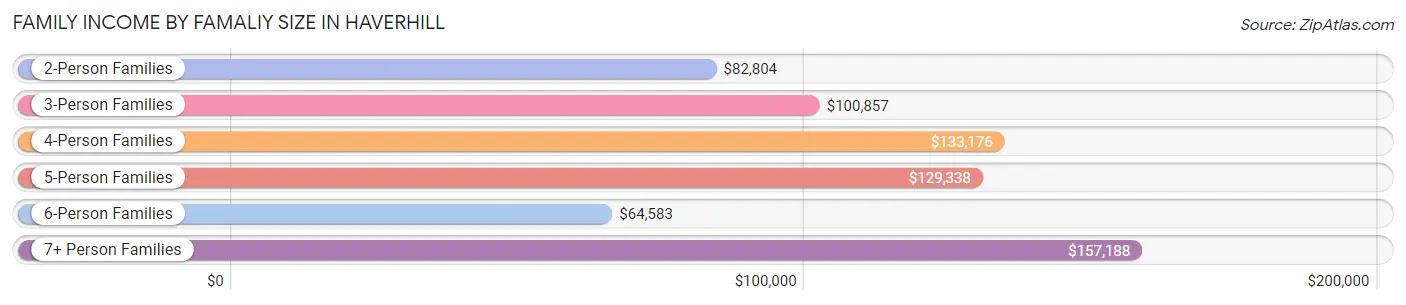
| Income Bracket | # Families | Median Income |
| 2-Person Families | 7,024 (42.3%) | $82,804 |
| 3-Person Families | 4,000 (24.1%) | $100,857 |
| 4-Person Families | 3,774 (22.8%) | $133,176 |
| 5-Person Families | 1,153 (7.0%) | $129,338 |
| 6-Person Families | 296 (1.8%) | $64,583 |
| 7+ Person Families | 338 (2.0%) | $157,188 |
| Total | 16,585 (100.0%) | $98,467 |
Family Income by Number of Earners in Haverhill
The median family income in Haverhill is $98,467, with families comprising 3+ earners (2,652) having the highest median family income of $165,581, while families with no earners (1,869) have the lowest median family income of $43,534, accounting for 16.0% and 11.3% of families, respectively.
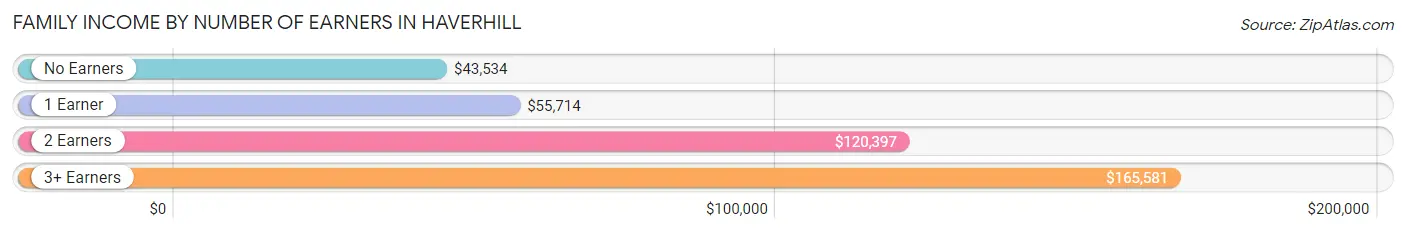
| Number of Earners | # Families | Median Income |
| No Earners | 1,869 (11.3%) | $43,534 |
| 1 Earner | 4,648 (28.0%) | $55,714 |
| 2 Earners | 7,416 (44.7%) | $120,397 |
| 3+ Earners | 2,652 (16.0%) | $165,581 |
| Total | 16,585 (100.0%) | $98,467 |
Household Income in Haverhill
Household Income Brackets in Haverhill
With 5,065 households falling in the category, the $100,000 to $149,999 income range is the most frequent in Haverhill, accounting for 19.5% of all households. In contrast, only 935 households (3.6%) fall into the $10,000 to $14,999 income bracket, making it the least populous group.
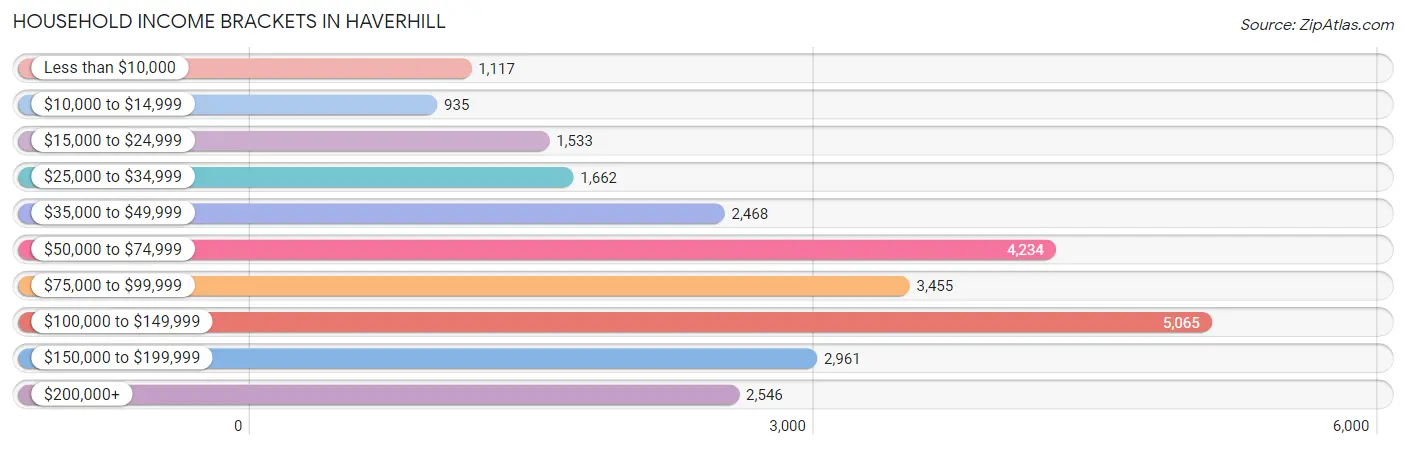
| Income Bracket | # Households | % Households |
| Less than $10,000 | 1,117 | 4.3% |
| $10,000 to $14,999 | 935 | 3.6% |
| $15,000 to $24,999 | 1,533 | 5.9% |
| $25,000 to $34,999 | 1,662 | 6.4% |
| $35,000 to $49,999 | 2,468 | 9.5% |
| $50,000 to $74,999 | 4,234 | 16.3% |
| $75,000 to $99,999 | 3,455 | 13.3% |
| $100,000 to $149,999 | 5,065 | 19.5% |
| $150,000 to $199,999 | 2,961 | 11.4% |
| $200,000+ | 2,546 | 9.8% |
Household Income by Householder Age in Haverhill
The median household income in Haverhill is $81,989, with the highest median household income of $96,219 found in the 45 to 64 years age bracket for the primary householder. A total of 10,951 households (42.2%) fall into this category. Meanwhile, the 15 to 24 years age bracket for the primary householder has the lowest median household income of $53,788, with 710 households (2.7%) in this group.
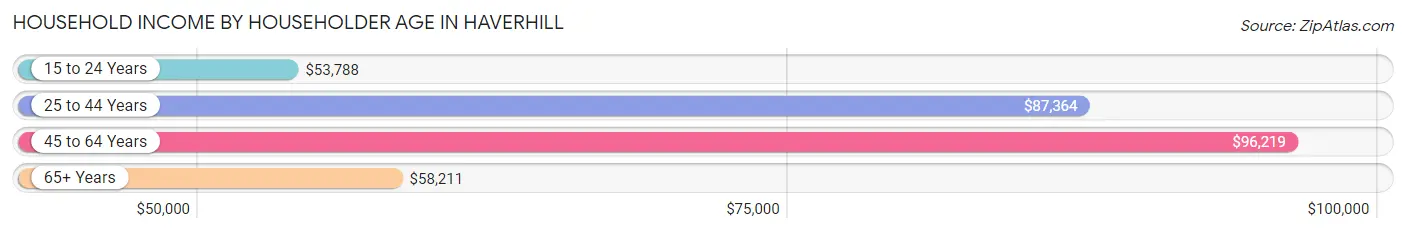
| Income Bracket | # Households | Median Income |
| 15 to 24 Years | 710 (2.7%) | $53,788 |
| 25 to 44 Years | 8,490 (32.7%) | $87,364 |
| 45 to 64 Years | 10,951 (42.2%) | $96,219 |
| 65+ Years | 5,825 (22.4%) | $58,211 |
| Total | 25,976 (100.0%) | $81,989 |
Poverty in Haverhill
Income Below Poverty by Sex and Age in Haverhill
With 9.0% poverty level for males and 12.2% for females among the residents of Haverhill, 12 to 14 year old males and under 5 year old females are the most vulnerable to poverty, with 298 males (19.3%) and 406 females (18.0%) in their respective age groups living below the poverty level.
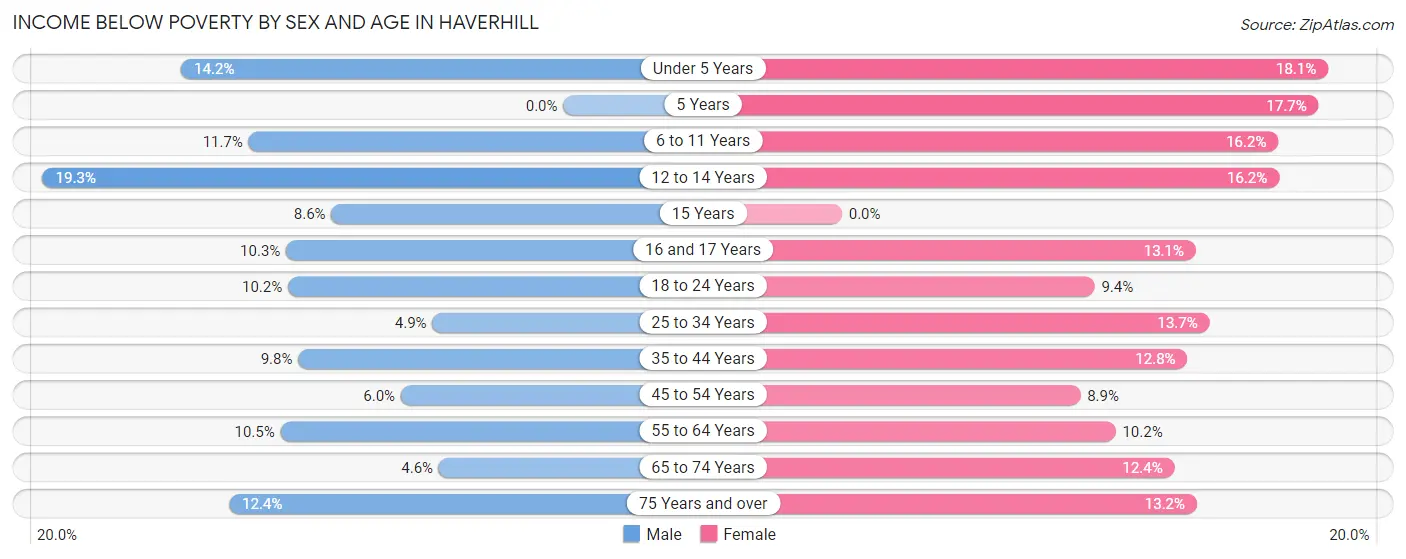
| Age Bracket | Male | Female |
| Under 5 Years | 210 (14.2%) | 406 (18.0%) |
| 5 Years | 0 (0.0%) | 40 (17.7%) |
| 6 to 11 Years | 277 (11.7%) | 304 (16.2%) |
| 12 to 14 Years | 298 (19.3%) | 188 (16.2%) |
| 15 Years | 47 (8.6%) | 0 (0.0%) |
| 16 and 17 Years | 92 (10.3%) | 92 (13.1%) |
| 18 to 24 Years | 326 (10.2%) | 304 (9.4%) |
| 25 to 34 Years | 243 (4.9%) | 680 (13.7%) |
| 35 to 44 Years | 399 (9.8%) | 538 (12.8%) |
| 45 to 54 Years | 249 (6.0%) | 408 (8.8%) |
| 55 to 64 Years | 465 (10.5%) | 505 (10.2%) |
| 65 to 74 Years | 136 (4.6%) | 388 (12.3%) |
| 75 Years and over | 166 (12.4%) | 273 (13.2%) |
| Total | 2,908 (9.0%) | 4,126 (12.2%) |
Income Above Poverty by Sex and Age in Haverhill
According to the poverty statistics in Haverhill, males aged 5 years and females aged 15 years are the age groups that are most secure financially, with 100.0% of males and 100.0% of females in these age groups living above the poverty line.
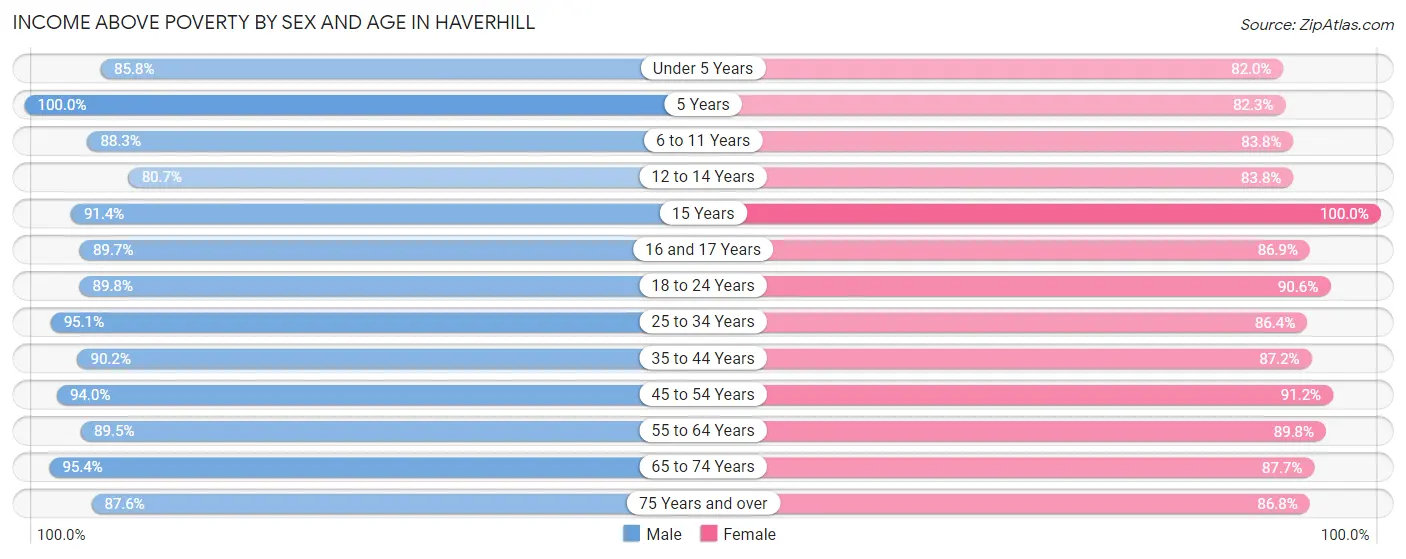
| Age Bracket | Male | Female |
| Under 5 Years | 1,270 (85.8%) | 1,843 (82.0%) |
| 5 Years | 504 (100.0%) | 186 (82.3%) |
| 6 to 11 Years | 2,094 (88.3%) | 1,573 (83.8%) |
| 12 to 14 Years | 1,244 (80.7%) | 970 (83.8%) |
| 15 Years | 499 (91.4%) | 500 (100.0%) |
| 16 and 17 Years | 802 (89.7%) | 608 (86.9%) |
| 18 to 24 Years | 2,865 (89.8%) | 2,937 (90.6%) |
| 25 to 34 Years | 4,758 (95.1%) | 4,303 (86.4%) |
| 35 to 44 Years | 3,654 (90.2%) | 3,656 (87.2%) |
| 45 to 54 Years | 3,879 (94.0%) | 4,201 (91.1%) |
| 55 to 64 Years | 3,965 (89.5%) | 4,464 (89.8%) |
| 65 to 74 Years | 2,808 (95.4%) | 2,754 (87.6%) |
| 75 Years and over | 1,172 (87.6%) | 1,799 (86.8%) |
| Total | 29,514 (91.0%) | 29,794 (87.8%) |
Income Below Poverty Among Married-Couple Families in Haverhill
The poverty statistics for married-couple families in Haverhill show that 3.0% or 329 of the total 10,930 families live below the poverty line. Families with 3 or 4 children have the highest poverty rate of 11.0%, comprising of 75 families. On the other hand, families with 1 or 2 children have the lowest poverty rate of 2.3%, which includes 91 families.
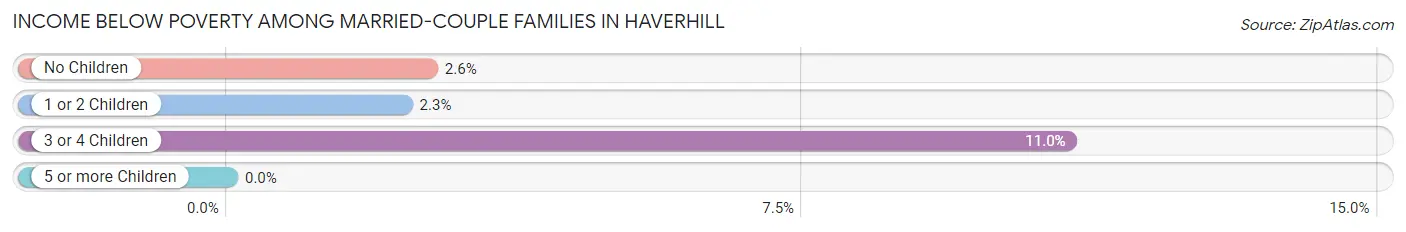
| Children | Above Poverty | Below Poverty |
| No Children | 6,089 (97.4%) | 163 (2.6%) |
| 1 or 2 Children | 3,903 (97.7%) | 91 (2.3%) |
| 3 or 4 Children | 609 (89.0%) | 75 (11.0%) |
| 5 or more Children | 0 (0.0%) | 0 (0.0%) |
| Total | 10,601 (97.0%) | 329 (3.0%) |
Income Below Poverty Among Single-Parent Households in Haverhill
According to the poverty data in Haverhill, 11.2% or 177 single-father households and 19.0% or 775 single-mother households are living below the poverty line. Among single-father households, those with 1 or 2 children have the highest poverty rate, with 135 households (15.3%) experiencing poverty. Likewise, among single-mother households, those with 3 or 4 children have the highest poverty rate, with 145 households (37.3%) falling below the poverty line.
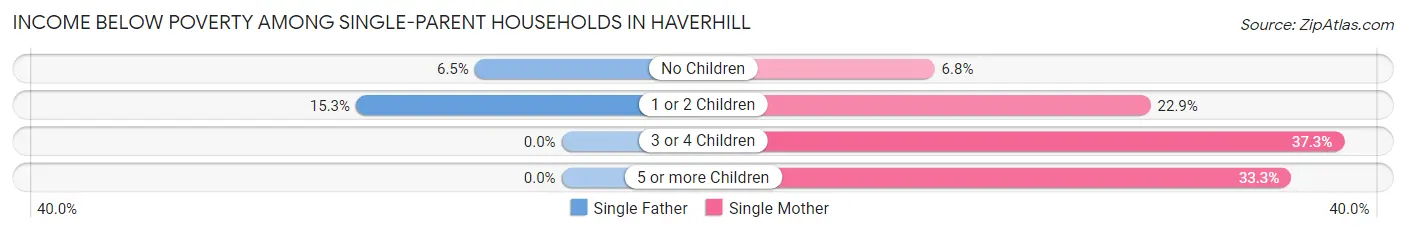
| Children | Single Father | Single Mother |
| No Children | 42 (6.5%) | 94 (6.8%) |
| 1 or 2 Children | 135 (15.3%) | 507 (22.9%) |
| 3 or 4 Children | 0 (0.0%) | 145 (37.3%) |
| 5 or more Children | 0 (0.0%) | 29 (33.3%) |
| Total | 177 (11.2%) | 775 (19.0%) |
Income Below Poverty Among Married-Couple vs Single-Parent Households in Haverhill
The poverty data for Haverhill shows that 329 of the married-couple family households (3.0%) and 952 of the single-parent households (16.8%) are living below the poverty level. Within the married-couple family households, those with 3 or 4 children have the highest poverty rate, with 75 households (11.0%) falling below the poverty line. Among the single-parent households, those with 3 or 4 children have the highest poverty rate, with 145 household (33.3%) living below poverty.
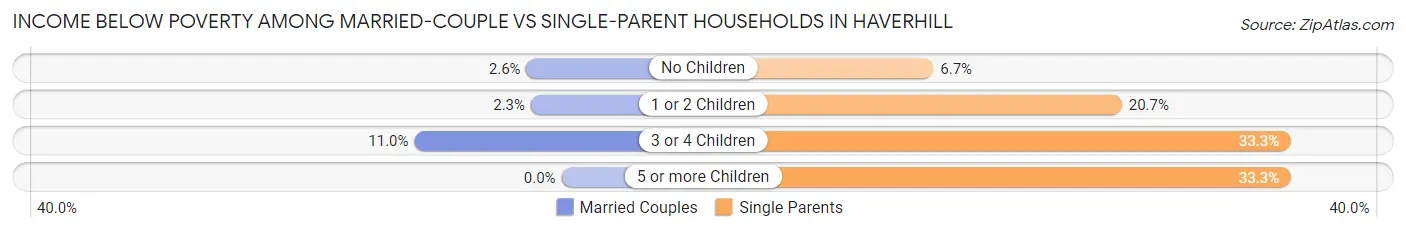
| Children | Married-Couple Families | Single-Parent Households |
| No Children | 163 (2.6%) | 136 (6.7%) |
| 1 or 2 Children | 91 (2.3%) | 642 (20.7%) |
| 3 or 4 Children | 75 (11.0%) | 145 (33.3%) |
| 5 or more Children | 0 (0.0%) | 29 (33.3%) |
| Total | 329 (3.0%) | 952 (16.8%) |
Race in Haverhill
The most populous races in Haverhill are White / Caucasian (48,081 | 71.5%), Hispanic or Latino (16,313 | 24.2%), and Two or more Races (8,906 | 13.2%).
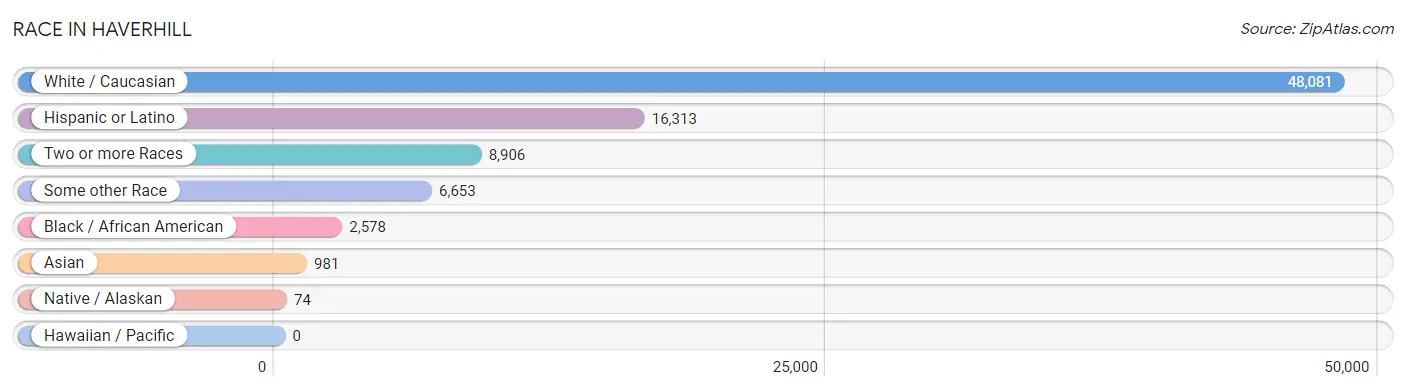
| Race | # Population | % Population |
| Asian | 981 | 1.5% |
| Black / African American | 2,578 | 3.8% |
| Hawaiian / Pacific | 0 | 0.0% |
| Hispanic or Latino | 16,313 | 24.2% |
| Native / Alaskan | 74 | 0.1% |
| White / Caucasian | 48,081 | 71.5% |
| Two or more Races | 8,906 | 13.2% |
| Some other Race | 6,653 | 9.9% |
| Total | 67,273 | 100.0% |
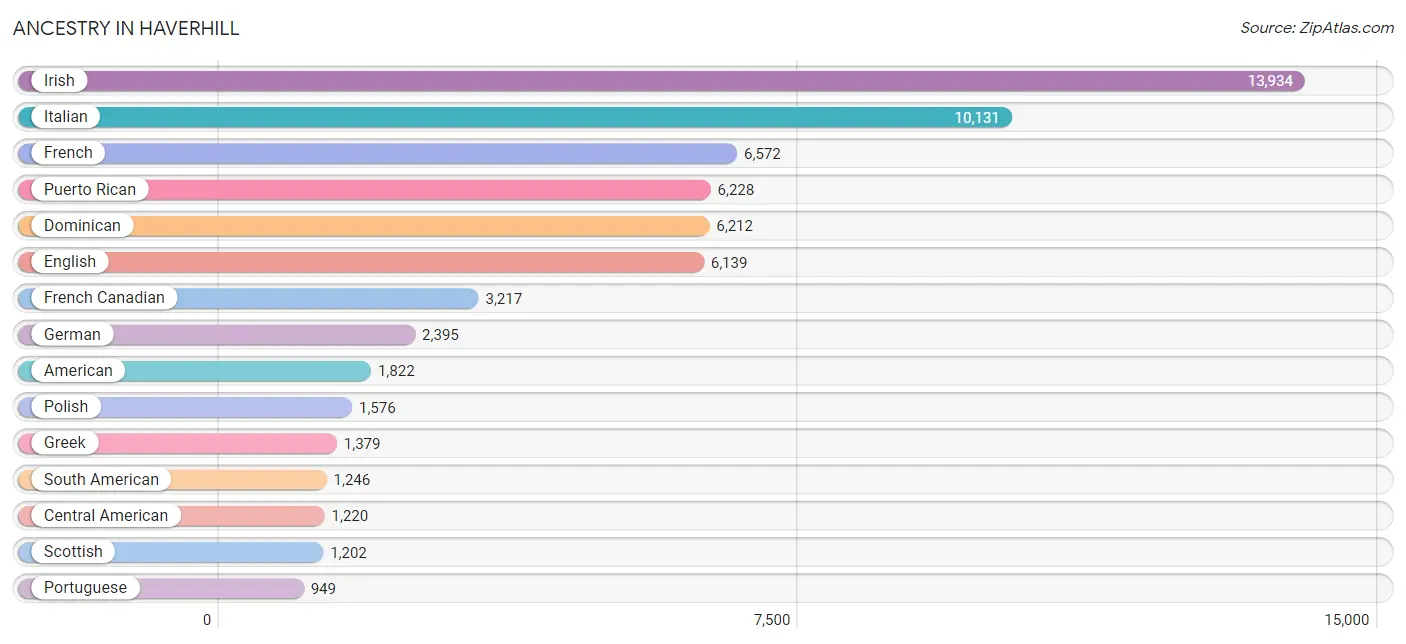
Ancestry in Haverhill
The most populous ancestries reported in Haverhill are Irish (13,934 | 20.7%), Italian (10,131 | 15.1%), French (6,572 | 9.8%), Puerto Rican (6,228 | 9.3%), and Dominican (6,212 | 9.2%), together accounting for 64.0% of all Haverhill residents.
| Ancestry | # Population | % Population |
| African | 260 | 0.4% |
| Albanian | 145 | 0.2% |
| American | 1,822 | 2.7% |
| Arab | 694 | 1.0% |
| Armenian | 602 | 0.9% |
| Assyrian / Chaldean / Syriac | 25 | 0.0% |
| Austrian | 22 | 0.0% |
| Basque | 24 | 0.0% |
| Belgian | 277 | 0.4% |
| Bhutanese | 40 | 0.1% |
| Blackfeet | 32 | 0.1% |
| Brazilian | 177 | 0.3% |
| British | 148 | 0.2% |
| British West Indian | 66 | 0.1% |
| Burmese | 435 | 0.6% |
| Canadian | 553 | 0.8% |
| Cape Verdean | 70 | 0.1% |
| Celtic | 13 | 0.0% |
| Central American | 1,220 | 1.8% |
| Central American Indian | 231 | 0.3% |
| Cherokee | 16 | 0.0% |
| Colombian | 896 | 1.3% |
| Croatian | 29 | 0.0% |
| Cuban | 219 | 0.3% |
| Czech | 8 | 0.0% |
| Danish | 22 | 0.0% |
| Dominican | 6,212 | 9.2% |
| Dutch | 241 | 0.4% |
| Eastern European | 19 | 0.0% |
| Ecuadorian | 245 | 0.4% |
| English | 6,139 | 9.1% |
| Ethiopian | 10 | 0.0% |
| European | 556 | 0.8% |
| Filipino | 47 | 0.1% |
| Finnish | 155 | 0.2% |
| French | 6,572 | 9.8% |
| French American Indian | 4 | 0.0% |
| French Canadian | 3,217 | 4.8% |
| German | 2,395 | 3.6% |
| Ghanaian | 55 | 0.1% |
| Greek | 1,379 | 2.1% |
| Guatemalan | 512 | 0.8% |
| Guyanese | 1 | 0.0% |
| Haitian | 388 | 0.6% |
| Honduran | 253 | 0.4% |
| Hungarian | 110 | 0.2% |
| Indian (Asian) | 50 | 0.1% |
| Iranian | 28 | 0.0% |
| Irish | 13,934 | 20.7% |
| Israeli | 7 | 0.0% |
| Italian | 10,131 | 15.1% |
| Jamaican | 152 | 0.2% |
| Japanese | 57 | 0.1% |
| Jordanian | 38 | 0.1% |
| Kenyan | 22 | 0.0% |
| Korean | 105 | 0.2% |
| Latvian | 8 | 0.0% |
| Lebanese | 383 | 0.6% |
| Liberian | 10 | 0.0% |
| Lithuanian | 250 | 0.4% |
| Macedonian | 105 | 0.2% |
| Mexican | 721 | 1.1% |
| Moroccan | 50 | 0.1% |
| Native Hawaiian | 29 | 0.0% |
| Nicaraguan | 30 | 0.0% |
| Nigerian | 9 | 0.0% |
| Norwegian | 240 | 0.4% |
| Palestinian | 12 | 0.0% |
| Panamanian | 12 | 0.0% |
| Pennsylvania German | 20 | 0.0% |
| Peruvian | 103 | 0.2% |
| Polish | 1,576 | 2.3% |
| Portuguese | 949 | 1.4% |
| Puerto Rican | 6,228 | 9.3% |
| Romanian | 11 | 0.0% |
| Russian | 501 | 0.7% |
| Salvadoran | 413 | 0.6% |
| Scandinavian | 214 | 0.3% |
| Scotch-Irish | 328 | 0.5% |
| Scottish | 1,202 | 1.8% |
| Serbian | 14 | 0.0% |
| Slavic | 32 | 0.1% |
| Slovak | 39 | 0.1% |
| South American | 1,246 | 1.8% |
| Spaniard | 55 | 0.1% |
| Spanish | 81 | 0.1% |
| Sri Lankan | 614 | 0.9% |
| Subsaharan African | 449 | 0.7% |
| Swedish | 607 | 0.9% |
| Swiss | 40 | 0.1% |
| Syrian | 109 | 0.2% |
| Thai | 150 | 0.2% |
| Trinidadian and Tobagonian | 32 | 0.1% |
| Tsimshian | 12 | 0.0% |
| Turkish | 8 | 0.0% |
| U.S. Virgin Islander | 28 | 0.0% |
| Ukrainian | 90 | 0.1% |
| Venezuelan | 2 | 0.0% |
| Welsh | 236 | 0.4% |
| West Indian | 57 | 0.1% | View All 100 Rows |
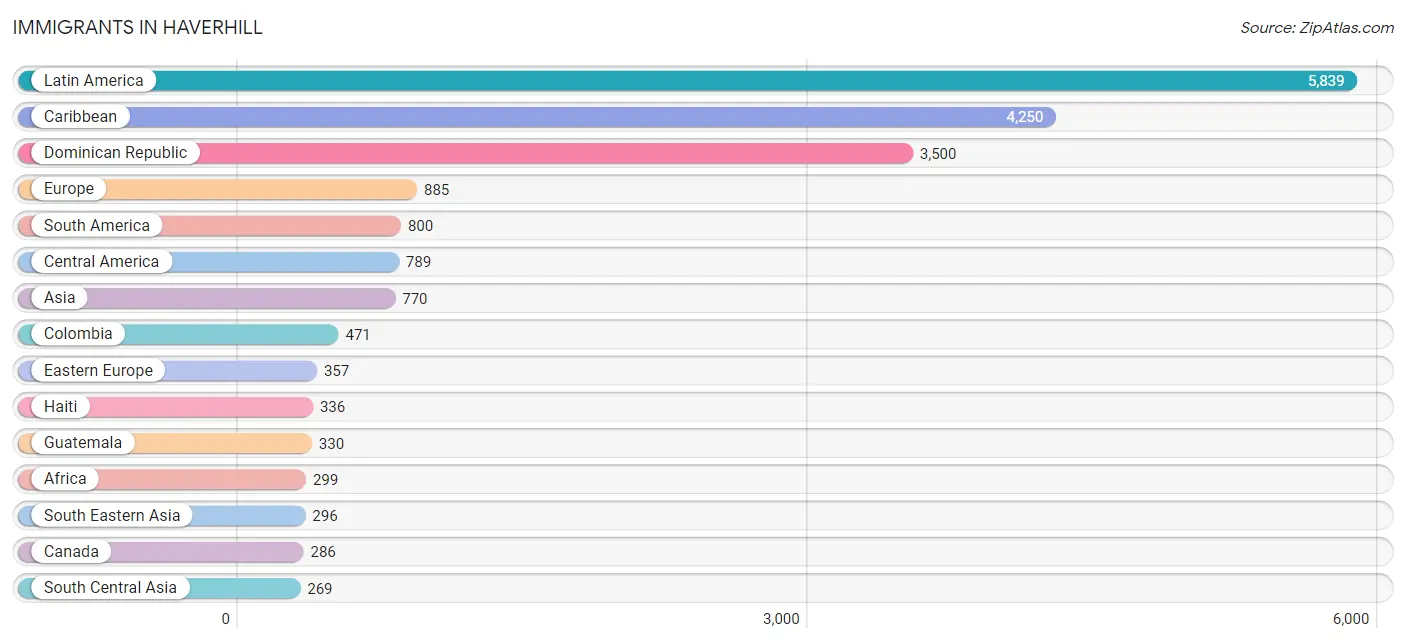
Immigrants in Haverhill
The most numerous immigrant groups reported in Haverhill came from Latin America (5,839 | 8.7%), Caribbean (4,250 | 6.3%), Dominican Republic (3,500 | 5.2%), Europe (885 | 1.3%), and South America (800 | 1.2%), together accounting for 22.7% of all Haverhill residents.
| Immigration Origin | # Population | % Population |
| Africa | 299 | 0.4% |
| Albania | 119 | 0.2% |
| Asia | 770 | 1.1% |
| Australia | 14 | 0.0% |
| Austria | 29 | 0.0% |
| Azores | 17 | 0.0% |
| Belarus | 79 | 0.1% |
| Belgium | 13 | 0.0% |
| Brazil | 149 | 0.2% |
| Cambodia | 23 | 0.0% |
| Cameroon | 18 | 0.0% |
| Canada | 286 | 0.4% |
| Caribbean | 4,250 | 6.3% |
| Central America | 789 | 1.2% |
| Colombia | 471 | 0.7% |
| Cuba | 53 | 0.1% |
| Czechoslovakia | 8 | 0.0% |
| Dominica | 232 | 0.3% |
| Dominican Republic | 3,500 | 5.2% |
| Eastern Africa | 130 | 0.2% |
| Eastern Asia | 93 | 0.1% |
| Eastern Europe | 357 | 0.5% |
| Ecuador | 110 | 0.2% |
| El Salvador | 252 | 0.4% |
| England | 40 | 0.1% |
| Ethiopia | 10 | 0.0% |
| Europe | 885 | 1.3% |
| Germany | 71 | 0.1% |
| Ghana | 21 | 0.0% |
| Greece | 162 | 0.2% |
| Guatemala | 330 | 0.5% |
| Haiti | 336 | 0.5% |
| Honduras | 150 | 0.2% |
| India | 80 | 0.1% |
| Iran | 53 | 0.1% |
| Ireland | 23 | 0.0% |
| Israel | 19 | 0.0% |
| Italy | 31 | 0.1% |
| Jamaica | 116 | 0.2% |
| Japan | 7 | 0.0% |
| Jordan | 29 | 0.0% |
| Kazakhstan | 11 | 0.0% |
| Kenya | 62 | 0.1% |
| Korea | 86 | 0.1% |
| Kuwait | 4 | 0.0% |
| Latin America | 5,839 | 8.7% |
| Lebanon | 60 | 0.1% |
| Mexico | 57 | 0.1% |
| Middle Africa | 19 | 0.0% |
| Morocco | 73 | 0.1% |
| Nepal | 14 | 0.0% |
| Nigeria | 18 | 0.0% |
| North Macedonia | 34 | 0.1% |
| Northern Africa | 97 | 0.1% |
| Northern Europe | 152 | 0.2% |
| Norway | 6 | 0.0% |
| Oceania | 14 | 0.0% |
| Pakistan | 86 | 0.1% |
| Peru | 55 | 0.1% |
| Philippines | 47 | 0.1% |
| Poland | 69 | 0.1% |
| Portugal | 43 | 0.1% |
| Romania | 22 | 0.0% |
| Russia | 19 | 0.0% |
| South America | 800 | 1.2% |
| South Central Asia | 269 | 0.4% |
| South Eastern Asia | 296 | 0.4% |
| Southern Europe | 263 | 0.4% |
| Spain | 27 | 0.0% |
| Sri Lanka | 10 | 0.0% |
| Thailand | 16 | 0.0% |
| Trinidad and Tobago | 13 | 0.0% |
| Ukraine | 7 | 0.0% |
| Uzbekistan | 15 | 0.0% |
| Vietnam | 210 | 0.3% |
| Western Africa | 53 | 0.1% |
| Western Asia | 112 | 0.2% |
| Western Europe | 113 | 0.2% |
| Zaire | 1 | 0.0% |
| Zimbabwe | 58 | 0.1% | View All 80 Rows |
Sex and Age in Haverhill
Sex and Age in Haverhill
The most populous age groups in Haverhill are 25 to 29 Years (2,591 | 7.9%) for men and 25 to 29 Years (2,583 | 7.5%) for women.
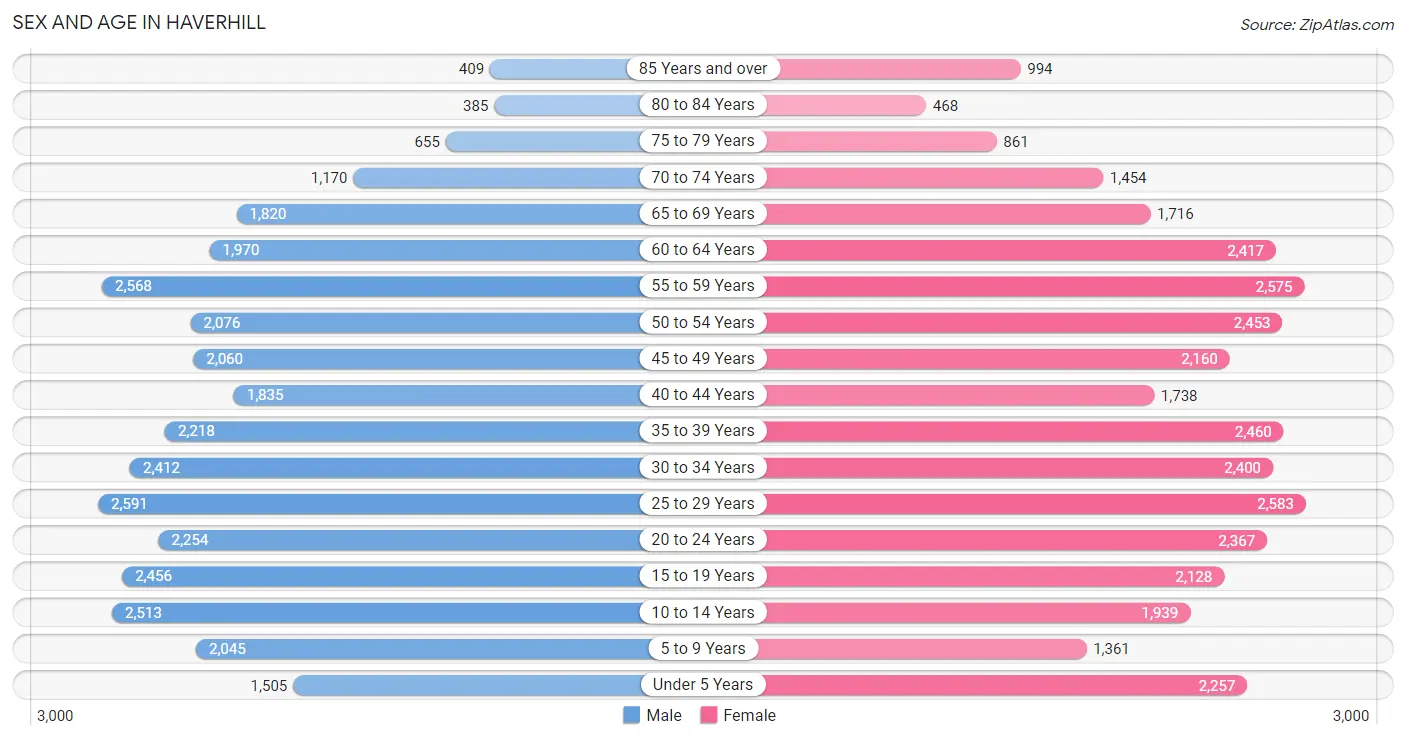
| Age Bracket | Male | Female |
| Under 5 Years | 1,505 (4.6%) | 2,257 (6.6%) |
| 5 to 9 Years | 2,045 (6.2%) | 1,361 (4.0%) |
| 10 to 14 Years | 2,513 (7.6%) | 1,939 (5.7%) |
| 15 to 19 Years | 2,456 (7.5%) | 2,128 (6.2%) |
| 20 to 24 Years | 2,254 (6.8%) | 2,367 (6.9%) |
| 25 to 29 Years | 2,591 (7.9%) | 2,583 (7.5%) |
| 30 to 34 Years | 2,412 (7.3%) | 2,400 (7.0%) |
| 35 to 39 Years | 2,218 (6.7%) | 2,460 (7.2%) |
| 40 to 44 Years | 1,835 (5.6%) | 1,738 (5.1%) |
| 45 to 49 Years | 2,060 (6.2%) | 2,160 (6.3%) |
| 50 to 54 Years | 2,076 (6.3%) | 2,453 (7.1%) |
| 55 to 59 Years | 2,568 (7.8%) | 2,575 (7.5%) |
| 60 to 64 Years | 1,970 (6.0%) | 2,417 (7.0%) |
| 65 to 69 Years | 1,820 (5.5%) | 1,716 (5.0%) |
| 70 to 74 Years | 1,170 (3.5%) | 1,454 (4.2%) |
| 75 to 79 Years | 655 (2.0%) | 861 (2.5%) |
| 80 to 84 Years | 385 (1.2%) | 468 (1.4%) |
| 85 Years and over | 409 (1.2%) | 994 (2.9%) |
| Total | 32,942 (100.0%) | 34,331 (100.0%) |
Families and Households in Haverhill
Median Family Size in Haverhill
The median family size in Haverhill is 3.11 persons per family, with married-couple families (10,930 | 65.9%) accounting for the largest median family size of 3.22 persons per family. On the other hand, single male/father families (1,576 | 9.5%) represent the smallest median family size with 2.71 persons per family.
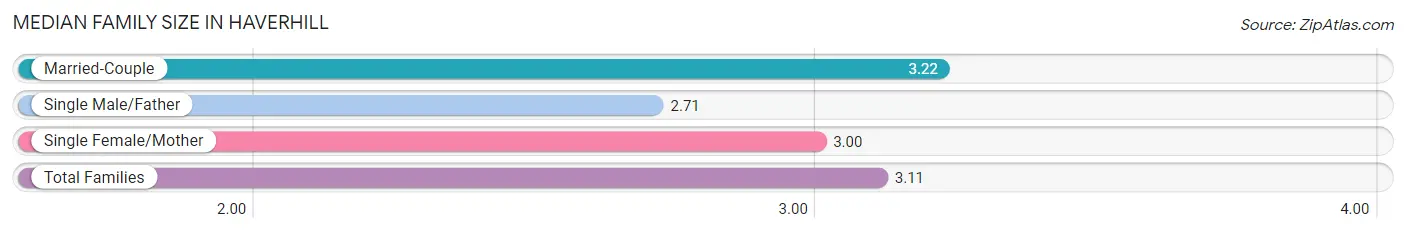
| Family Type | # Families | Family Size |
| Married-Couple | 10,930 (65.9%) | 3.22 |
| Single Male/Father | 1,576 (9.5%) | 2.71 |
| Single Female/Mother | 4,079 (24.6%) | 3.00 |
| Total Families | 16,585 (100.0%) | 3.11 |
Median Household Size in Haverhill
The median household size in Haverhill is 2.55 persons per household, with single female/mother households (4,079 | 15.7%) accounting for the largest median household size of 3.29 persons per household. non-family households (9,391 | 36.1%) represent the smallest median household size with 1.32 persons per household.
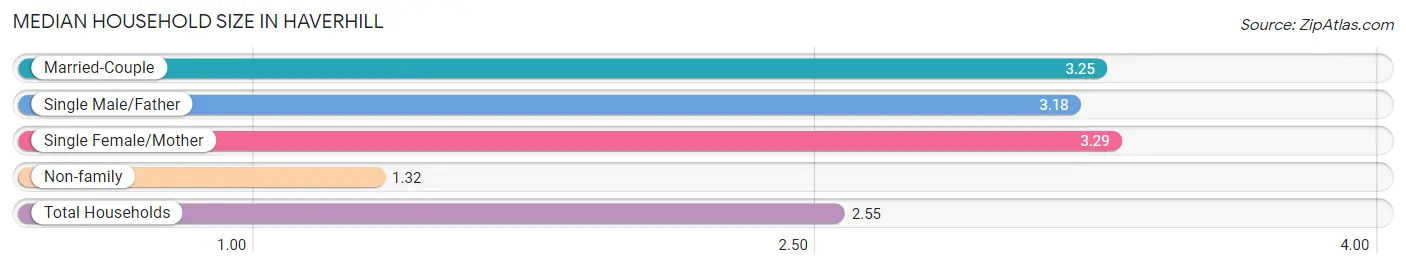
| Household Type | # Households | Household Size |
| Married-Couple | 10,930 (42.1%) | 3.25 |
| Single Male/Father | 1,576 (6.1%) | 3.18 |
| Single Female/Mother | 4,079 (15.7%) | 3.29 |
| Non-family | 9,391 (36.1%) | 1.32 |
| Total Households | 25,976 (100.0%) | 2.55 |
Household Size by Marriage Status in Haverhill
Out of a total of 25,976 households in Haverhill, 16,585 (63.8%) are family households, while 9,391 (36.1%) are nonfamily households. The most numerous type of family households are 2-person households, comprising 6,193, and the most common type of nonfamily households are 1-person households, comprising 6,866.
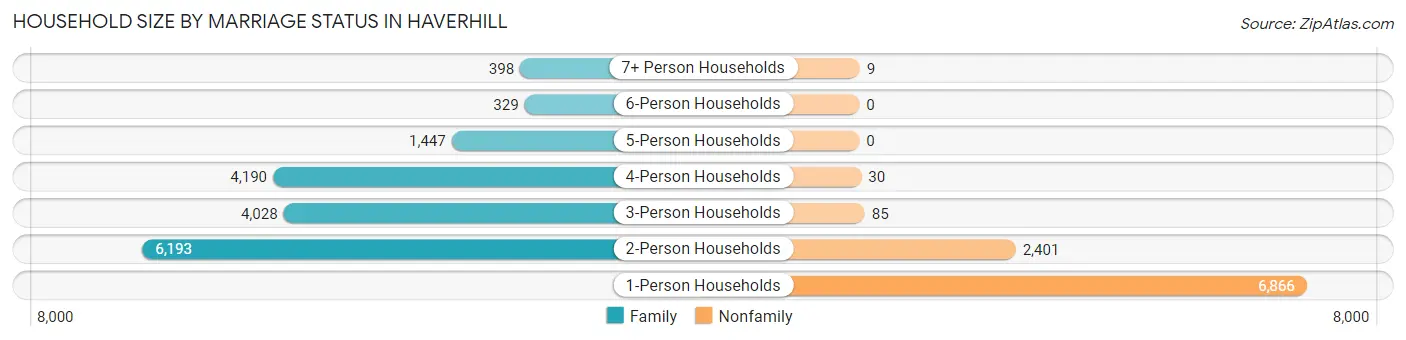
| Household Size | Family Households | Nonfamily Households |
| 1-Person Households | - | 6,866 (26.4%) |
| 2-Person Households | 6,193 (23.8%) | 2,401 (9.2%) |
| 3-Person Households | 4,028 (15.5%) | 85 (0.3%) |
| 4-Person Households | 4,190 (16.1%) | 30 (0.1%) |
| 5-Person Households | 1,447 (5.6%) | 0 (0.0%) |
| 6-Person Households | 329 (1.3%) | 0 (0.0%) |
| 7+ Person Households | 398 (1.5%) | 9 (0.0%) |
| Total | 16,585 (63.8%) | 9,391 (36.1%) |
Female Fertility in Haverhill
Fertility by Age in Haverhill
Average fertility rate in Haverhill is 56.0 births per 1,000 women. Women in the age bracket of 20 to 34 years have the highest fertility rate with 95.0 births per 1,000 women. Women in the age bracket of 20 to 34 years acount for 75.8% of all women with births.
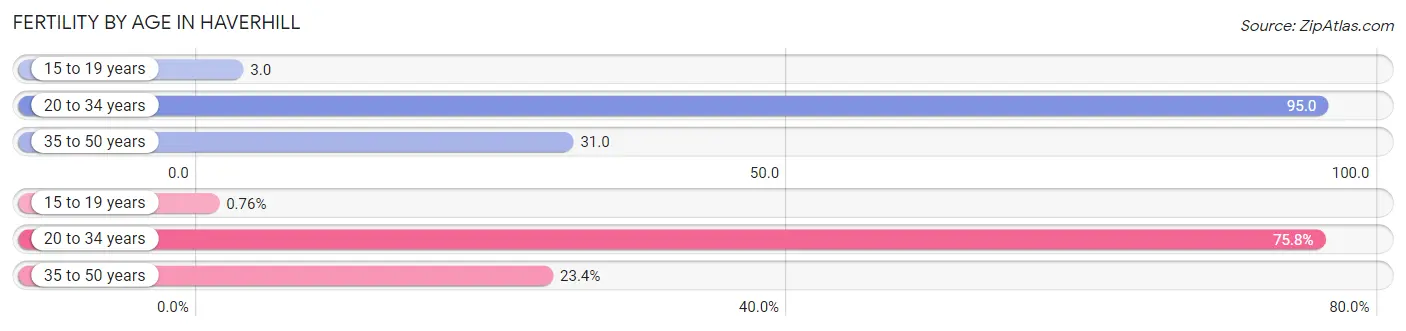
| Age Bracket | Women with Births | Births / 1,000 Women |
| 15 to 19 years | 7 (0.8%) | 3.0 |
| 20 to 34 years | 696 (75.8%) | 95.0 |
| 35 to 50 years | 215 (23.4%) | 31.0 |
| Total | 918 (100.0%) | 56.0 |
Fertility by Age by Marriage Status in Haverhill
55.0% of women with births (918) in Haverhill are married. The highest percentage of unmarried women with births falls into 15 to 19 years age bracket with 100.0% of them unmarried at the time of birth, while the lowest percentage of unmarried women with births belong to 35 to 50 years age bracket with 38.6% of them unmarried.
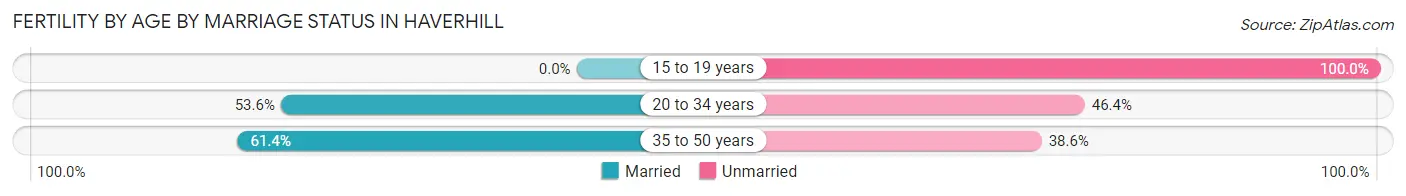
| Age Bracket | Married | Unmarried |
| 15 to 19 years | 0 (0.0%) | 7 (100.0%) |
| 20 to 34 years | 373 (53.6%) | 323 (46.4%) |
| 35 to 50 years | 132 (61.4%) | 83 (38.6%) |
| Total | 505 (55.0%) | 413 (45.0%) |
Fertility by Education in Haverhill
Average fertility rate in Haverhill is 56.0 births per 1,000 women. Women with the education attainment of graduate degree have the highest fertility rate of 67.0 births per 1,000 women, while women with the education attainment of less than high school have the lowest fertility at 27.0 births per 1,000 women. Women with the education attainment of college or associate's degree represent 37.6% of all women with births.
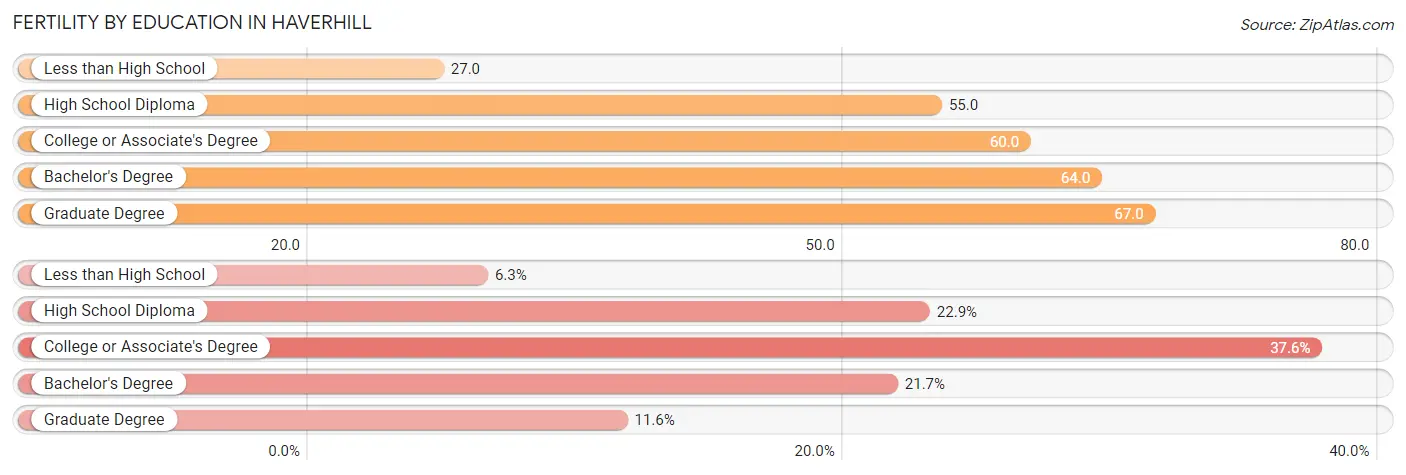
| Educational Attainment | Women with Births | Births / 1,000 Women |
| Less than High School | 58 (6.3%) | 27.0 |
| High School Diploma | 210 (22.9%) | 55.0 |
| College or Associate's Degree | 345 (37.6%) | 60.0 |
| Bachelor's Degree | 199 (21.7%) | 64.0 |
| Graduate Degree | 106 (11.6%) | 67.0 |
| Total | 918 (100.0%) | 56.0 |
Fertility by Education by Marriage Status in Haverhill
45.0% of women with births in Haverhill are unmarried. Women with the educational attainment of graduate degree are most likely to be married with 100.0% of them married at childbirth, while women with the educational attainment of less than high school are least likely to be married with 100.0% of them unmarried at childbirth.
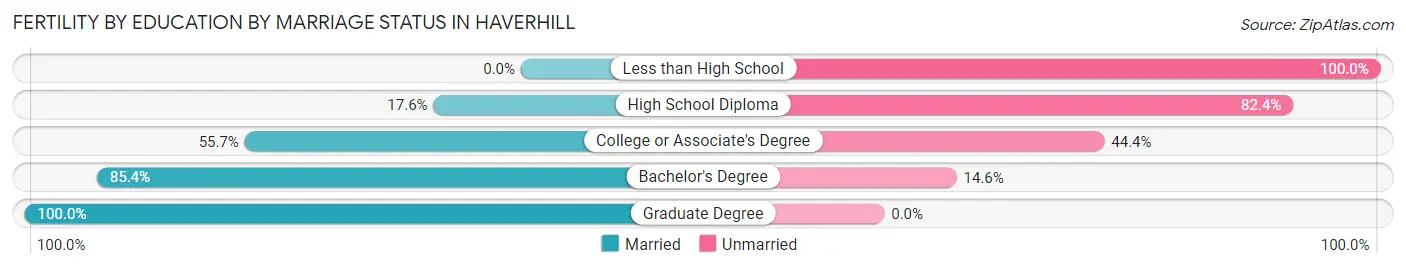
| Educational Attainment | Married | Unmarried |
| Less than High School | 0 (0.0%) | 58 (100.0%) |
| High School Diploma | 37 (17.6%) | 173 (82.4%) |
| College or Associate's Degree | 192 (55.6%) | 153 (44.4%) |
| Bachelor's Degree | 170 (85.4%) | 29 (14.6%) |
| Graduate Degree | 106 (100.0%) | 0 (0.0%) |
| Total | 505 (55.0%) | 413 (45.0%) |
Employment Characteristics in Haverhill
Employment by Class of Employer in Haverhill
Among the 34,590 employed individuals in Haverhill, private company employees (24,454 | 70.7%), not-for-profit organizations (3,504 | 10.1%), and local government employees (2,162 | 6.2%) make up the most common classes of employment.
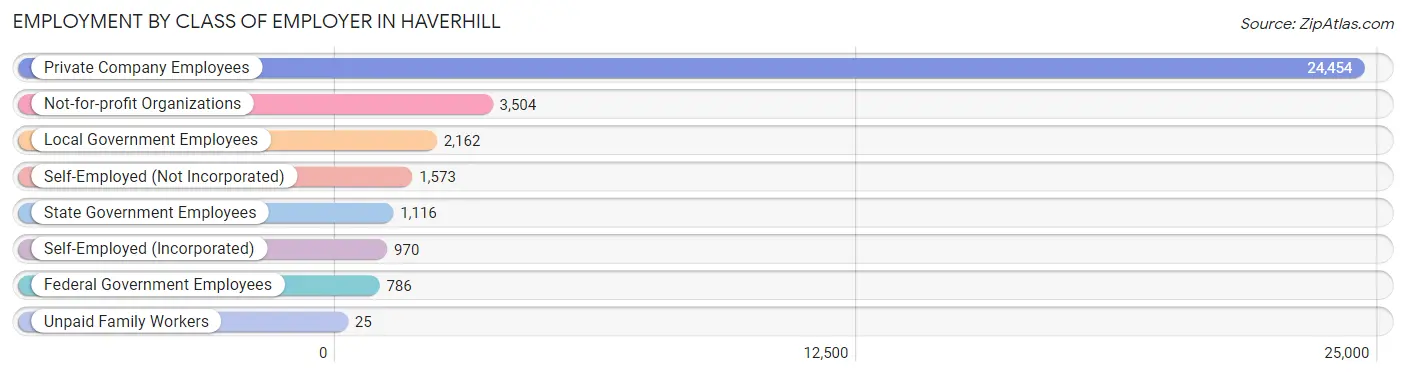
| Employer Class | # Employees | % Employees |
| Private Company Employees | 24,454 | 70.7% |
| Self-Employed (Incorporated) | 970 | 2.8% |
| Self-Employed (Not Incorporated) | 1,573 | 4.5% |
| Not-for-profit Organizations | 3,504 | 10.1% |
| Local Government Employees | 2,162 | 6.2% |
| State Government Employees | 1,116 | 3.2% |
| Federal Government Employees | 786 | 2.3% |
| Unpaid Family Workers | 25 | 0.1% |
| Total | 34,590 | 100.0% |
Employment Status by Age in Haverhill
According to the labor force statistics for Haverhill, out of the total population over 16 years of age (54,602), 69.8% or 38,112 individuals are in the labor force, with 6.0% or 2,287 of them unemployed. The age group with the highest labor force participation rate is 30 to 34 years, with 92.4% or 4,446 individuals in the labor force. Within the labor force, the 16 to 19 years age range has the highest percentage of unemployed individuals, with 17.3% or 325 of them being unemployed.
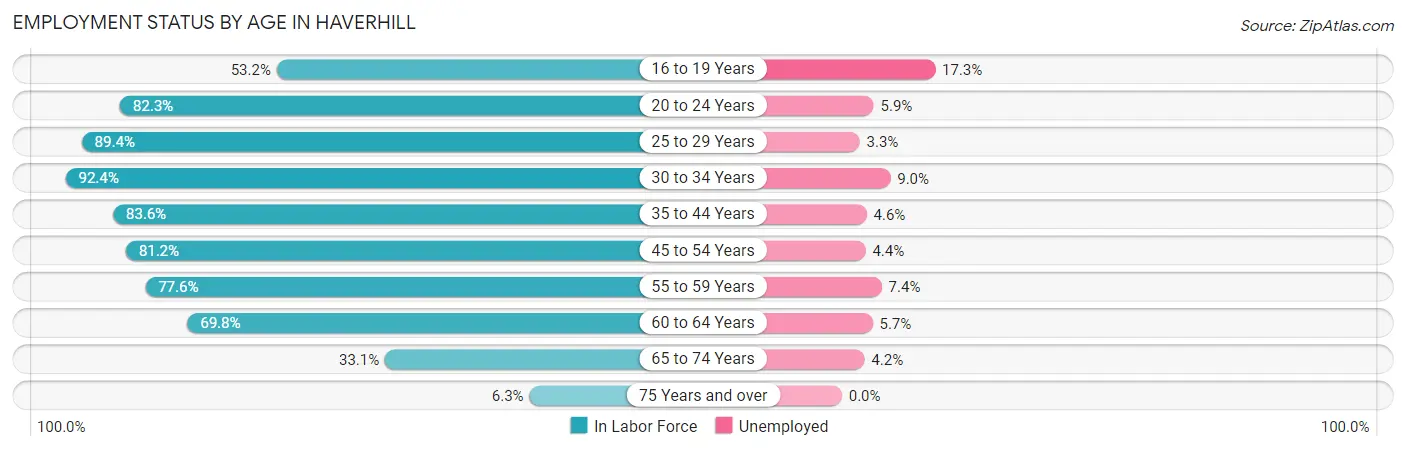
| Age Bracket | In Labor Force | Unemployed |
| 16 to 19 Years | 1,880 (53.2%) | 325 (17.3%) |
| 20 to 24 Years | 3,803 (82.3%) | 224 (5.9%) |
| 25 to 29 Years | 4,626 (89.4%) | 153 (3.3%) |
| 30 to 34 Years | 4,446 (92.4%) | 400 (9.0%) |
| 35 to 44 Years | 6,898 (83.6%) | 317 (4.6%) |
| 45 to 54 Years | 7,104 (81.2%) | 313 (4.4%) |
| 55 to 59 Years | 3,991 (77.6%) | 295 (7.4%) |
| 60 to 64 Years | 3,062 (69.8%) | 175 (5.7%) |
| 65 to 74 Years | 2,039 (33.1%) | 86 (4.2%) |
| 75 Years and over | 238 (6.3%) | 0 (0.0%) |
| Total | 38,112 (69.8%) | 2,287 (6.0%) |
Employment Status by Educational Attainment in Haverhill
According to labor force statistics for Haverhill, 82.5% of individuals (30,126) out of the total population between 25 and 64 years of age (36,516) are in the labor force, with 5.5% or 1,657 of them being unemployed. The group with the highest labor force participation rate are those with the educational attainment of bachelor's degree or higher, with 92.1% or 10,405 individuals in the labor force. Within the labor force, individuals with less than high school education have the highest percentage of unemployment, with 12.7% or 223 of them being unemployed.
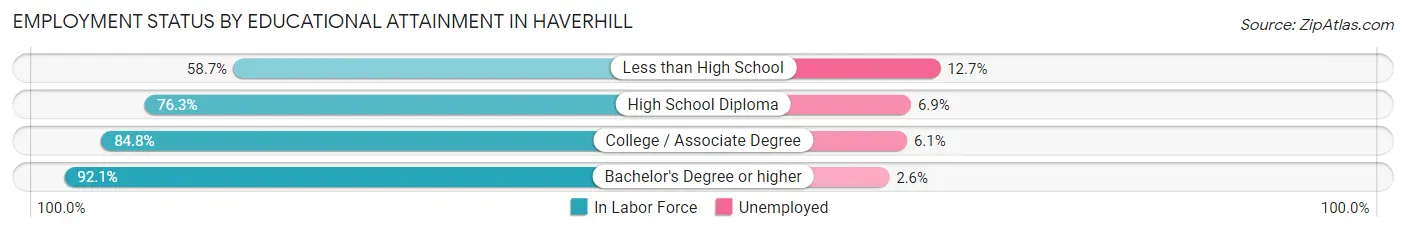
| Educational Attainment | In Labor Force | Unemployed |
| Less than High School | 1,759 (58.7%) | 381 (12.7%) |
| High School Diploma | 7,876 (76.3%) | 712 (6.9%) |
| College / Associate Degree | 10,090 (84.8%) | 726 (6.1%) |
| Bachelor's Degree or higher | 10,405 (92.1%) | 294 (2.6%) |
| Total | 30,126 (82.5%) | 2,008 (5.5%) |
Employment Occupations by Sex in Haverhill
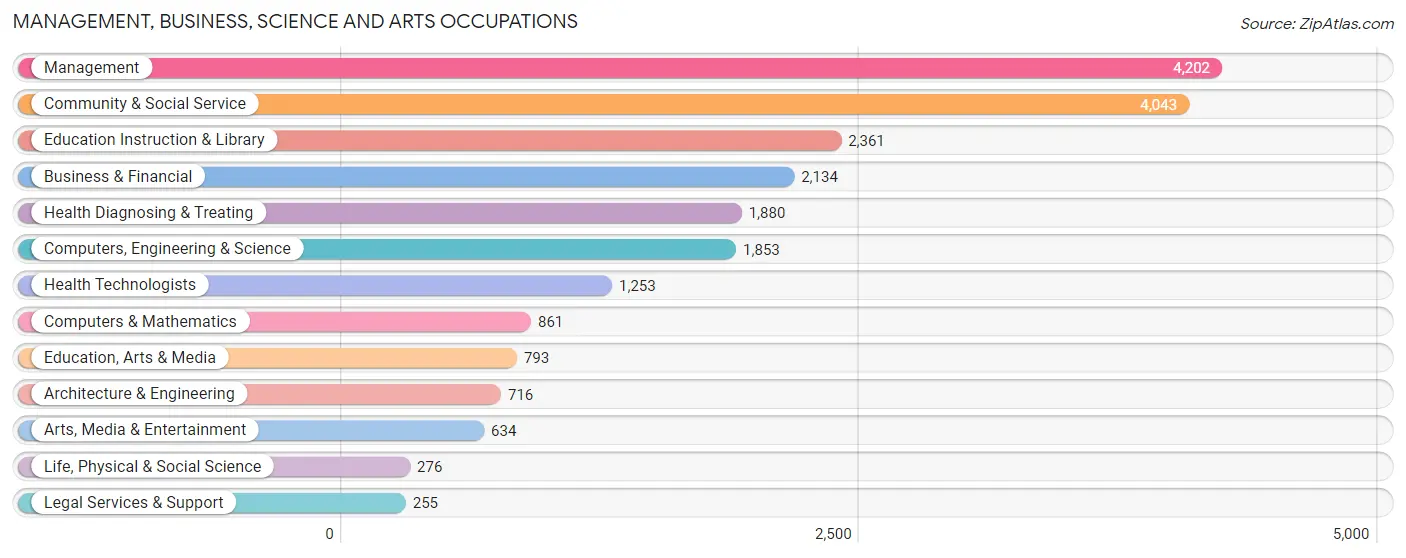
Management, Business, Science and Arts Occupations
The most common Management, Business, Science and Arts occupations in Haverhill are Management (4,202 | 11.7%), Community & Social Service (4,043 | 11.3%), Education Instruction & Library (2,361 | 6.6%), Business & Financial (2,134 | 6.0%), and Health Diagnosing & Treating (1,880 | 5.3%).
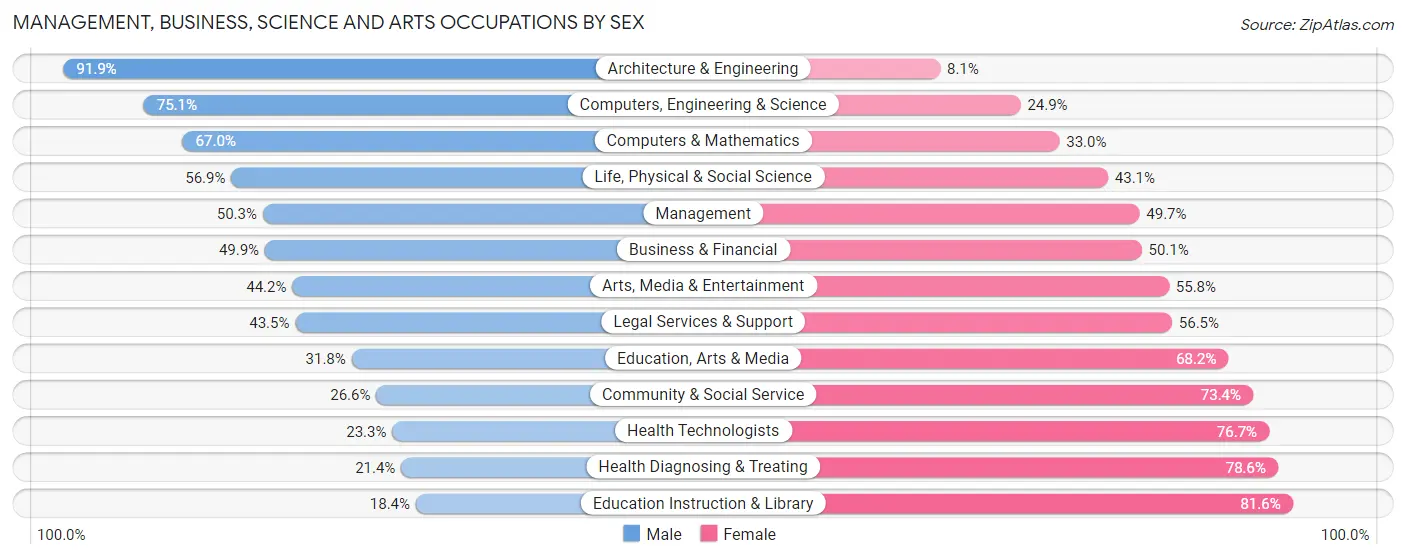
Management, Business, Science and Arts Occupations by Sex
Within the Management, Business, Science and Arts occupations in Haverhill, the most male-oriented occupations are Architecture & Engineering (91.9%), Computers, Engineering & Science (75.1%), and Computers & Mathematics (67.0%), while the most female-oriented occupations are Education Instruction & Library (81.6%), Health Diagnosing & Treating (78.6%), and Health Technologists (76.7%).
| Occupation | Male | Female |
| Management | 2,114 (50.3%) | 2,088 (49.7%) |
| Business & Financial | 1,064 (49.9%) | 1,070 (50.1%) |
| Computers, Engineering & Science | 1,392 (75.1%) | 461 (24.9%) |
| Computers & Mathematics | 577 (67.0%) | 284 (33.0%) |
| Architecture & Engineering | 658 (91.9%) | 58 (8.1%) |
| Life, Physical & Social Science | 157 (56.9%) | 119 (43.1%) |
| Community & Social Service | 1,077 (26.6%) | 2,966 (73.4%) |
| Education, Arts & Media | 252 (31.8%) | 541 (68.2%) |
| Legal Services & Support | 111 (43.5%) | 144 (56.5%) |
| Education Instruction & Library | 434 (18.4%) | 1,927 (81.6%) |
| Arts, Media & Entertainment | 280 (44.2%) | 354 (55.8%) |
| Health Diagnosing & Treating | 403 (21.4%) | 1,477 (78.6%) |
| Health Technologists | 292 (23.3%) | 961 (76.7%) |
| Total (Category) | 6,050 (42.9%) | 8,062 (57.1%) |
| Total (Overall) | 17,740 (49.6%) | 18,016 (50.4%) |
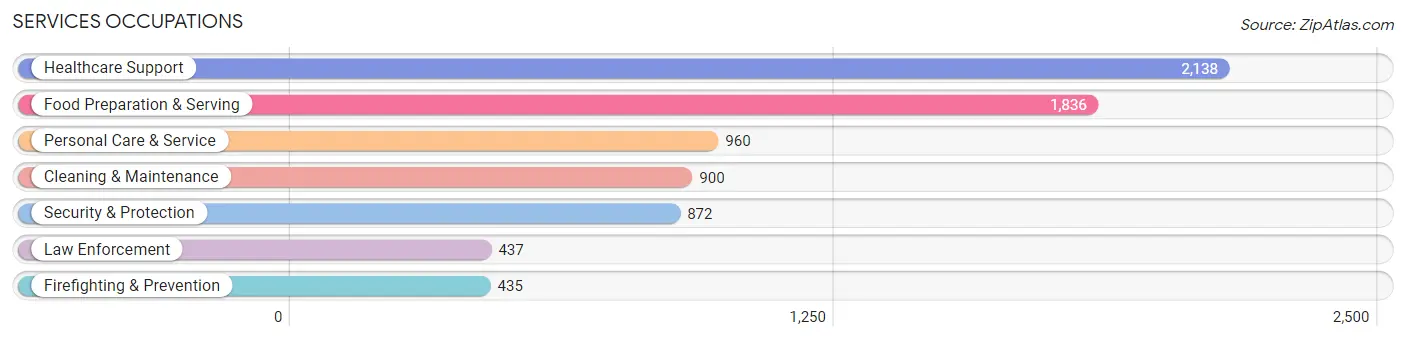
Services Occupations
The most common Services occupations in Haverhill are Healthcare Support (2,138 | 6.0%), Food Preparation & Serving (1,836 | 5.1%), Personal Care & Service (960 | 2.7%), Cleaning & Maintenance (900 | 2.5%), and Security & Protection (872 | 2.4%).
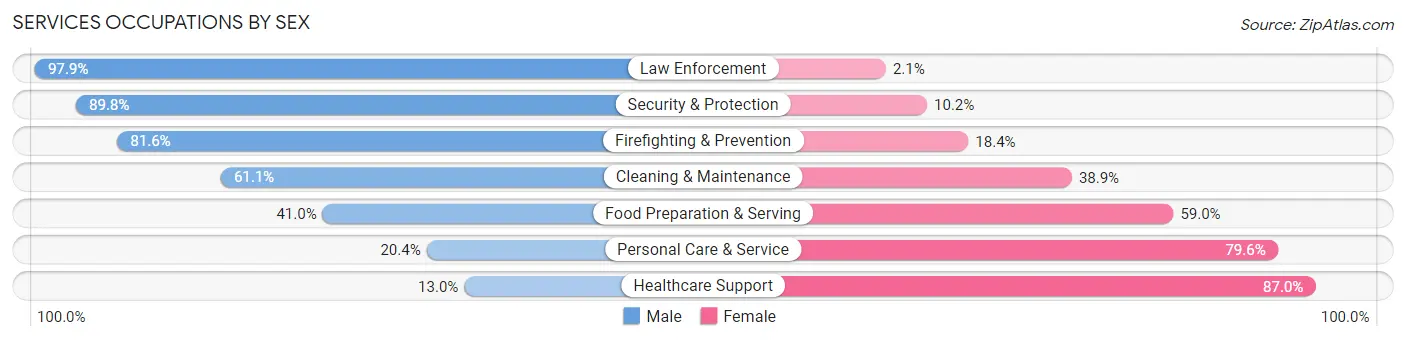
Services Occupations by Sex
Within the Services occupations in Haverhill, the most male-oriented occupations are Law Enforcement (97.9%), Security & Protection (89.8%), and Firefighting & Prevention (81.6%), while the most female-oriented occupations are Healthcare Support (87.0%), Personal Care & Service (79.6%), and Food Preparation & Serving (59.0%).
| Occupation | Male | Female |
| Healthcare Support | 277 (13.0%) | 1,861 (87.0%) |
| Security & Protection | 783 (89.8%) | 89 (10.2%) |
| Firefighting & Prevention | 355 (81.6%) | 80 (18.4%) |
| Law Enforcement | 428 (97.9%) | 9 (2.1%) |
| Food Preparation & Serving | 753 (41.0%) | 1,083 (59.0%) |
| Cleaning & Maintenance | 550 (61.1%) | 350 (38.9%) |
| Personal Care & Service | 196 (20.4%) | 764 (79.6%) |
| Total (Category) | 2,559 (38.2%) | 4,147 (61.8%) |
| Total (Overall) | 17,740 (49.6%) | 18,016 (50.4%) |
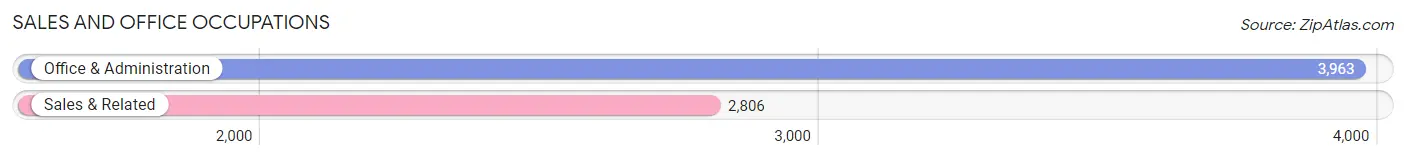
Sales and Office Occupations
The most common Sales and Office occupations in Haverhill are Office & Administration (3,963 | 11.1%), and Sales & Related (2,806 | 7.9%).
Sales and Office Occupations by Sex
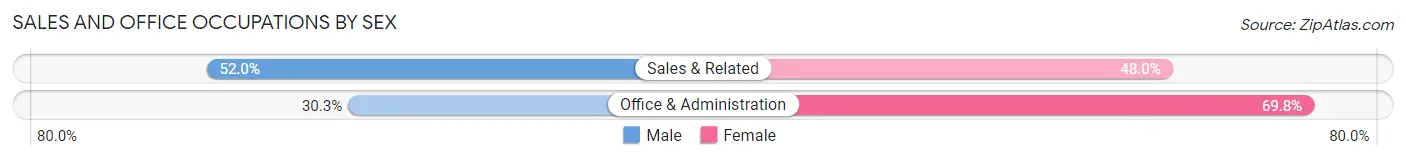
| Occupation | Male | Female |
| Sales & Related | 1,459 (52.0%) | 1,347 (48.0%) |
| Office & Administration | 1,199 (30.2%) | 2,764 (69.8%) |
| Total (Category) | 2,658 (39.3%) | 4,111 (60.7%) |
| Total (Overall) | 17,740 (49.6%) | 18,016 (50.4%) |
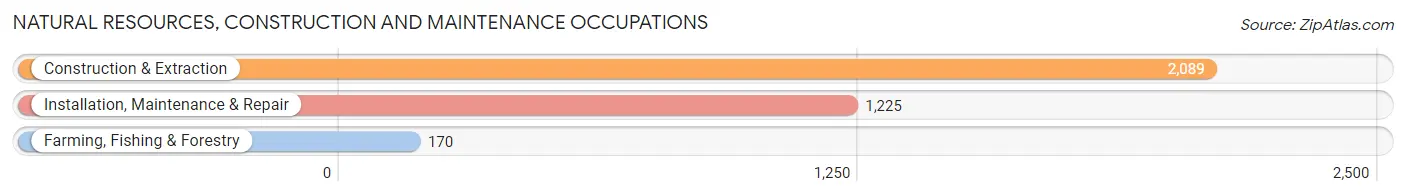
Natural Resources, Construction and Maintenance Occupations
The most common Natural Resources, Construction and Maintenance occupations in Haverhill are Construction & Extraction (2,089 | 5.8%), Installation, Maintenance & Repair (1,225 | 3.4%), and Farming, Fishing & Forestry (170 | 0.5%).
Natural Resources, Construction and Maintenance Occupations by Sex
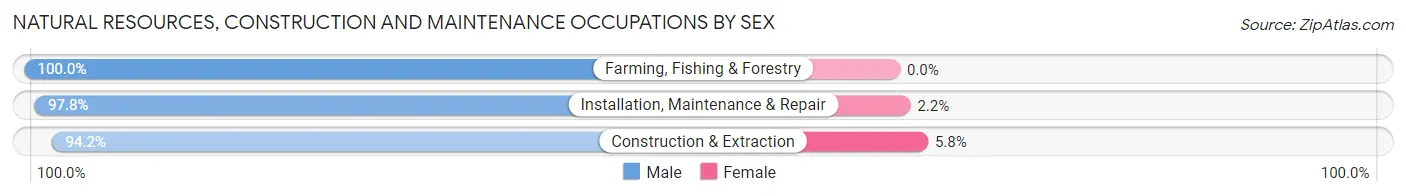
| Occupation | Male | Female |
| Farming, Fishing & Forestry | 170 (100.0%) | 0 (0.0%) |
| Construction & Extraction | 1,967 (94.2%) | 122 (5.8%) |
| Installation, Maintenance & Repair | 1,198 (97.8%) | 27 (2.2%) |
| Total (Category) | 3,335 (95.7%) | 149 (4.3%) |
| Total (Overall) | 17,740 (49.6%) | 18,016 (50.4%) |
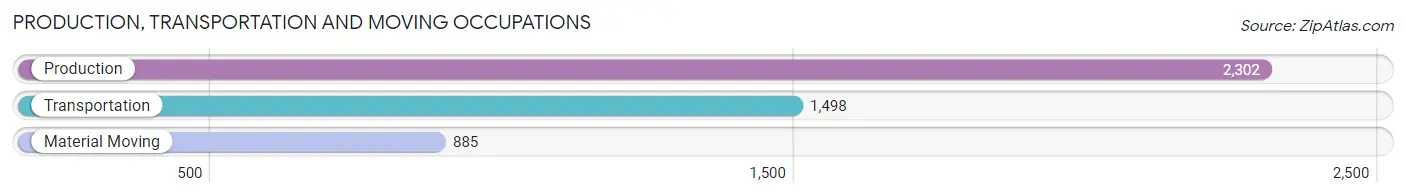
Production, Transportation and Moving Occupations
The most common Production, Transportation and Moving occupations in Haverhill are Production (2,302 | 6.4%), Transportation (1,498 | 4.2%), and Material Moving (885 | 2.5%).
Production, Transportation and Moving Occupations by Sex
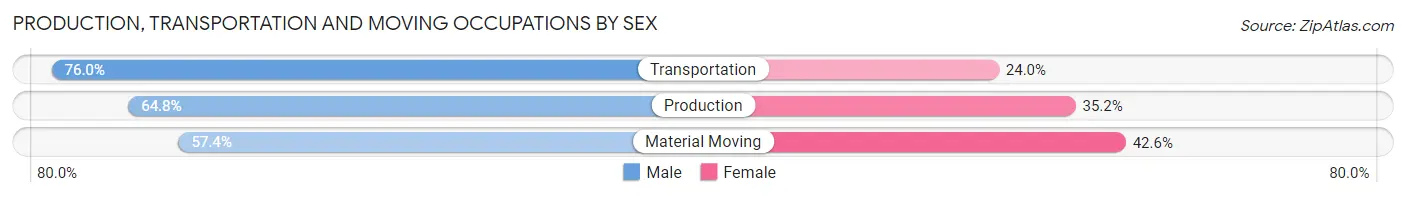
| Occupation | Male | Female |
| Production | 1,491 (64.8%) | 811 (35.2%) |
| Transportation | 1,139 (76.0%) | 359 (24.0%) |
| Material Moving | 508 (57.4%) | 377 (42.6%) |
| Total (Category) | 3,138 (67.0%) | 1,547 (33.0%) |
| Total (Overall) | 17,740 (49.6%) | 18,016 (50.4%) |
Employment Industries by Sex in Haverhill
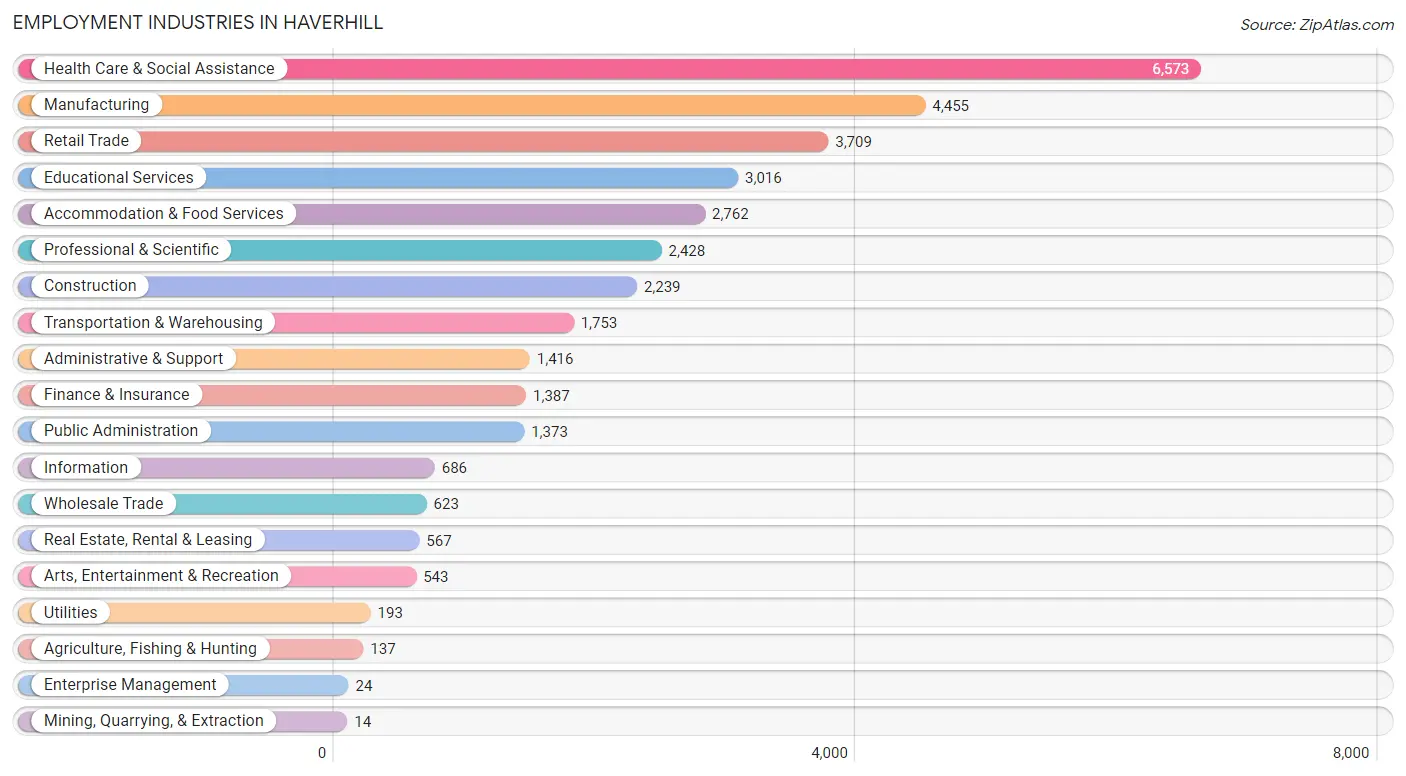
Employment Industries in Haverhill
The major employment industries in Haverhill include Health Care & Social Assistance (6,573 | 18.4%), Manufacturing (4,455 | 12.5%), Retail Trade (3,709 | 10.4%), Educational Services (3,016 | 8.4%), and Accommodation & Food Services (2,762 | 7.7%).
Employment Industries by Sex in Haverhill
The Haverhill industries that see more men than women are Agriculture, Fishing & Hunting (100.0%), Mining, Quarrying, & Extraction (100.0%), and Utilities (94.8%), whereas the industries that tend to have a higher number of women are Health Care & Social Assistance (79.2%), Educational Services (69.6%), and Finance & Insurance (61.5%).
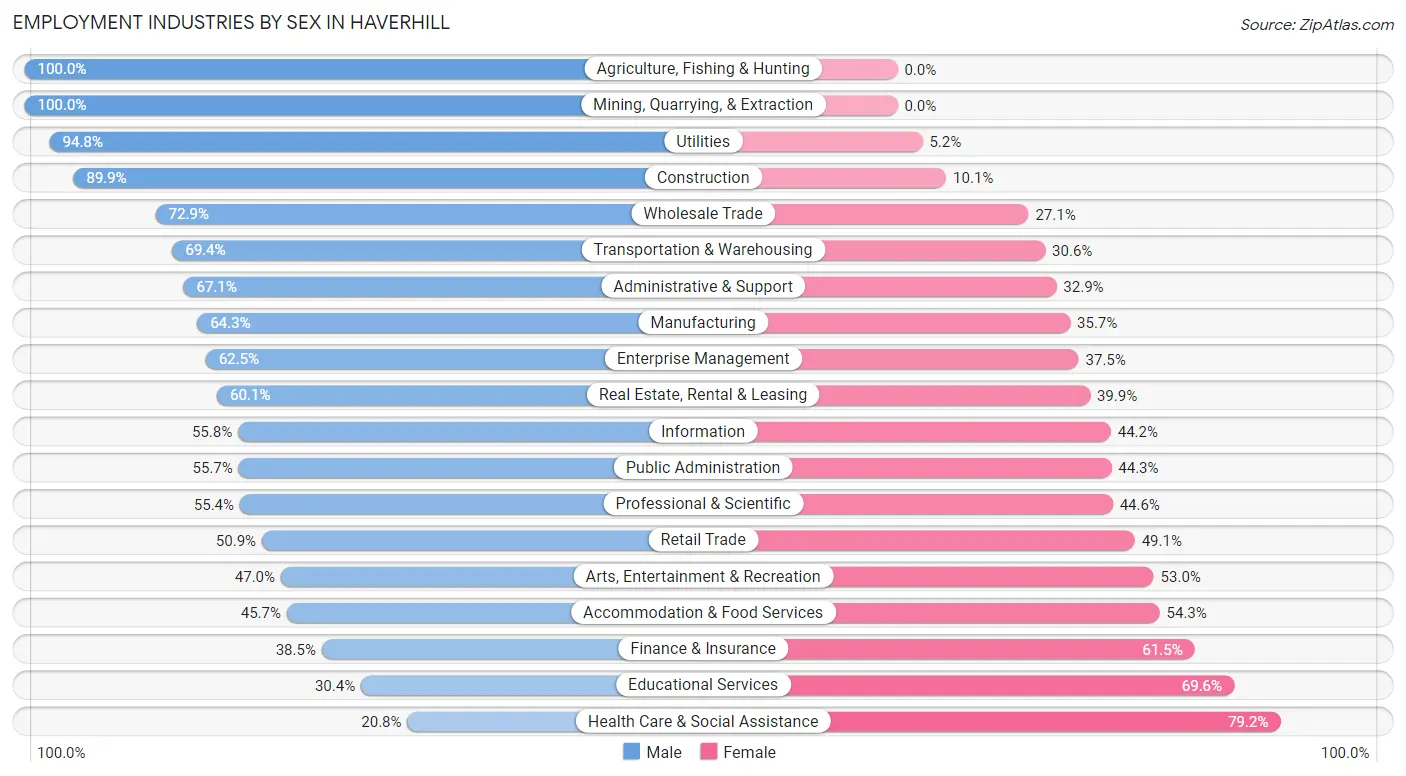
| Industry | Male | Female |
| Agriculture, Fishing & Hunting | 137 (100.0%) | 0 (0.0%) |
| Mining, Quarrying, & Extraction | 14 (100.0%) | 0 (0.0%) |
| Construction | 2,013 (89.9%) | 226 (10.1%) |
| Manufacturing | 2,863 (64.3%) | 1,592 (35.7%) |
| Wholesale Trade | 454 (72.9%) | 169 (27.1%) |
| Retail Trade | 1,887 (50.9%) | 1,822 (49.1%) |
| Transportation & Warehousing | 1,217 (69.4%) | 536 (30.6%) |
| Utilities | 183 (94.8%) | 10 (5.2%) |
| Information | 383 (55.8%) | 303 (44.2%) |
| Finance & Insurance | 534 (38.5%) | 853 (61.5%) |
| Real Estate, Rental & Leasing | 341 (60.1%) | 226 (39.9%) |
| Professional & Scientific | 1,346 (55.4%) | 1,082 (44.6%) |
| Enterprise Management | 15 (62.5%) | 9 (37.5%) |
| Administrative & Support | 950 (67.1%) | 466 (32.9%) |
| Educational Services | 916 (30.4%) | 2,100 (69.6%) |
| Health Care & Social Assistance | 1,365 (20.8%) | 5,208 (79.2%) |
| Arts, Entertainment & Recreation | 255 (47.0%) | 288 (53.0%) |
| Accommodation & Food Services | 1,263 (45.7%) | 1,499 (54.3%) |
| Public Administration | 765 (55.7%) | 608 (44.3%) |
| Total | 17,740 (49.6%) | 18,016 (50.4%) |
Education in Haverhill
School Enrollment in Haverhill
The most common levels of schooling among the 15,451 students in Haverhill are high school (3,894 | 25.2%), middle school (3,392 | 22.0%), and college / undergraduate (2,819 | 18.2%).
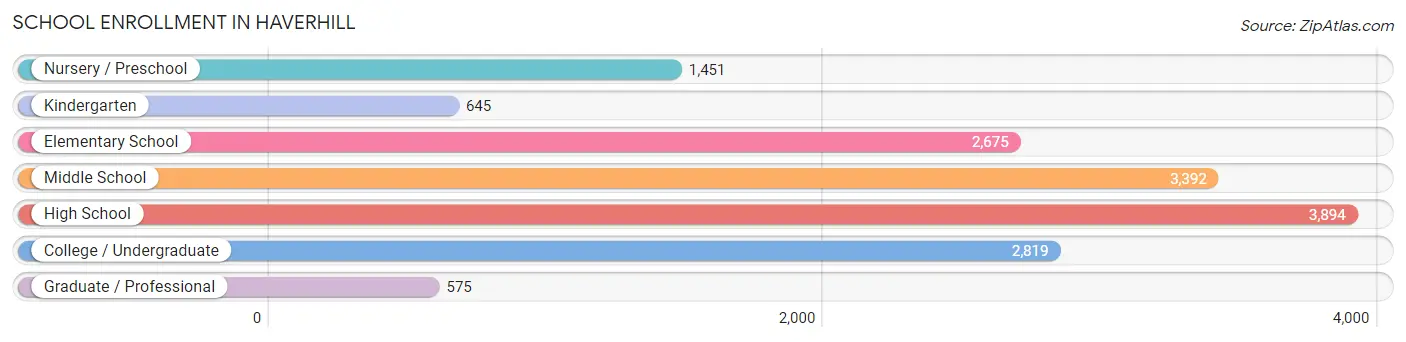
| School Level | # Students | % Students |
| Nursery / Preschool | 1,451 | 9.4% |
| Kindergarten | 645 | 4.2% |
| Elementary School | 2,675 | 17.3% |
| Middle School | 3,392 | 22.0% |
| High School | 3,894 | 25.2% |
| College / Undergraduate | 2,819 | 18.2% |
| Graduate / Professional | 575 | 3.7% |
| Total | 15,451 | 100.0% |
School Enrollment by Age by Funding Source in Haverhill
Out of a total of 15,451 students who are enrolled in schools in Haverhill, 3,322 (21.5%) attend a private institution, while the remaining 12,129 (78.5%) are enrolled in public schools. The age group of 3 to 4 year olds has the highest likelihood of being enrolled in private schools, with 522 (46.2% in the age bracket) enrolled. Conversely, the age group of 15 to 17 year olds has the lowest likelihood of being enrolled in a private school, with 2,311 (89.4% in the age bracket) attending a public institution.
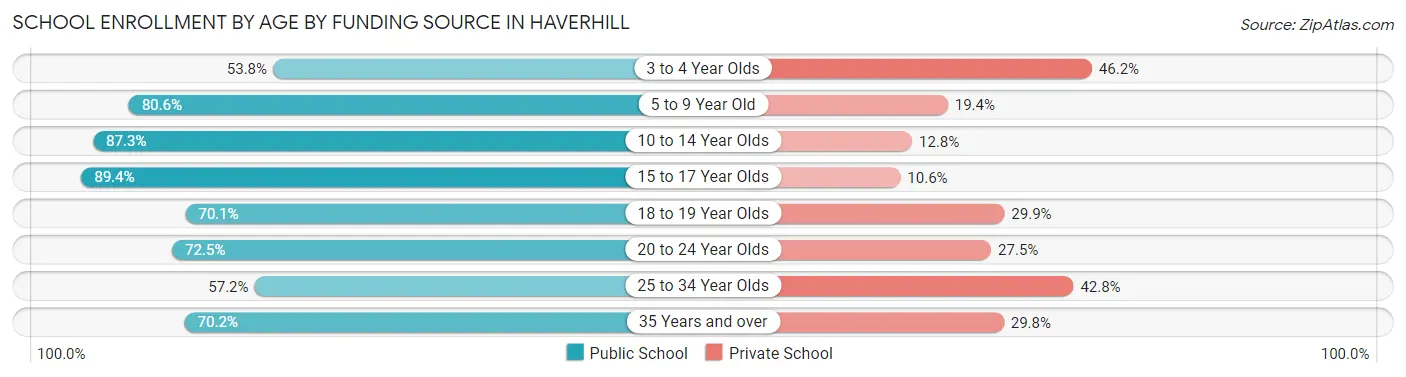
| Age Bracket | Public School | Private School |
| 3 to 4 Year Olds | 607 (53.8%) | 522 (46.2%) |
| 5 to 9 Year Old | 2,634 (80.6%) | 634 (19.4%) |
| 10 to 14 Year Olds | 3,772 (87.3%) | 551 (12.8%) |
| 15 to 17 Year Olds | 2,311 (89.4%) | 273 (10.6%) |
| 18 to 19 Year Olds | 880 (70.1%) | 376 (29.9%) |
| 20 to 24 Year Olds | 850 (72.5%) | 322 (27.5%) |
| 25 to 34 Year Olds | 592 (57.2%) | 443 (42.8%) |
| 35 Years and over | 480 (70.2%) | 204 (29.8%) |
| Total | 12,129 (78.5%) | 3,322 (21.5%) |
Educational Attainment by Field of Study in Haverhill
Business (2,709 | 18.0%), education (1,785 | 11.8%), arts & humanities (1,424 | 9.4%), social sciences (1,149 | 7.6%), and science & technology (1,088 | 7.2%) are the most common fields of study among 15,082 individuals in Haverhill who have obtained a bachelor's degree or higher.
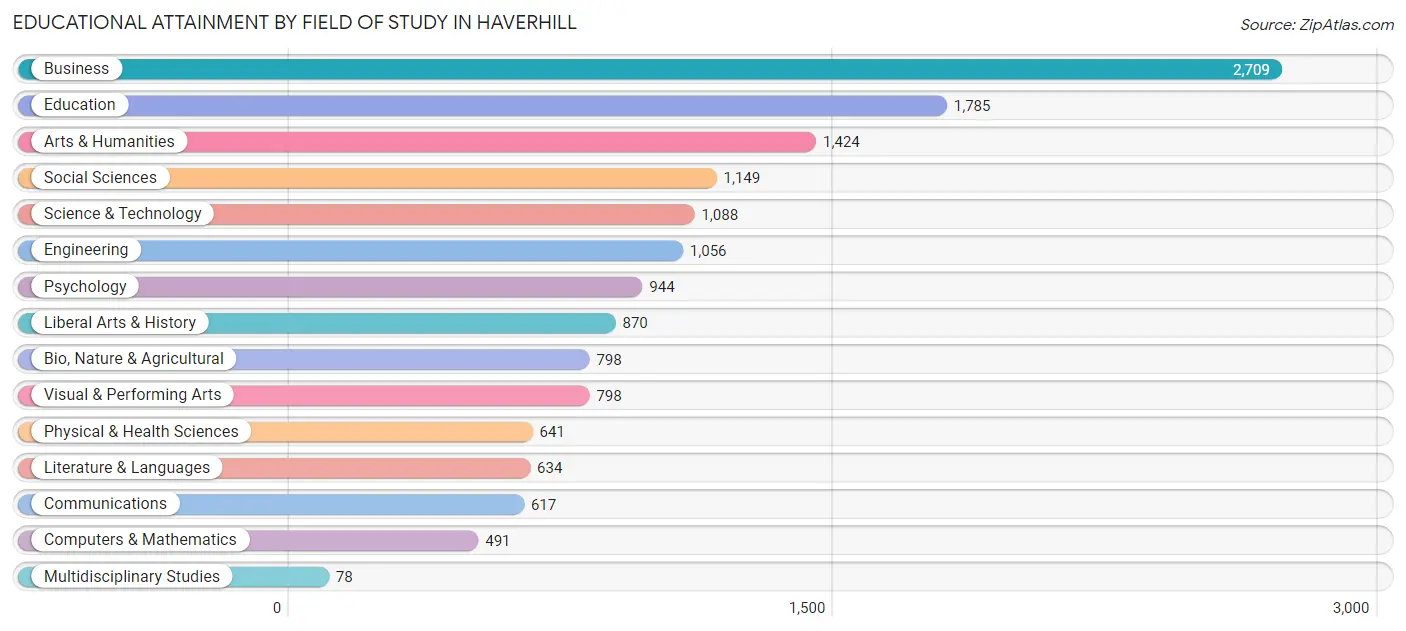
| Field of Study | # Graduates | % Graduates |
| Computers & Mathematics | 491 | 3.3% |
| Bio, Nature & Agricultural | 798 | 5.3% |
| Physical & Health Sciences | 641 | 4.3% |
| Psychology | 944 | 6.3% |
| Social Sciences | 1,149 | 7.6% |
| Engineering | 1,056 | 7.0% |
| Multidisciplinary Studies | 78 | 0.5% |
| Science & Technology | 1,088 | 7.2% |
| Business | 2,709 | 18.0% |
| Education | 1,785 | 11.8% |
| Literature & Languages | 634 | 4.2% |
| Liberal Arts & History | 870 | 5.8% |
| Visual & Performing Arts | 798 | 5.3% |
| Communications | 617 | 4.1% |
| Arts & Humanities | 1,424 | 9.4% |
| Total | 15,082 | 100.0% |
Transportation & Commute in Haverhill
Vehicle Availability by Sex in Haverhill
The most prevalent vehicle ownership categories in Haverhill are males with 2 vehicles (7,802, accounting for 45.3%) and females with 2 vehicles (7,529, making up 45.0%).
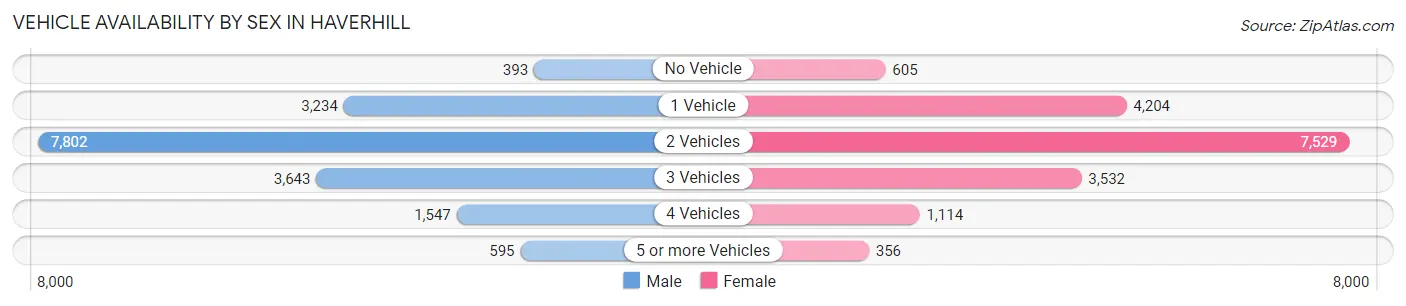
| Vehicles Available | Male | Female |
| No Vehicle | 393 (2.3%) | 605 (3.5%) |
| 1 Vehicle | 3,234 (18.8%) | 4,204 (24.2%) |
| 2 Vehicles | 7,802 (45.3%) | 7,529 (43.4%) |
| 3 Vehicles | 3,643 (21.2%) | 3,532 (20.4%) |
| 4 Vehicles | 1,547 (9.0%) | 1,114 (6.4%) |
| 5 or more Vehicles | 595 (3.5%) | 356 (2.1%) |
| Total | 17,214 (100.0%) | 17,340 (100.0%) |
Commute Time in Haverhill
The most frequently occuring commute durations in Haverhill are 10 to 14 minutes (5,223 commuters, 16.5%), 15 to 19 minutes (4,594 commuters, 14.5%), and 20 to 24 minutes (3,832 commuters, 12.1%).
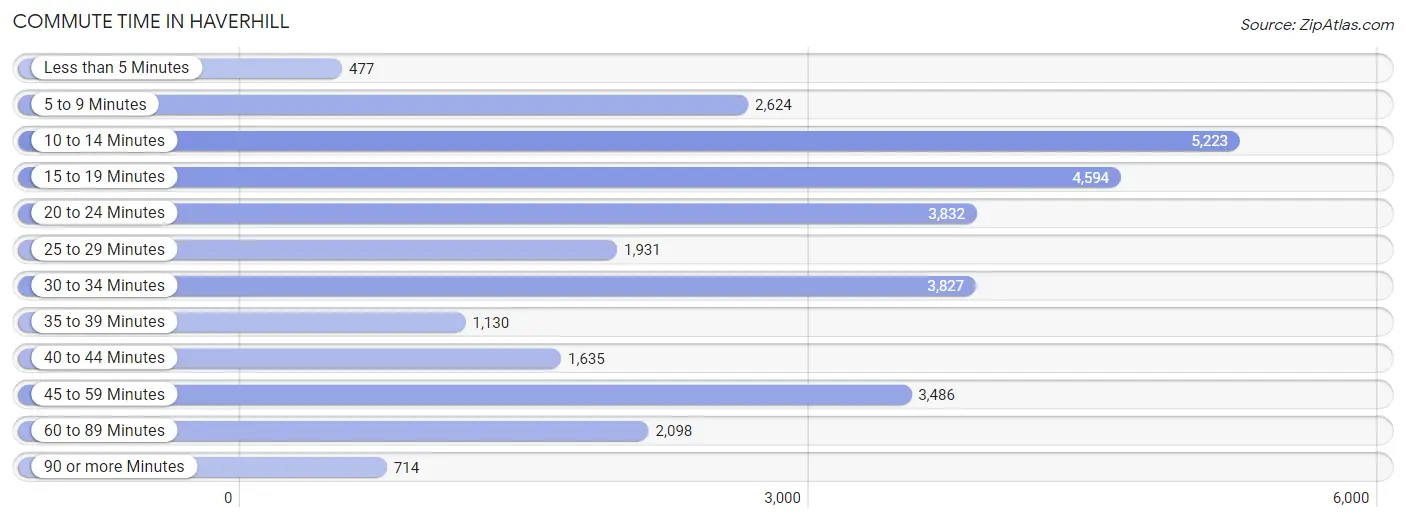
| Commute Time | # Commuters | % Commuters |
| Less than 5 Minutes | 477 | 1.5% |
| 5 to 9 Minutes | 2,624 | 8.3% |
| 10 to 14 Minutes | 5,223 | 16.5% |
| 15 to 19 Minutes | 4,594 | 14.5% |
| 20 to 24 Minutes | 3,832 | 12.1% |
| 25 to 29 Minutes | 1,931 | 6.1% |
| 30 to 34 Minutes | 3,827 | 12.1% |
| 35 to 39 Minutes | 1,130 | 3.6% |
| 40 to 44 Minutes | 1,635 | 5.2% |
| 45 to 59 Minutes | 3,486 | 11.0% |
| 60 to 89 Minutes | 2,098 | 6.7% |
| 90 or more Minutes | 714 | 2.3% |
Commute Time by Sex in Haverhill
The most common commute times in Haverhill are 15 to 19 minutes (2,188 commuters, 13.9%) for males and 10 to 14 minutes (3,240 commuters, 20.5%) for females.
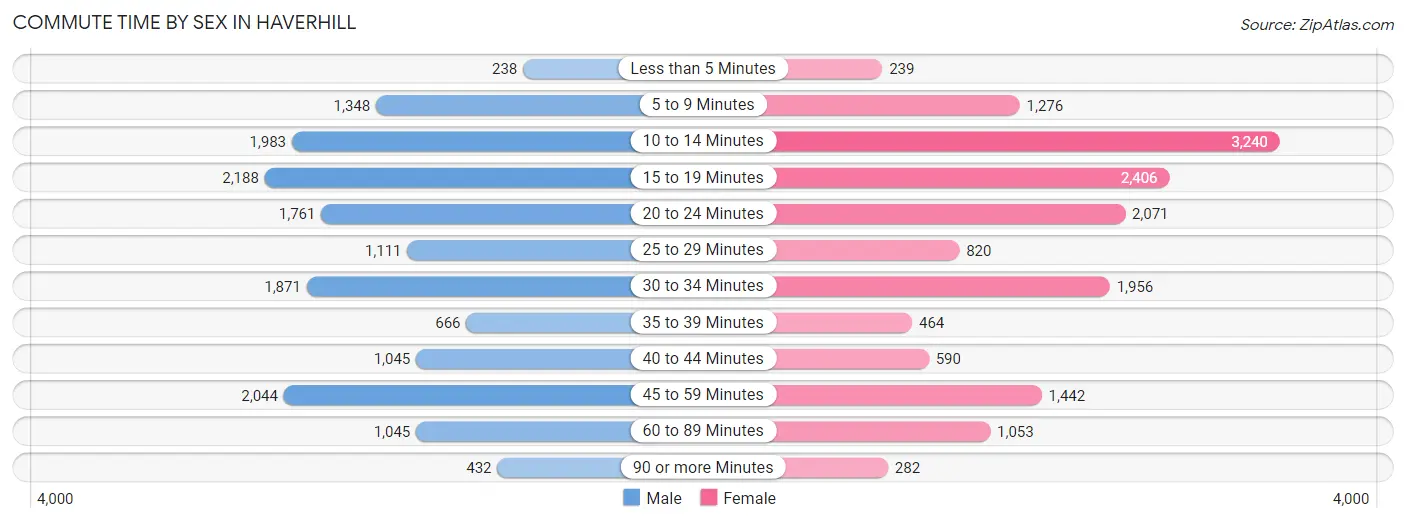
| Commute Time | Male | Female |
| Less than 5 Minutes | 238 (1.5%) | 239 (1.5%) |
| 5 to 9 Minutes | 1,348 (8.6%) | 1,276 (8.1%) |
| 10 to 14 Minutes | 1,983 (12.6%) | 3,240 (20.5%) |
| 15 to 19 Minutes | 2,188 (13.9%) | 2,406 (15.2%) |
| 20 to 24 Minutes | 1,761 (11.2%) | 2,071 (13.1%) |
| 25 to 29 Minutes | 1,111 (7.1%) | 820 (5.2%) |
| 30 to 34 Minutes | 1,871 (11.9%) | 1,956 (12.3%) |
| 35 to 39 Minutes | 666 (4.2%) | 464 (2.9%) |
| 40 to 44 Minutes | 1,045 (6.6%) | 590 (3.7%) |
| 45 to 59 Minutes | 2,044 (13.0%) | 1,442 (9.1%) |
| 60 to 89 Minutes | 1,045 (6.6%) | 1,053 (6.7%) |
| 90 or more Minutes | 432 (2.8%) | 282 (1.8%) |
Time of Departure to Work by Sex in Haverhill
The most frequent times of departure to work in Haverhill are 7:00 AM to 7:29 AM (1,835, 11.7%) for males and 7:00 AM to 7:29 AM (2,268, 14.3%) for females.
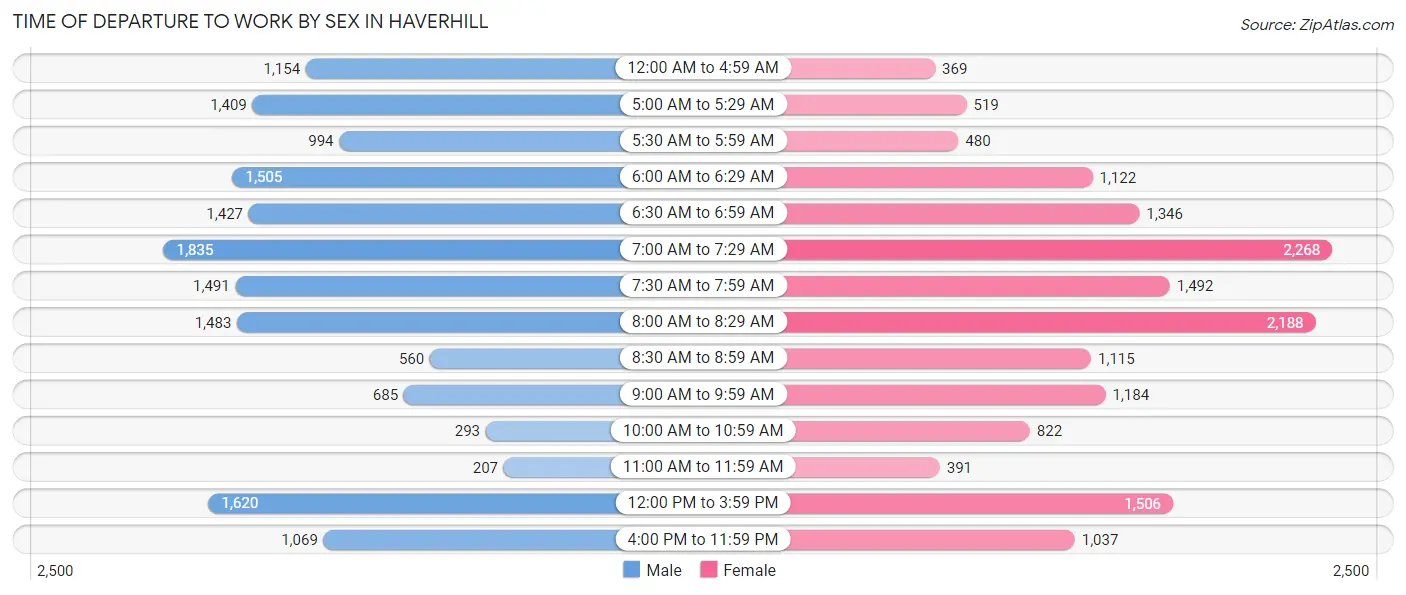
| Time of Departure | Male | Female |
| 12:00 AM to 4:59 AM | 1,154 (7.3%) | 369 (2.3%) |
| 5:00 AM to 5:29 AM | 1,409 (9.0%) | 519 (3.3%) |
| 5:30 AM to 5:59 AM | 994 (6.3%) | 480 (3.0%) |
| 6:00 AM to 6:29 AM | 1,505 (9.6%) | 1,122 (7.1%) |
| 6:30 AM to 6:59 AM | 1,427 (9.1%) | 1,346 (8.5%) |
| 7:00 AM to 7:29 AM | 1,835 (11.7%) | 2,268 (14.3%) |
| 7:30 AM to 7:59 AM | 1,491 (9.5%) | 1,492 (9.4%) |
| 8:00 AM to 8:29 AM | 1,483 (9.4%) | 2,188 (13.8%) |
| 8:30 AM to 8:59 AM | 560 (3.6%) | 1,115 (7.0%) |
| 9:00 AM to 9:59 AM | 685 (4.3%) | 1,184 (7.5%) |
| 10:00 AM to 10:59 AM | 293 (1.9%) | 822 (5.2%) |
| 11:00 AM to 11:59 AM | 207 (1.3%) | 391 (2.5%) |
| 12:00 PM to 3:59 PM | 1,620 (10.3%) | 1,506 (9.5%) |
| 4:00 PM to 11:59 PM | 1,069 (6.8%) | 1,037 (6.6%) |
| Total | 15,732 (100.0%) | 15,839 (100.0%) |
Housing Occupancy in Haverhill
Occupancy by Ownership in Haverhill
Of the total 25,976 dwellings in Haverhill, owner-occupied units account for 15,583 (60.0%), while renter-occupied units make up 10,393 (40.0%).
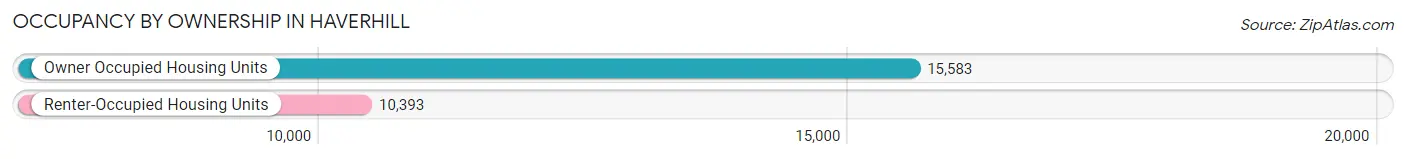
| Occupancy | # Housing Units | % Housing Units |
| Owner Occupied Housing Units | 15,583 | 60.0% |
| Renter-Occupied Housing Units | 10,393 | 40.0% |
| Total Occupied Housing Units | 25,976 | 100.0% |
Occupancy by Household Size in Haverhill
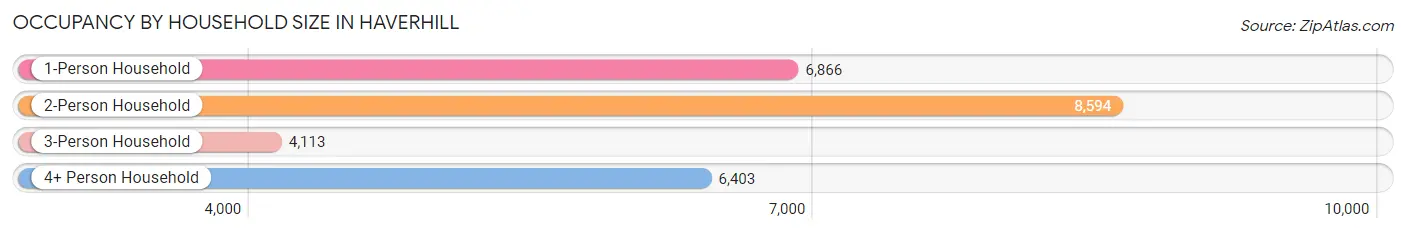
| Household Size | # Housing Units | % Housing Units |
| 1-Person Household | 6,866 | 26.4% |
| 2-Person Household | 8,594 | 33.1% |
| 3-Person Household | 4,113 | 15.8% |
| 4+ Person Household | 6,403 | 24.6% |
| Total Housing Units | 25,976 | 100.0% |
Occupancy by Ownership by Household Size in Haverhill
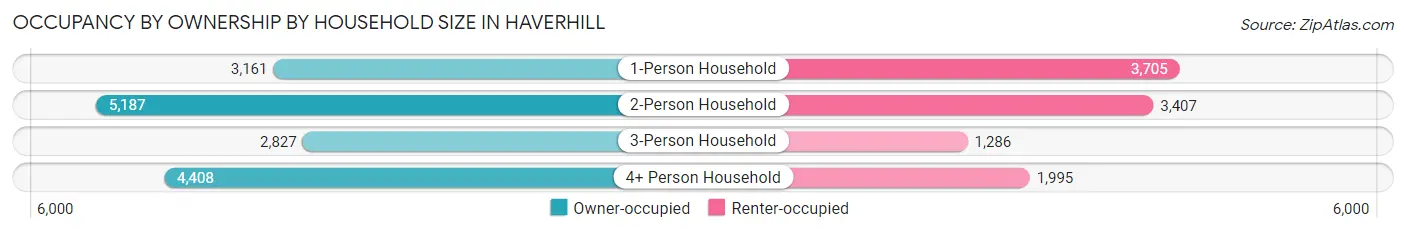
| Household Size | Owner-occupied | Renter-occupied |
| 1-Person Household | 3,161 (46.0%) | 3,705 (54.0%) |
| 2-Person Household | 5,187 (60.4%) | 3,407 (39.6%) |
| 3-Person Household | 2,827 (68.7%) | 1,286 (31.3%) |
| 4+ Person Household | 4,408 (68.8%) | 1,995 (31.2%) |
| Total Housing Units | 15,583 (60.0%) | 10,393 (40.0%) |
Occupancy by Educational Attainment in Haverhill
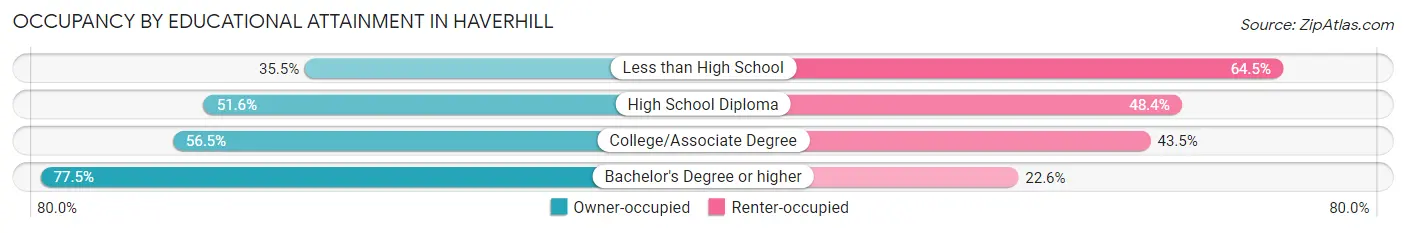
| Household Size | Owner-occupied | Renter-occupied |
| Less than High School | 807 (35.5%) | 1,465 (64.5%) |
| High School Diploma | 3,602 (51.6%) | 3,383 (48.4%) |
| College/Associate Degree | 4,779 (56.5%) | 3,683 (43.5%) |
| Bachelor's Degree or higher | 6,395 (77.4%) | 1,862 (22.6%) |
Occupancy by Age of Householder in Haverhill
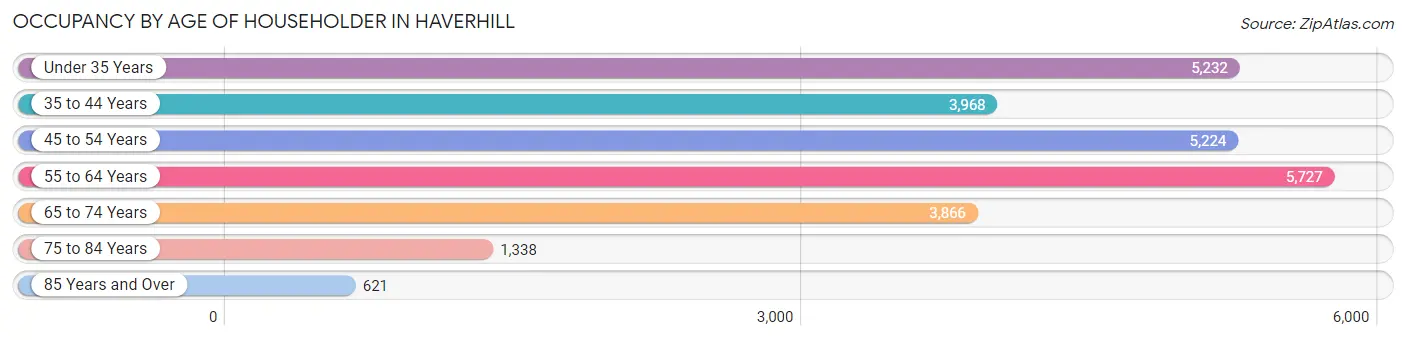
| Age Bracket | # Households | % Households |
| Under 35 Years | 5,232 | 20.1% |
| 35 to 44 Years | 3,968 | 15.3% |
| 45 to 54 Years | 5,224 | 20.1% |
| 55 to 64 Years | 5,727 | 22.1% |
| 65 to 74 Years | 3,866 | 14.9% |
| 75 to 84 Years | 1,338 | 5.1% |
| 85 Years and Over | 621 | 2.4% |
| Total | 25,976 | 100.0% |
Housing Finances in Haverhill
Median Income by Occupancy in Haverhill
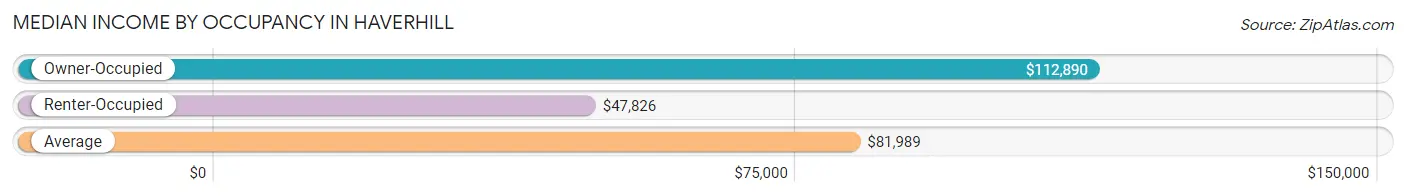
| Occupancy Type | # Households | Median Income |
| Owner-Occupied | 15,583 (60.0%) | $112,890 |
| Renter-Occupied | 10,393 (40.0%) | $47,826 |
| Average | 25,976 (100.0%) | $81,989 |
Occupancy by Householder Income Bracket in Haverhill
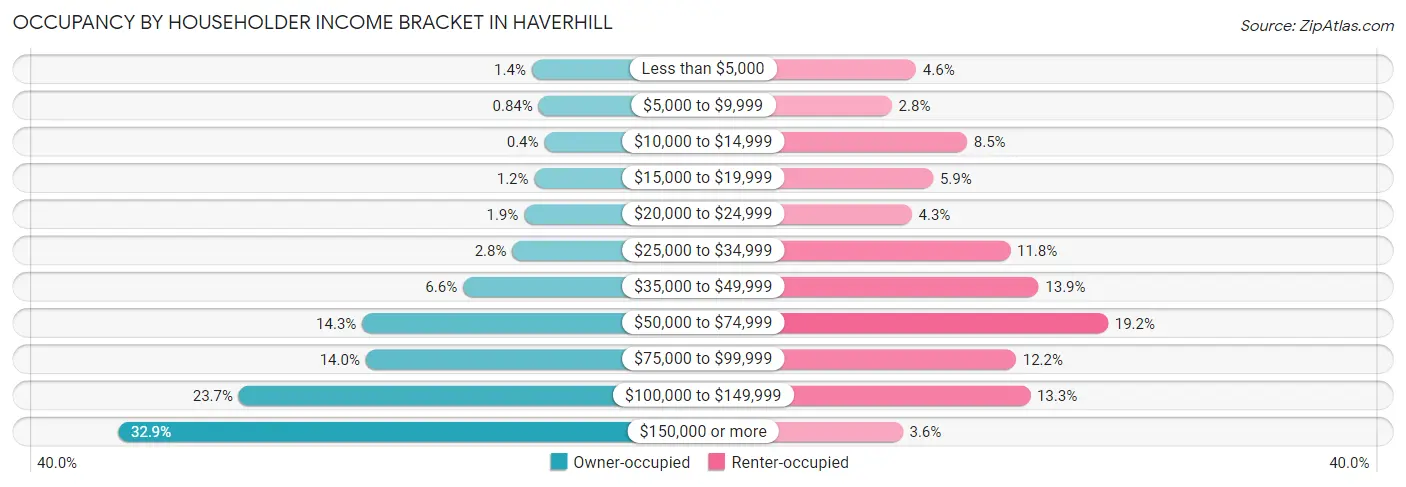
| Income Bracket | Owner-occupied | Renter-occupied |
| Less than $5,000 | 212 (1.4%) | 478 (4.6%) |
| $5,000 to $9,999 | 131 (0.8%) | 286 (2.8%) |
| $10,000 to $14,999 | 62 (0.4%) | 881 (8.5%) |
| $15,000 to $19,999 | 180 (1.2%) | 613 (5.9%) |
| $20,000 to $24,999 | 303 (1.9%) | 444 (4.3%) |
| $25,000 to $34,999 | 442 (2.8%) | 1,223 (11.8%) |
| $35,000 to $49,999 | 1,028 (6.6%) | 1,448 (13.9%) |
| $50,000 to $74,999 | 2,226 (14.3%) | 1,998 (19.2%) |
| $75,000 to $99,999 | 2,183 (14.0%) | 1,269 (12.2%) |
| $100,000 to $149,999 | 3,690 (23.7%) | 1,381 (13.3%) |
| $150,000 or more | 5,126 (32.9%) | 372 (3.6%) |
| Total | 15,583 (100.0%) | 10,393 (100.0%) |
Monthly Housing Cost Tiers in Haverhill
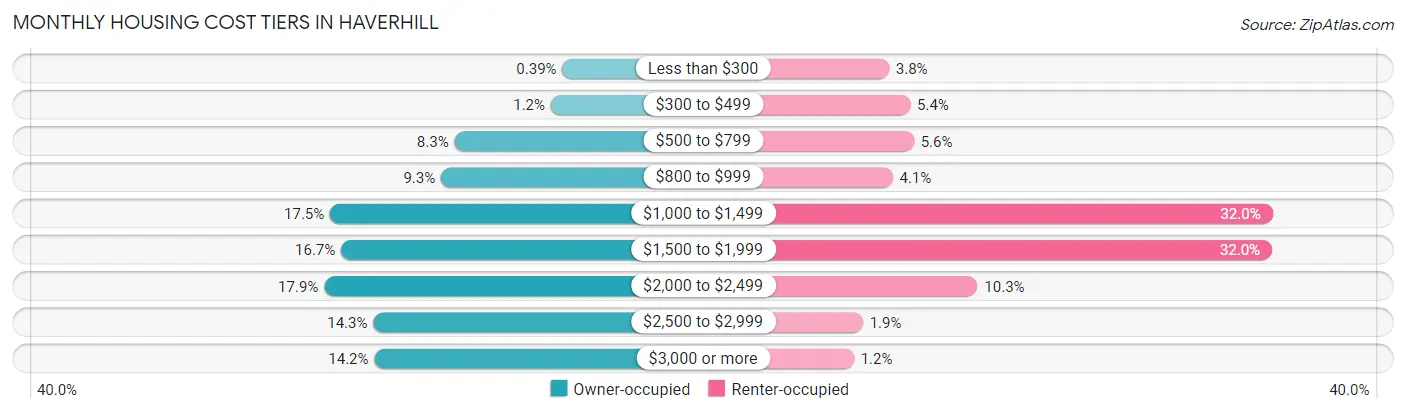
| Monthly Cost | Owner-occupied | Renter-occupied |
| Less than $300 | 61 (0.4%) | 394 (3.8%) |
| $300 to $499 | 194 (1.2%) | 556 (5.3%) |
| $500 to $799 | 1,300 (8.3%) | 584 (5.6%) |
| $800 to $999 | 1,454 (9.3%) | 422 (4.1%) |
| $1,000 to $1,499 | 2,727 (17.5%) | 3,330 (32.0%) |
| $1,500 to $1,999 | 2,601 (16.7%) | 3,326 (32.0%) |
| $2,000 to $2,499 | 2,795 (17.9%) | 1,072 (10.3%) |
| $2,500 to $2,999 | 2,232 (14.3%) | 193 (1.9%) |
| $3,000 or more | 2,219 (14.2%) | 125 (1.2%) |
| Total | 15,583 (100.0%) | 10,393 (100.0%) |
Physical Housing Characteristics in Haverhill
Housing Structures in Haverhill
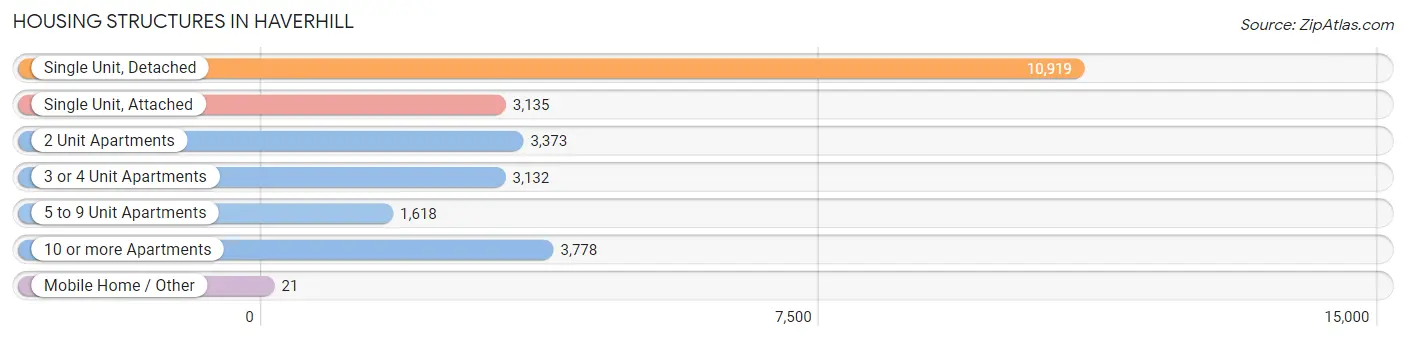
| Structure Type | # Housing Units | % Housing Units |
| Single Unit, Detached | 10,919 | 42.0% |
| Single Unit, Attached | 3,135 | 12.1% |
| 2 Unit Apartments | 3,373 | 13.0% |
| 3 or 4 Unit Apartments | 3,132 | 12.1% |
| 5 to 9 Unit Apartments | 1,618 | 6.2% |
| 10 or more Apartments | 3,778 | 14.5% |
| Mobile Home / Other | 21 | 0.1% |
| Total | 25,976 | 100.0% |
Housing Structures by Occupancy in Haverhill
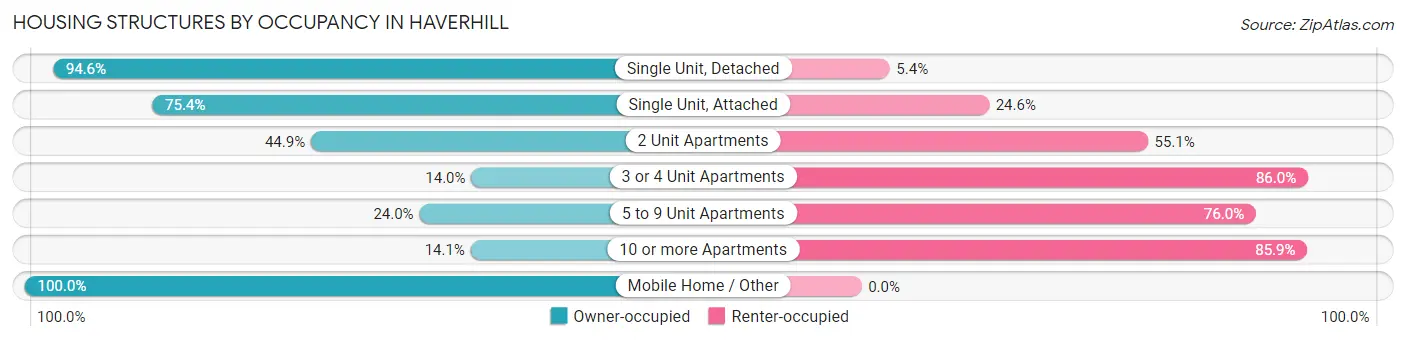
| Structure Type | Owner-occupied | Renter-occupied |
| Single Unit, Detached | 10,325 (94.6%) | 594 (5.4%) |
| Single Unit, Attached | 2,365 (75.4%) | 770 (24.6%) |
| 2 Unit Apartments | 1,513 (44.9%) | 1,860 (55.1%) |
| 3 or 4 Unit Apartments | 438 (14.0%) | 2,694 (86.0%) |
| 5 to 9 Unit Apartments | 388 (24.0%) | 1,230 (76.0%) |
| 10 or more Apartments | 533 (14.1%) | 3,245 (85.9%) |
| Mobile Home / Other | 21 (100.0%) | 0 (0.0%) |
| Total | 15,583 (60.0%) | 10,393 (40.0%) |
Housing Structures by Number of Rooms in Haverhill
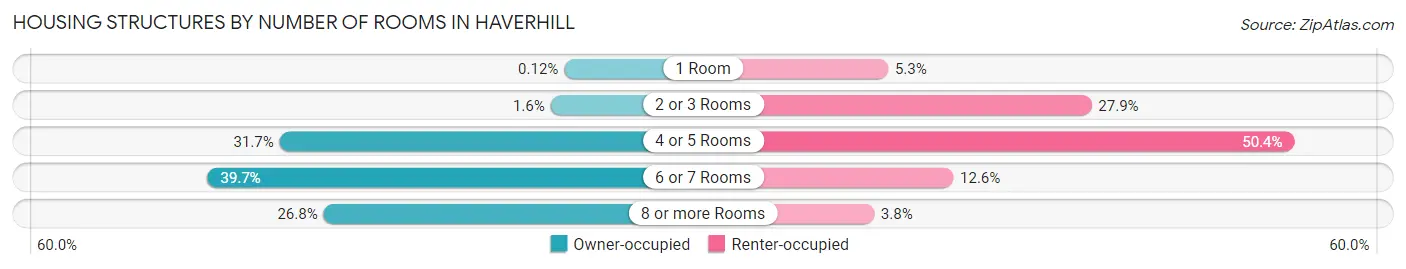
| Number of Rooms | Owner-occupied | Renter-occupied |
| 1 Room | 19 (0.1%) | 554 (5.3%) |
| 2 or 3 Rooms | 254 (1.6%) | 2,901 (27.9%) |
| 4 or 5 Rooms | 4,941 (31.7%) | 5,241 (50.4%) |
| 6 or 7 Rooms | 6,188 (39.7%) | 1,305 (12.6%) |
| 8 or more Rooms | 4,181 (26.8%) | 392 (3.8%) |
| Total | 15,583 (100.0%) | 10,393 (100.0%) |
Housing Structure by Heating Type in Haverhill
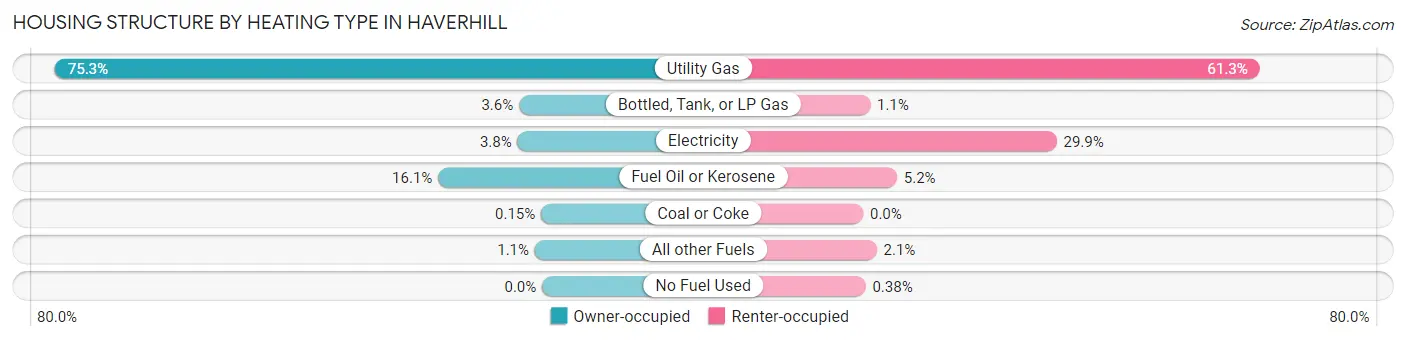
| Heating Type | Owner-occupied | Renter-occupied |
| Utility Gas | 11,737 (75.3%) | 6,371 (61.3%) |
| Bottled, Tank, or LP Gas | 554 (3.6%) | 112 (1.1%) |
| Electricity | 591 (3.8%) | 3,109 (29.9%) |
| Fuel Oil or Kerosene | 2,504 (16.1%) | 544 (5.2%) |
| Coal or Coke | 23 (0.2%) | 0 (0.0%) |
| All other Fuels | 174 (1.1%) | 218 (2.1%) |
| No Fuel Used | 0 (0.0%) | 39 (0.4%) |
| Total | 15,583 (100.0%) | 10,393 (100.0%) |
Household Vehicle Usage in Haverhill
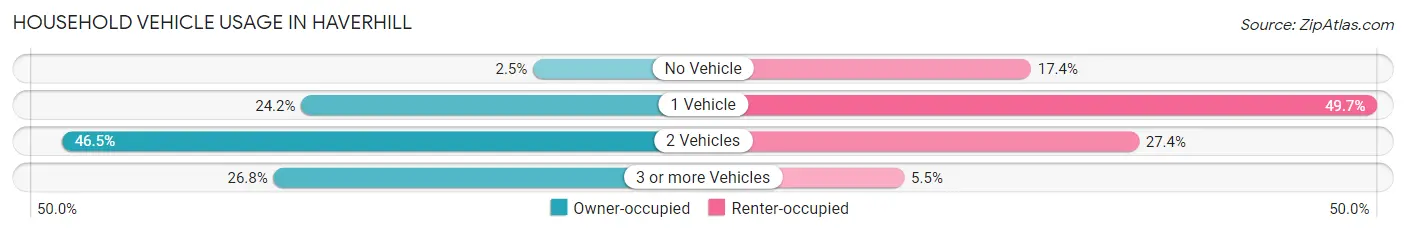
| Vehicles per Household | Owner-occupied | Renter-occupied |
| No Vehicle | 395 (2.5%) | 1,803 (17.3%) |
| 1 Vehicle | 3,767 (24.2%) | 5,164 (49.7%) |
| 2 Vehicles | 7,251 (46.5%) | 2,851 (27.4%) |
| 3 or more Vehicles | 4,170 (26.8%) | 575 (5.5%) |
| Total | 15,583 (100.0%) | 10,393 (100.0%) |
Real Estate & Mortgages in Haverhill
Real Estate and Mortgage Overview in Haverhill
| Characteristic | Without Mortgage | With Mortgage |
| Housing Units | 3,945 | 11,638 |
| Median Property Value | $366,200 | $411,700 |
| Median Household Income | $77,530 | $4,356 |
| Monthly Housing Costs | $921 | $2,219 |
| Real Estate Taxes | $4,909 | $130 |
Property Value by Mortgage Status in Haverhill
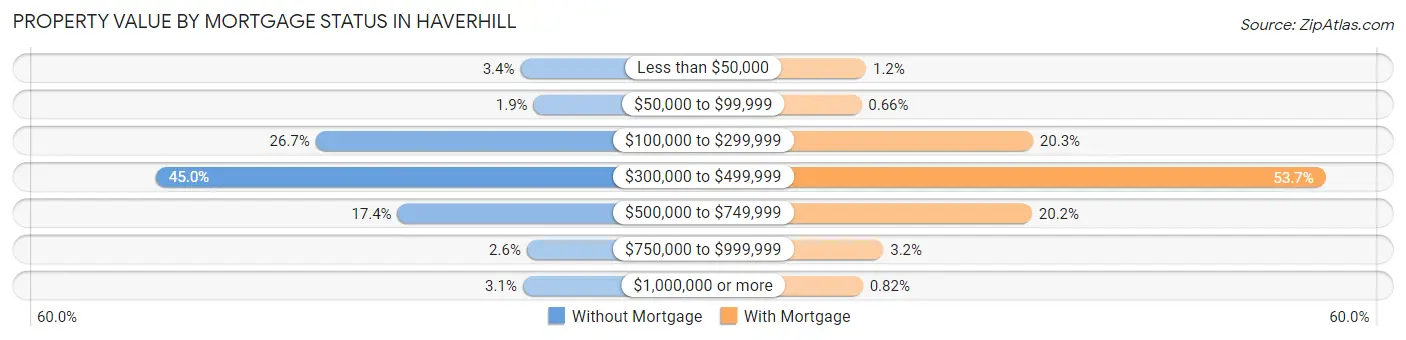
| Property Value | Without Mortgage | With Mortgage |
| Less than $50,000 | 132 (3.4%) | 140 (1.2%) |
| $50,000 to $99,999 | 73 (1.8%) | 77 (0.7%) |
| $100,000 to $299,999 | 1,055 (26.7%) | 2,359 (20.3%) |
| $300,000 to $499,999 | 1,775 (45.0%) | 6,252 (53.7%) |
| $500,000 to $749,999 | 686 (17.4%) | 2,345 (20.2%) |
| $750,000 to $999,999 | 103 (2.6%) | 369 (3.2%) |
| $1,000,000 or more | 121 (3.1%) | 96 (0.8%) |
| Total | 3,945 (100.0%) | 11,638 (100.0%) |
Household Income by Mortgage Status in Haverhill
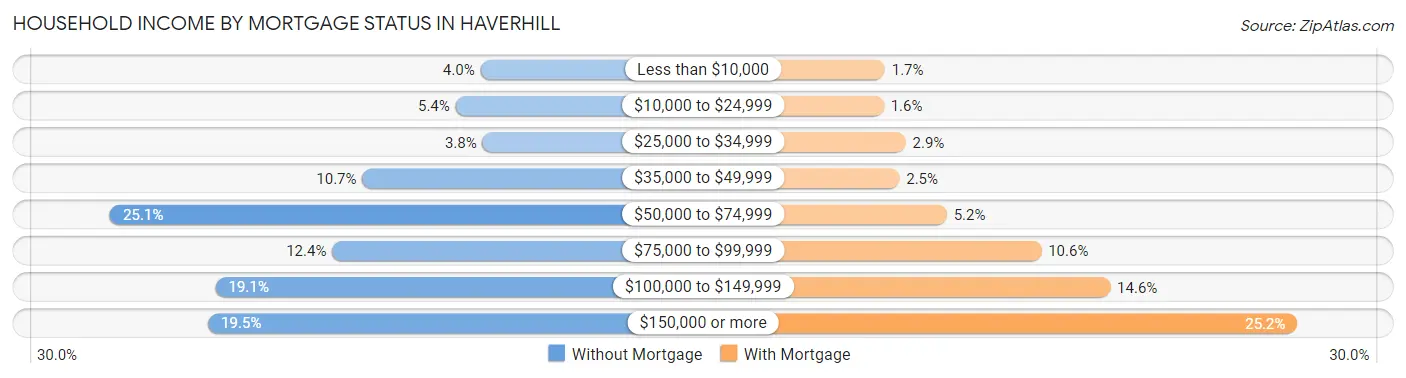
| Household Income | Without Mortgage | With Mortgage |
| Less than $10,000 | 156 (4.0%) | 194 (1.7%) |
| $10,000 to $24,999 | 212 (5.4%) | 187 (1.6%) |
| $25,000 to $34,999 | 151 (3.8%) | 333 (2.9%) |
| $35,000 to $49,999 | 422 (10.7%) | 291 (2.5%) |
| $50,000 to $74,999 | 991 (25.1%) | 606 (5.2%) |
| $75,000 to $99,999 | 490 (12.4%) | 1,235 (10.6%) |
| $100,000 to $149,999 | 753 (19.1%) | 1,693 (14.5%) |
| $150,000 or more | 770 (19.5%) | 2,937 (25.2%) |
| Total | 3,945 (100.0%) | 11,638 (100.0%) |
Property Value to Household Income Ratio in Haverhill
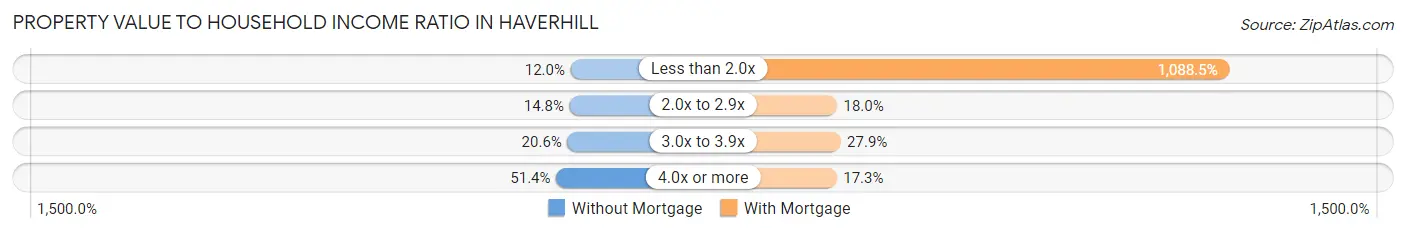
| Value-to-Income Ratio | Without Mortgage | With Mortgage |
| Less than 2.0x | 474 (12.0%) | 126,678 (1,088.5%) |
| 2.0x to 2.9x | 582 (14.7%) | 2,097 (18.0%) |
| 3.0x to 3.9x | 812 (20.6%) | 3,246 (27.9%) |
| 4.0x or more | 2,029 (51.4%) | 2,014 (17.3%) |
| Total | 3,945 (100.0%) | 11,638 (100.0%) |
Real Estate Taxes by Mortgage Status in Haverhill
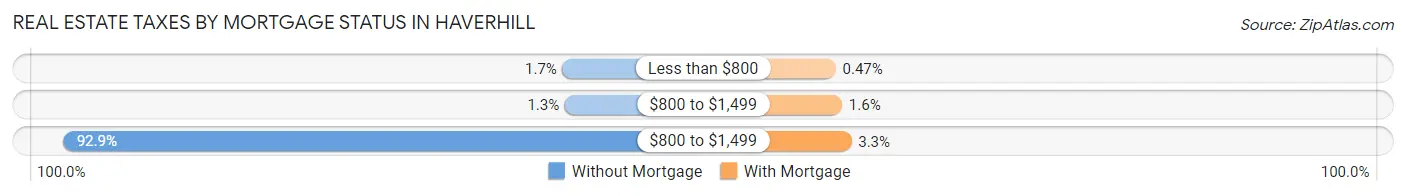
| Property Taxes | Without Mortgage | With Mortgage |
| Less than $800 | 68 (1.7%) | 55 (0.5%) |
| $800 to $1,499 | 51 (1.3%) | 188 (1.6%) |
| $800 to $1,499 | 3,663 (92.8%) | 387 (3.3%) |
| Total | 3,945 (100.0%) | 11,638 (100.0%) |
Health & Disability in Haverhill
Health Insurance Coverage by Age in Haverhill
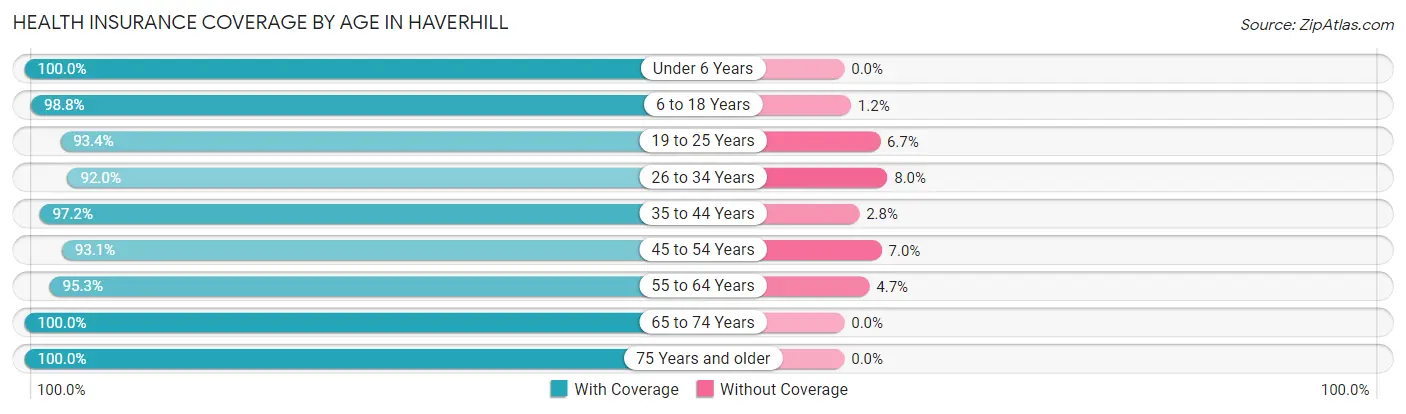
| Age Bracket | With Coverage | Without Coverage |
| Under 6 Years | 4,518 (100.0%) | 0 (0.0%) |
| 6 to 18 Years | 10,539 (98.8%) | 131 (1.2%) |
| 19 to 25 Years | 6,235 (93.3%) | 444 (6.7%) |
| 26 to 34 Years | 8,164 (92.0%) | 712 (8.0%) |
| 35 to 44 Years | 7,998 (97.2%) | 229 (2.8%) |
| 45 to 54 Years | 8,114 (93.0%) | 606 (7.0%) |
| 55 to 64 Years | 8,960 (95.3%) | 439 (4.7%) |
| 65 to 74 Years | 6,086 (100.0%) | 0 (0.0%) |
| 75 Years and older | 3,410 (100.0%) | 0 (0.0%) |
| Total | 64,024 (96.2%) | 2,561 (3.8%) |
Health Insurance Coverage by Citizenship Status in Haverhill
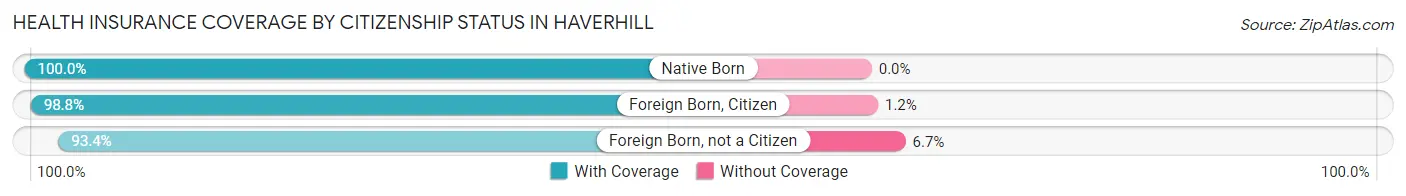
| Citizenship Status | With Coverage | Without Coverage |
| Native Born | 4,518 (100.0%) | 0 (0.0%) |
| Foreign Born, Citizen | 10,539 (98.8%) | 131 (1.2%) |
| Foreign Born, not a Citizen | 6,235 (93.3%) | 444 (6.7%) |
Health Insurance Coverage by Household Income in Haverhill
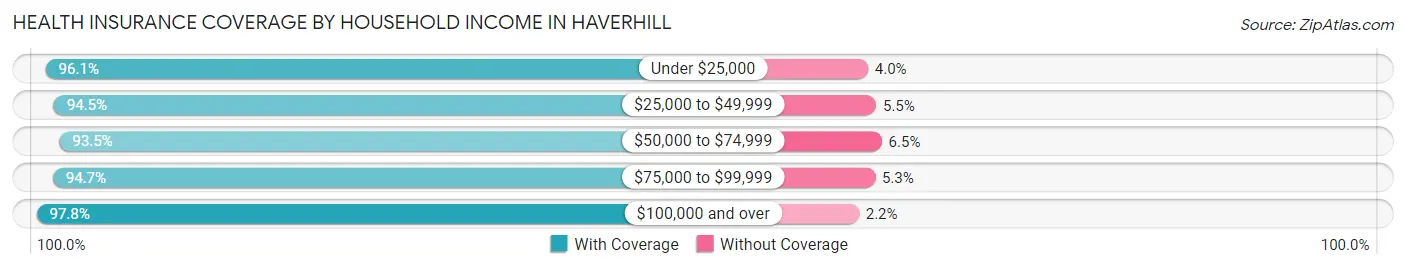
| Household Income | With Coverage | Without Coverage |
| Under $25,000 | 5,551 (96.1%) | 228 (4.0%) |
| $25,000 to $49,999 | 8,491 (94.5%) | 492 (5.5%) |
| $50,000 to $74,999 | 8,840 (93.5%) | 618 (6.5%) |
| $75,000 to $99,999 | 8,743 (94.7%) | 488 (5.3%) |
| $100,000 and over | 32,048 (97.8%) | 735 (2.2%) |
Public vs Private Health Insurance Coverage by Age in Haverhill
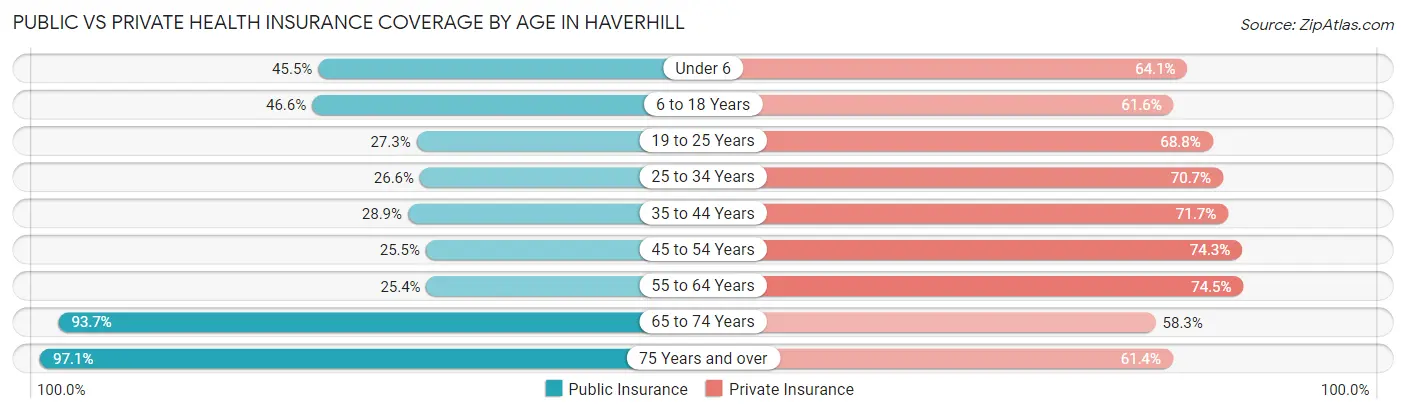
| Age Bracket | Public Insurance | Private Insurance |
| Under 6 | 2,056 (45.5%) | 2,898 (64.1%) |
| 6 to 18 Years | 4,976 (46.6%) | 6,571 (61.6%) |
| 19 to 25 Years | 1,821 (27.3%) | 4,596 (68.8%) |
| 25 to 34 Years | 2,364 (26.6%) | 6,277 (70.7%) |
| 35 to 44 Years | 2,374 (28.9%) | 5,899 (71.7%) |
| 45 to 54 Years | 2,226 (25.5%) | 6,479 (74.3%) |
| 55 to 64 Years | 2,388 (25.4%) | 7,005 (74.5%) |
| 65 to 74 Years | 5,703 (93.7%) | 3,545 (58.3%) |
| 75 Years and over | 3,312 (97.1%) | 2,095 (61.4%) |
| Total | 27,220 (40.9%) | 45,365 (68.1%) |
Disability Status by Sex by Age in Haverhill
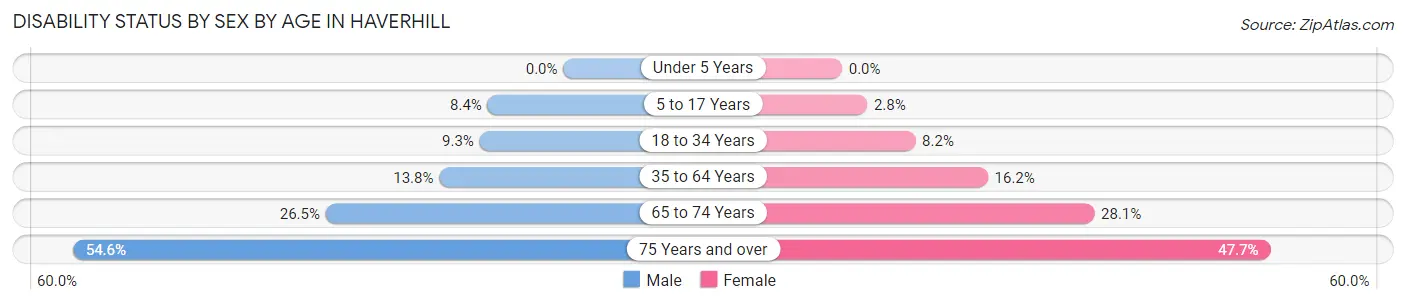
| Age Bracket | Male | Female |
| Under 5 Years | 0 (0.0%) | 0 (0.0%) |
| 5 to 17 Years | 505 (8.4%) | 126 (2.8%) |
| 18 to 34 Years | 766 (9.3%) | 676 (8.2%) |
| 35 to 64 Years | 1,738 (13.8%) | 2,237 (16.2%) |
| 65 to 74 Years | 779 (26.5%) | 883 (28.1%) |
| 75 Years and over | 731 (54.6%) | 989 (47.7%) |
Disability Class by Sex by Age in Haverhill
Disability Class: Hearing Difficulty
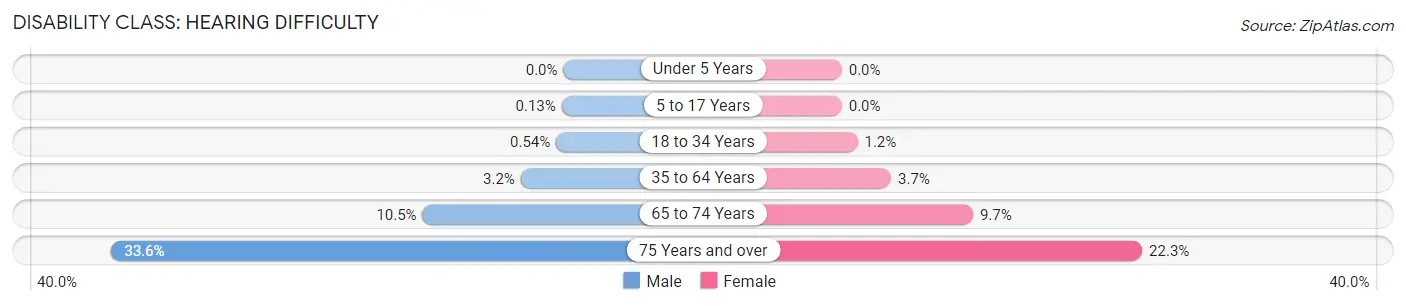
| Age Bracket | Male | Female |
| Under 5 Years | 0 (0.0%) | 0 (0.0%) |
| 5 to 17 Years | 8 (0.1%) | 0 (0.0%) |
| 18 to 34 Years | 44 (0.5%) | 97 (1.2%) |
| 35 to 64 Years | 398 (3.2%) | 504 (3.7%) |
| 65 to 74 Years | 308 (10.5%) | 306 (9.7%) |
| 75 Years and over | 449 (33.6%) | 462 (22.3%) |
Disability Class: Vision Difficulty
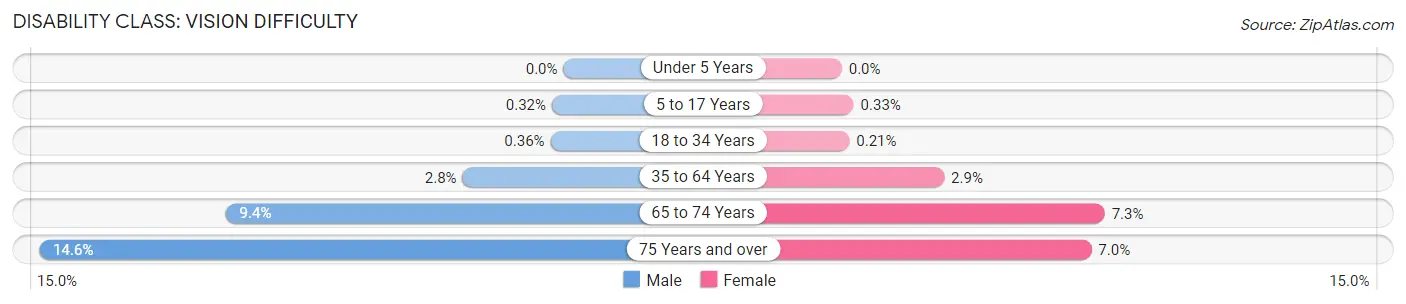
| Age Bracket | Male | Female |
| Under 5 Years | 0 (0.0%) | 0 (0.0%) |
| 5 to 17 Years | 19 (0.3%) | 15 (0.3%) |
| 18 to 34 Years | 30 (0.4%) | 17 (0.2%) |
| 35 to 64 Years | 353 (2.8%) | 393 (2.9%) |
| 65 to 74 Years | 276 (9.4%) | 230 (7.3%) |
| 75 Years and over | 195 (14.6%) | 144 (7.0%) |
Disability Class: Cognitive Difficulty
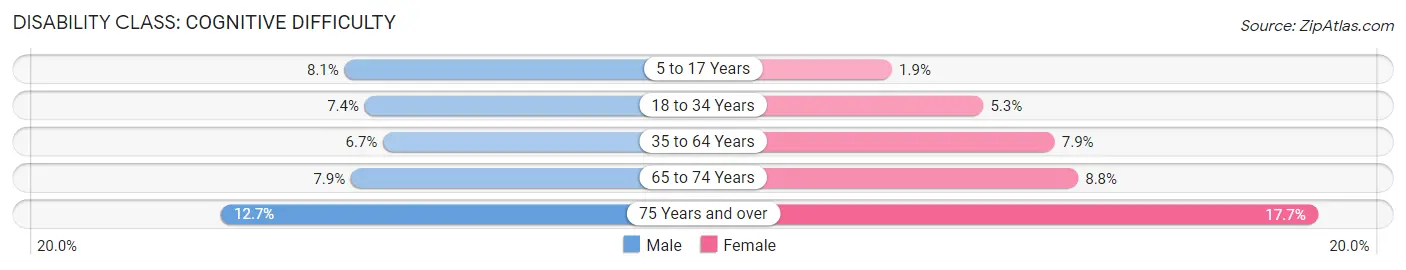
| Age Bracket | Male | Female |
| 5 to 17 Years | 486 (8.1%) | 84 (1.9%) |
| 18 to 34 Years | 606 (7.4%) | 435 (5.3%) |
| 35 to 64 Years | 841 (6.7%) | 1,089 (7.9%) |
| 65 to 74 Years | 232 (7.9%) | 276 (8.8%) |
| 75 Years and over | 170 (12.7%) | 366 (17.7%) |
Disability Class: Ambulatory Difficulty
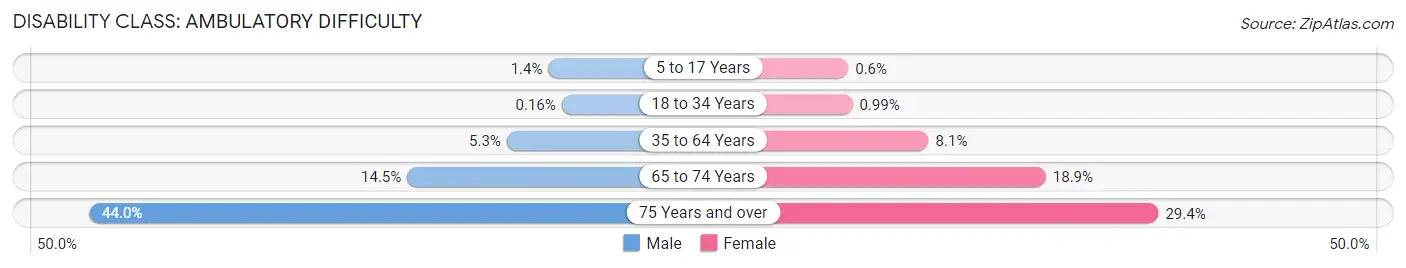
| Age Bracket | Male | Female |
| 5 to 17 Years | 84 (1.4%) | 27 (0.6%) |
| 18 to 34 Years | 13 (0.2%) | 82 (1.0%) |
| 35 to 64 Years | 662 (5.3%) | 1,110 (8.1%) |
| 65 to 74 Years | 427 (14.5%) | 595 (18.9%) |
| 75 Years and over | 589 (44.0%) | 609 (29.4%) |
Disability Class: Self-Care Difficulty
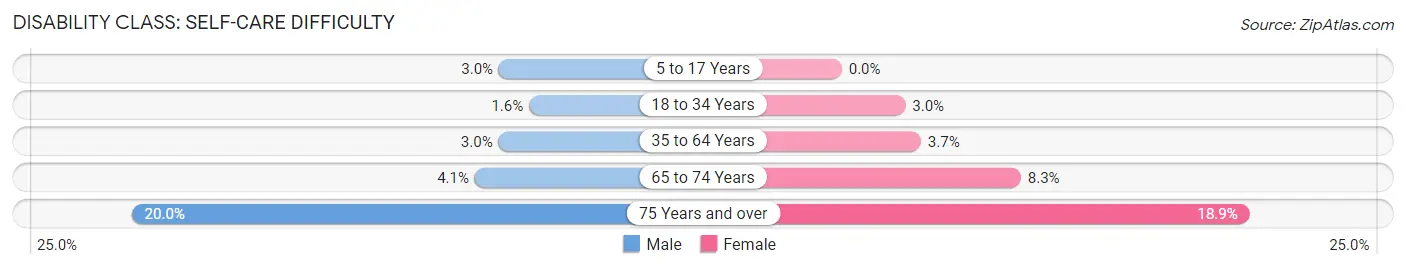
| Age Bracket | Male | Female |
| 5 to 17 Years | 179 (3.0%) | 0 (0.0%) |
| 18 to 34 Years | 131 (1.6%) | 244 (2.9%) |
| 35 to 64 Years | 379 (3.0%) | 506 (3.7%) |
| 65 to 74 Years | 121 (4.1%) | 261 (8.3%) |
| 75 Years and over | 268 (20.0%) | 392 (18.9%) |
Technology Access in Haverhill
Computing Device Access in Haverhill
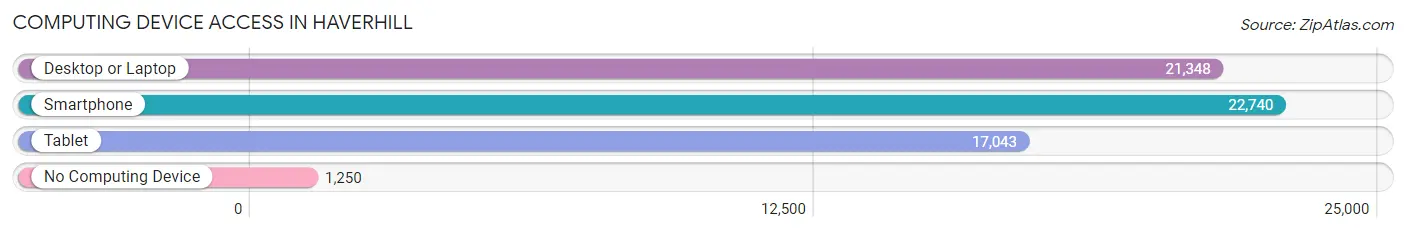
| Device Type | # Households | % Households |
| Desktop or Laptop | 21,348 | 82.2% |
| Smartphone | 22,740 | 87.5% |
| Tablet | 17,043 | 65.6% |
| No Computing Device | 1,250 | 4.8% |
| Total | 25,976 | 100.0% |
Internet Access in Haverhill
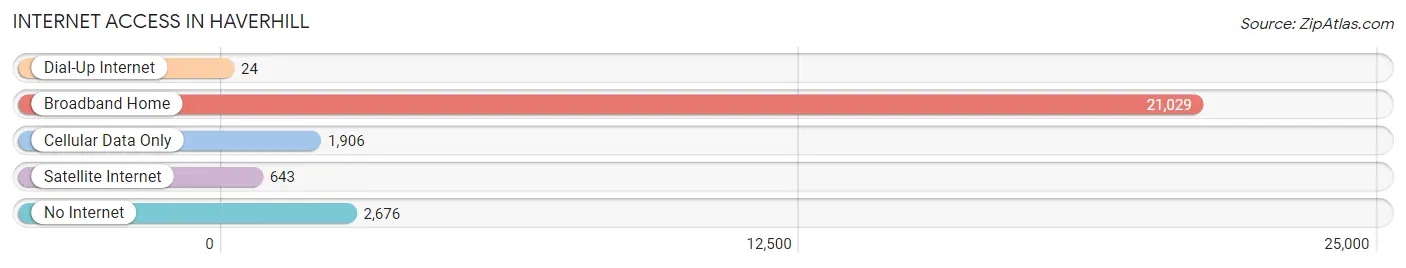
| Internet Type | # Households | % Households |
| Dial-Up Internet | 24 | 0.1% |
| Broadband Home | 21,029 | 81.0% |
| Cellular Data Only | 1,906 | 7.3% |
| Satellite Internet | 643 | 2.5% |
| No Internet | 2,676 | 10.3% |
| Total | 25,976 | 100.0% |
Haverhill Summary
Haverhill is a city located in Essex County, Massachusetts, United States. It is situated along the Merrimack River, approximately 35 miles north of Boston. The city has a population of approximately 60,000 people, making it the second largest city in Essex County.
History
Haverhill was first settled in 1640 by a group of settlers from nearby Newbury. The town was originally known as Pentucket, and was incorporated as a town in 1645. The town was renamed Haverhill in 1650, after the town of Haverhill in England.
In the late 1700s, Haverhill became an important center for the leather industry, with several tanneries and shoe factories located in the area. The city was also an important center for the textile industry, with several mills located along the Merrimack River.
In the late 1800s, Haverhill experienced a period of rapid growth, with the population increasing from 8,000 in 1880 to over 20,000 in 1900. This growth was largely due to the influx of immigrants from Europe, particularly from Ireland and Italy.
Geography
Haverhill is located in northeastern Massachusetts, approximately 35 miles north of Boston. The city is situated along the Merrimack River, and is bordered by the towns of Amesbury, Groveland, Merrimac, and West Newbury.
The city has a total area of 24.2 square miles, of which 23.7 square miles is land and 0.5 square miles is water. The highest point in Haverhill is located at the intersection of Main Street and Broadway, at an elevation of approximately 200 feet.
Economy
Haverhill’s economy is largely based on manufacturing and retail. The city is home to several large manufacturing companies, including the Haverhill shoe company, the Haverhill leather company, and the Haverhill textile company.
The city is also home to several large retail stores, including Walmart, Target, and Home Depot. In addition, Haverhill is home to several small businesses, including restaurants, bars, and shops.
Demographics
As of the 2010 census, Haverhill had a population of 60,879. The racial makeup of the city was 87.3% White, 4.2% African American, 0.5% Native American, 2.3% Asian, 0.1% Pacific Islander, 4.2% from other races, and 1.4% from two or more races. Hispanic or Latino of any race were 8.7% of the population.
The median income for a household in Haverhill was $50,817, and the median income for a family was $60,945. The per capita income for the city was $25,845. About 11.2% of families and 14.2% of the population were below the poverty line, including 19.2% of those under age 18 and 8.2% of those age 65 or over.
Common Questions
What is Per Capita Income in Haverhill?
Per Capita income in Haverhill is $39,770.
What is the Median Family Income in Haverhill?
Median Family Income in Haverhill is $98,467.
What is the Median Household income in Haverhill?
Median Household Income in Haverhill is $81,989.
What is Income or Wage Gap in Haverhill?
Income or Wage Gap in Haverhill is 30.5%.
Women in Haverhill earn 69.5 cents for every dollar earned by a man.
What is Family Income Deficit in Haverhill?
Family Income Deficit in Haverhill is $11,340.
Families that are below poverty line in Haverhill earn $11,340 less on average than the poverty threshold level.
What is Inequality or Gini Index in Haverhill?
Inequality or Gini Index in Haverhill is 0.42.
What is the Total Population of Haverhill?
Total Population of Haverhill is 67,273.
What is the Total Male Population of Haverhill?
Total Male Population of Haverhill is 32,942.
What is the Total Female Population of Haverhill?
Total Female Population of Haverhill is 34,331.
What is the Ratio of Males per 100 Females in Haverhill?
There are 95.95 Males per 100 Females in Haverhill.
What is the Ratio of Females per 100 Males in Haverhill?
There are 104.22 Females per 100 Males in Haverhill.
What is the Median Population Age in Haverhill?
Median Population Age in Haverhill is 37.9 Years.
What is the Average Family Size in Haverhill
Average Family Size in Haverhill is 3.1 People.
What is the Average Household Size in Haverhill
Average Household Size in Haverhill is 2.5 People.
How Large is the Labor Force in Haverhill?
There are 38,112 People in the Labor Forcein in Haverhill.
What is the Percentage of People in the Labor Force in Haverhill?
69.8% of People are in the Labor Force in Haverhill.
What is the Unemployment Rate in Haverhill?
Unemployment Rate in Haverhill is 6.0%.