Zip Codes with the Highest Percentage of Population Employed in Security & Protection in Haverhill, MA
RELATED REPORTS & OPTIONS
Security & Protection
Haverhill
Compare Zip Codes
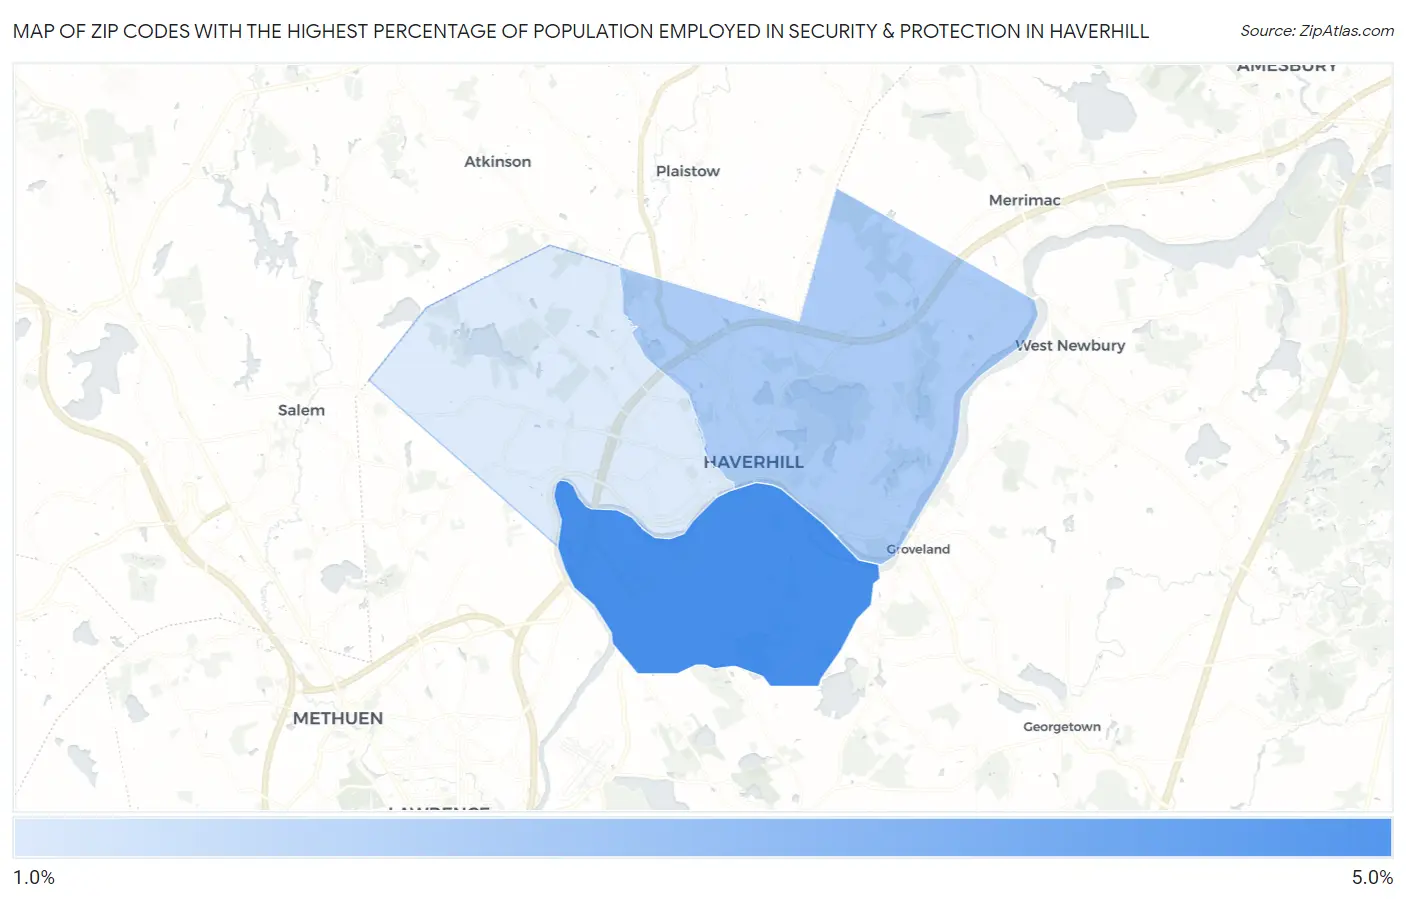
Map of Zip Codes with the Highest Percentage of Population Employed in Security & Protection in Haverhill
1.2%
4.5%
Zip Codes with the Highest Percentage of Population Employed in Security & Protection in Haverhill, MA
| Zip Code | % Employed | vs State | vs National | |
| 1. | 01835 | 4.5% | 2.0%(+2.49)#27 | 2.1%(+2.35)#3,608 |
| 2. | 01830 | 2.3% | 2.0%(+0.296)#175 | 2.1%(+0.161)#10,581 |
| 3. | 01832 | 1.2% | 2.0%(-0.795)#333 | 2.1%(-0.929)#18,368 |
1
Common Questions
What are the Top Zip Codes with the Highest Percentage of Population Employed in Security & Protection in Haverhill, MA?
Top Zip Codes with the Highest Percentage of Population Employed in Security & Protection in Haverhill, MA are:
What zip code has the Highest Percentage of Population Employed in Security & Protection in Haverhill, MA?
01835 has the Highest Percentage of Population Employed in Security & Protection in Haverhill, MA with 4.5%.
What is the Percentage of Population Employed in Security & Protection in Haverhill, MA?
Percentage of Population Employed in Security & Protection in Haverhill is 2.4%.
What is the Percentage of Population Employed in Security & Protection in Massachusetts?
Percentage of Population Employed in Security & Protection in Massachusetts is 2.0%.
What is the Percentage of Population Employed in Security & Protection in the United States?
Percentage of Population Employed in Security & Protection in the United States is 2.1%.