Cities with the Most Immigrants from Middle Africa in Massachusetts
RELATED REPORTS & OPTIONS
Middle Africa
Massachusetts
Compare Cities
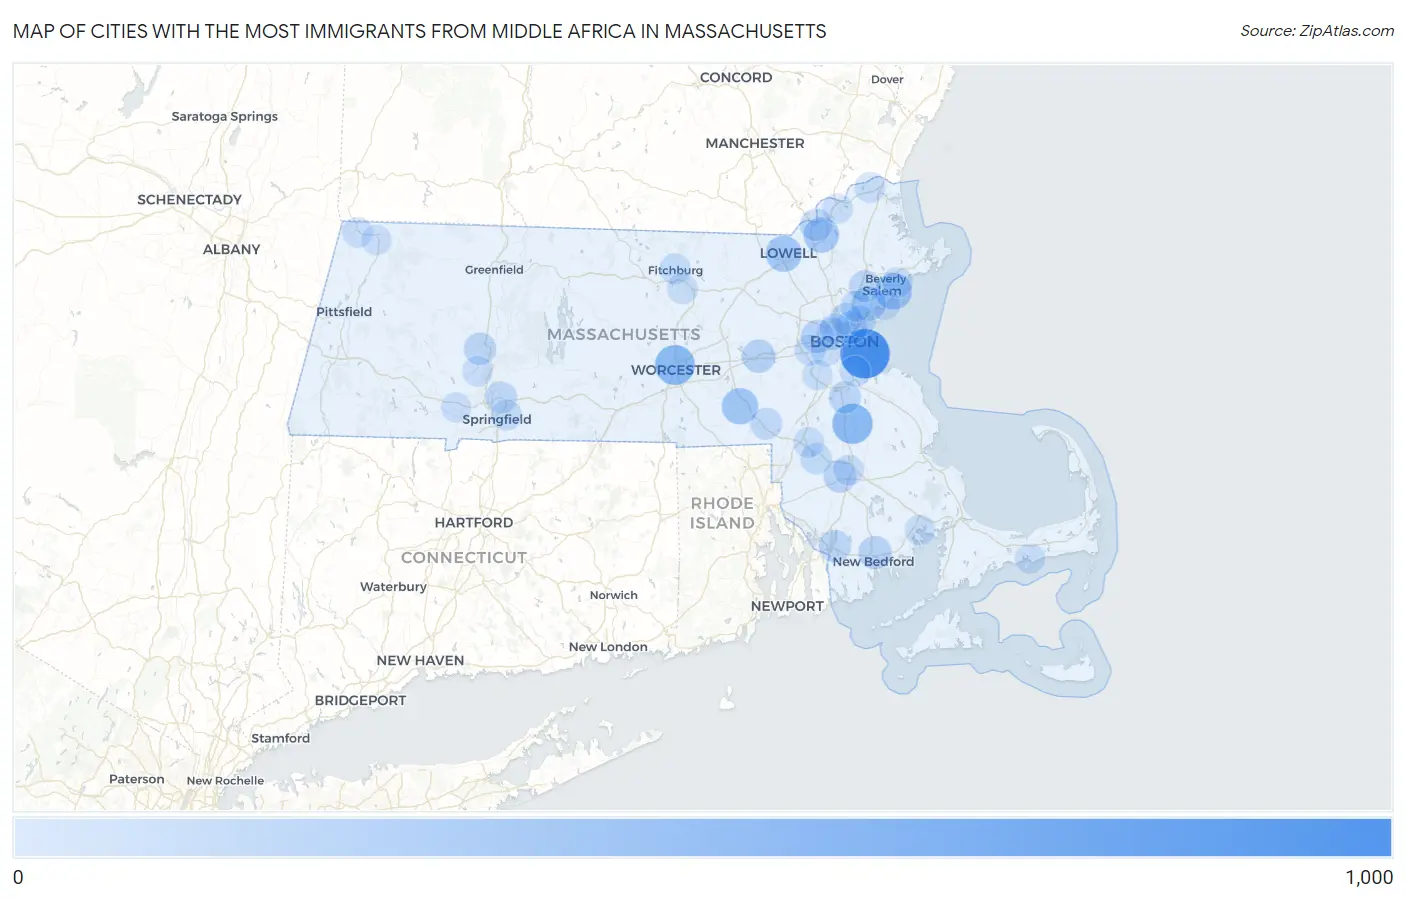
Map of Cities with the Most Immigrants from Middle Africa in Massachusetts
0
1,000
Cities with the Most Immigrants from Middle Africa in Massachusetts
| City | Middle Africa | vs State | vs National | |
| 1. | Boston | 801 | 5,098(15.71%)#1 | 193,874(0.41%)#40 |
| 2. | Brockton | 407 | 5,098(7.98%)#2 | 193,874(0.21%)#88 |
| 3. | Worcester | 394 | 5,098(7.73%)#3 | 193,874(0.20%)#94 |
| 4. | Salem | 262 | 5,098(5.14%)#4 | 193,874(0.14%)#152 |
| 5. | Milford | 250 | 5,098(4.90%)#5 | 193,874(0.13%)#163 |
| 6. | Lowell | 238 | 5,098(4.67%)#6 | 193,874(0.12%)#175 |
| 7. | Lawrence | 218 | 5,098(4.28%)#7 | 193,874(0.11%)#191 |
| 8. | Lynn | 167 | 5,098(3.28%)#8 | 193,874(0.09%)#235 |
| 9. | Framingham | 129 | 5,098(2.53%)#9 | 193,874(0.07%)#285 |
| 10. | New Bedford | 125 | 5,098(2.45%)#10 | 193,874(0.06%)#290 |
| 11. | Watertown Town | 120 | 5,098(2.35%)#11 | 193,874(0.06%)#299 |
| 12. | Taunton | 111 | 5,098(2.18%)#12 | 193,874(0.06%)#318 |
| 13. | Chelsea | 110 | 5,098(2.16%)#13 | 193,874(0.06%)#319 |
| 14. | Methuen Town | 99 | 5,098(1.94%)#14 | 193,874(0.05%)#345 |
| 15. | Fall River | 89 | 5,098(1.75%)#15 | 193,874(0.05%)#377 |
| 16. | Northampton | 88 | 5,098(1.73%)#16 | 193,874(0.05%)#386 |
| 17. | Cambridge | 83 | 5,098(1.63%)#17 | 193,874(0.04%)#399 |
| 18. | Peabody | 83 | 5,098(1.63%)#18 | 193,874(0.04%)#400 |
| 19. | Randolph Town | 74 | 5,098(1.45%)#19 | 193,874(0.04%)#433 |
| 20. | Malden | 72 | 5,098(1.41%)#20 | 193,874(0.04%)#443 |
| 21. | Franklin Town | 72 | 5,098(1.41%)#21 | 193,874(0.04%)#446 |
| 22. | Chicopee | 66 | 5,098(1.29%)#22 | 193,874(0.03%)#476 |
| 23. | Norton Center | 52 | 5,098(1.02%)#23 | 193,874(0.03%)#558 |
| 24. | Revere | 51 | 5,098(1.00%)#24 | 193,874(0.03%)#561 |
| 25. | Newton | 46 | 5,098(0.90%)#25 | 193,874(0.02%)#597 |
| 26. | Fitchburg | 43 | 5,098(0.84%)#26 | 193,874(0.02%)#622 |
| 27. | Saugus | 41 | 5,098(0.80%)#27 | 193,874(0.02%)#638 |
| 28. | Quincy | 40 | 5,098(0.78%)#28 | 193,874(0.02%)#647 |
| 29. | Springfield | 37 | 5,098(0.73%)#29 | 193,874(0.02%)#674 |
| 30. | Mansfield Center | 34 | 5,098(0.67%)#30 | 193,874(0.02%)#709 |
| 31. | Amesbury Town | 33 | 5,098(0.65%)#31 | 193,874(0.02%)#718 |
| 32. | Leominster | 30 | 5,098(0.59%)#32 | 193,874(0.02%)#744 |
| 33. | Beverly | 26 | 5,098(0.51%)#33 | 193,874(0.01%)#796 |
| 34. | Raynham Center | 24 | 5,098(0.47%)#34 | 193,874(0.01%)#821 |
| 35. | Somerville | 22 | 5,098(0.43%)#35 | 193,874(0.01%)#844 |
| 36. | Weweantic | 20 | 5,098(0.39%)#36 | 193,874(0.01%)#898 |
| 37. | Haverhill | 19 | 5,098(0.37%)#37 | 193,874(0.01%)#904 |
| 38. | Brookline | 19 | 5,098(0.37%)#38 | 193,874(0.01%)#905 |
| 39. | Easthampton Town | 18 | 5,098(0.35%)#39 | 193,874(0.01%)#931 |
| 40. | Williamstown | 17 | 5,098(0.33%)#40 | 193,874(0.01%)#952 |
| 41. | Dedham | 14 | 5,098(0.27%)#41 | 193,874(0.01%)#1,013 |
| 42. | Westfield | 11 | 5,098(0.22%)#42 | 193,874(0.01%)#1,100 |
| 43. | Swampscott | 11 | 5,098(0.22%)#43 | 193,874(0.01%)#1,106 |
| 44. | North Adams | 10 | 5,098(0.20%)#44 | 193,874(0.01%)#1,138 |
| 45. | West Yarmouth | 10 | 5,098(0.20%)#45 | 193,874(0.01%)#1,141 |
| 46. | Greenfield | 6 | 5,098(0.12%)#46 | 193,874(0.00%)#1,247 |
Common Questions
What are the Top 10 Cities with the Most Immigrants from Middle Africa in Massachusetts?
Top 10 Cities with the Most Immigrants from Middle Africa in Massachusetts are:
#1
801
#2
407
#3
394
#4
262
#5
250
#6
238
#7
218
#8
167
#9
129
#10
125
What city has the Most Immigrants from Middle Africa in Massachusetts?
Boston has the Most Immigrants from Middle Africa in Massachusetts with 801.
What is the Total Immigrants from Middle Africa in the State of Massachusetts?
Total Immigrants from Middle Africa in Massachusetts is 5,098.
What is the Total Immigrants from Middle Africa in the United States?
Total Immigrants from Middle Africa in the United States is 193,874.