Andover, MA Map & Demographics
Andover Map
Andover Overview
$68,253
PER CAPITA INCOME
$188,472
AVG FAMILY INCOME
$130,417
AVG HOUSEHOLD INCOME
53.1%
WAGE / INCOME GAP [ % ]
46.9¢/ $1
WAGE / INCOME GAP [ $ ]
0.49
INEQUALITY / GINI INDEX
9,419
TOTAL POPULATION
4,372
MALE POPULATION
5,047
FEMALE POPULATION
86.63
MALES / 100 FEMALES
115.44
FEMALES / 100 MALES
45.4
MEDIAN AGE
2.8
AVG FAMILY SIZE
2.3
AVG HOUSEHOLD SIZE
5,347
LABOR FORCE [ PEOPLE ]
66.7%
PERCENT IN LABOR FORCE
7.2%
UNEMPLOYMENT RATE
Andover Zip Codes
Income in Andover
Income Overview in Andover
Per Capita Income in Andover is $68,253, while median incomes of families and households are $188,472 and $130,417 respectively.
| Characteristic | Number | Measure |
| Per Capita Income | 9,419 | $68,253 |
| Median Family Income | 2,321 | $188,472 |
| Mean Family Income | 2,321 | $240,738 |
| Median Household Income | 3,519 | $130,417 |
| Mean Household Income | 3,519 | $184,691 |
| Income Deficit | 2,321 | $0 |
| Wage / Income Gap (%) | 9,419 | 53.06% |
| Wage / Income Gap ($) | 9,419 | 46.94¢ per $1 |
| Gini / Inequality Index | 9,419 | 0.49 |
Earnings by Sex in Andover
Average Earnings in Andover are $48,015, $76,680 for men and $35,994 for women, a difference of 53.1%.
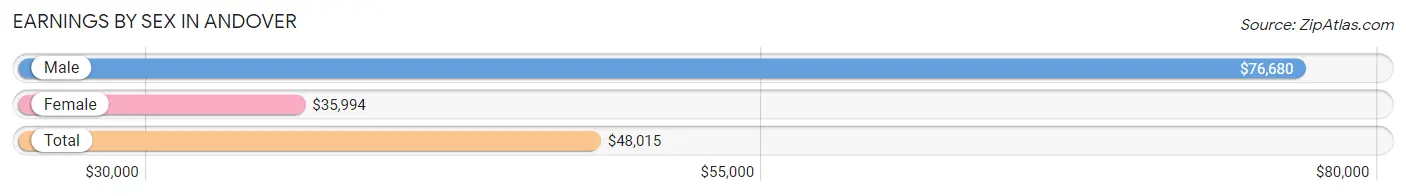
| Sex | Number | Average Earnings |
| Male | 3,019 (50.8%) | $76,680 |
| Female | 2,928 (49.2%) | $35,994 |
| Total | 5,947 (100.0%) | $48,015 |
Earnings by Sex by Income Bracket in Andover
The most common earnings brackets in Andover are $100,000+ for men (1,274 | 42.2%) and $100,000+ for women (707 | 24.1%).
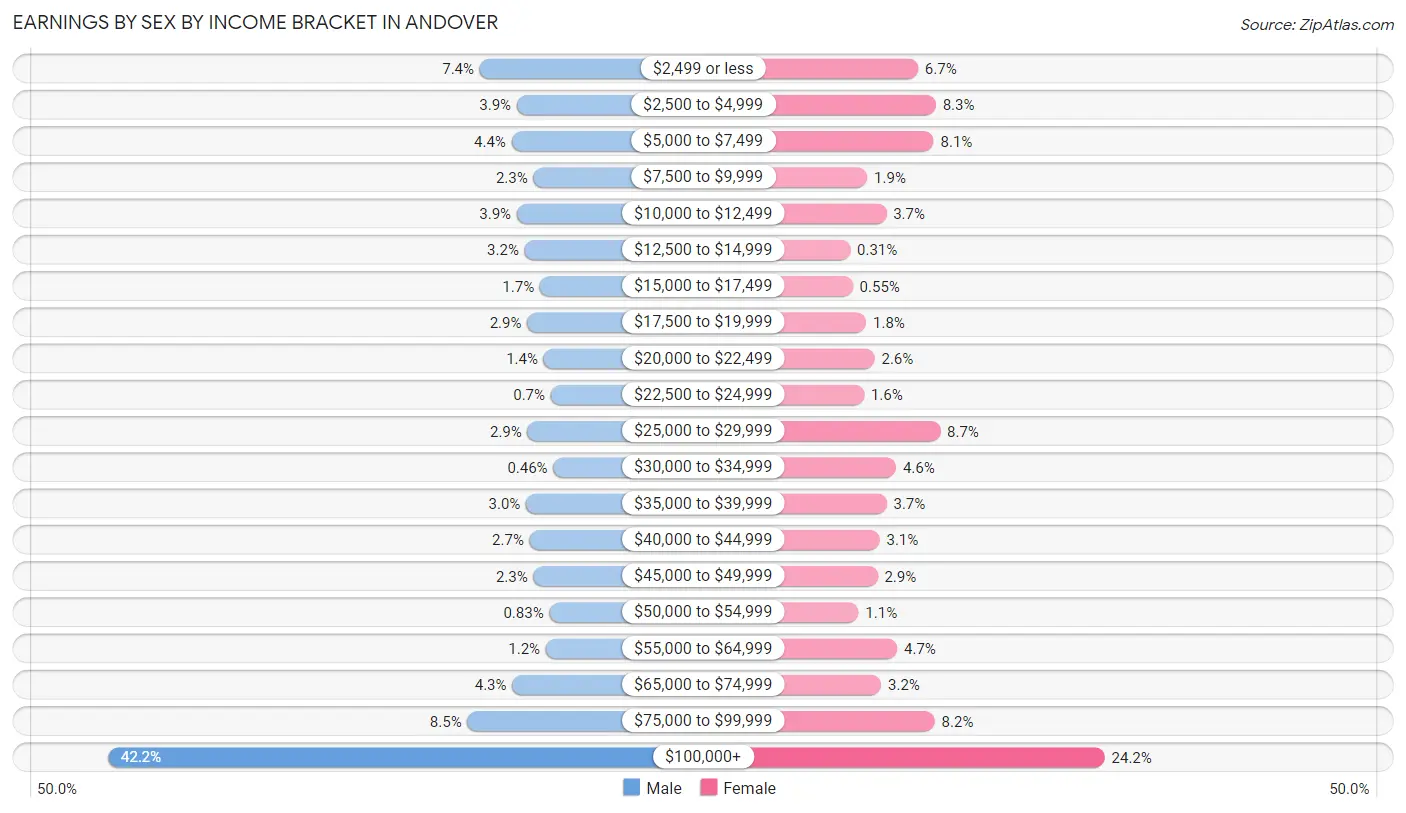
| Income | Male | Female |
| $2,499 or less | 222 (7.3%) | 195 (6.7%) |
| $2,500 to $4,999 | 117 (3.9%) | 244 (8.3%) |
| $5,000 to $7,499 | 132 (4.4%) | 238 (8.1%) |
| $7,500 to $9,999 | 70 (2.3%) | 56 (1.9%) |
| $10,000 to $12,499 | 117 (3.9%) | 108 (3.7%) |
| $12,500 to $14,999 | 95 (3.2%) | 9 (0.3%) |
| $15,000 to $17,499 | 52 (1.7%) | 16 (0.5%) |
| $17,500 to $19,999 | 88 (2.9%) | 53 (1.8%) |
| $20,000 to $22,499 | 41 (1.4%) | 76 (2.6%) |
| $22,500 to $24,999 | 21 (0.7%) | 47 (1.6%) |
| $25,000 to $29,999 | 87 (2.9%) | 256 (8.7%) |
| $30,000 to $34,999 | 14 (0.5%) | 135 (4.6%) |
| $35,000 to $39,999 | 91 (3.0%) | 109 (3.7%) |
| $40,000 to $44,999 | 81 (2.7%) | 90 (3.1%) |
| $45,000 to $49,999 | 70 (2.3%) | 84 (2.9%) |
| $50,000 to $54,999 | 25 (0.8%) | 32 (1.1%) |
| $55,000 to $64,999 | 35 (1.2%) | 138 (4.7%) |
| $65,000 to $74,999 | 130 (4.3%) | 94 (3.2%) |
| $75,000 to $99,999 | 257 (8.5%) | 241 (8.2%) |
| $100,000+ | 1,274 (42.2%) | 707 (24.1%) |
| Total | 3,019 (100.0%) | 2,928 (100.0%) |
Earnings by Sex by Educational Attainment in Andover
Average earnings in Andover are $115,657 for men and $64,968 for women, a difference of 43.8%. Men with an educational attainment of graduate degree enjoy the highest average annual earnings of $175,855, while those with high school diploma education earn the least with $31,500. Women with an educational attainment of graduate degree earn the most with the average annual earnings of $125,245, while those with high school diploma education have the smallest earnings of $28,643.
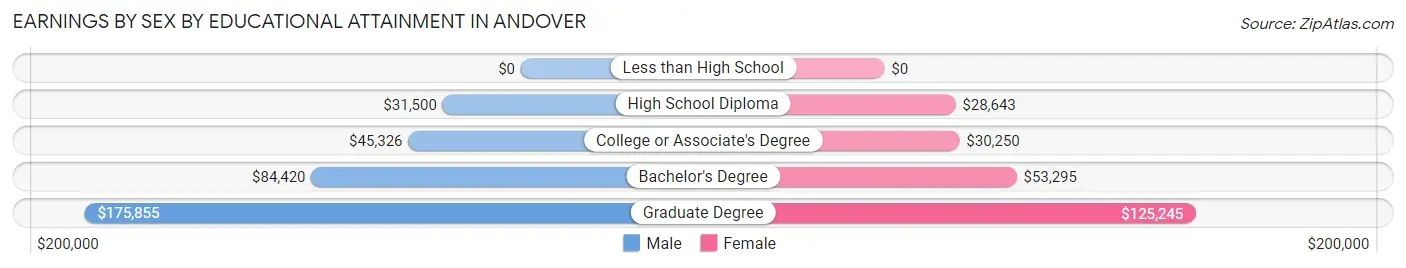
| Educational Attainment | Male Income | Female Income |
| Less than High School | - | - |
| High School Diploma | $31,500 | $28,643 |
| College or Associate's Degree | $45,326 | $30,250 |
| Bachelor's Degree | $84,420 | $53,295 |
| Graduate Degree | $175,855 | $125,245 |
| Total | $115,657 | $64,968 |
Family Income in Andover
Family Income Brackets in Andover
According to the Andover family income data, there are 1,109 families falling into the $200,000+ income range, which is the most common income bracket and makes up 47.8% of all families.
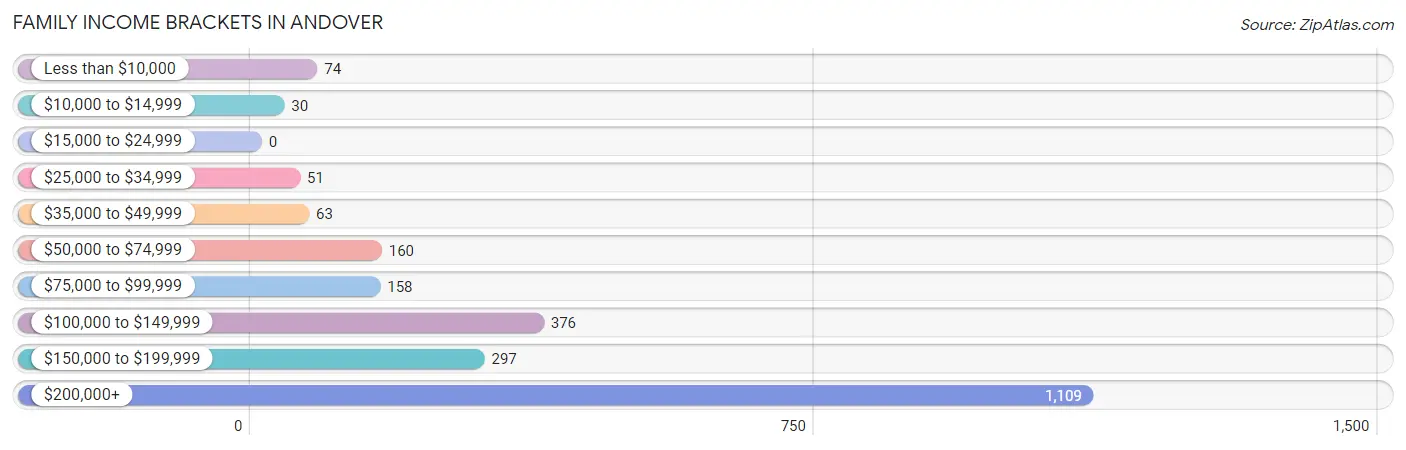
| Income Bracket | # Families | % Families |
| Less than $10,000 | 74 | 3.2% |
| $10,000 to $14,999 | 30 | 1.3% |
| $15,000 to $24,999 | 0 | 0.0% |
| $25,000 to $34,999 | 51 | 2.2% |
| $35,000 to $49,999 | 63 | 2.7% |
| $50,000 to $74,999 | 160 | 6.9% |
| $75,000 to $99,999 | 158 | 6.8% |
| $100,000 to $149,999 | 376 | 16.2% |
| $150,000 to $199,999 | 297 | 12.8% |
| $200,000+ | 1,109 | 47.8% |
Family Income by Famaliy Size in Andover
5-person families (85 | 3.7%) account for the highest median family income in Andover with $250,001 per family, while 2-person families (1,047 | 45.1%) have the highest median income of $93,590 per family member.
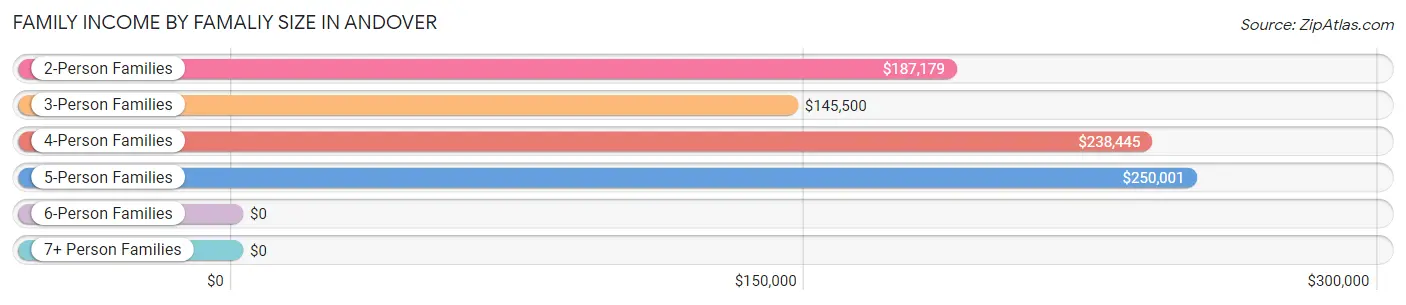
| Income Bracket | # Families | Median Income |
| 2-Person Families | 1,047 (45.1%) | $187,179 |
| 3-Person Families | 668 (28.8%) | $145,500 |
| 4-Person Families | 521 (22.5%) | $238,445 |
| 5-Person Families | 85 (3.7%) | $250,001 |
| 6-Person Families | 0 (0.0%) | $0 |
| 7+ Person Families | 0 (0.0%) | $0 |
| Total | 2,321 (100.0%) | $188,472 |
Family Income by Number of Earners in Andover
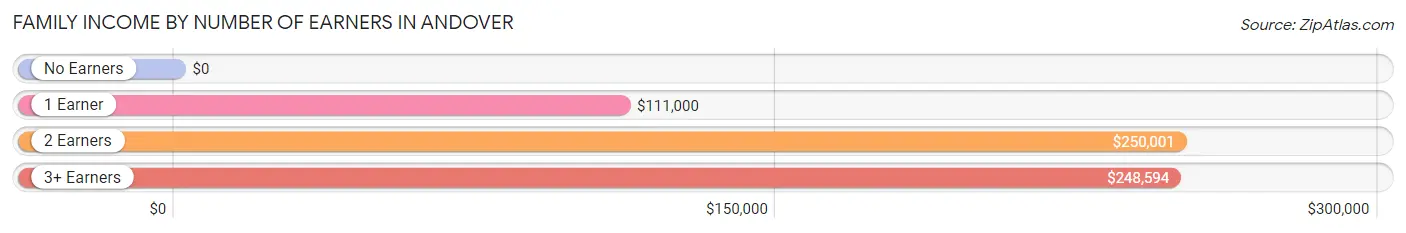
| Number of Earners | # Families | Median Income |
| No Earners | 179 (7.7%) | $0 |
| 1 Earner | 662 (28.5%) | $111,000 |
| 2 Earners | 1,187 (51.1%) | $250,001 |
| 3+ Earners | 293 (12.6%) | $248,594 |
| Total | 2,321 (100.0%) | $188,472 |
Household Income in Andover
Household Income Brackets in Andover
With 1,196 households falling in the category, the $200,000+ income range is the most frequent in Andover, accounting for 34.0% of all households. In contrast, only 120 households (3.4%) fall into the $10,000 to $14,999 income bracket, making it the least populous group.
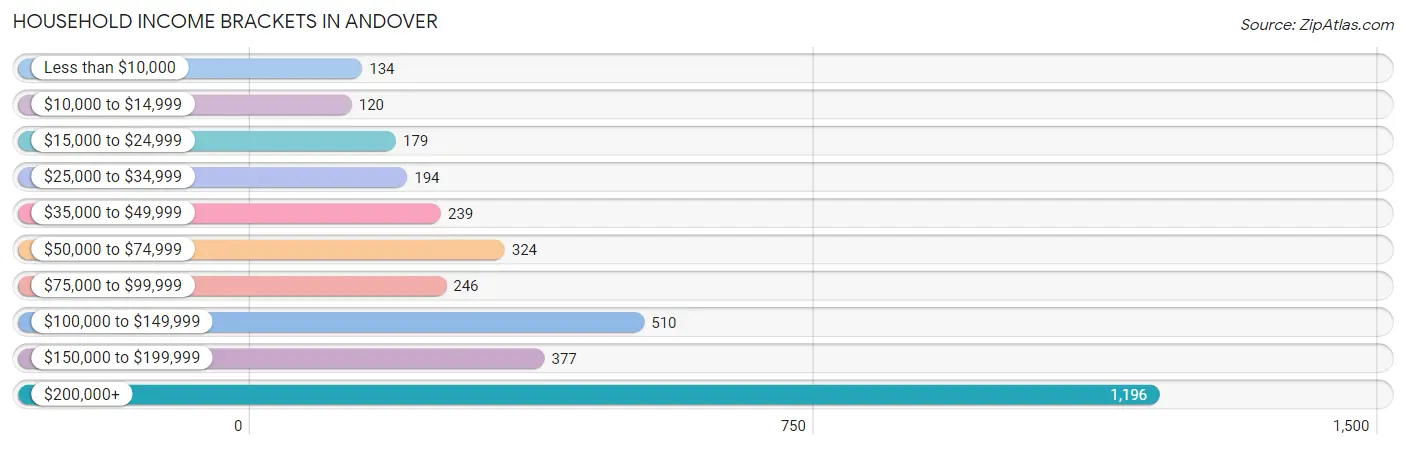
| Income Bracket | # Households | % Households |
| Less than $10,000 | 134 | 3.8% |
| $10,000 to $14,999 | 120 | 3.4% |
| $15,000 to $24,999 | 179 | 5.1% |
| $25,000 to $34,999 | 194 | 5.5% |
| $35,000 to $49,999 | 239 | 6.8% |
| $50,000 to $74,999 | 324 | 9.2% |
| $75,000 to $99,999 | 246 | 7.0% |
| $100,000 to $149,999 | 510 | 14.5% |
| $150,000 to $199,999 | 377 | 10.7% |
| $200,000+ | 1,196 | 34.0% |
Household Income by Householder Age in Andover
The median household income in Andover is $130,417, with the highest median household income of $196,076 found in the 45 to 64 years age bracket for the primary householder. A total of 1,613 households (45.8%) fall into this category.
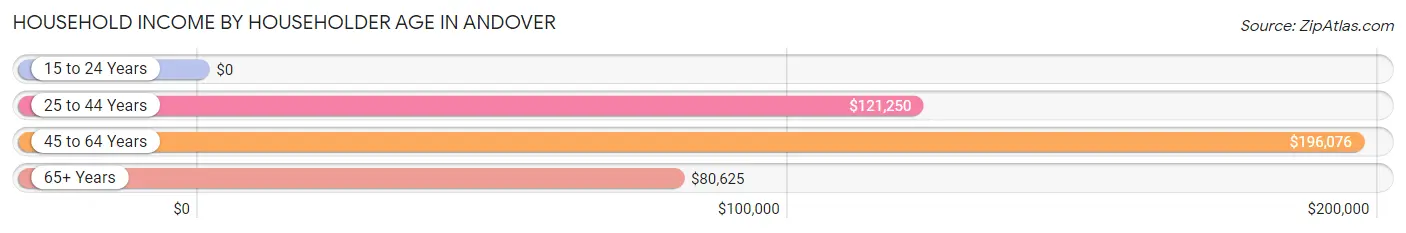
| Income Bracket | # Households | Median Income |
| 15 to 24 Years | 0 (0.0%) | $0 |
| 25 to 44 Years | 733 (20.8%) | $121,250 |
| 45 to 64 Years | 1,613 (45.8%) | $196,076 |
| 65+ Years | 1,173 (33.3%) | $80,625 |
| Total | 3,519 (100.0%) | $130,417 |
Poverty in Andover
Income Below Poverty by Sex and Age in Andover
With 5.8% poverty level for males and 8.6% for females among the residents of Andover, 15 year old males and 5 year old females are the most vulnerable to poverty, with 65 males (89.0%) and 38 females (61.3%) in their respective age groups living below the poverty level.
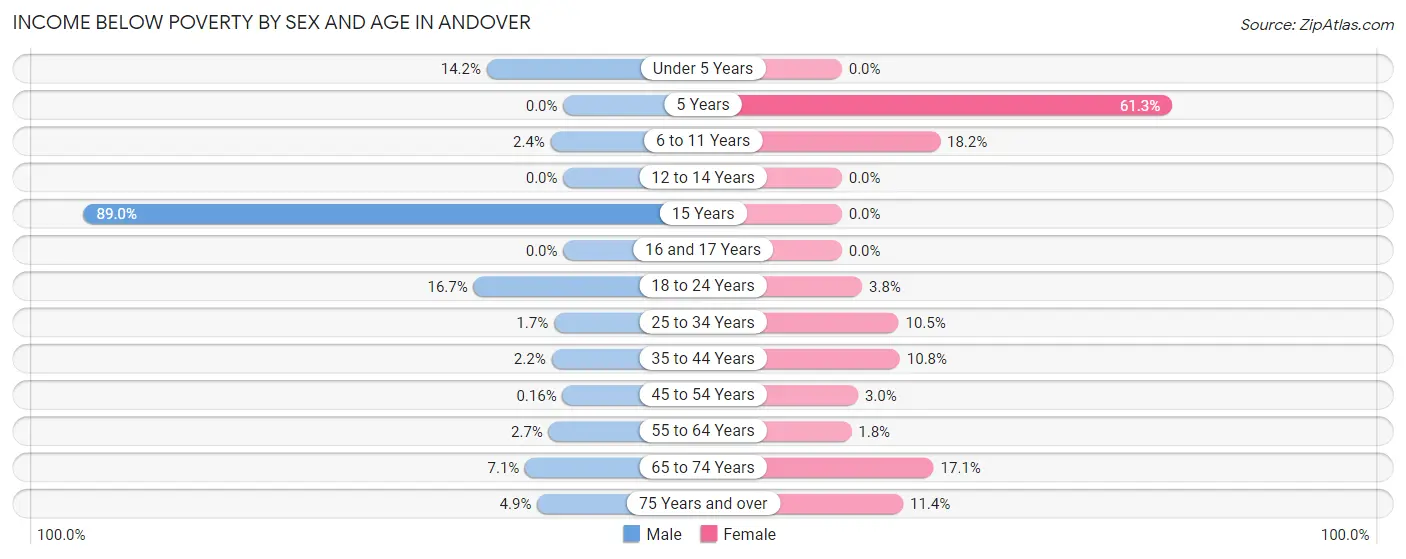
| Age Bracket | Male | Female |
| Under 5 Years | 27 (14.2%) | 0 (0.0%) |
| 5 Years | 0 (0.0%) | 38 (61.3%) |
| 6 to 11 Years | 7 (2.4%) | 60 (18.2%) |
| 12 to 14 Years | 0 (0.0%) | 0 (0.0%) |
| 15 Years | 65 (89.0%) | 0 (0.0%) |
| 16 and 17 Years | 0 (0.0%) | 0 (0.0%) |
| 18 to 24 Years | 42 (16.7%) | 11 (3.8%) |
| 25 to 34 Years | 5 (1.7%) | 35 (10.5%) |
| 35 to 44 Years | 7 (2.2%) | 58 (10.8%) |
| 45 to 54 Years | 1 (0.2%) | 20 (3.0%) |
| 55 to 64 Years | 24 (2.7%) | 13 (1.8%) |
| 65 to 74 Years | 40 (7.1%) | 75 (17.1%) |
| 75 Years and over | 8 (4.9%) | 58 (11.4%) |
| Total | 226 (5.8%) | 368 (8.6%) |
Income Above Poverty by Sex and Age in Andover
According to the poverty statistics in Andover, males aged 5 years and females aged under 5 years are the age groups that are most secure financially, with 100.0% of males and 100.0% of females in these age groups living above the poverty line.
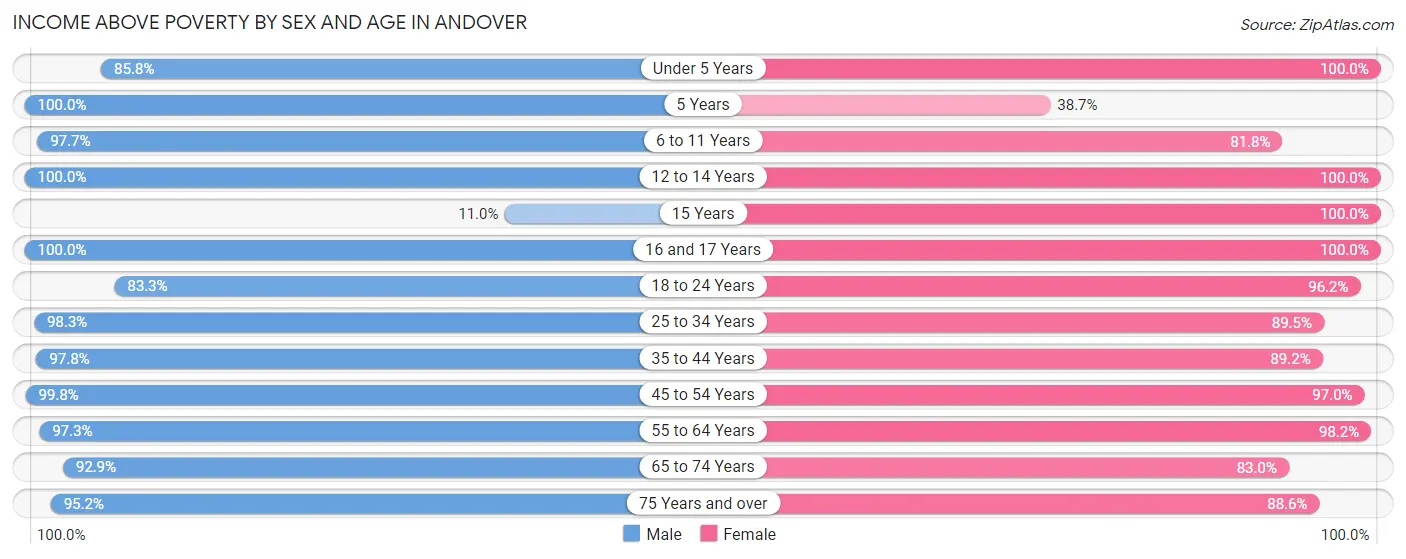
| Age Bracket | Male | Female |
| Under 5 Years | 163 (85.8%) | 162 (100.0%) |
| 5 Years | 35 (100.0%) | 24 (38.7%) |
| 6 to 11 Years | 291 (97.7%) | 269 (81.8%) |
| 12 to 14 Years | 87 (100.0%) | 109 (100.0%) |
| 15 Years | 8 (11.0%) | 55 (100.0%) |
| 16 and 17 Years | 110 (100.0%) | 76 (100.0%) |
| 18 to 24 Years | 210 (83.3%) | 281 (96.2%) |
| 25 to 34 Years | 282 (98.3%) | 297 (89.5%) |
| 35 to 44 Years | 311 (97.8%) | 480 (89.2%) |
| 45 to 54 Years | 621 (99.8%) | 647 (97.0%) |
| 55 to 64 Years | 858 (97.3%) | 721 (98.2%) |
| 65 to 74 Years | 524 (92.9%) | 365 (83.0%) |
| 75 Years and over | 157 (95.2%) | 452 (88.6%) |
| Total | 3,657 (94.2%) | 3,938 (91.4%) |
Income Below Poverty Among Married-Couple Families in Andover
The poverty statistics for married-couple families in Andover show that 1.3% or 25 of the total 1,941 families live below the poverty line. Families with no children have the highest poverty rate of 1.5%, comprising of 18 families. On the other hand, families with 3 or 4 children have the lowest poverty rate of 0.0%, which includes 0 families.
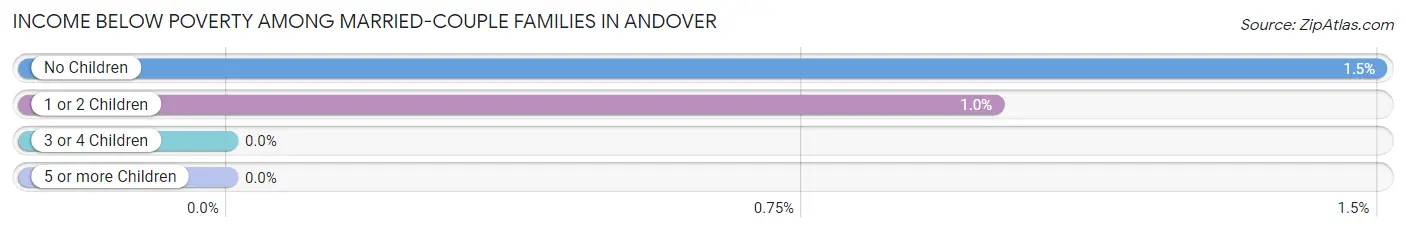
| Children | Above Poverty | Below Poverty |
| No Children | 1,179 (98.5%) | 18 (1.5%) |
| 1 or 2 Children | 691 (99.0%) | 7 (1.0%) |
| 3 or 4 Children | 46 (100.0%) | 0 (0.0%) |
| 5 or more Children | 0 (0.0%) | 0 (0.0%) |
| Total | 1,916 (98.7%) | 25 (1.3%) |
Income Below Poverty Among Single-Parent Households in Andover
According to the poverty data in Andover, 15.2% or 9 single-father households and 21.8% or 70 single-mother households are living below the poverty line. Among single-father households, those with no children have the highest poverty rate, with 9 households (19.2%) experiencing poverty. Likewise, among single-mother households, those with 1 or 2 children have the highest poverty rate, with 60 households (30.5%) falling below the poverty line.
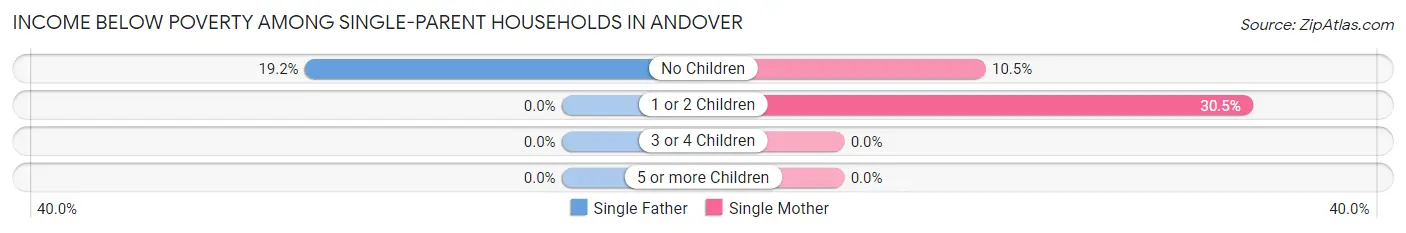
| Children | Single Father | Single Mother |
| No Children | 9 (19.2%) | 10 (10.5%) |
| 1 or 2 Children | 0 (0.0%) | 60 (30.5%) |
| 3 or 4 Children | 0 (0.0%) | 0 (0.0%) |
| 5 or more Children | 0 (0.0%) | 0 (0.0%) |
| Total | 9 (15.2%) | 70 (21.8%) |
Income Below Poverty Among Married-Couple vs Single-Parent Households in Andover
The poverty data for Andover shows that 25 of the married-couple family households (1.3%) and 79 of the single-parent households (20.8%) are living below the poverty level. Within the married-couple family households, those with no children have the highest poverty rate, with 18 households (1.5%) falling below the poverty line. Among the single-parent households, those with 1 or 2 children have the highest poverty rate, with 60 household (28.7%) living below poverty.
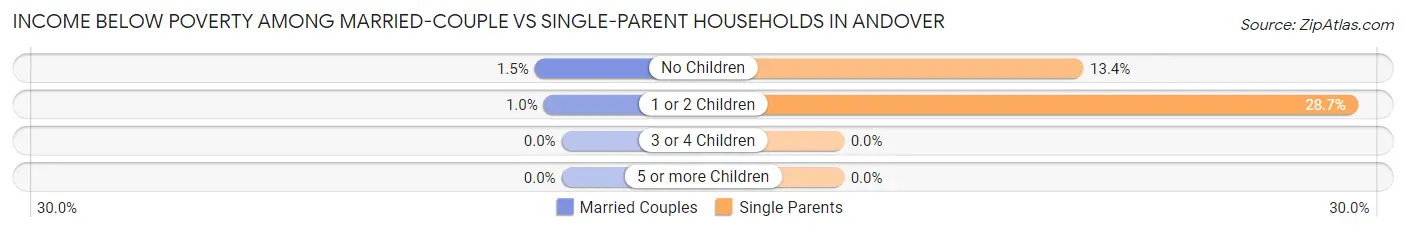
| Children | Married-Couple Families | Single-Parent Households |
| No Children | 18 (1.5%) | 19 (13.4%) |
| 1 or 2 Children | 7 (1.0%) | 60 (28.7%) |
| 3 or 4 Children | 0 (0.0%) | 0 (0.0%) |
| 5 or more Children | 0 (0.0%) | 0 (0.0%) |
| Total | 25 (1.3%) | 79 (20.8%) |
Race in Andover
The most populous races in Andover are White / Caucasian (7,644 | 81.2%), Asian (880 | 9.3%), and Hispanic or Latino (765 | 8.1%).
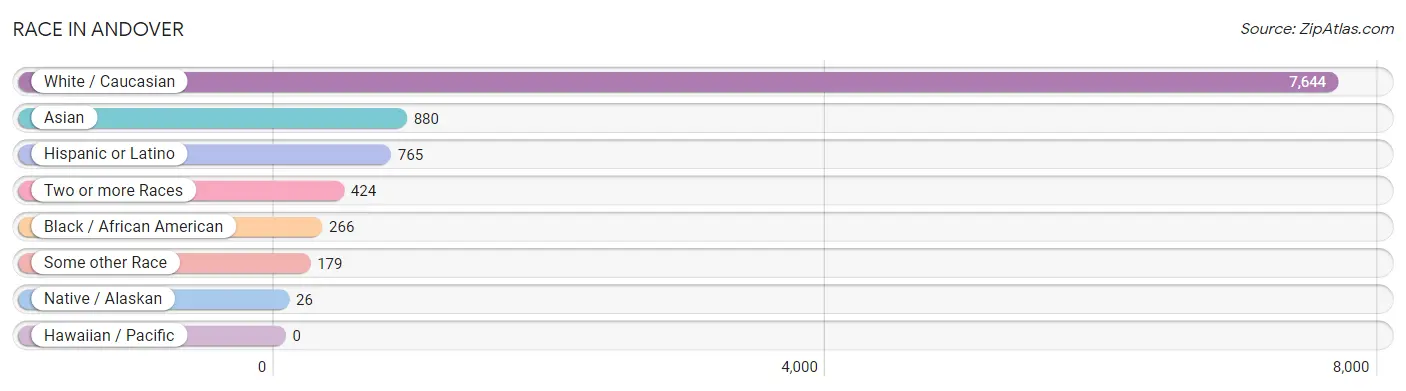
| Race | # Population | % Population |
| Asian | 880 | 9.3% |
| Black / African American | 266 | 2.8% |
| Hawaiian / Pacific | 0 | 0.0% |
| Hispanic or Latino | 765 | 8.1% |
| Native / Alaskan | 26 | 0.3% |
| White / Caucasian | 7,644 | 81.2% |
| Two or more Races | 424 | 4.5% |
| Some other Race | 179 | 1.9% |
| Total | 9,419 | 100.0% |
Ancestry in Andover
The most populous ancestries reported in Andover are Irish (2,656 | 28.2%), Italian (1,575 | 16.7%), English (979 | 10.4%), German (633 | 6.7%), and Polish (451 | 4.8%), together accounting for 66.8% of all Andover residents.
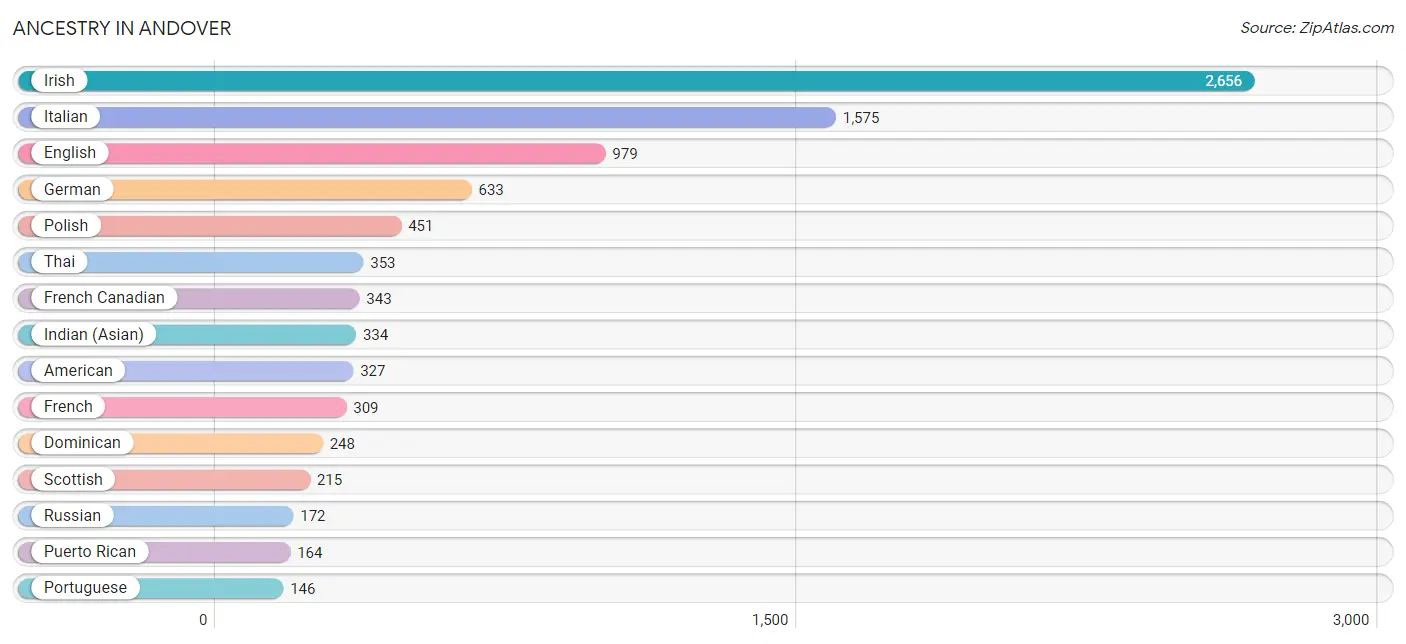
| Ancestry | # Population | % Population |
| African | 6 | 0.1% |
| Albanian | 44 | 0.5% |
| American | 327 | 3.5% |
| Arab | 66 | 0.7% |
| Armenian | 48 | 0.5% |
| Austrian | 32 | 0.3% |
| Belgian | 8 | 0.1% |
| Bhutanese | 46 | 0.5% |
| British | 60 | 0.6% |
| Burmese | 118 | 1.3% |
| Cajun | 9 | 0.1% |
| Canadian | 82 | 0.9% |
| Cape Verdean | 7 | 0.1% |
| Central American | 51 | 0.5% |
| Chilean | 4 | 0.0% |
| Chippewa | 13 | 0.1% |
| Czech | 20 | 0.2% |
| Czechoslovakian | 17 | 0.2% |
| Danish | 12 | 0.1% |
| Dominican | 248 | 2.6% |
| Dutch | 31 | 0.3% |
| Eastern European | 33 | 0.4% |
| English | 979 | 10.4% |
| European | 98 | 1.0% |
| Finnish | 77 | 0.8% |
| French | 309 | 3.3% |
| French Canadian | 343 | 3.6% |
| German | 633 | 6.7% |
| Ghanaian | 12 | 0.1% |
| Greek | 43 | 0.5% |
| Guatemalan | 51 | 0.5% |
| Haitian | 27 | 0.3% |
| Hungarian | 14 | 0.2% |
| Indian (Asian) | 334 | 3.5% |
| Iranian | 9 | 0.1% |
| Irish | 2,656 | 28.2% |
| Italian | 1,575 | 16.7% |
| Jamaican | 107 | 1.1% |
| Japanese | 32 | 0.3% |
| Korean | 4 | 0.0% |
| Laotian | 17 | 0.2% |
| Lebanese | 66 | 0.7% |
| Lithuanian | 54 | 0.6% |
| Mexican | 58 | 0.6% |
| Native Hawaiian | 34 | 0.4% |
| Northern European | 7 | 0.1% |
| Norwegian | 11 | 0.1% |
| Pakistani | 5 | 0.1% |
| Peruvian | 80 | 0.9% |
| Polish | 451 | 4.8% |
| Portuguese | 146 | 1.5% |
| Puerto Rican | 164 | 1.7% |
| Romanian | 74 | 0.8% |
| Russian | 172 | 1.8% |
| Scotch-Irish | 3 | 0.0% |
| Scottish | 215 | 2.3% |
| Senegalese | 12 | 0.1% |
| Slovak | 31 | 0.3% |
| Slovene | 12 | 0.1% |
| South American | 84 | 0.9% |
| Spaniard | 47 | 0.5% |
| Subsaharan African | 27 | 0.3% |
| Swedish | 45 | 0.5% |
| Syrian | 8 | 0.1% |
| Thai | 353 | 3.7% |
| Trinidadian and Tobagonian | 16 | 0.2% |
| Turkish | 11 | 0.1% |
| Ukrainian | 31 | 0.3% |
| Welsh | 91 | 1.0% | View All 69 Rows |
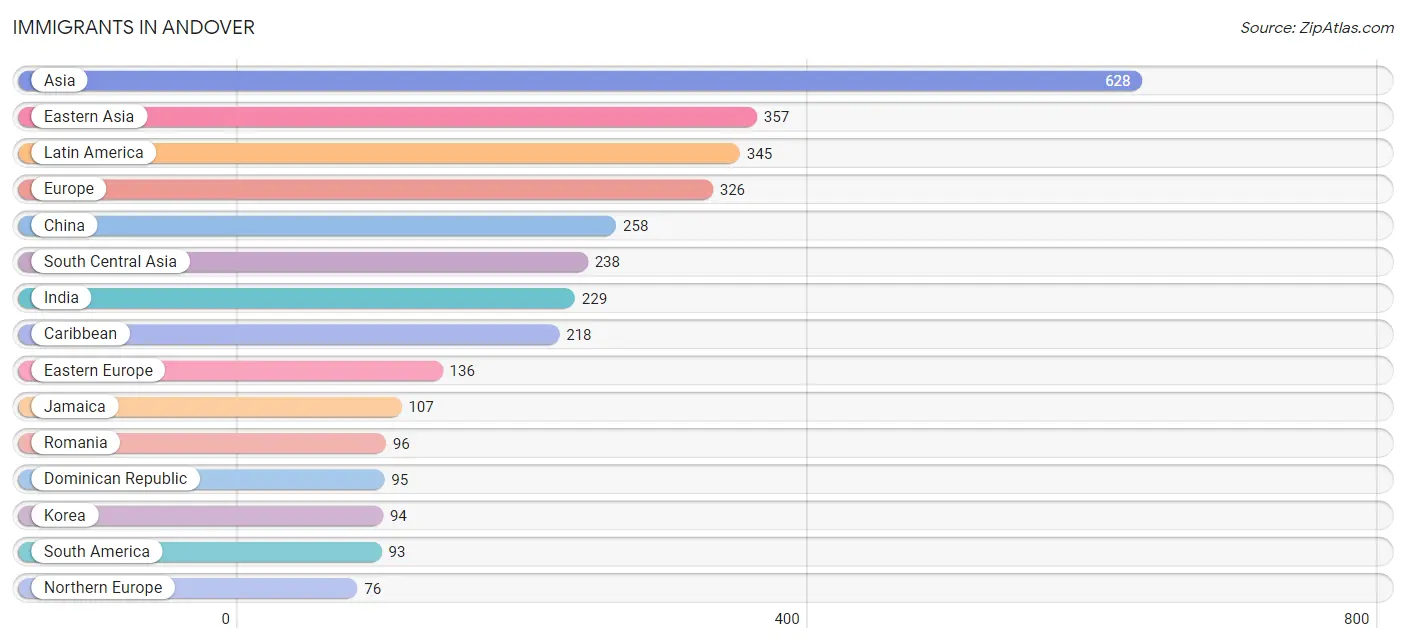
Immigrants in Andover
The most numerous immigrant groups reported in Andover came from Asia (628 | 6.7%), Eastern Asia (357 | 3.8%), Latin America (345 | 3.7%), Europe (326 | 3.5%), and China (258 | 2.7%), together accounting for 20.3% of all Andover residents.
| Immigration Origin | # Population | % Population |
| Asia | 628 | 6.7% |
| Bangladesh | 9 | 0.1% |
| Brazil | 24 | 0.3% |
| Cambodia | 16 | 0.2% |
| Canada | 23 | 0.2% |
| Caribbean | 218 | 2.3% |
| Central America | 34 | 0.4% |
| Chile | 4 | 0.0% |
| China | 258 | 2.7% |
| Czechoslovakia | 4 | 0.0% |
| Dominican Republic | 95 | 1.0% |
| Eastern Asia | 357 | 3.8% |
| Eastern Europe | 136 | 1.4% |
| Europe | 326 | 3.5% |
| France | 18 | 0.2% |
| Germany | 20 | 0.2% |
| Greece | 12 | 0.1% |
| Hong Kong | 12 | 0.1% |
| India | 229 | 2.4% |
| Indonesia | 17 | 0.2% |
| Ireland | 32 | 0.3% |
| Italy | 64 | 0.7% |
| Jamaica | 107 | 1.1% |
| Japan | 5 | 0.1% |
| Korea | 94 | 1.0% |
| Latin America | 345 | 3.7% |
| Mexico | 34 | 0.4% |
| Northern Europe | 76 | 0.8% |
| Peru | 65 | 0.7% |
| Romania | 96 | 1.0% |
| Russia | 36 | 0.4% |
| South America | 93 | 1.0% |
| South Central Asia | 238 | 2.5% |
| South Eastern Asia | 33 | 0.4% |
| Southern Europe | 76 | 0.8% |
| Sweden | 8 | 0.1% |
| Taiwan | 59 | 0.6% |
| Trinidad and Tobago | 16 | 0.2% |
| Western Europe | 38 | 0.4% | View All 39 Rows |
Sex and Age in Andover
Sex and Age in Andover
The most populous age groups in Andover are 60 to 64 Years (535 | 12.2%) for men and 20 to 24 Years (560 | 11.1%) for women.
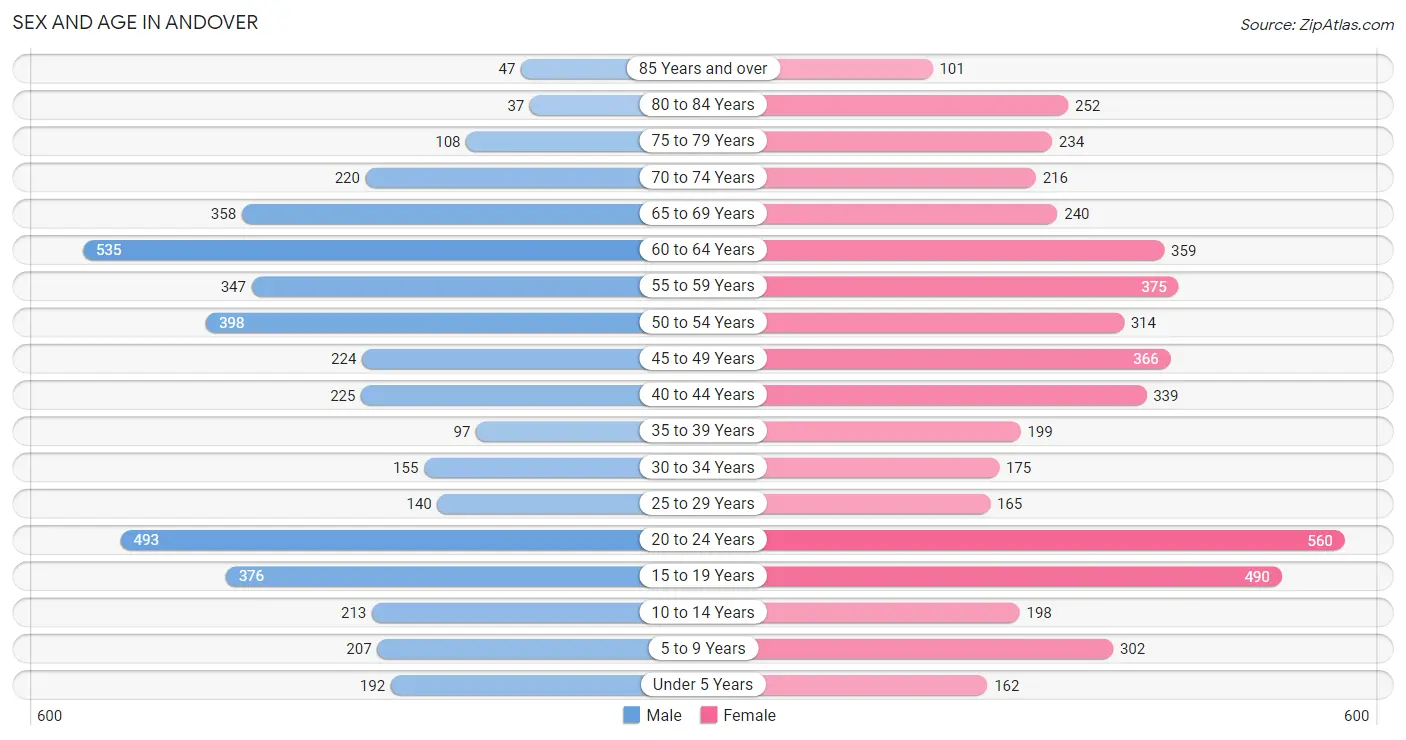
| Age Bracket | Male | Female |
| Under 5 Years | 192 (4.4%) | 162 (3.2%) |
| 5 to 9 Years | 207 (4.7%) | 302 (6.0%) |
| 10 to 14 Years | 213 (4.9%) | 198 (3.9%) |
| 15 to 19 Years | 376 (8.6%) | 490 (9.7%) |
| 20 to 24 Years | 493 (11.3%) | 560 (11.1%) |
| 25 to 29 Years | 140 (3.2%) | 165 (3.3%) |
| 30 to 34 Years | 155 (3.5%) | 175 (3.5%) |
| 35 to 39 Years | 97 (2.2%) | 199 (3.9%) |
| 40 to 44 Years | 225 (5.1%) | 339 (6.7%) |
| 45 to 49 Years | 224 (5.1%) | 366 (7.2%) |
| 50 to 54 Years | 398 (9.1%) | 314 (6.2%) |
| 55 to 59 Years | 347 (7.9%) | 375 (7.4%) |
| 60 to 64 Years | 535 (12.2%) | 359 (7.1%) |
| 65 to 69 Years | 358 (8.2%) | 240 (4.8%) |
| 70 to 74 Years | 220 (5.0%) | 216 (4.3%) |
| 75 to 79 Years | 108 (2.5%) | 234 (4.6%) |
| 80 to 84 Years | 37 (0.9%) | 252 (5.0%) |
| 85 Years and over | 47 (1.1%) | 101 (2.0%) |
| Total | 4,372 (100.0%) | 5,047 (100.0%) |
Families and Households in Andover
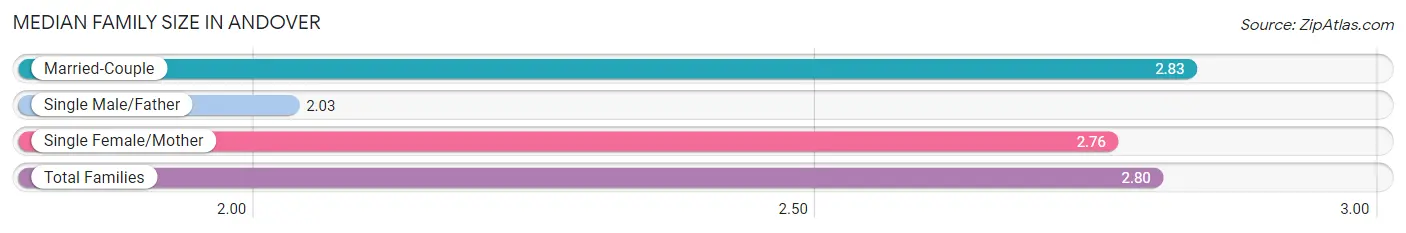
Median Family Size in Andover
The median family size in Andover is 2.80 persons per family, with married-couple families (1,941 | 83.6%) accounting for the largest median family size of 2.83 persons per family. On the other hand, single male/father families (59 | 2.5%) represent the smallest median family size with 2.03 persons per family.
| Family Type | # Families | Family Size |
| Married-Couple | 1,941 (83.6%) | 2.83 |
| Single Male/Father | 59 (2.5%) | 2.03 |
| Single Female/Mother | 321 (13.8%) | 2.76 |
| Total Families | 2,321 (100.0%) | 2.80 |
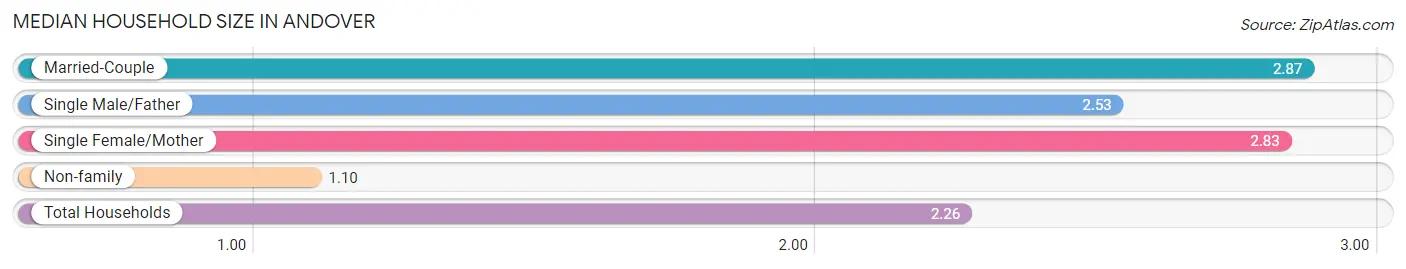
Median Household Size in Andover
The median household size in Andover is 2.26 persons per household, with married-couple households (1,941 | 55.2%) accounting for the largest median household size of 2.87 persons per household. non-family households (1,198 | 34.0%) represent the smallest median household size with 1.10 persons per household.
| Household Type | # Households | Household Size |
| Married-Couple | 1,941 (55.2%) | 2.87 |
| Single Male/Father | 59 (1.7%) | 2.53 |
| Single Female/Mother | 321 (9.1%) | 2.83 |
| Non-family | 1,198 (34.0%) | 1.10 |
| Total Households | 3,519 (100.0%) | 2.26 |
Household Size by Marriage Status in Andover
Out of a total of 3,519 households in Andover, 2,321 (66.0%) are family households, while 1,198 (34.0%) are nonfamily households. The most numerous type of family households are 2-person households, comprising 990, and the most common type of nonfamily households are 1-person households, comprising 1,102.
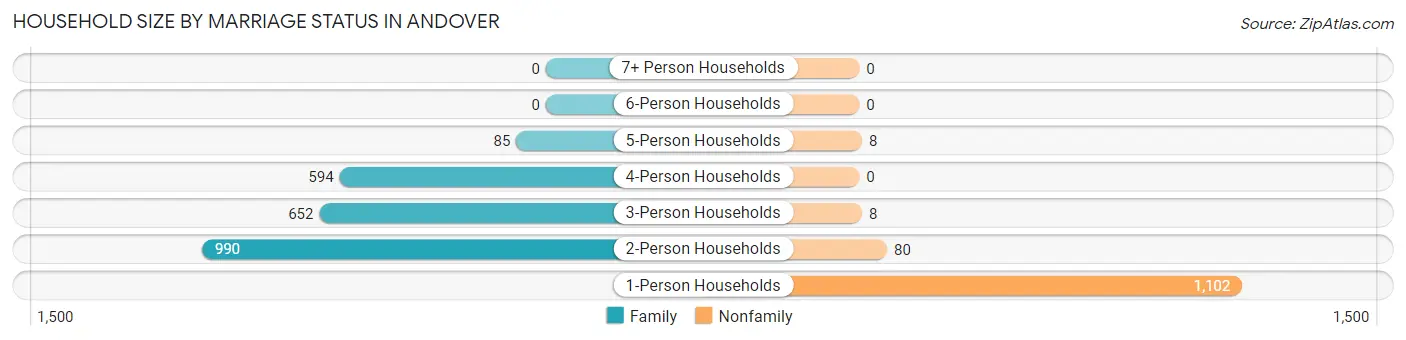
| Household Size | Family Households | Nonfamily Households |
| 1-Person Households | - | 1,102 (31.3%) |
| 2-Person Households | 990 (28.1%) | 80 (2.3%) |
| 3-Person Households | 652 (18.5%) | 8 (0.2%) |
| 4-Person Households | 594 (16.9%) | 0 (0.0%) |
| 5-Person Households | 85 (2.4%) | 8 (0.2%) |
| 6-Person Households | 0 (0.0%) | 0 (0.0%) |
| 7+ Person Households | 0 (0.0%) | 0 (0.0%) |
| Total | 2,321 (66.0%) | 1,198 (34.0%) |
Female Fertility in Andover
Fertility by Age in Andover
Average fertility rate in Andover is 18.0 births per 1,000 women. Women in the age bracket of 20 to 34 years have the highest fertility rate with 30.0 births per 1,000 women. Women in the age bracket of 20 to 34 years acount for 64.3% of all women with births.
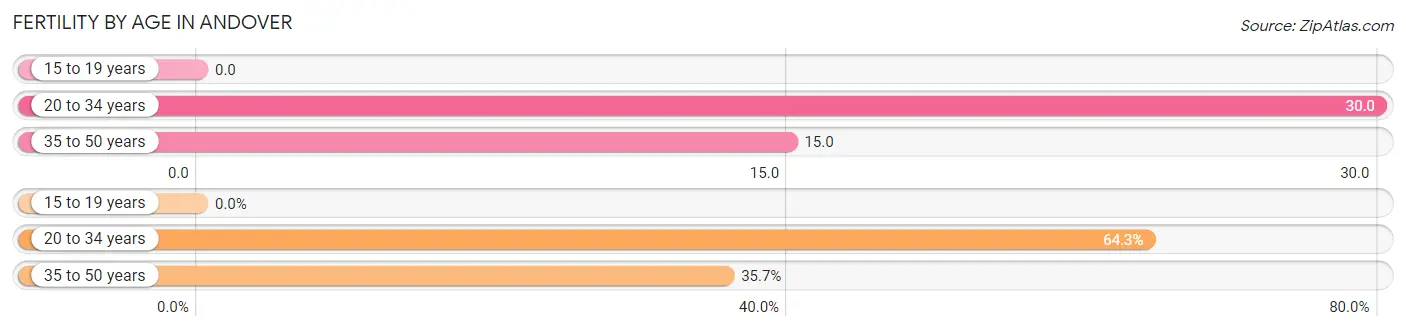
| Age Bracket | Women with Births | Births / 1,000 Women |
| 15 to 19 years | 0 (0.0%) | 0.0 |
| 20 to 34 years | 27 (64.3%) | 30.0 |
| 35 to 50 years | 15 (35.7%) | 15.0 |
| Total | 42 (100.0%) | 18.0 |
Fertility by Age by Marriage Status in Andover
78.6% of women with births (42) in Andover are married. The highest percentage of unmarried women with births falls into 20 to 34 years age bracket with 33.3% of them unmarried at the time of birth, while the lowest percentage of unmarried women with births belong to 35 to 50 years age bracket with 0.0% of them unmarried.
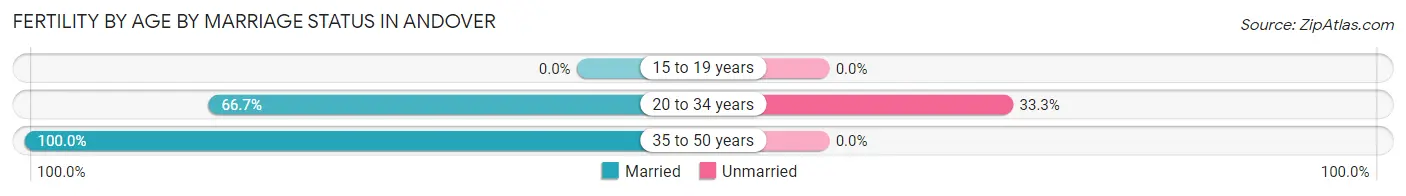
| Age Bracket | Married | Unmarried |
| 15 to 19 years | 0 (0.0%) | 0 (0.0%) |
| 20 to 34 years | 18 (66.7%) | 9 (33.3%) |
| 35 to 50 years | 15 (100.0%) | 0 (0.0%) |
| Total | 33 (78.6%) | 9 (21.4%) |
Fertility by Education in Andover
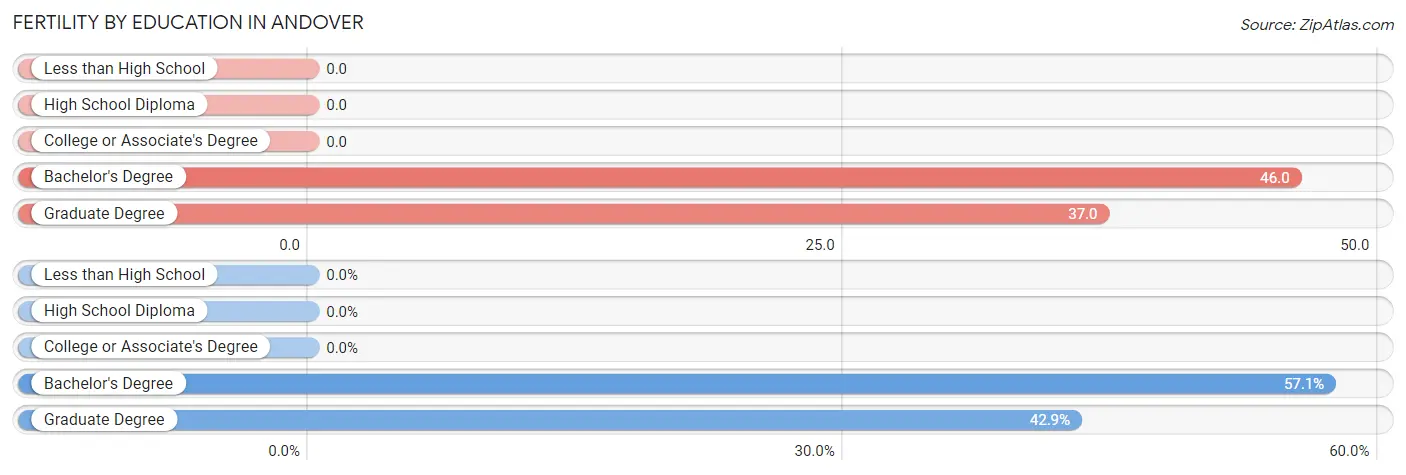
| Educational Attainment | Women with Births | Births / 1,000 Women |
| Less than High School | 0 (0.0%) | 0.0 |
| High School Diploma | 0 (0.0%) | 0.0 |
| College or Associate's Degree | 0 (0.0%) | 0.0 |
| Bachelor's Degree | 24 (57.1%) | 46.0 |
| Graduate Degree | 18 (42.9%) | 37.0 |
| Total | 42 (100.0%) | 18.0 |
Fertility by Education by Marriage Status in Andover
21.4% of women with births in Andover are unmarried. Women with the educational attainment of graduate degree are most likely to be married with 100.0% of them married at childbirth, while women with the educational attainment of bachelor's degree are least likely to be married with 37.5% of them unmarried at childbirth.
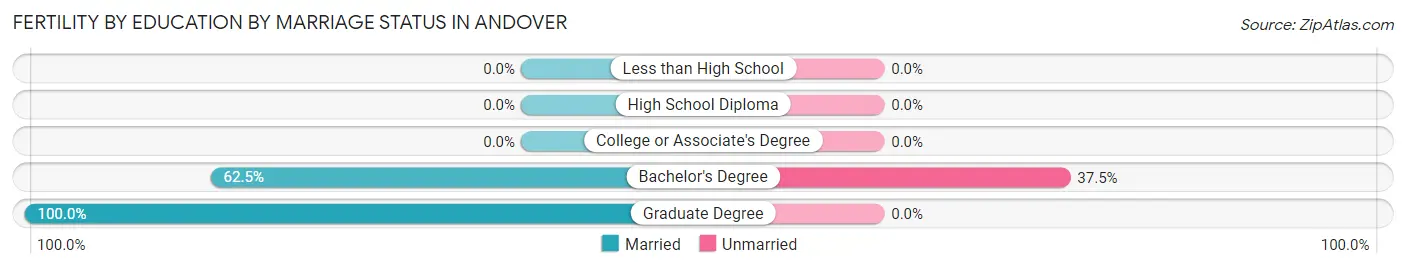
| Educational Attainment | Married | Unmarried |
| Less than High School | 0 (0.0%) | 0 (0.0%) |
| High School Diploma | 0 (0.0%) | 0 (0.0%) |
| College or Associate's Degree | 0 (0.0%) | 0 (0.0%) |
| Bachelor's Degree | 15 (62.5%) | 9 (37.5%) |
| Graduate Degree | 18 (100.0%) | 0 (0.0%) |
| Total | 33 (78.6%) | 9 (21.4%) |
Employment Characteristics in Andover
Employment by Class of Employer in Andover
Among the 4,825 employed individuals in Andover, private company employees (2,866 | 59.4%), not-for-profit organizations (567 | 11.7%), and state government employees (410 | 8.5%) make up the most common classes of employment.
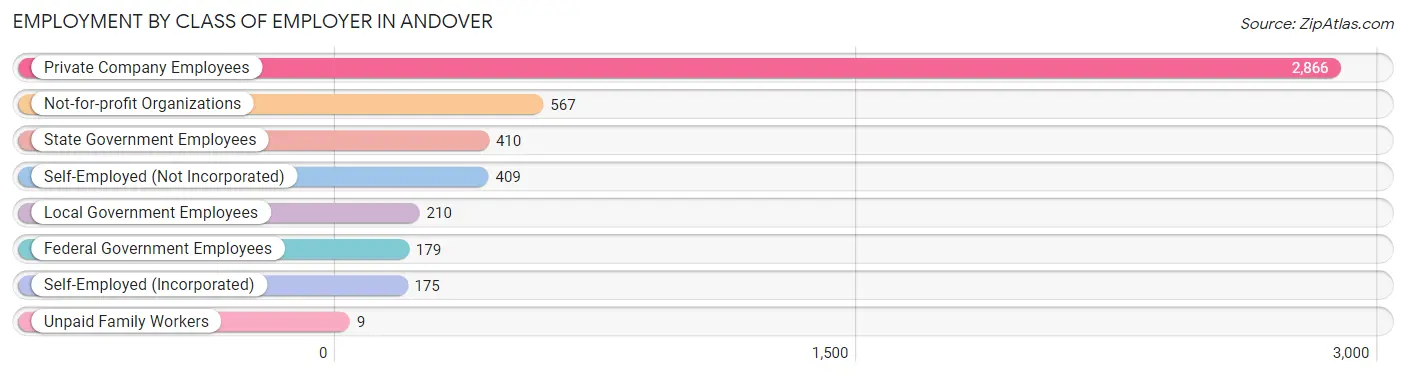
| Employer Class | # Employees | % Employees |
| Private Company Employees | 2,866 | 59.4% |
| Self-Employed (Incorporated) | 175 | 3.6% |
| Self-Employed (Not Incorporated) | 409 | 8.5% |
| Not-for-profit Organizations | 567 | 11.7% |
| Local Government Employees | 210 | 4.3% |
| State Government Employees | 410 | 8.5% |
| Federal Government Employees | 179 | 3.7% |
| Unpaid Family Workers | 9 | 0.2% |
| Total | 4,825 | 100.0% |
Employment Status by Age in Andover
According to the labor force statistics for Andover, out of the total population over 16 years of age (8,017), 66.7% or 5,347 individuals are in the labor force, with 7.2% or 385 of them unemployed. The age group with the highest labor force participation rate is 25 to 29 years, with 95.1% or 290 individuals in the labor force. Within the labor force, the 75 years and over age range has the highest percentage of unemployed individuals, with 30.9% or 29 of them being unemployed.
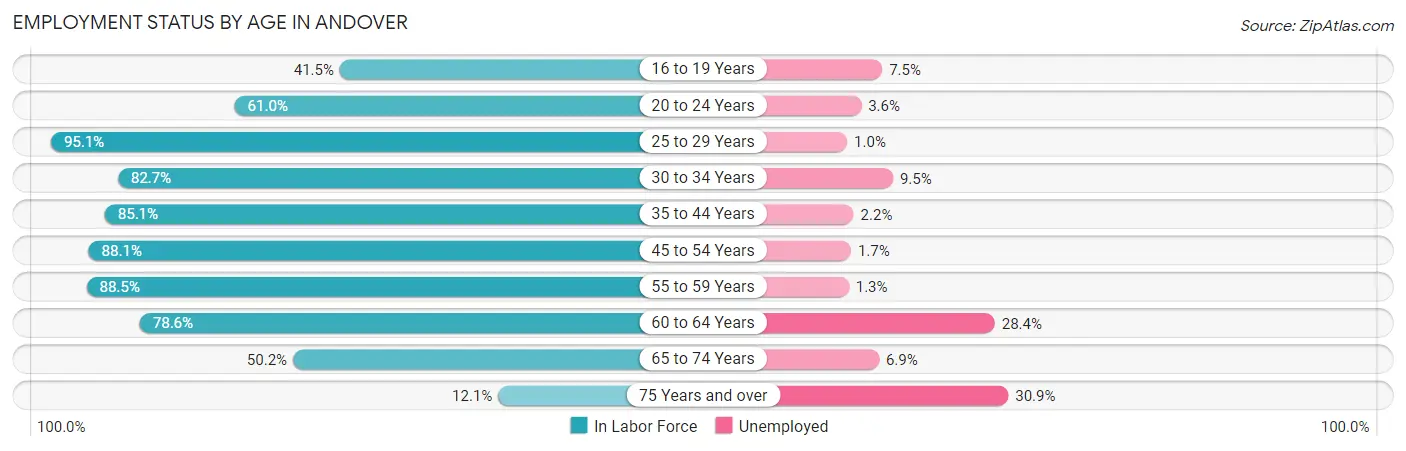
| Age Bracket | In Labor Force | Unemployed |
| 16 to 19 Years | 306 (41.5%) | 23 (7.5%) |
| 20 to 24 Years | 642 (61.0%) | 23 (3.6%) |
| 25 to 29 Years | 290 (95.1%) | 3 (1.0%) |
| 30 to 34 Years | 273 (82.7%) | 26 (9.5%) |
| 35 to 44 Years | 732 (85.1%) | 16 (2.2%) |
| 45 to 54 Years | 1,147 (88.1%) | 19 (1.7%) |
| 55 to 59 Years | 639 (88.5%) | 8 (1.3%) |
| 60 to 64 Years | 703 (78.6%) | 200 (28.4%) |
| 65 to 74 Years | 519 (50.2%) | 36 (6.9%) |
| 75 Years and over | 94 (12.1%) | 29 (30.9%) |
| Total | 5,347 (66.7%) | 385 (7.2%) |
Employment Status by Educational Attainment in Andover
According to labor force statistics for Andover, 85.7% of individuals (3,782) out of the total population between 25 and 64 years of age (4,413) are in the labor force, with 7.2% or 272 of them being unemployed. The group with the highest labor force participation rate are those with the educational attainment of less than high school, with 92.4% or 145 individuals in the labor force. Within the labor force, individuals with high school diploma education have the highest percentage of unemployment, with 9.8% or 25 of them being unemployed.
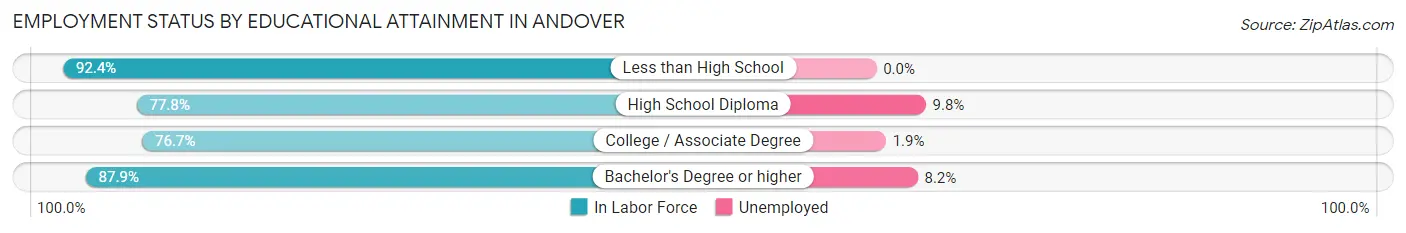
| Educational Attainment | In Labor Force | Unemployed |
| Less than High School | 145 (92.4%) | 0 (0.0%) |
| High School Diploma | 256 (77.8%) | 32 (9.8%) |
| College / Associate Degree | 476 (76.7%) | 12 (1.9%) |
| Bachelor's Degree or higher | 2,906 (87.9%) | 271 (8.2%) |
| Total | 3,782 (85.7%) | 318 (7.2%) |
Employment Occupations by Sex in Andover
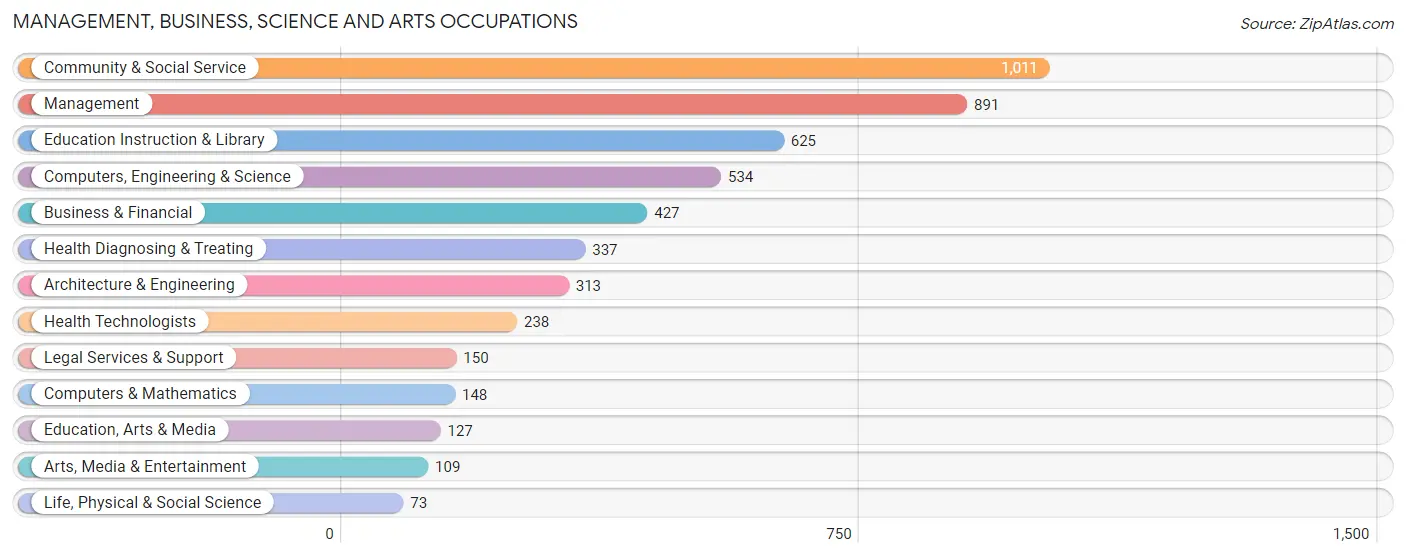
Management, Business, Science and Arts Occupations
The most common Management, Business, Science and Arts occupations in Andover are Community & Social Service (1,011 | 20.4%), Management (891 | 18.0%), Education Instruction & Library (625 | 12.6%), Computers, Engineering & Science (534 | 10.8%), and Business & Financial (427 | 8.6%).
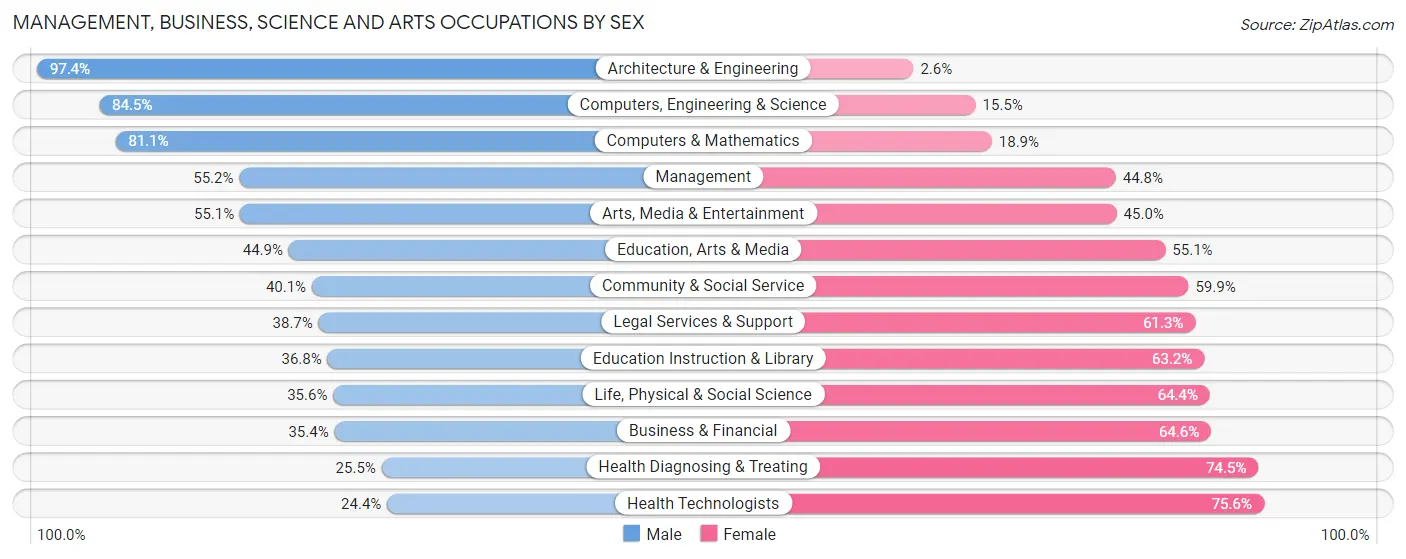
Management, Business, Science and Arts Occupations by Sex
Within the Management, Business, Science and Arts occupations in Andover, the most male-oriented occupations are Architecture & Engineering (97.4%), Computers, Engineering & Science (84.5%), and Computers & Mathematics (81.1%), while the most female-oriented occupations are Health Technologists (75.6%), Health Diagnosing & Treating (74.5%), and Business & Financial (64.6%).
| Occupation | Male | Female |
| Management | 492 (55.2%) | 399 (44.8%) |
| Business & Financial | 151 (35.4%) | 276 (64.6%) |
| Computers, Engineering & Science | 451 (84.5%) | 83 (15.5%) |
| Computers & Mathematics | 120 (81.1%) | 28 (18.9%) |
| Architecture & Engineering | 305 (97.4%) | 8 (2.6%) |
| Life, Physical & Social Science | 26 (35.6%) | 47 (64.4%) |
| Community & Social Service | 405 (40.1%) | 606 (59.9%) |
| Education, Arts & Media | 57 (44.9%) | 70 (55.1%) |
| Legal Services & Support | 58 (38.7%) | 92 (61.3%) |
| Education Instruction & Library | 230 (36.8%) | 395 (63.2%) |
| Arts, Media & Entertainment | 60 (55.0%) | 49 (45.0%) |
| Health Diagnosing & Treating | 86 (25.5%) | 251 (74.5%) |
| Health Technologists | 58 (24.4%) | 180 (75.6%) |
| Total (Category) | 1,585 (49.5%) | 1,615 (50.5%) |
| Total (Overall) | 2,444 (49.2%) | 2,518 (50.7%) |
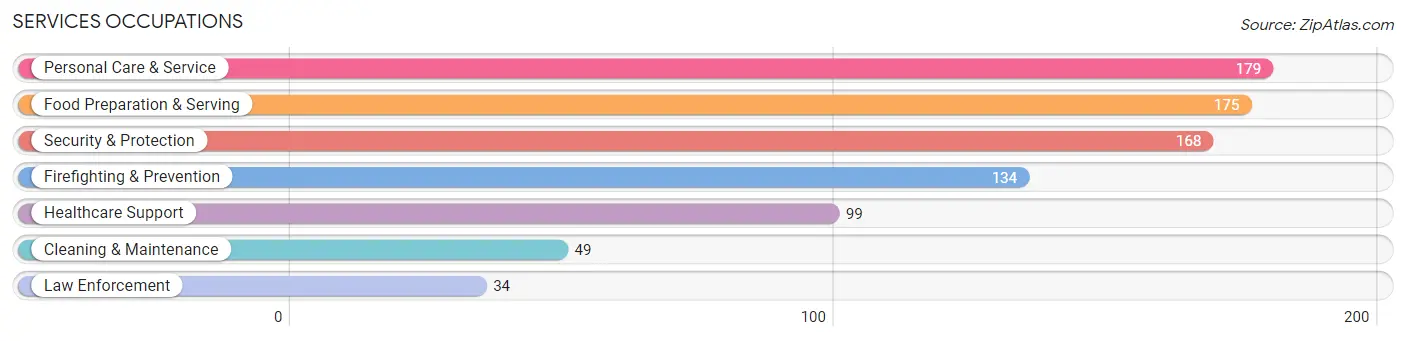
Services Occupations
The most common Services occupations in Andover are Personal Care & Service (179 | 3.6%), Food Preparation & Serving (175 | 3.5%), Security & Protection (168 | 3.4%), Firefighting & Prevention (134 | 2.7%), and Healthcare Support (99 | 2.0%).
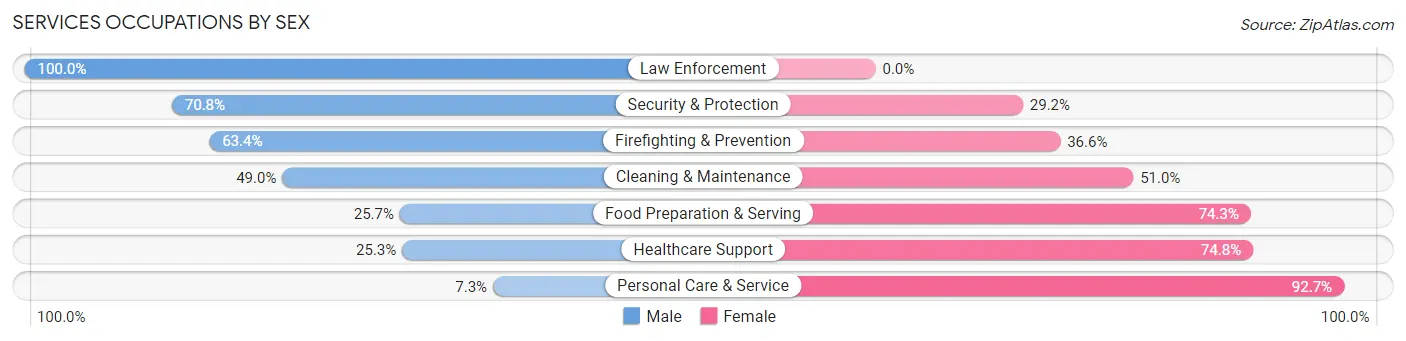
Services Occupations by Sex
Within the Services occupations in Andover, the most male-oriented occupations are Law Enforcement (100.0%), Security & Protection (70.8%), and Firefighting & Prevention (63.4%), while the most female-oriented occupations are Personal Care & Service (92.7%), Healthcare Support (74.8%), and Food Preparation & Serving (74.3%).
| Occupation | Male | Female |
| Healthcare Support | 25 (25.3%) | 74 (74.8%) |
| Security & Protection | 119 (70.8%) | 49 (29.2%) |
| Firefighting & Prevention | 85 (63.4%) | 49 (36.6%) |
| Law Enforcement | 34 (100.0%) | 0 (0.0%) |
| Food Preparation & Serving | 45 (25.7%) | 130 (74.3%) |
| Cleaning & Maintenance | 24 (49.0%) | 25 (51.0%) |
| Personal Care & Service | 13 (7.3%) | 166 (92.7%) |
| Total (Category) | 226 (33.7%) | 444 (66.3%) |
| Total (Overall) | 2,444 (49.2%) | 2,518 (50.7%) |
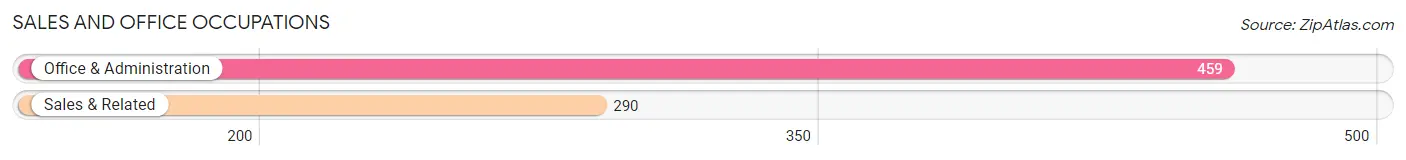
Sales and Office Occupations
The most common Sales and Office occupations in Andover are Office & Administration (459 | 9.2%), and Sales & Related (290 | 5.8%).
Sales and Office Occupations by Sex
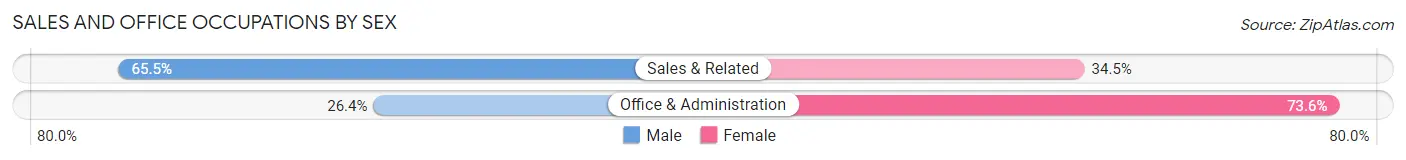
| Occupation | Male | Female |
| Sales & Related | 190 (65.5%) | 100 (34.5%) |
| Office & Administration | 121 (26.4%) | 338 (73.6%) |
| Total (Category) | 311 (41.5%) | 438 (58.5%) |
| Total (Overall) | 2,444 (49.2%) | 2,518 (50.7%) |
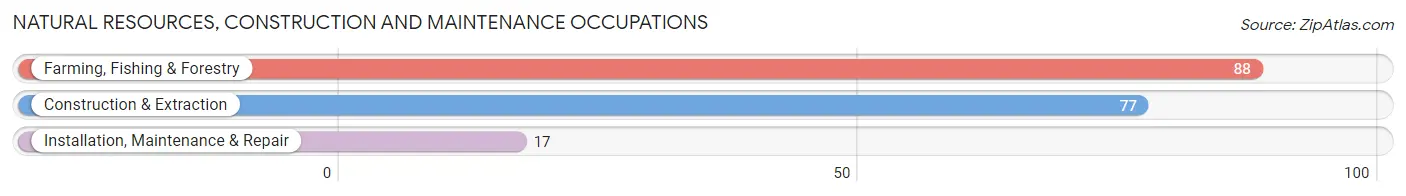
Natural Resources, Construction and Maintenance Occupations
The most common Natural Resources, Construction and Maintenance occupations in Andover are Farming, Fishing & Forestry (88 | 1.8%), Construction & Extraction (77 | 1.5%), and Installation, Maintenance & Repair (17 | 0.3%).
Natural Resources, Construction and Maintenance Occupations by Sex
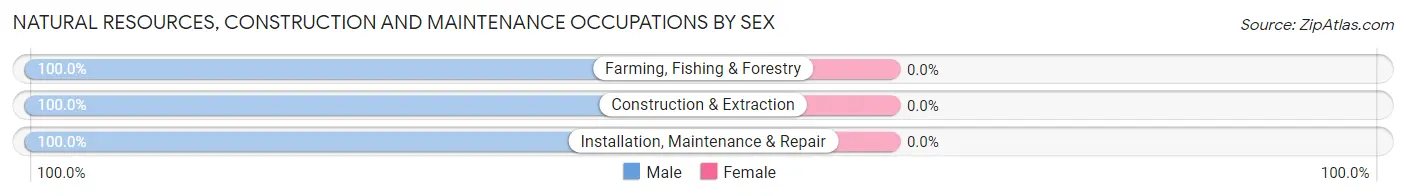
| Occupation | Male | Female |
| Farming, Fishing & Forestry | 88 (100.0%) | 0 (0.0%) |
| Construction & Extraction | 77 (100.0%) | 0 (0.0%) |
| Installation, Maintenance & Repair | 17 (100.0%) | 0 (0.0%) |
| Total (Category) | 182 (100.0%) | 0 (0.0%) |
| Total (Overall) | 2,444 (49.2%) | 2,518 (50.7%) |
Production, Transportation and Moving Occupations
The most common Production, Transportation and Moving occupations in Andover are Material Moving (81 | 1.6%), Production (71 | 1.4%), and Transportation (9 | 0.2%).
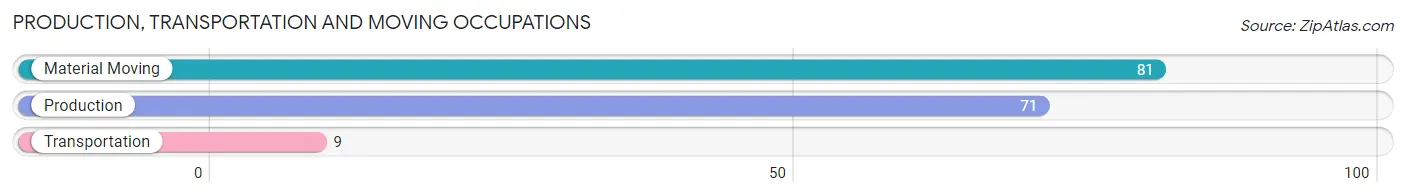
Production, Transportation and Moving Occupations by Sex
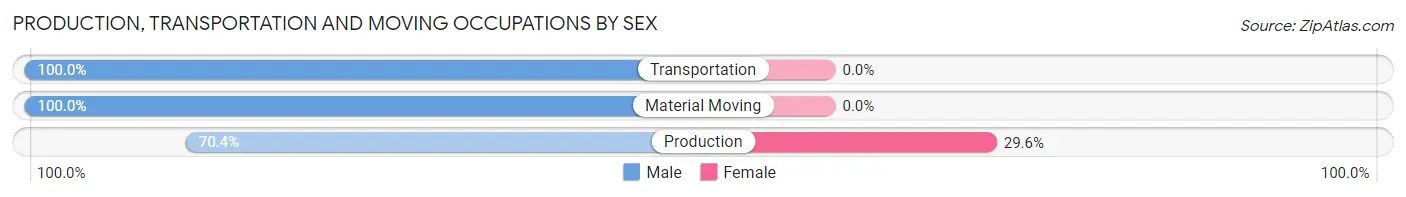
| Occupation | Male | Female |
| Production | 50 (70.4%) | 21 (29.6%) |
| Transportation | 9 (100.0%) | 0 (0.0%) |
| Material Moving | 81 (100.0%) | 0 (0.0%) |
| Total (Category) | 140 (87.0%) | 21 (13.0%) |
| Total (Overall) | 2,444 (49.2%) | 2,518 (50.7%) |
Employment Industries by Sex in Andover
Employment Industries in Andover
The major employment industries in Andover include Educational Services (902 | 18.2%), Health Care & Social Assistance (712 | 14.3%), Professional & Scientific (694 | 14.0%), Manufacturing (538 | 10.8%), and Retail Trade (355 | 7.1%).
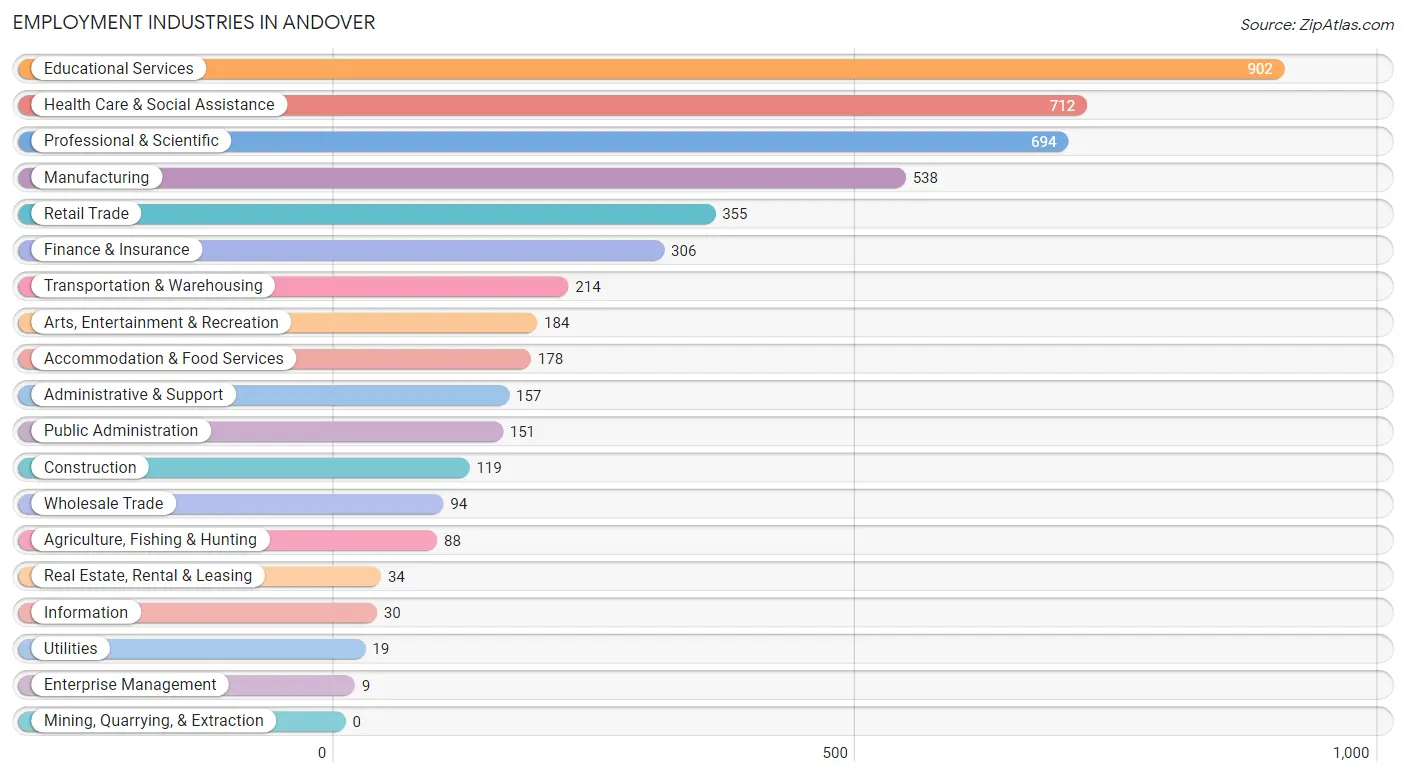
Employment Industries by Sex in Andover
The Andover industries that see more men than women are Agriculture, Fishing & Hunting (100.0%), Administrative & Support (95.5%), and Construction (88.2%), whereas the industries that tend to have a higher number of women are Enterprise Management (100.0%), Health Care & Social Assistance (85.7%), and Arts, Entertainment & Recreation (78.3%).
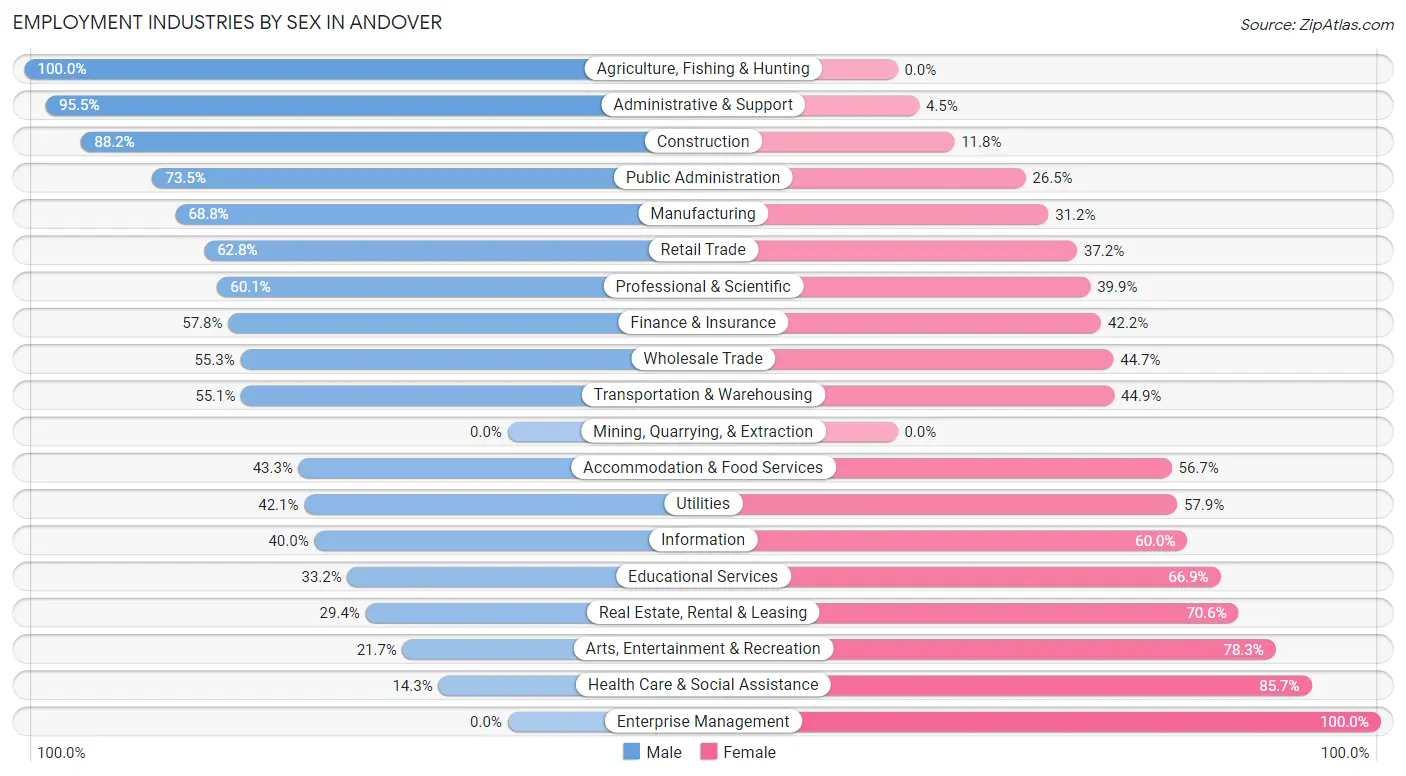
| Industry | Male | Female |
| Agriculture, Fishing & Hunting | 88 (100.0%) | 0 (0.0%) |
| Mining, Quarrying, & Extraction | 0 (0.0%) | 0 (0.0%) |
| Construction | 105 (88.2%) | 14 (11.8%) |
| Manufacturing | 370 (68.8%) | 168 (31.2%) |
| Wholesale Trade | 52 (55.3%) | 42 (44.7%) |
| Retail Trade | 223 (62.8%) | 132 (37.2%) |
| Transportation & Warehousing | 118 (55.1%) | 96 (44.9%) |
| Utilities | 8 (42.1%) | 11 (57.9%) |
| Information | 12 (40.0%) | 18 (60.0%) |
| Finance & Insurance | 177 (57.8%) | 129 (42.2%) |
| Real Estate, Rental & Leasing | 10 (29.4%) | 24 (70.6%) |
| Professional & Scientific | 417 (60.1%) | 277 (39.9%) |
| Enterprise Management | 0 (0.0%) | 9 (100.0%) |
| Administrative & Support | 150 (95.5%) | 7 (4.5%) |
| Educational Services | 299 (33.2%) | 603 (66.8%) |
| Health Care & Social Assistance | 102 (14.3%) | 610 (85.7%) |
| Arts, Entertainment & Recreation | 40 (21.7%) | 144 (78.3%) |
| Accommodation & Food Services | 77 (43.3%) | 101 (56.7%) |
| Public Administration | 111 (73.5%) | 40 (26.5%) |
| Total | 2,444 (49.2%) | 2,518 (50.7%) |
Education in Andover
School Enrollment in Andover
The most common levels of schooling among the 2,762 students in Andover are college / undergraduate (1,355 | 49.1%), elementary school (479 | 17.3%), and high school (358 | 13.0%).
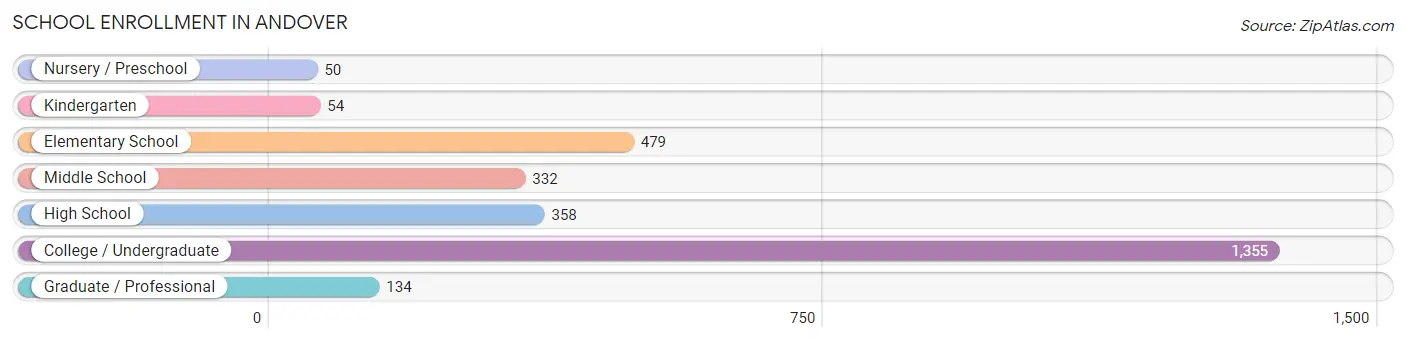
| School Level | # Students | % Students |
| Nursery / Preschool | 50 | 1.8% |
| Kindergarten | 54 | 2.0% |
| Elementary School | 479 | 17.3% |
| Middle School | 332 | 12.0% |
| High School | 358 | 13.0% |
| College / Undergraduate | 1,355 | 49.1% |
| Graduate / Professional | 134 | 4.9% |
| Total | 2,762 | 100.0% |
School Enrollment by Age by Funding Source in Andover
Out of a total of 2,762 students who are enrolled in schools in Andover, 1,240 (44.9%) attend a private institution, while the remaining 1,522 (55.1%) are enrolled in public schools. The age group of 18 to 19 year olds has the highest likelihood of being enrolled in private schools, with 388 (75.6% in the age bracket) enrolled. Conversely, the age group of 5 to 9 year old has the lowest likelihood of being enrolled in a private school, with 458 (96.6% in the age bracket) attending a public institution.
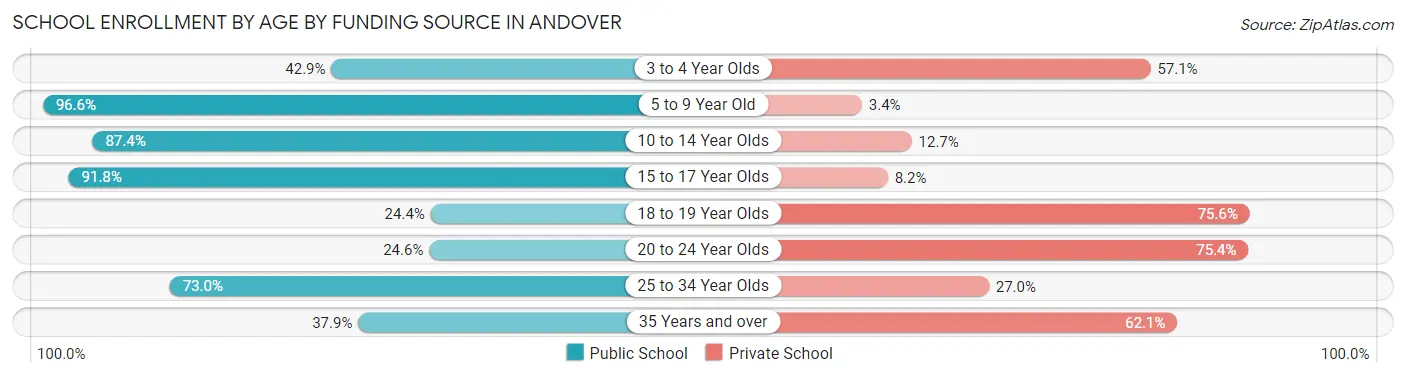
| Age Bracket | Public School | Private School |
| 3 to 4 Year Olds | 18 (42.9%) | 24 (57.1%) |
| 5 to 9 Year Old | 458 (96.6%) | 16 (3.4%) |
| 10 to 14 Year Olds | 359 (87.4%) | 52 (12.7%) |
| 15 to 17 Year Olds | 280 (91.8%) | 25 (8.2%) |
| 18 to 19 Year Olds | 125 (24.4%) | 388 (75.6%) |
| 20 to 24 Year Olds | 216 (24.6%) | 661 (75.4%) |
| 25 to 34 Year Olds | 27 (73.0%) | 10 (27.0%) |
| 35 Years and over | 39 (37.9%) | 64 (62.1%) |
| Total | 1,522 (55.1%) | 1,240 (44.9%) |
Educational Attainment by Field of Study in Andover
Business (928 | 19.2%), engineering (670 | 13.9%), education (455 | 9.4%), literature & languages (419 | 8.7%), and social sciences (417 | 8.6%) are the most common fields of study among 4,832 individuals in Andover who have obtained a bachelor's degree or higher.
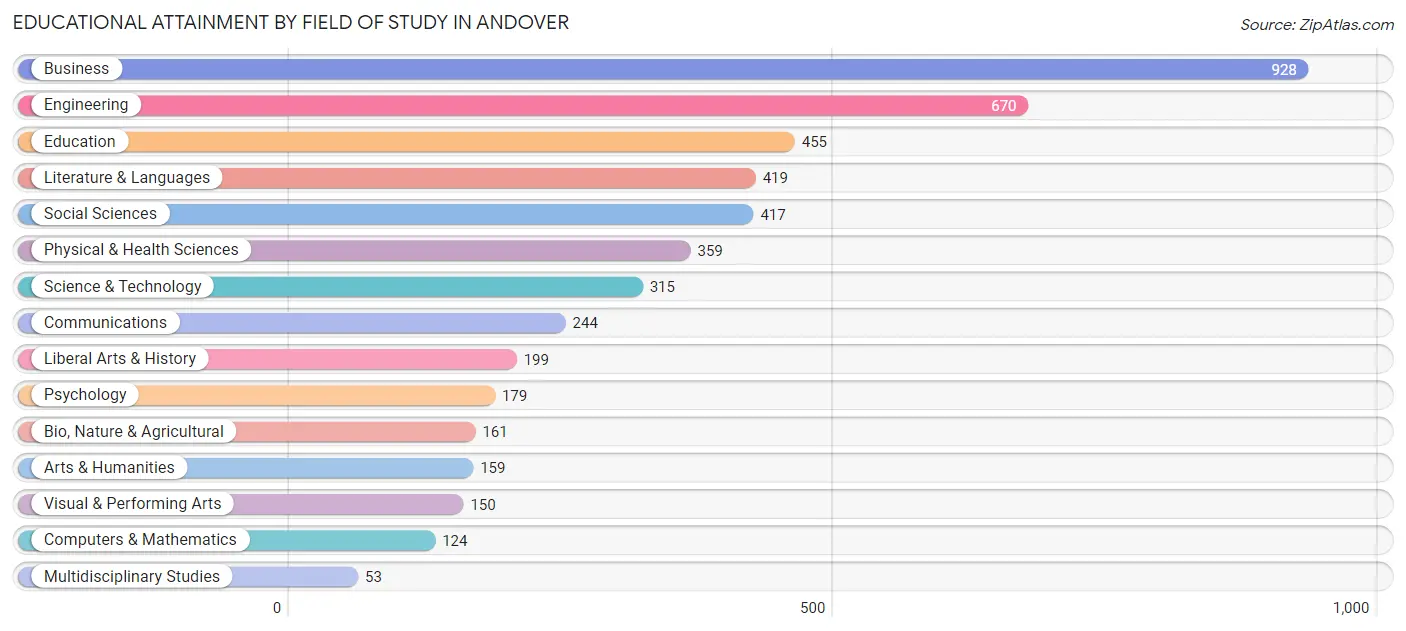
| Field of Study | # Graduates | % Graduates |
| Computers & Mathematics | 124 | 2.6% |
| Bio, Nature & Agricultural | 161 | 3.3% |
| Physical & Health Sciences | 359 | 7.4% |
| Psychology | 179 | 3.7% |
| Social Sciences | 417 | 8.6% |
| Engineering | 670 | 13.9% |
| Multidisciplinary Studies | 53 | 1.1% |
| Science & Technology | 315 | 6.5% |
| Business | 928 | 19.2% |
| Education | 455 | 9.4% |
| Literature & Languages | 419 | 8.7% |
| Liberal Arts & History | 199 | 4.1% |
| Visual & Performing Arts | 150 | 3.1% |
| Communications | 244 | 5.1% |
| Arts & Humanities | 159 | 3.3% |
| Total | 4,832 | 100.0% |
Transportation & Commute in Andover
Vehicle Availability by Sex in Andover
The most prevalent vehicle ownership categories in Andover are males with 2 vehicles (1,030, accounting for 48.4%) and females with 2 vehicles (1,106, making up 51.9%).
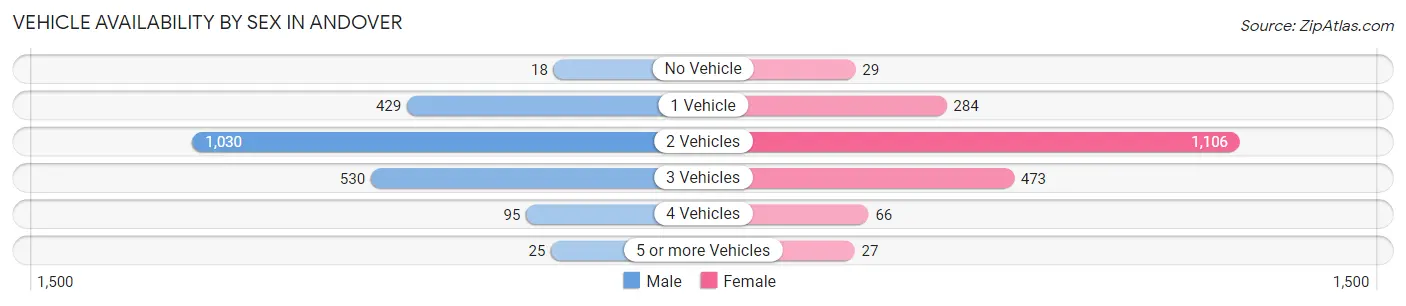
| Vehicles Available | Male | Female |
| No Vehicle | 18 (0.9%) | 29 (1.5%) |
| 1 Vehicle | 429 (20.2%) | 284 (14.3%) |
| 2 Vehicles | 1,030 (48.4%) | 1,106 (55.7%) |
| 3 Vehicles | 530 (24.9%) | 473 (23.8%) |
| 4 Vehicles | 95 (4.5%) | 66 (3.3%) |
| 5 or more Vehicles | 25 (1.2%) | 27 (1.4%) |
| Total | 2,127 (100.0%) | 1,985 (100.0%) |
Commute Time in Andover
The most frequently occuring commute durations in Andover are 5 to 9 minutes (629 commuters, 17.8%), 30 to 34 minutes (555 commuters, 15.7%), and 20 to 24 minutes (452 commuters, 12.8%).
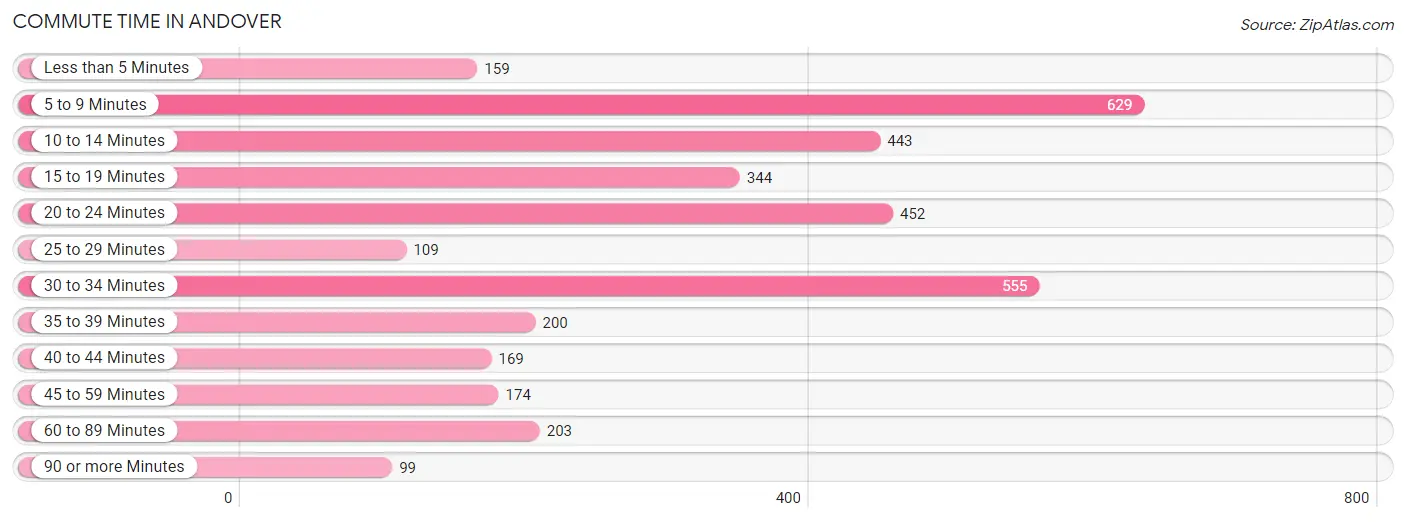
| Commute Time | # Commuters | % Commuters |
| Less than 5 Minutes | 159 | 4.5% |
| 5 to 9 Minutes | 629 | 17.8% |
| 10 to 14 Minutes | 443 | 12.5% |
| 15 to 19 Minutes | 344 | 9.7% |
| 20 to 24 Minutes | 452 | 12.8% |
| 25 to 29 Minutes | 109 | 3.1% |
| 30 to 34 Minutes | 555 | 15.7% |
| 35 to 39 Minutes | 200 | 5.7% |
| 40 to 44 Minutes | 169 | 4.8% |
| 45 to 59 Minutes | 174 | 4.9% |
| 60 to 89 Minutes | 203 | 5.7% |
| 90 or more Minutes | 99 | 2.8% |
Commute Time by Sex in Andover
The most common commute times in Andover are 20 to 24 minutes (298 commuters, 17.7%) for males and 5 to 9 minutes (448 commuters, 24.2%) for females.
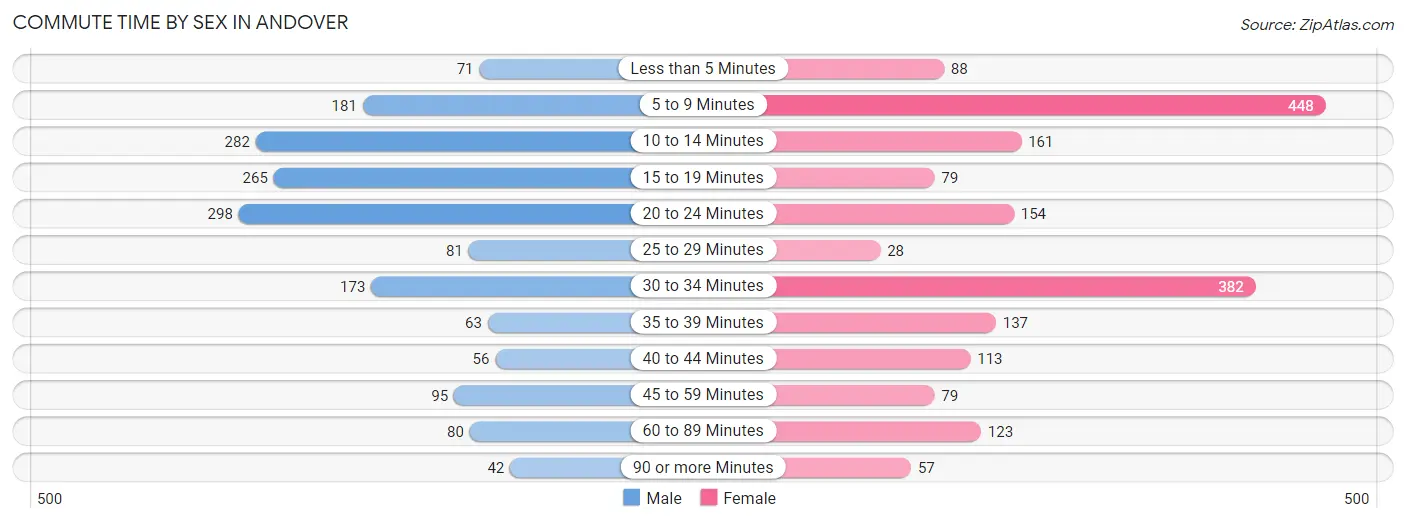
| Commute Time | Male | Female |
| Less than 5 Minutes | 71 (4.2%) | 88 (4.8%) |
| 5 to 9 Minutes | 181 (10.7%) | 448 (24.2%) |
| 10 to 14 Minutes | 282 (16.7%) | 161 (8.7%) |
| 15 to 19 Minutes | 265 (15.7%) | 79 (4.3%) |
| 20 to 24 Minutes | 298 (17.7%) | 154 (8.3%) |
| 25 to 29 Minutes | 81 (4.8%) | 28 (1.5%) |
| 30 to 34 Minutes | 173 (10.2%) | 382 (20.7%) |
| 35 to 39 Minutes | 63 (3.7%) | 137 (7.4%) |
| 40 to 44 Minutes | 56 (3.3%) | 113 (6.1%) |
| 45 to 59 Minutes | 95 (5.6%) | 79 (4.3%) |
| 60 to 89 Minutes | 80 (4.7%) | 123 (6.7%) |
| 90 or more Minutes | 42 (2.5%) | 57 (3.1%) |
Time of Departure to Work by Sex in Andover
The most frequent times of departure to work in Andover are 8:00 AM to 8:29 AM (306, 18.1%) for males and 8:00 AM to 8:29 AM (448, 24.2%) for females.
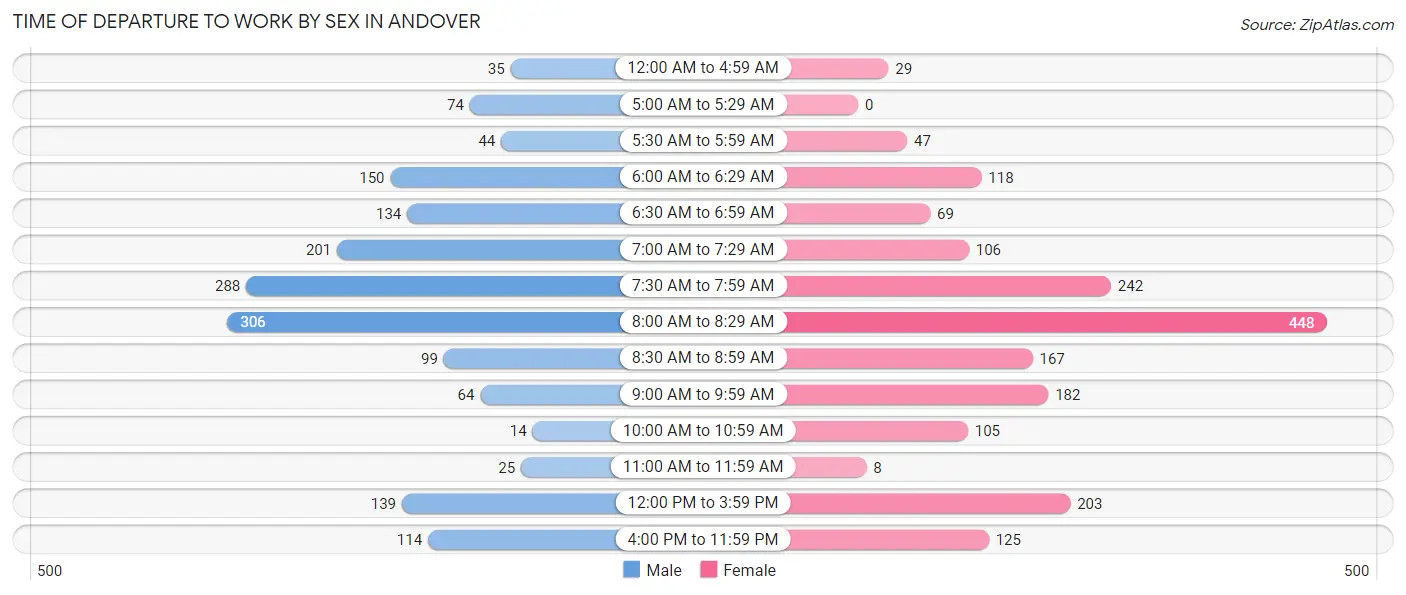
| Time of Departure | Male | Female |
| 12:00 AM to 4:59 AM | 35 (2.1%) | 29 (1.6%) |
| 5:00 AM to 5:29 AM | 74 (4.4%) | 0 (0.0%) |
| 5:30 AM to 5:59 AM | 44 (2.6%) | 47 (2.5%) |
| 6:00 AM to 6:29 AM | 150 (8.9%) | 118 (6.4%) |
| 6:30 AM to 6:59 AM | 134 (7.9%) | 69 (3.7%) |
| 7:00 AM to 7:29 AM | 201 (11.9%) | 106 (5.7%) |
| 7:30 AM to 7:59 AM | 288 (17.1%) | 242 (13.1%) |
| 8:00 AM to 8:29 AM | 306 (18.1%) | 448 (24.2%) |
| 8:30 AM to 8:59 AM | 99 (5.9%) | 167 (9.0%) |
| 9:00 AM to 9:59 AM | 64 (3.8%) | 182 (9.8%) |
| 10:00 AM to 10:59 AM | 14 (0.8%) | 105 (5.7%) |
| 11:00 AM to 11:59 AM | 25 (1.5%) | 8 (0.4%) |
| 12:00 PM to 3:59 PM | 139 (8.2%) | 203 (11.0%) |
| 4:00 PM to 11:59 PM | 114 (6.8%) | 125 (6.8%) |
| Total | 1,687 (100.0%) | 1,849 (100.0%) |
Housing Occupancy in Andover
Occupancy by Ownership in Andover
Of the total 3,519 dwellings in Andover, owner-occupied units account for 2,537 (72.1%), while renter-occupied units make up 982 (27.9%).
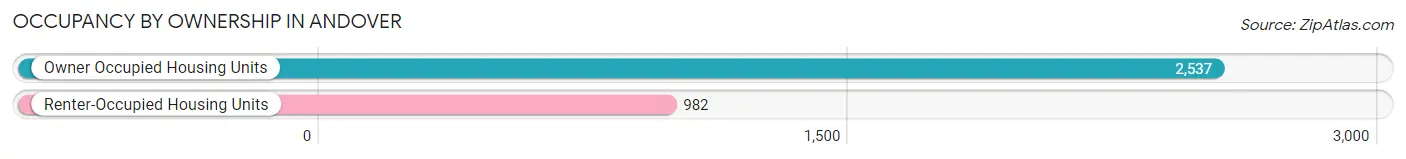
| Occupancy | # Housing Units | % Housing Units |
| Owner Occupied Housing Units | 2,537 | 72.1% |
| Renter-Occupied Housing Units | 982 | 27.9% |
| Total Occupied Housing Units | 3,519 | 100.0% |
Occupancy by Household Size in Andover
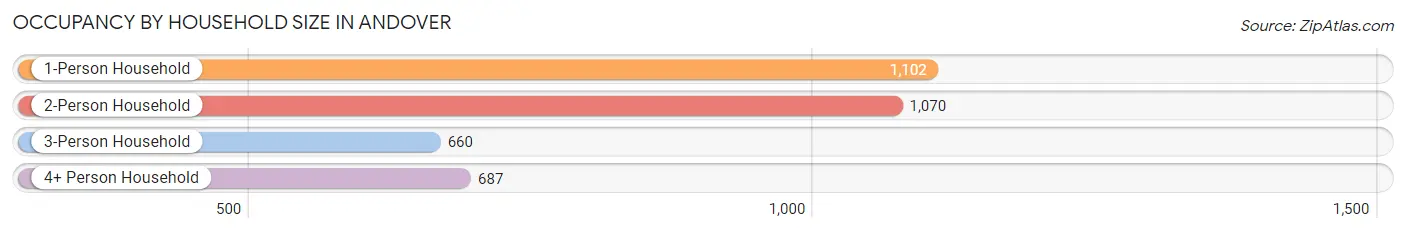
| Household Size | # Housing Units | % Housing Units |
| 1-Person Household | 1,102 | 31.3% |
| 2-Person Household | 1,070 | 30.4% |
| 3-Person Household | 660 | 18.8% |
| 4+ Person Household | 687 | 19.5% |
| Total Housing Units | 3,519 | 100.0% |
Occupancy by Ownership by Household Size in Andover
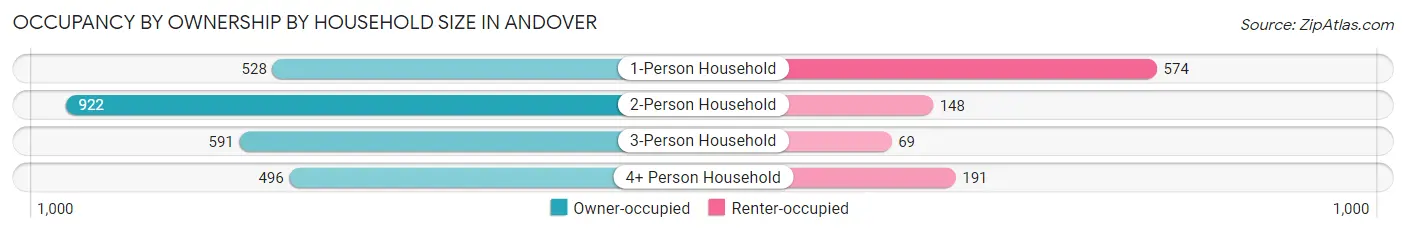
| Household Size | Owner-occupied | Renter-occupied |
| 1-Person Household | 528 (47.9%) | 574 (52.1%) |
| 2-Person Household | 922 (86.2%) | 148 (13.8%) |
| 3-Person Household | 591 (89.5%) | 69 (10.4%) |
| 4+ Person Household | 496 (72.2%) | 191 (27.8%) |
| Total Housing Units | 2,537 (72.1%) | 982 (27.9%) |
Occupancy by Educational Attainment in Andover
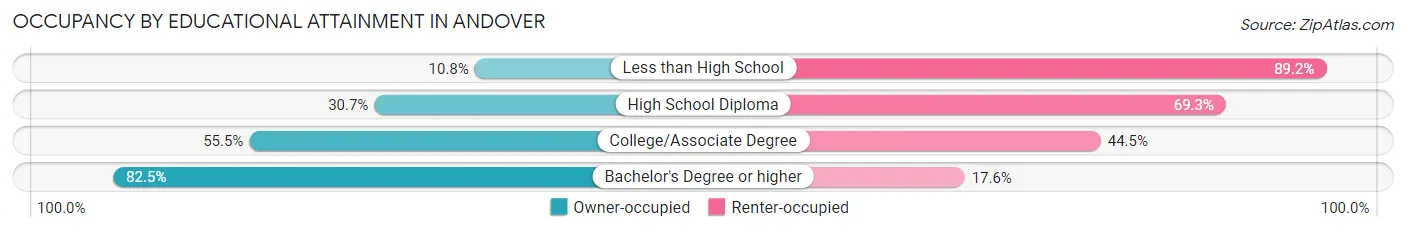
| Household Size | Owner-occupied | Renter-occupied |
| Less than High School | 11 (10.8%) | 91 (89.2%) |
| High School Diploma | 85 (30.7%) | 192 (69.3%) |
| College/Associate Degree | 304 (55.5%) | 244 (44.5%) |
| Bachelor's Degree or higher | 2,137 (82.5%) | 455 (17.5%) |
Occupancy by Age of Householder in Andover
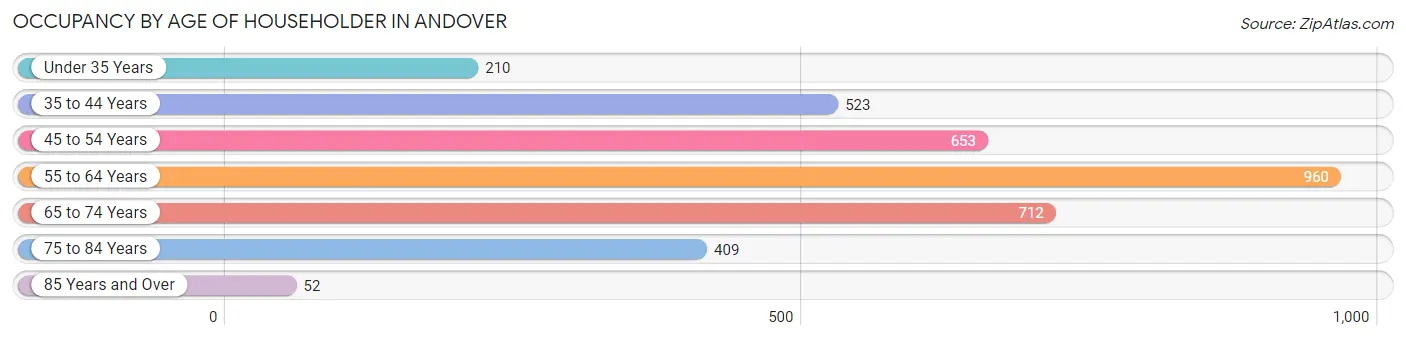
| Age Bracket | # Households | % Households |
| Under 35 Years | 210 | 6.0% |
| 35 to 44 Years | 523 | 14.9% |
| 45 to 54 Years | 653 | 18.6% |
| 55 to 64 Years | 960 | 27.3% |
| 65 to 74 Years | 712 | 20.2% |
| 75 to 84 Years | 409 | 11.6% |
| 85 Years and Over | 52 | 1.5% |
| Total | 3,519 | 100.0% |
Housing Finances in Andover
Median Income by Occupancy in Andover
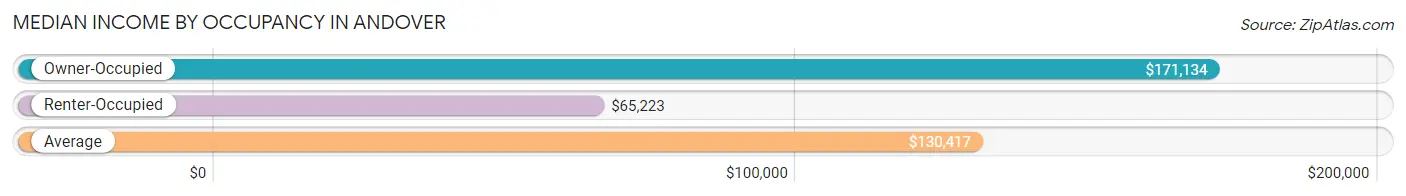
| Occupancy Type | # Households | Median Income |
| Owner-Occupied | 2,537 (72.1%) | $171,134 |
| Renter-Occupied | 982 (27.9%) | $65,223 |
| Average | 3,519 (100.0%) | $130,417 |
Occupancy by Householder Income Bracket in Andover
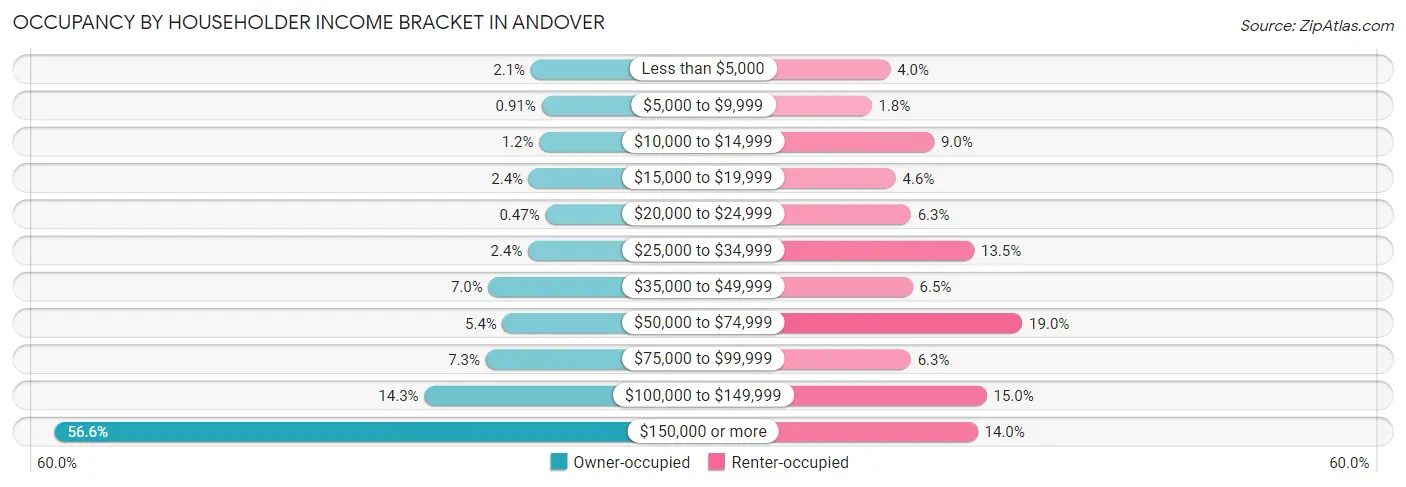
| Income Bracket | Owner-occupied | Renter-occupied |
| Less than $5,000 | 54 (2.1%) | 39 (4.0%) |
| $5,000 to $9,999 | 23 (0.9%) | 18 (1.8%) |
| $10,000 to $14,999 | 30 (1.2%) | 88 (9.0%) |
| $15,000 to $19,999 | 60 (2.4%) | 45 (4.6%) |
| $20,000 to $24,999 | 12 (0.5%) | 62 (6.3%) |
| $25,000 to $34,999 | 62 (2.4%) | 133 (13.5%) |
| $35,000 to $49,999 | 177 (7.0%) | 64 (6.5%) |
| $50,000 to $74,999 | 136 (5.4%) | 187 (19.0%) |
| $75,000 to $99,999 | 185 (7.3%) | 62 (6.3%) |
| $100,000 to $149,999 | 363 (14.3%) | 147 (15.0%) |
| $150,000 or more | 1,435 (56.6%) | 137 (14.0%) |
| Total | 2,537 (100.0%) | 982 (100.0%) |
Monthly Housing Cost Tiers in Andover
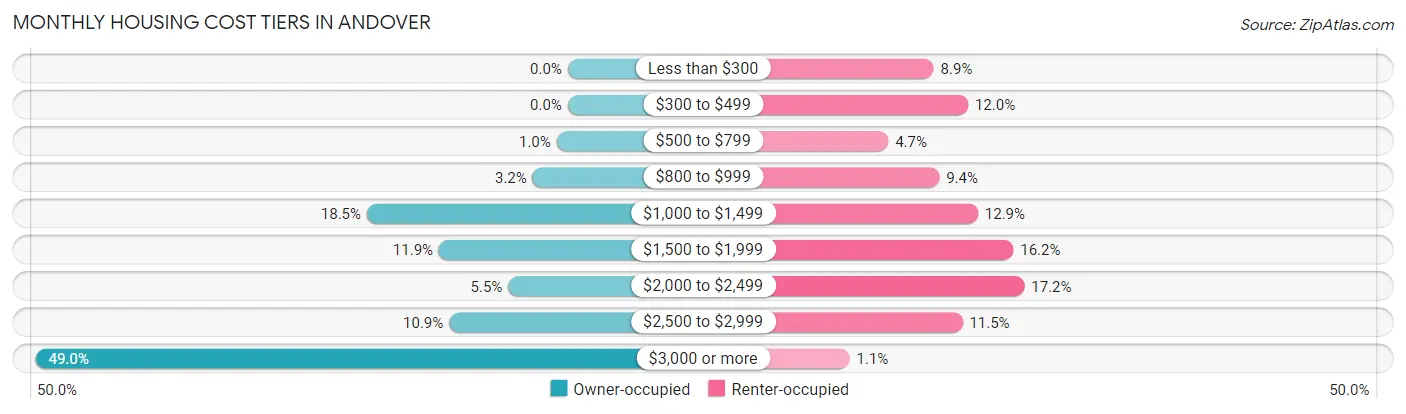
| Monthly Cost | Owner-occupied | Renter-occupied |
| Less than $300 | 0 (0.0%) | 87 (8.9%) |
| $300 to $499 | 0 (0.0%) | 118 (12.0%) |
| $500 to $799 | 26 (1.0%) | 46 (4.7%) |
| $800 to $999 | 82 (3.2%) | 92 (9.4%) |
| $1,000 to $1,499 | 469 (18.5%) | 127 (12.9%) |
| $1,500 to $1,999 | 301 (11.9%) | 159 (16.2%) |
| $2,000 to $2,499 | 139 (5.5%) | 169 (17.2%) |
| $2,500 to $2,999 | 277 (10.9%) | 113 (11.5%) |
| $3,000 or more | 1,243 (49.0%) | 11 (1.1%) |
| Total | 2,537 (100.0%) | 982 (100.0%) |
Physical Housing Characteristics in Andover
Housing Structures in Andover
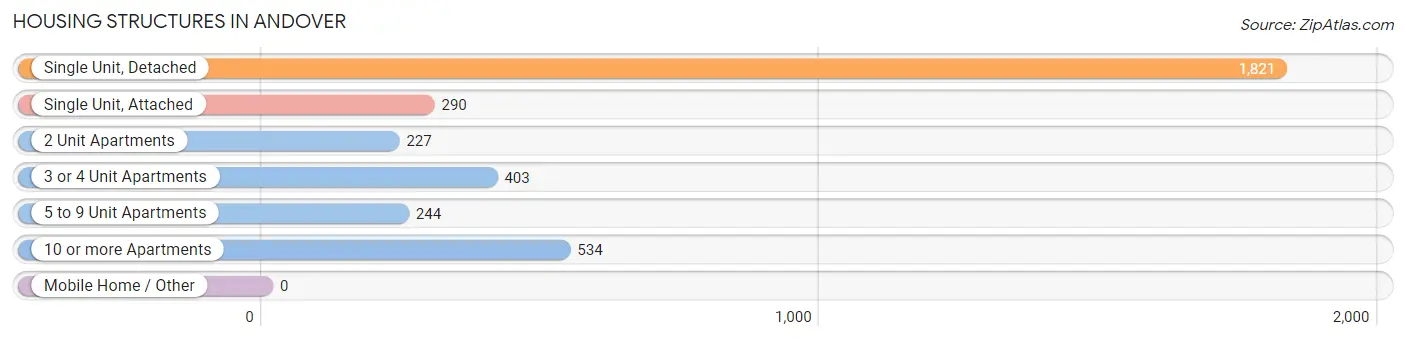
| Structure Type | # Housing Units | % Housing Units |
| Single Unit, Detached | 1,821 | 51.7% |
| Single Unit, Attached | 290 | 8.2% |
| 2 Unit Apartments | 227 | 6.5% |
| 3 or 4 Unit Apartments | 403 | 11.5% |
| 5 to 9 Unit Apartments | 244 | 6.9% |
| 10 or more Apartments | 534 | 15.2% |
| Mobile Home / Other | 0 | 0.0% |
| Total | 3,519 | 100.0% |
Housing Structures by Occupancy in Andover
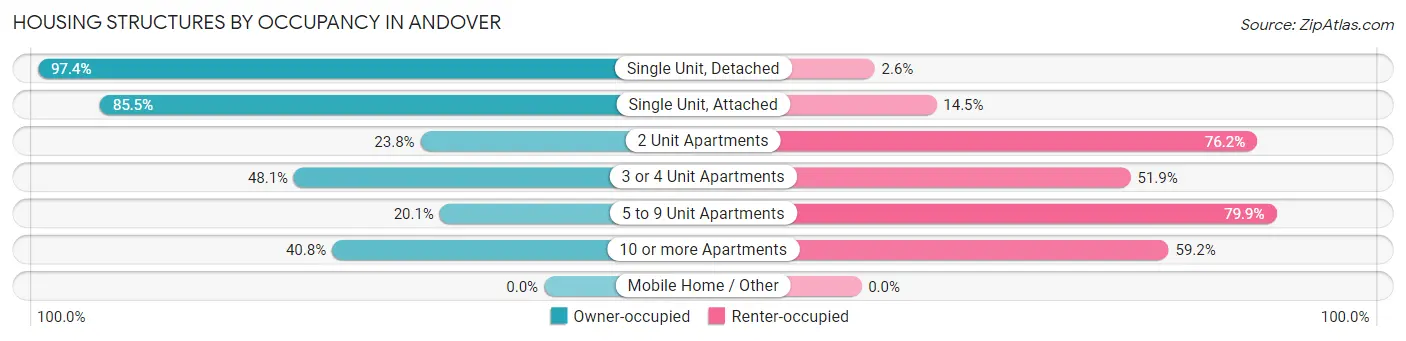
| Structure Type | Owner-occupied | Renter-occupied |
| Single Unit, Detached | 1,774 (97.4%) | 47 (2.6%) |
| Single Unit, Attached | 248 (85.5%) | 42 (14.5%) |
| 2 Unit Apartments | 54 (23.8%) | 173 (76.2%) |
| 3 or 4 Unit Apartments | 194 (48.1%) | 209 (51.9%) |
| 5 to 9 Unit Apartments | 49 (20.1%) | 195 (79.9%) |
| 10 or more Apartments | 218 (40.8%) | 316 (59.2%) |
| Mobile Home / Other | 0 (0.0%) | 0 (0.0%) |
| Total | 2,537 (72.1%) | 982 (27.9%) |
Housing Structures by Number of Rooms in Andover
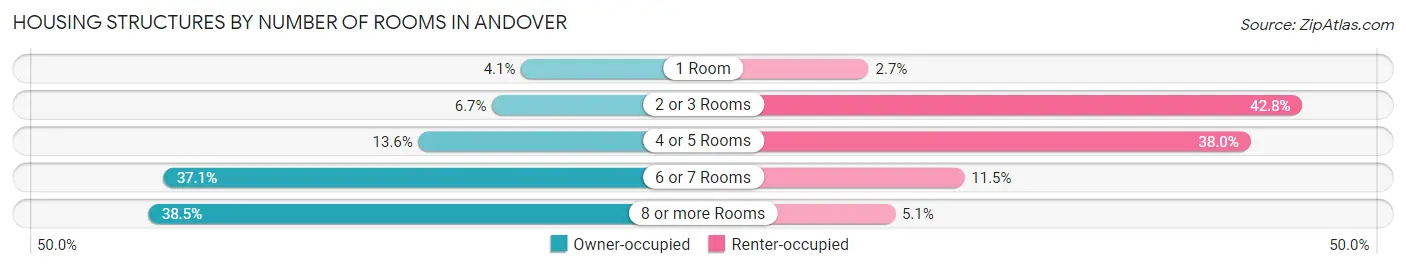
| Number of Rooms | Owner-occupied | Renter-occupied |
| 1 Room | 103 (4.1%) | 26 (2.6%) |
| 2 or 3 Rooms | 171 (6.7%) | 420 (42.8%) |
| 4 or 5 Rooms | 344 (13.6%) | 373 (38.0%) |
| 6 or 7 Rooms | 942 (37.1%) | 113 (11.5%) |
| 8 or more Rooms | 977 (38.5%) | 50 (5.1%) |
| Total | 2,537 (100.0%) | 982 (100.0%) |
Housing Structure by Heating Type in Andover
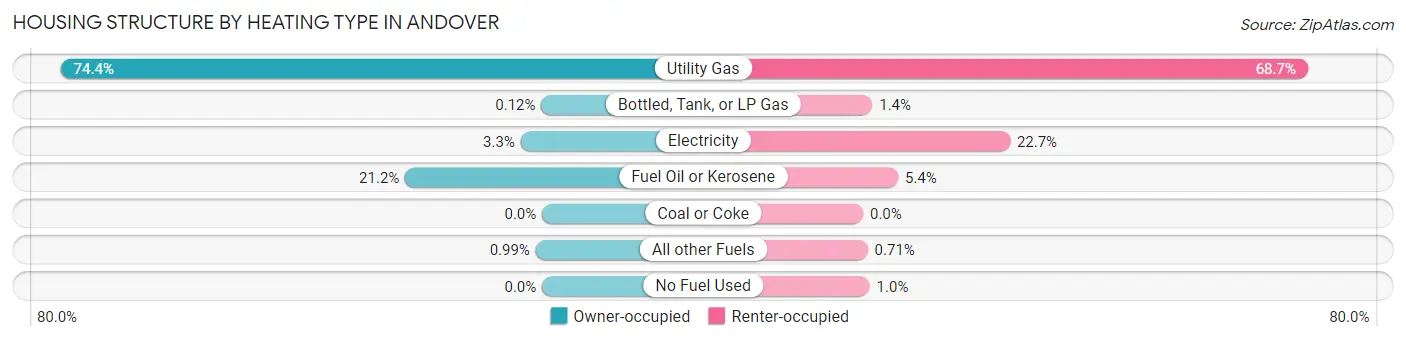
| Heating Type | Owner-occupied | Renter-occupied |
| Utility Gas | 1,888 (74.4%) | 675 (68.7%) |
| Bottled, Tank, or LP Gas | 3 (0.1%) | 14 (1.4%) |
| Electricity | 84 (3.3%) | 223 (22.7%) |
| Fuel Oil or Kerosene | 537 (21.2%) | 53 (5.4%) |
| Coal or Coke | 0 (0.0%) | 0 (0.0%) |
| All other Fuels | 25 (1.0%) | 7 (0.7%) |
| No Fuel Used | 0 (0.0%) | 10 (1.0%) |
| Total | 2,537 (100.0%) | 982 (100.0%) |
Household Vehicle Usage in Andover
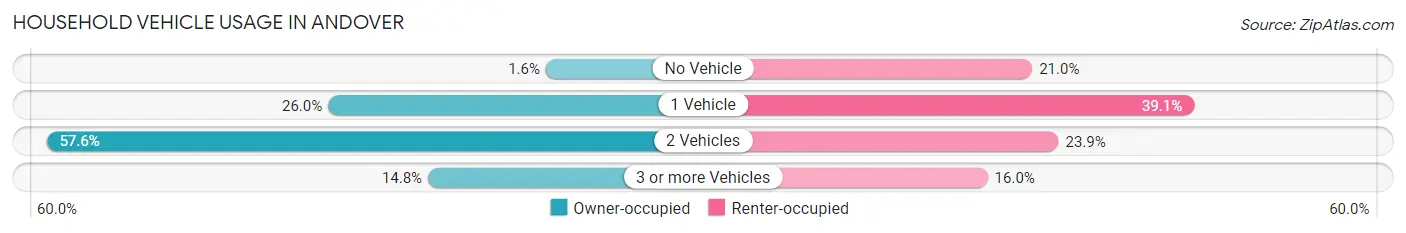
| Vehicles per Household | Owner-occupied | Renter-occupied |
| No Vehicle | 41 (1.6%) | 206 (21.0%) |
| 1 Vehicle | 660 (26.0%) | 384 (39.1%) |
| 2 Vehicles | 1,460 (57.6%) | 235 (23.9%) |
| 3 or more Vehicles | 376 (14.8%) | 157 (16.0%) |
| Total | 2,537 (100.0%) | 982 (100.0%) |
Real Estate & Mortgages in Andover
Real Estate and Mortgage Overview in Andover
| Characteristic | Without Mortgage | With Mortgage |
| Housing Units | 697 | 1,840 |
| Median Property Value | $702,300 | $699,200 |
| Median Household Income | $108,750 | $1,233 |
| Monthly Housing Costs | $1,335 | $1,222 |
| Real Estate Taxes | $9,060 | $8 |
Property Value by Mortgage Status in Andover
| Property Value | Without Mortgage | With Mortgage |
| Less than $50,000 | 0 (0.0%) | 0 (0.0%) |
| $50,000 to $99,999 | 0 (0.0%) | 0 (0.0%) |
| $100,000 to $299,999 | 20 (2.9%) | 131 (7.1%) |
| $300,000 to $499,999 | 127 (18.2%) | 153 (8.3%) |
| $500,000 to $749,999 | 249 (35.7%) | 798 (43.4%) |
| $750,000 to $999,999 | 191 (27.4%) | 517 (28.1%) |
| $1,000,000 or more | 110 (15.8%) | 241 (13.1%) |
| Total | 697 (100.0%) | 1,840 (100.0%) |
Household Income by Mortgage Status in Andover
| Household Income | Without Mortgage | With Mortgage |
| Less than $10,000 | 29 (4.2%) | 8 (0.4%) |
| $10,000 to $24,999 | 73 (10.5%) | 48 (2.6%) |
| $25,000 to $34,999 | 52 (7.5%) | 29 (1.6%) |
| $35,000 to $49,999 | 99 (14.2%) | 10 (0.5%) |
| $50,000 to $74,999 | 28 (4.0%) | 78 (4.2%) |
| $75,000 to $99,999 | 46 (6.6%) | 108 (5.9%) |
| $100,000 to $149,999 | 168 (24.1%) | 139 (7.5%) |
| $150,000 or more | 202 (29.0%) | 195 (10.6%) |
| Total | 697 (100.0%) | 1,840 (100.0%) |
Property Value to Household Income Ratio in Andover
| Value-to-Income Ratio | Without Mortgage | With Mortgage |
| Less than 2.0x | 38 (5.4%) | 212,143 (11,529.5%) |
| 2.0x to 2.9x | 74 (10.6%) | 459 (24.9%) |
| 3.0x to 3.9x | 44 (6.3%) | 416 (22.6%) |
| 4.0x or more | 531 (76.2%) | 246 (13.4%) |
| Total | 697 (100.0%) | 1,840 (100.0%) |
Real Estate Taxes by Mortgage Status in Andover
| Property Taxes | Without Mortgage | With Mortgage |
| Less than $800 | 0 (0.0%) | 30 (1.6%) |
| $800 to $1,499 | 0 (0.0%) | 0 (0.0%) |
| $800 to $1,499 | 674 (96.7%) | 13 (0.7%) |
| Total | 697 (100.0%) | 1,840 (100.0%) |
Health & Disability in Andover
Health Insurance Coverage by Age in Andover
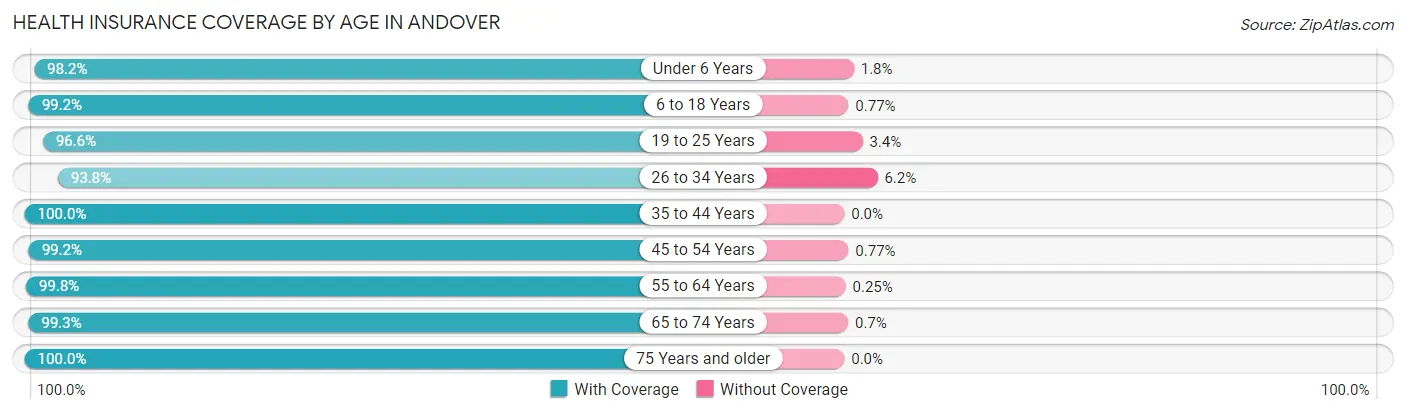
| Age Bracket | With Coverage | Without Coverage |
| Under 6 Years | 443 (98.2%) | 8 (1.8%) |
| 6 to 18 Years | 1,413 (99.2%) | 11 (0.8%) |
| 19 to 25 Years | 1,341 (96.6%) | 47 (3.4%) |
| 26 to 34 Years | 530 (93.8%) | 35 (6.2%) |
| 35 to 44 Years | 860 (100.0%) | 0 (0.0%) |
| 45 to 54 Years | 1,287 (99.2%) | 10 (0.8%) |
| 55 to 64 Years | 1,612 (99.8%) | 4 (0.3%) |
| 65 to 74 Years | 997 (99.3%) | 7 (0.7%) |
| 75 Years and older | 675 (100.0%) | 0 (0.0%) |
| Total | 9,158 (98.7%) | 122 (1.3%) |
Health Insurance Coverage by Citizenship Status in Andover
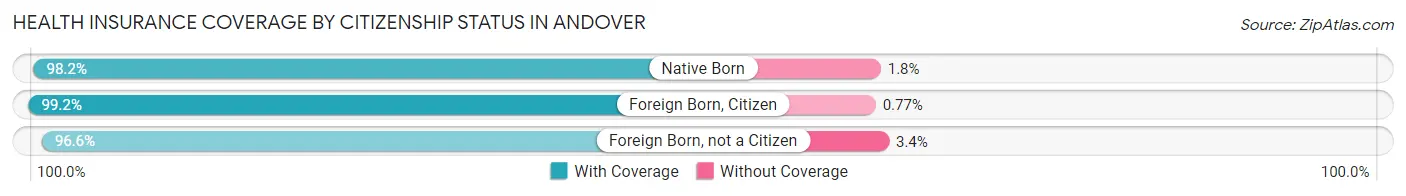
| Citizenship Status | With Coverage | Without Coverage |
| Native Born | 443 (98.2%) | 8 (1.8%) |
| Foreign Born, Citizen | 1,413 (99.2%) | 11 (0.8%) |
| Foreign Born, not a Citizen | 1,341 (96.6%) | 47 (3.4%) |
Health Insurance Coverage by Household Income in Andover
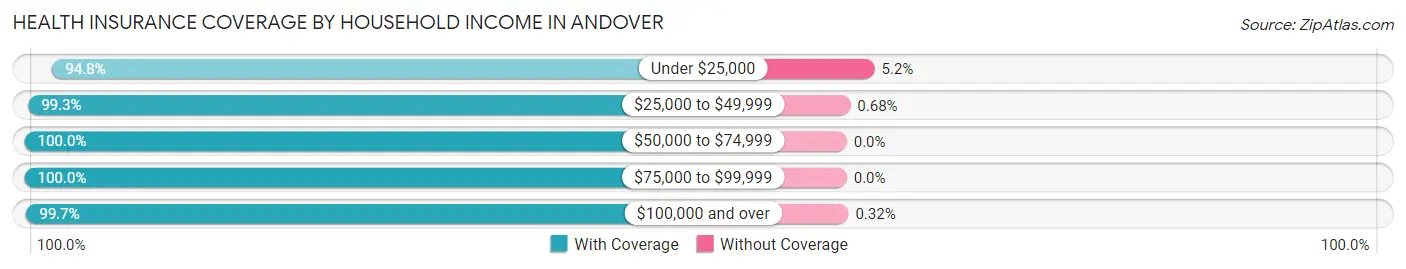
| Household Income | With Coverage | Without Coverage |
| Under $25,000 | 582 (94.8%) | 32 (5.2%) |
| $25,000 to $49,999 | 585 (99.3%) | 4 (0.7%) |
| $50,000 to $74,999 | 669 (100.0%) | 0 (0.0%) |
| $75,000 to $99,999 | 478 (100.0%) | 0 (0.0%) |
| $100,000 and over | 5,574 (99.7%) | 18 (0.3%) |
Public vs Private Health Insurance Coverage by Age in Andover
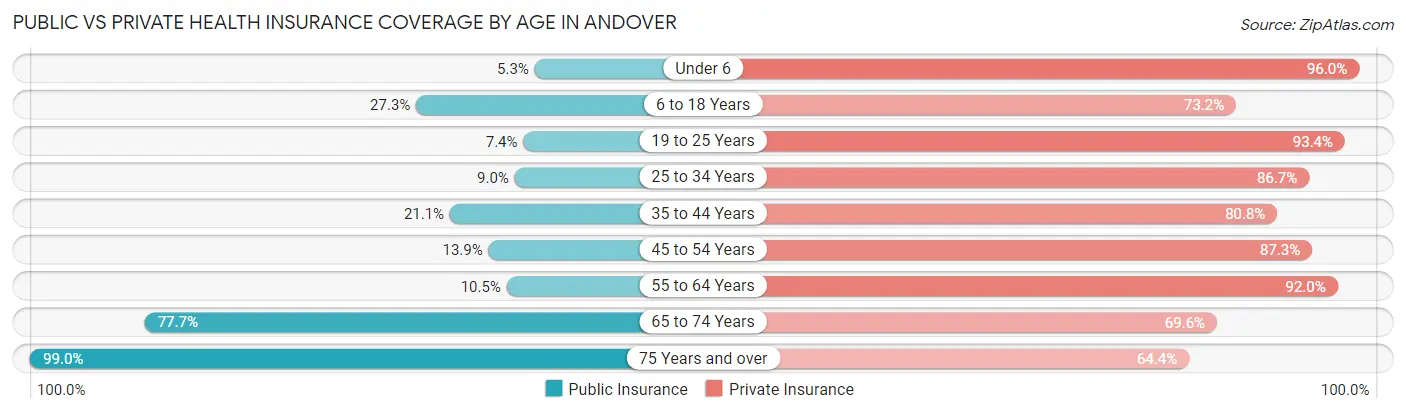
| Age Bracket | Public Insurance | Private Insurance |
| Under 6 | 24 (5.3%) | 433 (96.0%) |
| 6 to 18 Years | 389 (27.3%) | 1,042 (73.2%) |
| 19 to 25 Years | 103 (7.4%) | 1,296 (93.4%) |
| 25 to 34 Years | 51 (9.0%) | 490 (86.7%) |
| 35 to 44 Years | 181 (21.0%) | 695 (80.8%) |
| 45 to 54 Years | 180 (13.9%) | 1,132 (87.3%) |
| 55 to 64 Years | 170 (10.5%) | 1,487 (92.0%) |
| 65 to 74 Years | 780 (77.7%) | 699 (69.6%) |
| 75 Years and over | 668 (99.0%) | 435 (64.4%) |
| Total | 2,546 (27.4%) | 7,709 (83.1%) |
Disability Status by Sex by Age in Andover
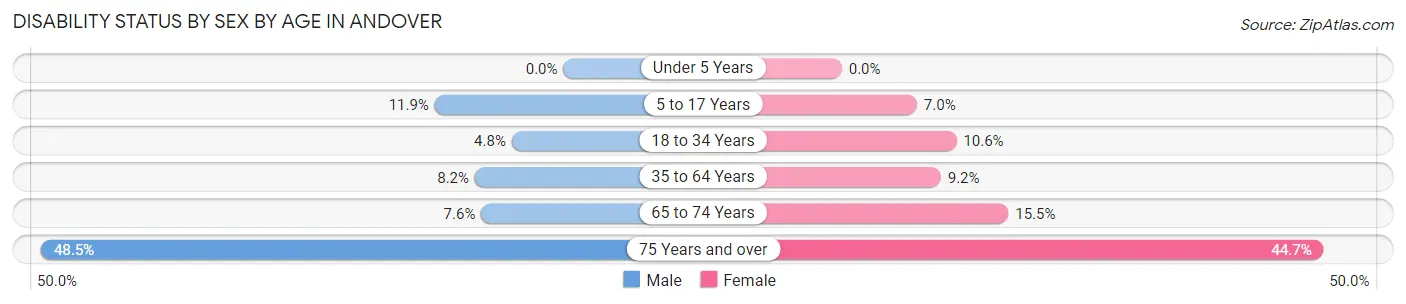
| Age Bracket | Male | Female |
| Under 5 Years | 0 (0.0%) | 0 (0.0%) |
| 5 to 17 Years | 72 (11.9%) | 44 (7.0%) |
| 18 to 34 Years | 47 (4.8%) | 134 (10.6%) |
| 35 to 64 Years | 150 (8.2%) | 179 (9.2%) |
| 65 to 74 Years | 43 (7.6%) | 68 (15.4%) |
| 75 Years and over | 80 (48.5%) | 228 (44.7%) |
Disability Class by Sex by Age in Andover
Disability Class: Hearing Difficulty
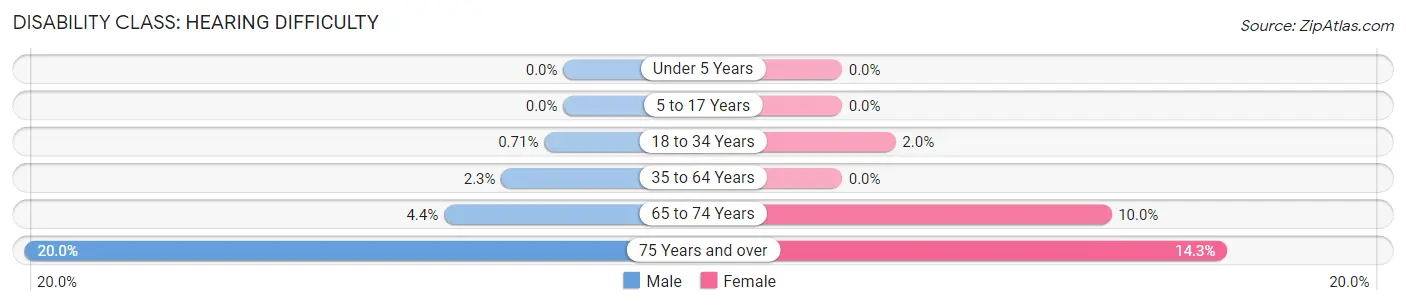
| Age Bracket | Male | Female |
| Under 5 Years | 0 (0.0%) | 0 (0.0%) |
| 5 to 17 Years | 0 (0.0%) | 0 (0.0%) |
| 18 to 34 Years | 7 (0.7%) | 25 (2.0%) |
| 35 to 64 Years | 42 (2.3%) | 0 (0.0%) |
| 65 to 74 Years | 25 (4.4%) | 44 (10.0%) |
| 75 Years and over | 33 (20.0%) | 73 (14.3%) |
Disability Class: Vision Difficulty
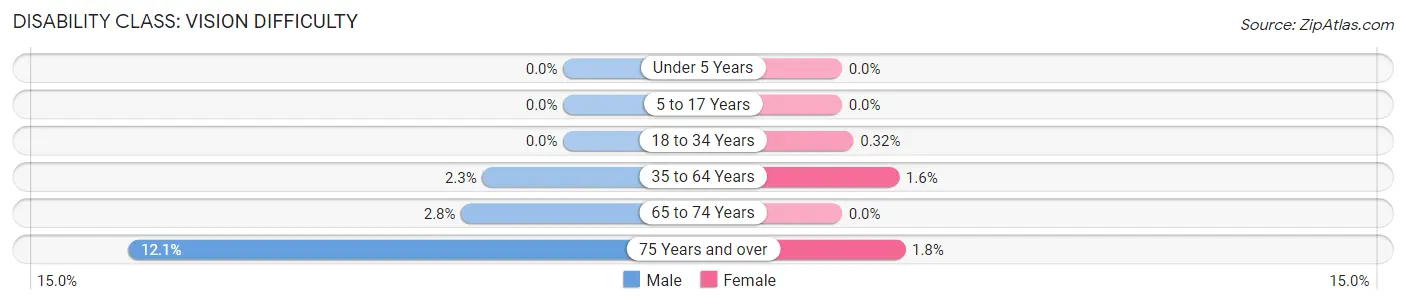
| Age Bracket | Male | Female |
| Under 5 Years | 0 (0.0%) | 0 (0.0%) |
| 5 to 17 Years | 0 (0.0%) | 0 (0.0%) |
| 18 to 34 Years | 0 (0.0%) | 4 (0.3%) |
| 35 to 64 Years | 41 (2.2%) | 31 (1.6%) |
| 65 to 74 Years | 16 (2.8%) | 0 (0.0%) |
| 75 Years and over | 20 (12.1%) | 9 (1.8%) |
Disability Class: Cognitive Difficulty
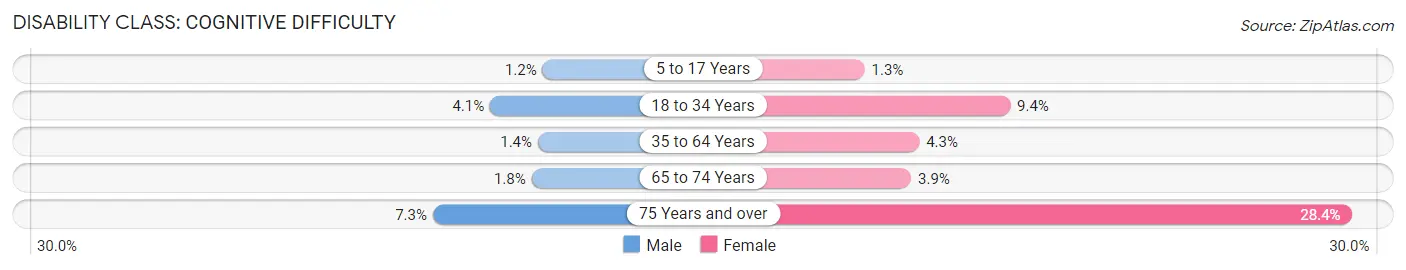
| Age Bracket | Male | Female |
| 5 to 17 Years | 7 (1.2%) | 8 (1.3%) |
| 18 to 34 Years | 40 (4.1%) | 118 (9.4%) |
| 35 to 64 Years | 26 (1.4%) | 84 (4.3%) |
| 65 to 74 Years | 10 (1.8%) | 17 (3.9%) |
| 75 Years and over | 12 (7.3%) | 145 (28.4%) |
Disability Class: Ambulatory Difficulty
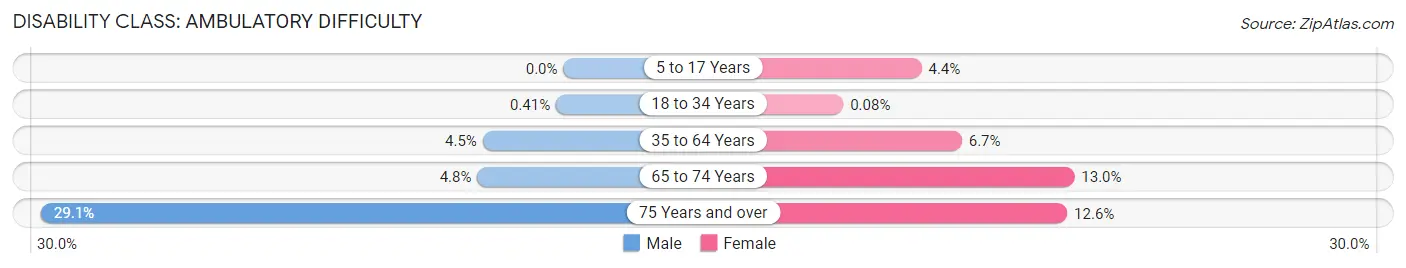
| Age Bracket | Male | Female |
| 5 to 17 Years | 0 (0.0%) | 28 (4.4%) |
| 18 to 34 Years | 4 (0.4%) | 1 (0.1%) |
| 35 to 64 Years | 82 (4.5%) | 130 (6.7%) |
| 65 to 74 Years | 27 (4.8%) | 57 (13.0%) |
| 75 Years and over | 48 (29.1%) | 64 (12.6%) |
Disability Class: Self-Care Difficulty
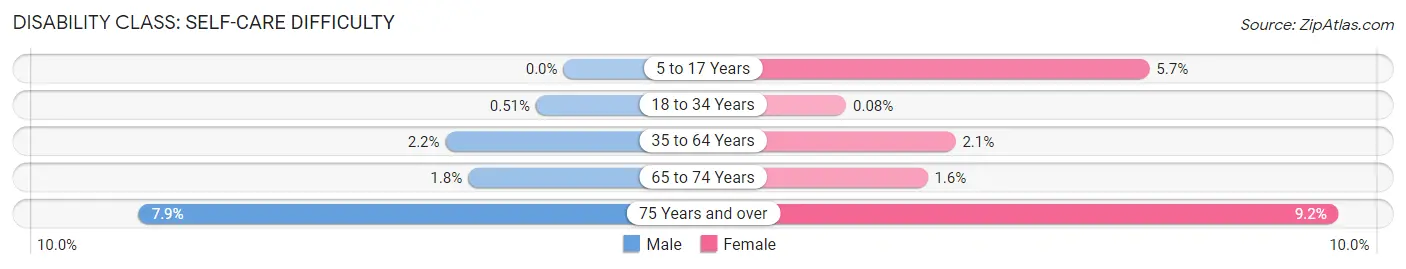
| Age Bracket | Male | Female |
| 5 to 17 Years | 0 (0.0%) | 36 (5.7%) |
| 18 to 34 Years | 5 (0.5%) | 1 (0.1%) |
| 35 to 64 Years | 40 (2.2%) | 41 (2.1%) |
| 65 to 74 Years | 10 (1.8%) | 7 (1.6%) |
| 75 Years and over | 13 (7.9%) | 47 (9.2%) |
Technology Access in Andover
Computing Device Access in Andover
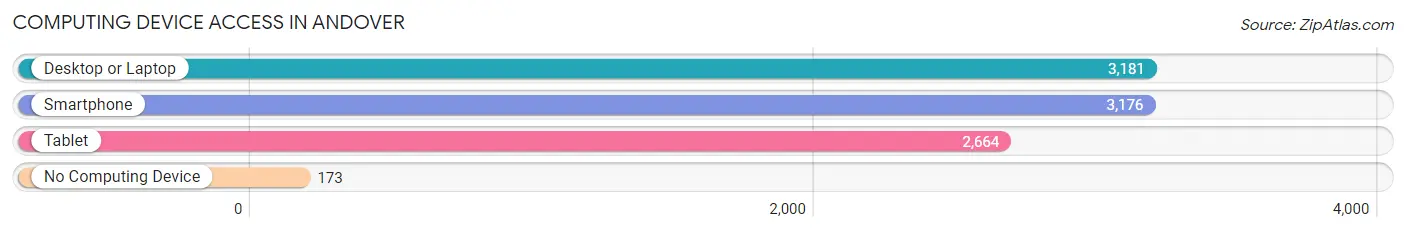
| Device Type | # Households | % Households |
| Desktop or Laptop | 3,181 | 90.4% |
| Smartphone | 3,176 | 90.2% |
| Tablet | 2,664 | 75.7% |
| No Computing Device | 173 | 4.9% |
| Total | 3,519 | 100.0% |
Internet Access in Andover
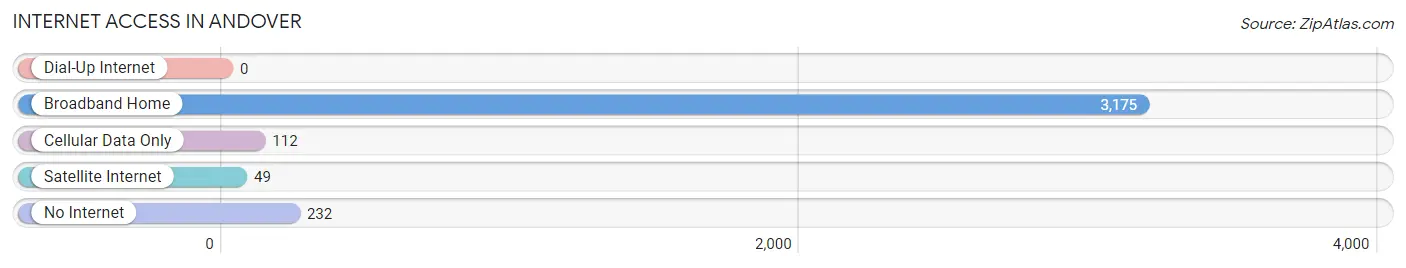
| Internet Type | # Households | % Households |
| Dial-Up Internet | 0 | 0.0% |
| Broadband Home | 3,175 | 90.2% |
| Cellular Data Only | 112 | 3.2% |
| Satellite Internet | 49 | 1.4% |
| No Internet | 232 | 6.6% |
| Total | 3,519 | 100.0% |
Andover Summary
Andover, Massachusetts is a town located in Essex County, approximately 25 miles north of Boston. It is a suburban community with a population of 33,201 as of the 2010 census. The town is bordered by North Andover to the north, Lawrence to the east, North Reading to the southeast, and Tewksbury to the west.
History
Andover was first settled in 1642 by a group of Puritans from nearby Ipswich. The town was officially incorporated in 1646 and was named after the town of Andover in England. The town was initially an agricultural community, with the main crops being corn, rye, and wheat. In the late 1700s, the town began to industrialize, with the first cotton mill being built in 1790. The town also had a number of tanneries, which produced leather goods.
In the mid-1800s, the town began to develop a reputation as a center of education. The town was home to Phillips Academy, which was founded in 1778 and is one of the oldest and most prestigious boarding schools in the United States. The town also had a number of other schools, including Abbot Academy, which was founded in 1829 and is now part of Phillips Academy.
Geography
Andover is located in northeastern Massachusetts, approximately 25 miles north of Boston. The town is bordered by North Andover to the north, Lawrence to the east, North Reading to the southeast, and Tewksbury to the west. The town is located in the Merrimack Valley region of Massachusetts and is part of the Greater Boston metropolitan area.
The town has a total area of 28.2 square miles, of which 27.9 square miles is land and 0.3 square miles is water. The town is located on the Shawsheen River, which flows through the center of town. The town is mostly flat, with some hills in the northern part of town.
Economy
Andover has a diverse economy, with a mix of manufacturing, retail, and service industries. The town is home to a number of large companies, including Raytheon, which is a defense contractor, and Analog Devices, which is a semiconductor manufacturer. The town also has a number of smaller businesses, including restaurants, retail stores, and professional services.
The town is also home to a number of educational institutions, including Phillips Academy, Abbot Academy, and Merrimack College. These institutions provide a number of jobs in the town, as well as educational opportunities for the residents.
Demographics
As of the 2010 census, Andover had a population of 33,201. The racial makeup of the town was 87.3% White, 4.2% Asian, 3.2% African American, 0.3% Native American, 0.1% Pacific Islander, and 4.9% from other races. The median household income was $97,837, and the median family income was $117,837.
Conclusion
Andover, Massachusetts is a suburban town located in Essex County, approximately 25 miles north of Boston. The town has a long history, dating back to 1642, and has a diverse economy, with a mix of manufacturing, retail, and service industries. The town is also home to a number of educational institutions, including Phillips Academy and Abbot Academy. As of the 2010 census, the town had a population of 33,201, with a median household income of $97,837.
Common Questions
What is Per Capita Income in Andover?
Per Capita income in Andover is $68,253.
What is the Median Family Income in Andover?
Median Family Income in Andover is $188,472.
What is the Median Household income in Andover?
Median Household Income in Andover is $130,417.
What is Income or Wage Gap in Andover?
Income or Wage Gap in Andover is 53.1%.
Women in Andover earn 46.9 cents for every dollar earned by a man.
What is Inequality or Gini Index in Andover?
Inequality or Gini Index in Andover is 0.49.
What is the Total Population of Andover?
Total Population of Andover is 9,419.
What is the Total Male Population of Andover?
Total Male Population of Andover is 4,372.
What is the Total Female Population of Andover?
Total Female Population of Andover is 5,047.
What is the Ratio of Males per 100 Females in Andover?
There are 86.63 Males per 100 Females in Andover.
What is the Ratio of Females per 100 Males in Andover?
There are 115.44 Females per 100 Males in Andover.
What is the Median Population Age in Andover?
Median Population Age in Andover is 45.4 Years.
What is the Average Family Size in Andover
Average Family Size in Andover is 2.8 People.
What is the Average Household Size in Andover
Average Household Size in Andover is 2.3 People.
How Large is the Labor Force in Andover?
There are 5,347 People in the Labor Forcein in Andover.
What is the Percentage of People in the Labor Force in Andover?
66.7% of People are in the Labor Force in Andover.
What is the Unemployment Rate in Andover?
Unemployment Rate in Andover is 7.2%.