Cities with the Most Births per 1,000 Women Over the Age of 35 in Massachusetts
RELATED REPORTS & OPTIONS
Highest Birth Rate | Women 35+
Massachusetts
Compare Cities
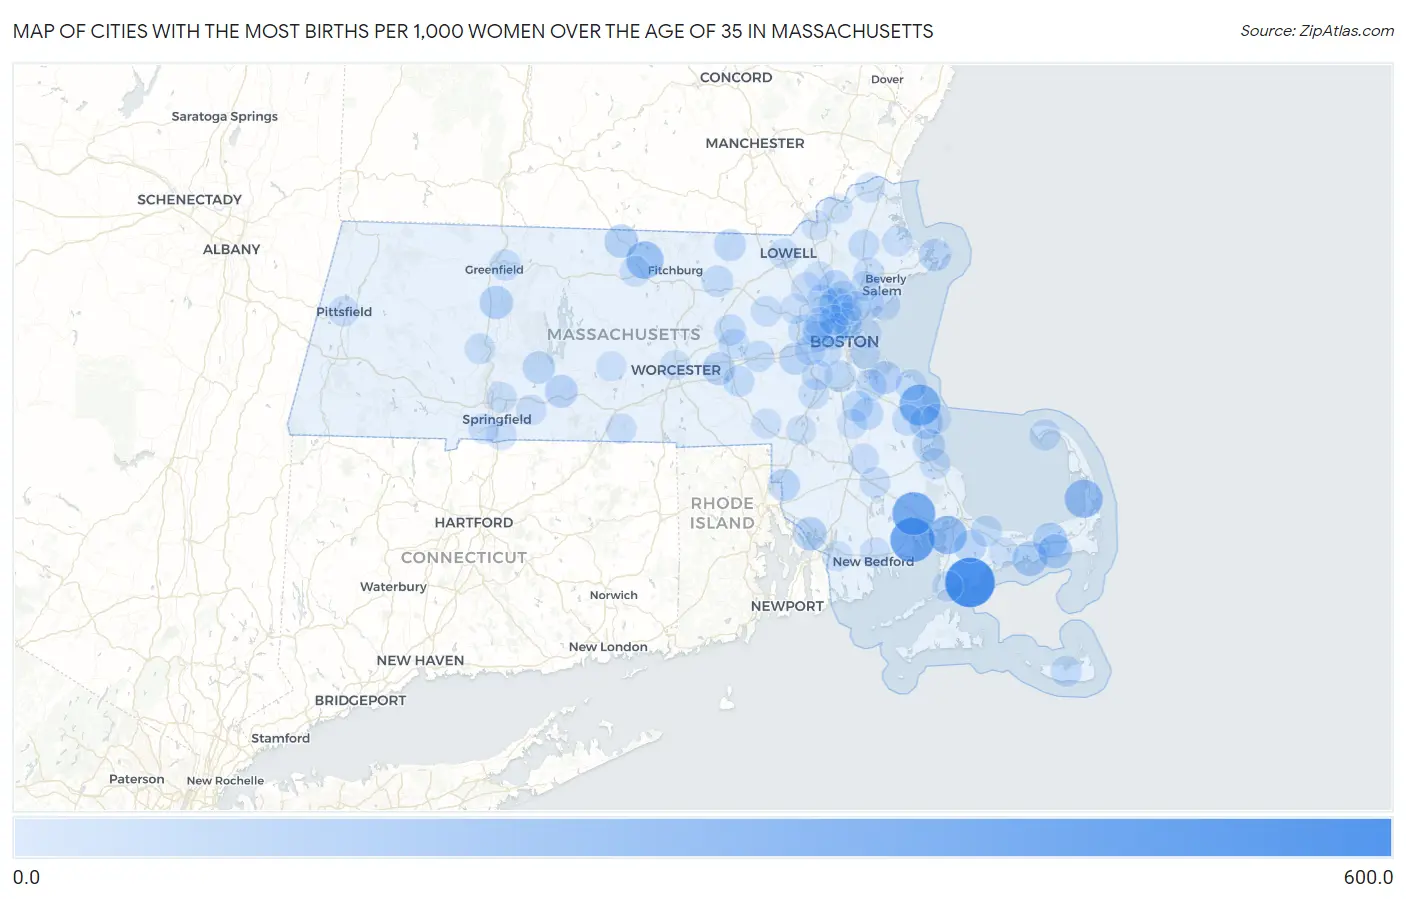
Map of Cities with the Most Births per 1,000 Women Over the Age of 35 in Massachusetts
0.0
600.0
Cities with the Most Births per 1,000 Women Over the Age of 35 in Massachusetts
| City | Births / 1,000 Women | vs State | vs National | |
| 1. | Seconsett Island | 571.0 | 36.0(+535)#1 | 32.0(+539)#108 |
| 2. | Marion Center | 420.0 | 36.0(+384)#2 | 32.0(+388)#203 |
| 3. | West Wareham | 385.0 | 36.0(+349)#3 | 32.0(+353)#219 |
| 4. | Marshfield Hills | 326.0 | 36.0(+290)#4 | 32.0(+294)#315 |
| 5. | Monument Beach | 257.0 | 36.0(+221)#5 | 32.0(+225)#446 |
| 6. | North Eastham | 248.0 | 36.0(+212)#6 | 32.0(+216)#491 |
| 7. | South Ashburnham | 220.0 | 36.0(+184)#7 | 32.0(+188)#595 |
| 8. | West Yarmouth | 158.0 | 36.0(+122)#8 | 32.0(+126)#989 |
| 9. | South Dennis | 146.0 | 36.0(+110)#9 | 32.0(+114)#1,115 |
| 10. | Dennis Port | 141.0 | 36.0(+105)#10 | 32.0(+109)#1,176 |
| 11. | Stoneham | 126.0 | 36.0(+90.0)#11 | 32.0(+94.0)#1,384 |
| 12. | West Warren | 122.0 | 36.0(+86.0)#12 | 32.0(+90.0)#1,473 |
| 13. | Winchendon | 117.0 | 36.0(+81.0)#13 | 32.0(+85.0)#1,548 |
| 14. | South Deerfield | 117.0 | 36.0(+81.0)#14 | 32.0(+85.0)#1,553 |
| 15. | Ocean Grove | 116.0 | 36.0(+80.0)#15 | 32.0(+84.0)#1,571 |
| 16. | Marshfield | 114.0 | 36.0(+78.0)#16 | 32.0(+82.0)#1,611 |
| 17. | Hingham | 107.0 | 36.0(+71.0)#17 | 32.0(+75.0)#1,779 |
| 18. | Cedar Crest | 105.0 | 36.0(+69.0)#18 | 32.0(+73.0)#1,828 |
| 19. | Palmer Town | 101.0 | 36.0(+65.0)#19 | 32.0(+69.0)#1,912 |
| 20. | Westborough | 99.0 | 36.0(+63.0)#20 | 32.0(+67.0)#1,980 |
| 21. | Belchertown | 94.0 | 36.0(+58.0)#21 | 32.0(+62.0)#2,115 |
| 22. | North Seekonk | 92.0 | 36.0(+56.0)#22 | 32.0(+60.0)#2,181 |
| 23. | Gloucester | 89.0 | 36.0(+53.0)#23 | 32.0(+57.0)#2,245 |
| 24. | Malden | 87.0 | 36.0(+51.0)#24 | 32.0(+55.0)#2,307 |
| 25. | South Duxbury | 87.0 | 36.0(+51.0)#25 | 32.0(+55.0)#2,324 |
| 26. | Forestdale | 85.0 | 36.0(+49.0)#26 | 32.0(+53.0)#2,387 |
| 27. | Reading | 81.0 | 36.0(+45.0)#27 | 32.0(+49.0)#2,517 |
| 28. | Wellesley | 79.0 | 36.0(+43.0)#28 | 32.0(+47.0)#2,582 |
| 29. | East Pepperell | 76.0 | 36.0(+40.0)#29 | 32.0(+44.0)#2,732 |
| 30. | Abington | 71.0 | 36.0(+35.0)#30 | 32.0(+39.0)#2,935 |
| 31. | Milton | 69.0 | 36.0(+33.0)#31 | 32.0(+37.0)#3,049 |
| 32. | Devens | 67.0 | 36.0(+31.0)#32 | 32.0(+35.0)#3,171 |
| 33. | North Scituate | 63.0 | 36.0(+27.0)#33 | 32.0(+31.0)#3,393 |
| 34. | East Sandwich | 63.0 | 36.0(+27.0)#34 | 32.0(+31.0)#3,404 |
| 35. | Weymouth Town | 62.0 | 36.0(+26.0)#35 | 32.0(+30.0)#3,450 |
| 36. | Hudson | 62.0 | 36.0(+26.0)#36 | 32.0(+30.0)#3,461 |
| 37. | Wakefield | 61.0 | 36.0(+25.0)#37 | 32.0(+29.0)#3,506 |
| 38. | Somerville | 60.0 | 36.0(+24.0)#38 | 32.0(+28.0)#3,579 |
| 39. | Holbrook | 60.0 | 36.0(+24.0)#39 | 32.0(+28.0)#3,596 |
| 40. | Turners Falls | 59.0 | 36.0(+23.0)#40 | 32.0(+27.0)#3,688 |
| 41. | Everett | 58.0 | 36.0(+22.0)#41 | 32.0(+26.0)#3,730 |
| 42. | Provincetown | 58.0 | 36.0(+22.0)#42 | 32.0(+26.0)#3,757 |
| 43. | Woburn | 57.0 | 36.0(+21.0)#43 | 32.0(+25.0)#3,787 |
| 44. | Greenfield | 57.0 | 36.0(+21.0)#44 | 32.0(+25.0)#3,797 |
| 45. | North Pembroke | 57.0 | 36.0(+21.0)#45 | 32.0(+25.0)#3,819 |
| 46. | Nantucket | 56.0 | 36.0(+20.0)#46 | 32.0(+24.0)#3,870 |
| 47. | Plymouth | 56.0 | 36.0(+20.0)#47 | 32.0(+24.0)#3,877 |
| 48. | Hopkinton | 56.0 | 36.0(+20.0)#48 | 32.0(+24.0)#3,891 |
| 49. | Cambridge | 55.0 | 36.0(+19.0)#49 | 32.0(+23.0)#3,929 |
| 50. | Waltham | 55.0 | 36.0(+19.0)#50 | 32.0(+23.0)#3,937 |
| 51. | Brookline | 53.0 | 36.0(+17.0)#51 | 32.0(+21.0)#4,117 |
| 52. | Framingham | 52.0 | 36.0(+16.0)#52 | 32.0(+20.0)#4,227 |
| 53. | Winchester | 52.0 | 36.0(+16.0)#53 | 32.0(+20.0)#4,247 |
| 54. | Watertown Town | 51.0 | 36.0(+15.0)#54 | 32.0(+19.0)#4,321 |
| 55. | Melrose | 51.0 | 36.0(+15.0)#55 | 32.0(+19.0)#4,326 |
| 56. | Boxford | 51.0 | 36.0(+15.0)#56 | 32.0(+19.0)#4,368 |
| 57. | Norwood | 50.0 | 36.0(+14.0)#57 | 32.0(+18.0)#4,420 |
| 58. | Gardner | 48.0 | 36.0(+12.0)#58 | 32.0(+16.0)#4,637 |
| 59. | Chicopee | 47.0 | 36.0(+11.0)#59 | 32.0(+15.0)#4,729 |
| 60. | Falmouth | 47.0 | 36.0(+11.0)#60 | 32.0(+15.0)#4,786 |
| 61. | Dedham | 46.0 | 36.0(+10.00)#61 | 32.0(+14.0)#4,849 |
| 62. | Swampscott | 46.0 | 36.0(+10.00)#62 | 32.0(+14.0)#4,855 |
| 63. | Middleborough Center | 45.0 | 36.0(+9.00)#63 | 32.0(+13.0)#4,967 |
| 64. | Arlington | 42.0 | 36.0(+6.00)#64 | 32.0(+10.00)#5,293 |
| 65. | Northampton | 42.0 | 36.0(+6.00)#65 | 32.0(+10.00)#5,300 |
| 66. | West Concord | 42.0 | 36.0(+6.00)#66 | 32.0(+10.00)#5,332 |
| 67. | Lynn | 40.0 | 36.0(+4.00)#67 | 32.0(+8.00)#5,522 |
| 68. | Newton | 40.0 | 36.0(+4.00)#68 | 32.0(+8.00)#5,525 |
| 69. | Marlborough | 40.0 | 36.0(+4.00)#69 | 32.0(+8.00)#5,537 |
| 70. | Danvers | 40.0 | 36.0(+4.00)#70 | 32.0(+8.00)#5,552 |
| 71. | Longmeadow | 40.0 | 36.0(+4.00)#71 | 32.0(+8.00)#5,573 |
| 72. | New Bedford | 39.0 | 36.0(+3.00)#72 | 32.0(+7.00)#5,670 |
| 73. | Pittsfield | 39.0 | 36.0(+3.00)#73 | 32.0(+7.00)#5,687 |
| 74. | Winthrop Town | 39.0 | 36.0(+3.00)#74 | 32.0(+7.00)#5,708 |
| 75. | Southbridge Town | 39.0 | 36.0(+3.00)#75 | 32.0(+7.00)#5,711 |
| 76. | Bridgewater Town | 38.0 | 36.0(+2.00)#76 | 32.0(+6.00)#5,834 |
| 77. | Pinehurst | 38.0 | 36.0(+2.00)#77 | 32.0(+6.00)#5,892 |
| 78. | Ipswich | 38.0 | 36.0(+2.00)#78 | 32.0(+6.00)#5,901 |
| 79. | Wilbraham | 38.0 | 36.0(+2.00)#79 | 32.0(+6.00)#5,907 |
| 80. | Agawam Town | 37.0 | 36.0(+1.000)#80 | 32.0(+5.00)#6,017 |
| 81. | Boston | 36.0 | 36.0(=0.000)#81 | 32.0(+4.00)#6,139 |
| 82. | Peabody | 36.0 | 36.0(=0.000)#82 | 32.0(+4.00)#6,163 |
| 83. | Lowell | 35.0 | 36.0(-1.000)#83 | 32.0(+3.00)#6,323 |
| 84. | Belmont | 33.0 | 36.0(-3.00)#84 | 32.0(+1.000)#6,659 |
| 85. | Hanscom Afb | 33.0 | 36.0(-3.00)#85 | 32.0(+1.000)#6,764 |
| 86. | Franklin Town | 32.0 | 36.0(-4.00)#86 | 32.0(=0.000)#6,843 |
| 87. | North Westport | 32.0 | 36.0(-4.00)#87 | 32.0(=0.000)#6,912 |
| 88. | Worcester | 31.0 | 36.0(-5.00)#88 | 32.0(-1.000)#6,972 |
| 89. | Brockton | 31.0 | 36.0(-5.00)#89 | 32.0(-1.000)#6,985 |
| 90. | Haverhill | 31.0 | 36.0(-5.00)#90 | 32.0(-1.000)#6,991 |
| 91. | Barnstable Town | 31.0 | 36.0(-5.00)#91 | 32.0(-1.000)#6,999 |
| 92. | Medford | 30.0 | 36.0(-6.00)#92 | 32.0(-2.00)#7,168 |
| 93. | Methuen Town | 30.0 | 36.0(-6.00)#93 | 32.0(-2.00)#7,172 |
| 94. | Saugus | 30.0 | 36.0(-6.00)#94 | 32.0(-2.00)#7,191 |
| 95. | Ocean Bluff Brant Rock | 30.0 | 36.0(-6.00)#95 | 32.0(-2.00)#7,258 |
| 96. | North Brookfield | 30.0 | 36.0(-6.00)#96 | 32.0(-2.00)#7,286 |
| 97. | Amherst | 29.0 | 36.0(-7.00)#97 | 32.0(-3.00)#7,372 |
| 98. | Foxborough | 29.0 | 36.0(-7.00)#98 | 32.0(-3.00)#7,428 |
| 99. | Wilmington | 28.0 | 36.0(-8.00)#99 | 32.0(-4.00)#7,568 |
| 100. | Amesbury Town | 28.0 | 36.0(-8.00)#100 | 32.0(-4.00)#7,588 |
1
2Common Questions
What are the Top 10 Cities with the Most Births per 1,000 Women Over the Age of 35 in Massachusetts?
Top 10 Cities with the Most Births per 1,000 Women Over the Age of 35 in Massachusetts are:
#1
571.0
#2
420.0
#3
385.0
#4
326.0
#5
257.0
#6
248.0
#7
220.0
#8
158.0
#9
146.0
#10
141.0
What city has the Most Births per 1,000 Women Over the Age of 35 in Massachusetts?
Seconsett Island has the Most Births per 1,000 Women Over the Age of 35 in Massachusetts with 571.0.
What is the Number of Births per 1,000 Women Over the Age of 35 in the State of Massachusetts?
Number of Births per 1,000 Women Over the Age of 35 in Massachusetts is 36.0.
What is the Number of Births per 1,000 Women Over the Age of 35 in the United States?
Number of Births per 1,000 Women Over the Age of 35 in the United States is 32.0.