Cities with the Highest Poverty Level Among Females Between Ages 18 and 24 in Massachusetts
RELATED REPORTS & OPTIONS
Highest Poverty | Female 18-24
Massachusetts
Compare Cities
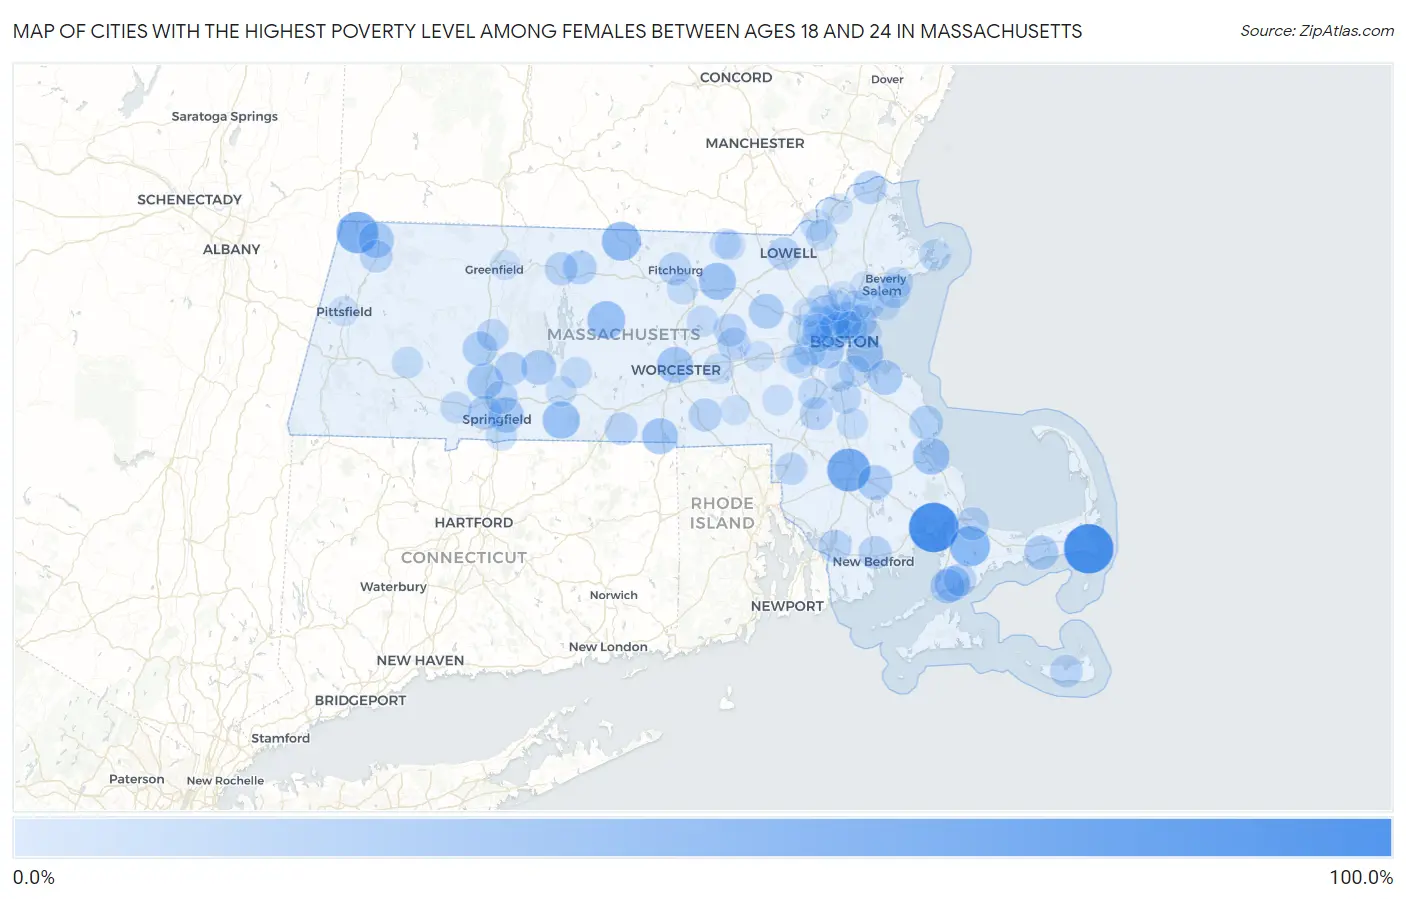
Map of Cities with the Highest Poverty Level Among Females Between Ages 18 and 24 in Massachusetts
0.0%
100.0%
Cities with the Highest Poverty Level Among Females Between Ages 18 and 24 in Massachusetts
| City | Female Poverty | vs State | vs National | |
| 1. | West Chatham | 100.0% | 16.9%(+83.1)#1 | 21.6%(+78.4)#90 |
| 2. | Onset | 100.0% | 16.9%(+83.1)#2 | 21.6%(+78.4)#129 |
| 3. | Amherst | 69.0% | 16.9%(+52.0)#3 | 21.6%(+47.4)#1,755 |
| 4. | Raynham Center | 68.2% | 16.9%(+51.3)#4 | 21.6%(+46.6)#1,791 |
| 5. | Williamstown | 60.9% | 16.9%(+44.0)#5 | 21.6%(+39.3)#2,260 |
| 6. | West Warren | 60.8% | 16.9%(+43.8)#6 | 21.6%(+39.2)#2,272 |
| 7. | Forestdale | 54.2% | 16.9%(+37.3)#7 | 21.6%(+32.6)#2,789 |
| 8. | Winchendon | 47.7% | 16.9%(+30.8)#8 | 21.6%(+26.1)#3,517 |
| 9. | Barre | 43.2% | 16.9%(+26.3)#9 | 21.6%(+21.6)#4,054 |
| 10. | Monson Center | 40.7% | 16.9%(+23.7)#10 | 21.6%(+19.1)#4,444 |
| 11. | Devens | 39.2% | 16.9%(+22.3)#11 | 21.6%(+17.6)#4,694 |
| 12. | North Plymouth | 37.8% | 16.9%(+20.9)#12 | 21.6%(+16.2)#4,900 |
| 13. | Boston | 36.0% | 16.9%(+19.1)#13 | 21.6%(+14.4)#5,206 |
| 14. | Worcester | 35.2% | 16.9%(+18.3)#14 | 21.6%(+13.6)#5,330 |
| 15. | Webster | 34.4% | 16.9%(+17.5)#15 | 21.6%(+12.8)#5,473 |
| 16. | Holyoke | 34.1% | 16.9%(+17.1)#16 | 21.6%(+12.5)#5,537 |
| 17. | North Adams | 32.1% | 16.9%(+15.2)#17 | 21.6%(+10.5)#6,004 |
| 18. | Teaticket | 31.6% | 16.9%(+14.7)#18 | 21.6%(+9.98)#6,079 |
| 19. | Springfield | 30.7% | 16.9%(+13.8)#19 | 21.6%(+9.10)#6,271 |
| 20. | Brookline | 30.2% | 16.9%(+13.3)#20 | 21.6%(+8.60)#6,356 |
| 21. | Middleborough Center | 29.1% | 16.9%(+12.2)#21 | 21.6%(+7.55)#6,615 |
| 22. | Cambridge | 28.8% | 16.9%(+11.9)#22 | 21.6%(+7.17)#6,691 |
| 23. | West Concord | 28.7% | 16.9%(+11.8)#23 | 21.6%(+7.13)#6,699 |
| 24. | Belchertown | 28.6% | 16.9%(+11.7)#24 | 21.6%(+6.97)#6,719 |
| 25. | Hingham | 28.3% | 16.9%(+11.4)#25 | 21.6%(+6.69)#6,844 |
| 26. | Northampton | 27.5% | 16.9%(+10.6)#26 | 21.6%(+5.93)#7,017 |
| 27. | South Yarmouth | 27.3% | 16.9%(+10.4)#27 | 21.6%(+5.74)#7,057 |
| 28. | Falmouth | 27.0% | 16.9%(+10.1)#28 | 21.6%(+5.39)#7,172 |
| 29. | West Springfield Town | 25.2% | 16.9%(+8.32)#29 | 21.6%(+3.63)#7,591 |
| 30. | Marshfield | 24.3% | 16.9%(+7.43)#30 | 21.6%(+2.74)#7,883 |
| 31. | Athol | 24.1% | 16.9%(+7.17)#31 | 21.6%(+2.49)#7,945 |
| 32. | Malden | 23.1% | 16.9%(+6.20)#32 | 21.6%(+1.51)#8,205 |
| 33. | Salem | 23.0% | 16.9%(+6.11)#33 | 21.6%(+1.42)#8,254 |
| 34. | Amesbury Town | 22.5% | 16.9%(+5.55)#34 | 21.6%(+0.861)#8,389 |
| 35. | Revere | 22.4% | 16.9%(+5.50)#35 | 21.6%(+0.812)#8,405 |
| 36. | Somerville | 22.3% | 16.9%(+5.43)#36 | 21.6%(+0.745)#8,419 |
| 37. | New Bedford | 21.6% | 16.9%(+4.68)#37 | 21.6%(-0.005)#8,674 |
| 38. | Orange | 21.3% | 16.9%(+4.35)#38 | 21.6%(-0.338)#8,788 |
| 39. | Sandwich | 21.2% | 16.9%(+4.30)#39 | 21.6%(-0.385)#8,806 |
| 40. | Granby | 20.8% | 16.9%(+3.92)#40 | 21.6%(-0.764)#8,927 |
| 41. | Whitinsville | 20.7% | 16.9%(+3.83)#41 | 21.6%(-0.858)#8,952 |
| 42. | Fall River | 20.4% | 16.9%(+3.54)#42 | 21.6%(-1.15)#9,029 |
| 43. | Sharon | 20.1% | 16.9%(+3.23)#43 | 21.6%(-1.45)#9,089 |
| 44. | Lowell | 20.0% | 16.9%(+3.08)#44 | 21.6%(-1.61)#9,241 |
| 45. | Chicopee | 20.0% | 16.9%(+3.04)#45 | 21.6%(-1.65)#9,243 |
| 46. | Southbridge Town | 19.9% | 16.9%(+3.00)#46 | 21.6%(-1.68)#9,251 |
| 47. | Fitchburg | 19.9% | 16.9%(+2.95)#47 | 21.6%(-1.74)#9,257 |
| 48. | East Falmouth | 19.8% | 16.9%(+2.85)#48 | 21.6%(-1.84)#9,277 |
| 49. | Hudson | 19.3% | 16.9%(+2.36)#49 | 21.6%(-2.33)#9,389 |
| 50. | Marlborough | 19.1% | 16.9%(+2.21)#50 | 21.6%(-2.47)#9,427 |
| 51. | Adams | 19.0% | 16.9%(+2.08)#51 | 21.6%(-2.60)#9,474 |
| 52. | Nantucket | 18.6% | 16.9%(+1.66)#52 | 21.6%(-3.03)#9,595 |
| 53. | Chelsea | 17.9% | 16.9%(+0.990)#53 | 21.6%(-3.70)#9,823 |
| 54. | Randolph Town | 17.4% | 16.9%(+0.526)#54 | 21.6%(-4.16)#9,989 |
| 55. | Attleboro | 17.0% | 16.9%(+0.109)#55 | 21.6%(-4.58)#10,131 |
| 56. | Newton | 16.8% | 16.9%(-0.090)#56 | 21.6%(-4.78)#10,175 |
| 57. | Arlington | 16.8% | 16.9%(-0.152)#57 | 21.6%(-4.84)#10,195 |
| 58. | Hatfield | 16.0% | 16.9%(-0.860)#58 | 21.6%(-5.55)#10,456 |
| 59. | Medford | 15.8% | 16.9%(-1.10)#59 | 21.6%(-5.79)#10,547 |
| 60. | Gloucester | 15.4% | 16.9%(-1.52)#60 | 21.6%(-6.21)#10,681 |
| 61. | Westfield | 14.8% | 16.9%(-2.15)#61 | 21.6%(-6.84)#10,951 |
| 62. | Quincy | 14.4% | 16.9%(-2.49)#62 | 21.6%(-7.18)#11,063 |
| 63. | Watertown Town | 14.3% | 16.9%(-2.61)#63 | 21.6%(-7.30)#11,085 |
| 64. | Waltham | 13.9% | 16.9%(-3.04)#64 | 21.6%(-7.73)#11,296 |
| 65. | Ware | 13.6% | 16.9%(-3.30)#65 | 21.6%(-7.99)#11,408 |
| 66. | Methuen Town | 13.5% | 16.9%(-3.42)#66 | 21.6%(-8.11)#11,449 |
| 67. | Leominster | 13.4% | 16.9%(-3.52)#67 | 21.6%(-8.20)#11,474 |
| 68. | Clinton | 13.4% | 16.9%(-3.55)#68 | 21.6%(-8.24)#11,484 |
| 69. | Lawrence | 13.3% | 16.9%(-3.59)#69 | 21.6%(-8.28)#11,535 |
| 70. | Longmeadow | 13.3% | 16.9%(-3.65)#70 | 21.6%(-8.33)#11,558 |
| 71. | Norwood | 13.2% | 16.9%(-3.73)#71 | 21.6%(-8.42)#11,586 |
| 72. | Chester | 13.0% | 16.9%(-3.87)#72 | 21.6%(-8.55)#11,641 |
| 73. | Greenfield | 13.0% | 16.9%(-3.92)#73 | 21.6%(-8.61)#11,663 |
| 74. | Beverly | 12.8% | 16.9%(-4.15)#74 | 21.6%(-8.84)#11,745 |
| 75. | Lynn | 12.4% | 16.9%(-4.50)#75 | 21.6%(-9.18)#11,902 |
| 76. | Brockton | 12.3% | 16.9%(-4.60)#76 | 21.6%(-9.29)#11,939 |
| 77. | Needham | 11.9% | 16.9%(-5.01)#77 | 21.6%(-9.70)#12,115 |
| 78. | Winthrop Town | 11.5% | 16.9%(-5.36)#78 | 21.6%(-10.1)#12,243 |
| 79. | Palmer Town | 11.1% | 16.9%(-5.80)#79 | 21.6%(-10.5)#12,395 |
| 80. | Westborough | 11.1% | 16.9%(-5.80)#80 | 21.6%(-10.5)#12,399 |
| 81. | Millis Clicquot | 10.6% | 16.9%(-6.36)#81 | 21.6%(-11.0)#12,633 |
| 82. | Swampscott | 10.4% | 16.9%(-6.49)#82 | 21.6%(-11.2)#12,698 |
| 83. | Saugus | 10.4% | 16.9%(-6.55)#83 | 21.6%(-11.2)#12,721 |
| 84. | Pepperell | 9.9% | 16.9%(-7.01)#84 | 21.6%(-11.7)#12,938 |
| 85. | Haverhill | 9.4% | 16.9%(-7.53)#85 | 21.6%(-12.2)#13,158 |
| 86. | East Pepperell | 9.3% | 16.9%(-7.56)#86 | 21.6%(-12.3)#13,176 |
| 87. | Everett | 9.3% | 16.9%(-7.60)#87 | 21.6%(-12.3)#13,188 |
| 88. | Framingham | 9.3% | 16.9%(-7.63)#88 | 21.6%(-12.3)#13,199 |
| 89. | Milton | 9.0% | 16.9%(-7.93)#89 | 21.6%(-12.6)#13,337 |
| 90. | Stoneham | 8.8% | 16.9%(-8.09)#90 | 21.6%(-12.8)#13,392 |
| 91. | Woburn | 8.3% | 16.9%(-8.58)#91 | 21.6%(-13.3)#13,601 |
| 92. | Turners Falls | 7.5% | 16.9%(-9.39)#92 | 21.6%(-14.1)#13,887 |
| 93. | Winchester | 7.4% | 16.9%(-9.50)#93 | 21.6%(-14.2)#13,917 |
| 94. | Hopedale | 7.4% | 16.9%(-9.54)#94 | 21.6%(-14.2)#13,934 |
| 95. | Peabody | 7.4% | 16.9%(-9.56)#95 | 21.6%(-14.2)#13,937 |
| 96. | Lexington | 7.2% | 16.9%(-9.70)#96 | 21.6%(-14.4)#13,991 |
| 97. | Wakefield | 7.1% | 16.9%(-9.82)#97 | 21.6%(-14.5)#14,048 |
| 98. | Pittsfield | 7.0% | 16.9%(-9.92)#98 | 21.6%(-14.6)#14,088 |
| 99. | Wellesley | 7.0% | 16.9%(-9.94)#99 | 21.6%(-14.6)#14,098 |
| 100. | Belmont | 7.0% | 16.9%(-9.94)#100 | 21.6%(-14.6)#14,099 |
Common Questions
What are the Top 10 Cities with the Highest Poverty Level Among Females Between Ages 18 and 24 in Massachusetts?
Top 10 Cities with the Highest Poverty Level Among Females Between Ages 18 and 24 in Massachusetts are:
#1
100.0%
#2
100.0%
#3
68.2%
#4
60.9%
#5
54.2%
#6
47.7%
#7
43.2%
#8
40.7%
#9
39.2%
#10
37.8%
What city has the Highest Poverty Level Among Females Between Ages 18 and 24 in Massachusetts?
West Chatham has the Highest Poverty Level Among Females Between Ages 18 and 24 in Massachusetts with 100.0%.
What is the Poverty Level Among Females Between Ages 18 and 24 in the State of Massachusetts?
Poverty Level Among Females Between Ages 18 and 24 in Massachusetts is 16.9%.
What is the Poverty Level Among Females Between Ages 18 and 24 in the United States?
Poverty Level Among Females Between Ages 18 and 24 in the United States is 21.6%.