Zip Codes with the Highest Percentage of Population Employed in Security & Protection in Massachusetts
RELATED REPORTS & OPTIONS
Security & Protection
Massachusetts
Compare Zip Codes
Map of Zip Codes with the Highest Percentage of Population Employed in Security & Protection in Massachusetts
0.0%
15.0%
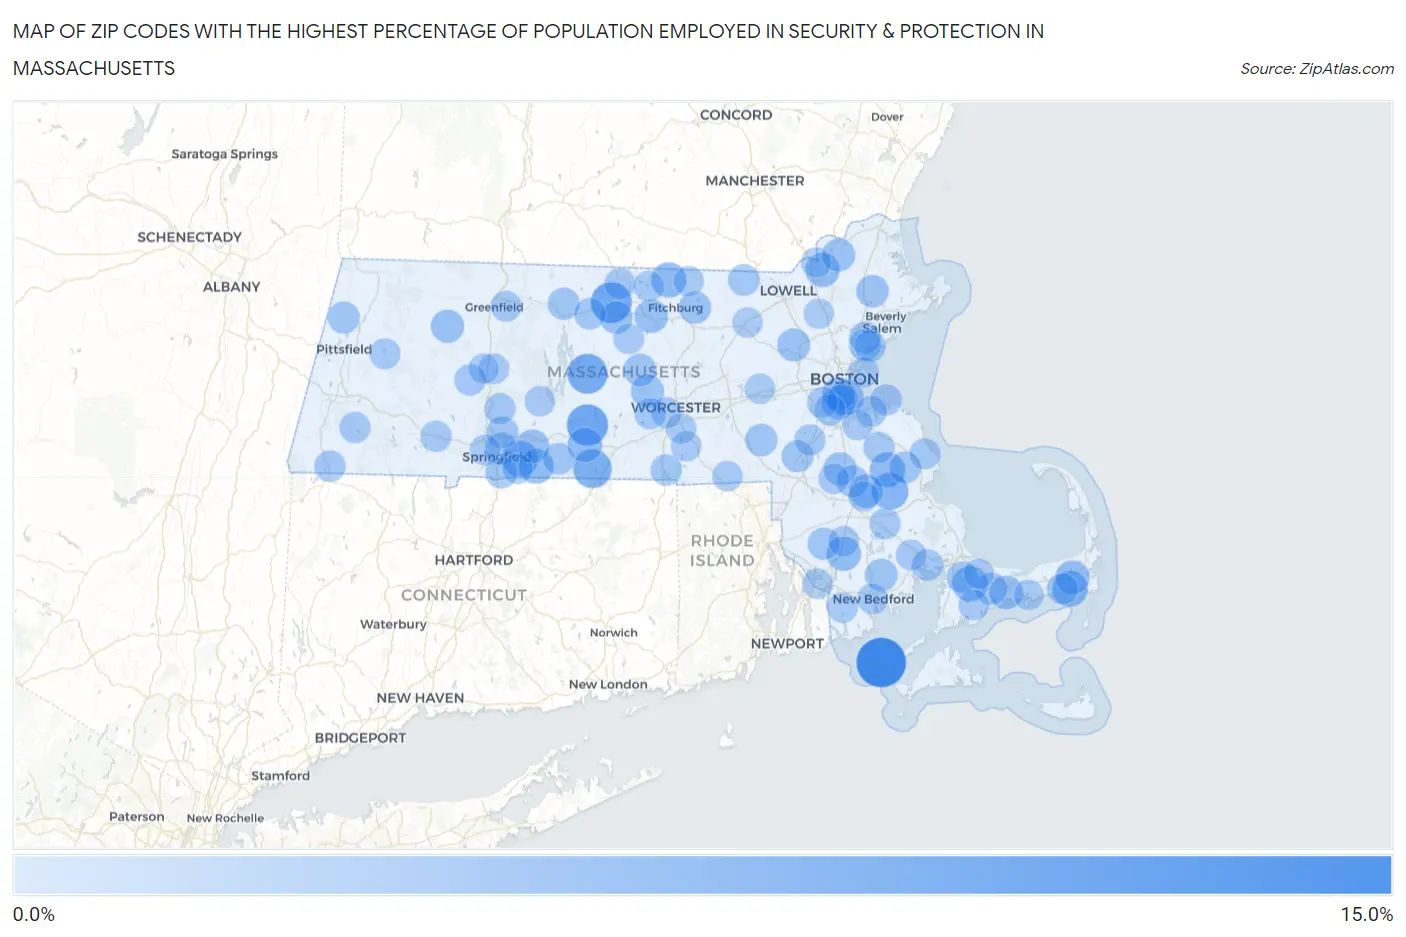
Zip Codes with the Highest Percentage of Population Employed in Security & Protection in Massachusetts
| Zip Code | % Employed | vs State | vs National | |
| 1. | 02713 | 14.3% | 2.0%(+12.3)#1 | 2.1%(+12.1)#404 |
| 2. | 01083 | 9.3% | 2.0%(+7.28)#2 | 2.1%(+7.15)#861 |
| 3. | 01436 | 9.2% | 2.0%(+7.20)#3 | 2.1%(+7.06)#876 |
| 4. | 01037 | 8.6% | 2.0%(+6.62)#4 | 2.1%(+6.49)#978 |
| 5. | 01521 | 7.8% | 2.0%(+5.77)#5 | 2.1%(+5.63)#1,245 |
| 6. | 02338 | 6.8% | 2.0%(+4.83)#6 | 2.1%(+4.69)#1,612 |
| 7. | 01128 | 6.4% | 2.0%(+4.34)#7 | 2.1%(+4.20)#1,863 |
| 8. | 02646 | 6.1% | 2.0%(+4.09)#8 | 2.1%(+3.96)#2,007 |
| 9. | 02644 | 5.9% | 2.0%(+3.93)#9 | 2.1%(+3.80)#2,116 |
| 10. | 02341 | 5.9% | 2.0%(+3.86)#10 | 2.1%(+3.73)#2,166 |
| 11. | 01431 | 5.8% | 2.0%(+3.80)#11 | 2.1%(+3.66)#2,201 |
| 12. | 01036 | 5.7% | 2.0%(+3.65)#12 | 2.1%(+3.52)#2,312 |
| 13. | 02122 | 5.6% | 2.0%(+3.62)#13 | 2.1%(+3.49)#2,344 |
| 14. | 01010 | 5.4% | 2.0%(+3.41)#14 | 2.1%(+3.28)#2,515 |
| 15. | 02702 | 5.4% | 2.0%(+3.36)#15 | 2.1%(+3.23)#2,562 |
| 16. | 01840 | 5.3% | 2.0%(+3.31)#16 | 2.1%(+3.17)#2,612 |
| 17. | 02645 | 5.2% | 2.0%(+3.19)#17 | 2.1%(+3.05)#2,711 |
| 18. | 02126 | 5.0% | 2.0%(+2.99)#18 | 2.1%(+2.85)#2,924 |
| 19. | 02632 | 5.0% | 2.0%(+2.95)#19 | 2.1%(+2.81)#2,971 |
| 20. | 02325 | 4.9% | 2.0%(+2.89)#20 | 2.1%(+2.76)#3,041 |
| 21. | 01095 | 4.9% | 2.0%(+2.87)#21 | 2.1%(+2.74)#3,061 |
| 22. | 01473 | 4.8% | 2.0%(+2.84)#22 | 2.1%(+2.70)#3,109 |
| 23. | 01330 | 4.7% | 2.0%(+2.72)#23 | 2.1%(+2.59)#3,252 |
| 24. | 01612 | 4.6% | 2.0%(+2.60)#24 | 2.1%(+2.47)#3,409 |
| 25. | 01731 | 4.6% | 2.0%(+2.55)#25 | 2.1%(+2.41)#3,501 |
| 26. | 02121 | 4.6% | 2.0%(+2.54)#26 | 2.1%(+2.40)#3,519 |
| 27. | 01835 | 4.5% | 2.0%(+2.49)#27 | 2.1%(+2.35)#3,608 |
| 28. | 02357 | 4.5% | 2.0%(+2.48)#28 | 2.1%(+2.35)#3,619 |
| 29. | 01543 | 4.3% | 2.0%(+2.33)#29 | 2.1%(+2.20)#3,857 |
| 30. | 01468 | 4.3% | 2.0%(+2.29)#30 | 2.1%(+2.16)#3,936 |
| 31. | 02743 | 4.3% | 2.0%(+2.29)#31 | 2.1%(+2.16)#3,938 |
| 32. | 01983 | 4.2% | 2.0%(+2.22)#32 | 2.1%(+2.08)#4,068 |
| 33. | 01462 | 4.2% | 2.0%(+2.20)#33 | 2.1%(+2.07)#4,100 |
| 34. | 02053 | 4.2% | 2.0%(+2.18)#34 | 2.1%(+2.04)#4,136 |
| 35. | 01104 | 4.2% | 2.0%(+2.16)#35 | 2.1%(+2.02)#4,175 |
| 36. | 02648 | 4.2% | 2.0%(+2.15)#36 | 2.1%(+2.01)#4,194 |
| 37. | 01364 | 4.1% | 2.0%(+2.10)#37 | 2.1%(+1.97)#4,265 |
| 38. | 02715 | 4.1% | 2.0%(+2.07)#38 | 2.1%(+1.94)#4,325 |
| 39. | 01237 | 4.0% | 2.0%(+1.99)#39 | 2.1%(+1.85)#4,486 |
| 40. | 02379 | 4.0% | 2.0%(+1.98)#40 | 2.1%(+1.84)#4,515 |
| 41. | 02071 | 4.0% | 2.0%(+1.95)#41 | 2.1%(+1.81)#4,568 |
| 42. | 01020 | 3.9% | 2.0%(+1.87)#42 | 2.1%(+1.73)#4,728 |
| 43. | 02542 | 3.9% | 2.0%(+1.86)#43 | 2.1%(+1.72)#4,753 |
| 44. | 01106 | 3.9% | 2.0%(+1.85)#44 | 2.1%(+1.71)#4,777 |
| 45. | 01905 | 3.9% | 2.0%(+1.84)#45 | 2.1%(+1.70)#4,800 |
| 46. | 02359 | 3.8% | 2.0%(+1.82)#46 | 2.1%(+1.69)#4,833 |
| 47. | 01057 | 3.8% | 2.0%(+1.78)#47 | 2.1%(+1.65)#4,916 |
| 48. | 02571 | 3.7% | 2.0%(+1.72)#48 | 2.1%(+1.59)#5,058 |
| 49. | 01827 | 3.7% | 2.0%(+1.71)#49 | 2.1%(+1.58)#5,071 |
| 50. | 01904 | 3.7% | 2.0%(+1.71)#50 | 2.1%(+1.57)#5,095 |
| 51. | 01331 | 3.7% | 2.0%(+1.67)#51 | 2.1%(+1.54)#5,190 |
| 52. | 01570 | 3.7% | 2.0%(+1.65)#52 | 2.1%(+1.51)#5,246 |
| 53. | 02124 | 3.7% | 2.0%(+1.64)#53 | 2.1%(+1.50)#5,275 |
| 54. | 01901 | 3.6% | 2.0%(+1.60)#54 | 2.1%(+1.46)#5,378 |
| 55. | 01222 | 3.6% | 2.0%(+1.57)#55 | 2.1%(+1.43)#5,448 |
| 56. | 01053 | 3.6% | 2.0%(+1.54)#56 | 2.1%(+1.41)#5,523 |
| 57. | 01075 | 3.6% | 2.0%(+1.54)#57 | 2.1%(+1.40)#5,533 |
| 58. | 01524 | 3.5% | 2.0%(+1.53)#58 | 2.1%(+1.39)#5,559 |
| 59. | 02136 | 3.5% | 2.0%(+1.52)#59 | 2.1%(+1.39)#5,581 |
| 60. | 02045 | 3.5% | 2.0%(+1.49)#60 | 2.1%(+1.36)#5,655 |
| 61. | 02032 | 3.5% | 2.0%(+1.48)#61 | 2.1%(+1.35)#5,673 |
| 62. | 01475 | 3.5% | 2.0%(+1.48)#62 | 2.1%(+1.35)#5,677 |
| 63. | 02191 | 3.5% | 2.0%(+1.48)#63 | 2.1%(+1.34)#5,697 |
| 64. | 01245 | 3.5% | 2.0%(+1.47)#64 | 2.1%(+1.33)#5,721 |
| 65. | 02671 | 3.5% | 2.0%(+1.45)#65 | 2.1%(+1.31)#5,782 |
| 66. | 02050 | 3.5% | 2.0%(+1.44)#66 | 2.1%(+1.30)#5,801 |
| 67. | 02346 | 3.4% | 2.0%(+1.40)#67 | 2.1%(+1.26)#5,902 |
| 68. | 01071 | 3.4% | 2.0%(+1.38)#68 | 2.1%(+1.24)#5,951 |
| 69. | 02370 | 3.4% | 2.0%(+1.36)#69 | 2.1%(+1.23)#6,011 |
| 70. | 01235 | 3.4% | 2.0%(+1.34)#70 | 2.1%(+1.21)#6,066 |
| 71. | 01603 | 3.4% | 2.0%(+1.34)#71 | 2.1%(+1.20)#6,083 |
| 72. | 01376 | 3.3% | 2.0%(+1.33)#72 | 2.1%(+1.20)#6,109 |
| 73. | 02132 | 3.3% | 2.0%(+1.29)#73 | 2.1%(+1.16)#6,222 |
| 74. | 02576 | 3.3% | 2.0%(+1.24)#74 | 2.1%(+1.11)#6,378 |
| 75. | 01038 | 3.2% | 2.0%(+1.22)#75 | 2.1%(+1.09)#6,438 |
| 76. | 02375 | 3.2% | 2.0%(+1.21)#76 | 2.1%(+1.07)#6,492 |
| 77. | 02790 | 3.2% | 2.0%(+1.18)#77 | 2.1%(+1.05)#6,560 |
| 78. | 01430 | 3.2% | 2.0%(+1.17)#78 | 2.1%(+1.04)#6,583 |
| 79. | 02779 | 3.2% | 2.0%(+1.16)#79 | 2.1%(+1.02)#6,632 |
| 80. | 02740 | 3.2% | 2.0%(+1.15)#80 | 2.1%(+1.02)#6,648 |
| 81. | 01529 | 3.2% | 2.0%(+1.15)#81 | 2.1%(+1.02)#6,650 |
| 82. | 02184 | 3.2% | 2.0%(+1.14)#82 | 2.1%(+1.00)#6,687 |
| 83. | 02649 | 3.1% | 2.0%(+1.13)#83 | 2.1%(+0.997)#6,718 |
| 84. | 01452 | 3.1% | 2.0%(+1.10)#84 | 2.1%(+0.970)#6,825 |
| 85. | 01007 | 3.1% | 2.0%(+1.09)#85 | 2.1%(+0.956)#6,872 |
| 86. | 01590 | 3.1% | 2.0%(+1.08)#86 | 2.1%(+0.946)#6,905 |
| 87. | 02152 | 3.1% | 2.0%(+1.08)#87 | 2.1%(+0.942)#6,917 |
| 88. | 01089 | 3.1% | 2.0%(+1.07)#88 | 2.1%(+0.932)#6,955 |
| 89. | 01701 | 3.0% | 2.0%(+1.03)#89 | 2.1%(+0.891)#7,071 |
| 90. | 02563 | 3.0% | 2.0%(+1.01)#90 | 2.1%(+0.877)#7,126 |
| 91. | 01474 | 3.0% | 2.0%(+1.01)#91 | 2.1%(+0.876)#7,129 |
| 92. | 01028 | 3.0% | 2.0%(+1.00)#92 | 2.1%(+0.867)#7,163 |
| 93. | 01460 | 3.0% | 2.0%(+1.00)#93 | 2.1%(+0.867)#7,170 |
| 94. | 01844 | 3.0% | 2.0%(+0.999)#94 | 2.1%(+0.865)#7,178 |
| 95. | 01088 | 3.0% | 2.0%(+0.990)#95 | 2.1%(+0.856)#7,215 |
| 96. | 01887 | 3.0% | 2.0%(+0.979)#96 | 2.1%(+0.845)#7,254 |
| 97. | 02324 | 3.0% | 2.0%(+0.973)#97 | 2.1%(+0.838)#7,279 |
| 98. | 02673 | 3.0% | 2.0%(+0.970)#98 | 2.1%(+0.835)#7,293 |
| 99. | 01527 | 3.0% | 2.0%(+0.939)#99 | 2.1%(+0.805)#7,415 |
| 100. | 02724 | 3.0% | 2.0%(+0.939)#100 | 2.1%(+0.805)#7,416 |
Common Questions
What are the Top 10 Zip Codes with the Highest Percentage of Population Employed in Security & Protection in Massachusetts?
Top 10 Zip Codes with the Highest Percentage of Population Employed in Security & Protection in Massachusetts are:
What zip code has the Highest Percentage of Population Employed in Security & Protection in Massachusetts?
02713 has the Highest Percentage of Population Employed in Security & Protection in Massachusetts with 14.3%.
What is the Percentage of Population Employed in Security & Protection in the State of Massachusetts?
Percentage of Population Employed in Security & Protection in Massachusetts is 2.0%.
What is the Percentage of Population Employed in Security & Protection in the United States?
Percentage of Population Employed in Security & Protection in the United States is 2.1%.