West Springfield Town, MA Map & Demographics
West Springfield Town Map
West Springfield Town Overview
$41,129
PER CAPITA INCOME
$93,441
AVG FAMILY INCOME
$67,297
AVG HOUSEHOLD INCOME
28.1%
WAGE / INCOME GAP [ % ]
71.9¢/ $1
WAGE / INCOME GAP [ $ ]
$8,398
FAMILY INCOME DEFICIT
0.46
INEQUALITY / GINI INDEX
28,755
TOTAL POPULATION
13,952
MALE POPULATION
14,803
FEMALE POPULATION
94.25
MALES / 100 FEMALES
106.10
FEMALES / 100 MALES
38.7
MEDIAN AGE
3.0
AVG FAMILY SIZE
2.3
AVG HOUSEHOLD SIZE
16,083
LABOR FORCE [ PEOPLE ]
67.6%
PERCENT IN LABOR FORCE
5.8%
UNEMPLOYMENT RATE
Income in West Springfield Town
Income Overview in West Springfield Town
Per Capita Income in West Springfield Town is $41,129, while median incomes of families and households are $93,441 and $67,297 respectively.
| Characteristic | Number | Measure |
| Per Capita Income | 28,755 | $41,129 |
| Median Family Income | 7,109 | $93,441 |
| Mean Family Income | 7,109 | $117,357 |
| Median Household Income | 12,691 | $67,297 |
| Mean Household Income | 12,691 | $92,898 |
| Income Deficit | 7,109 | $8,398 |
| Wage / Income Gap (%) | 28,755 | 28.14% |
| Wage / Income Gap ($) | 28,755 | 71.86¢ per $1 |
| Gini / Inequality Index | 28,755 | 0.46 |
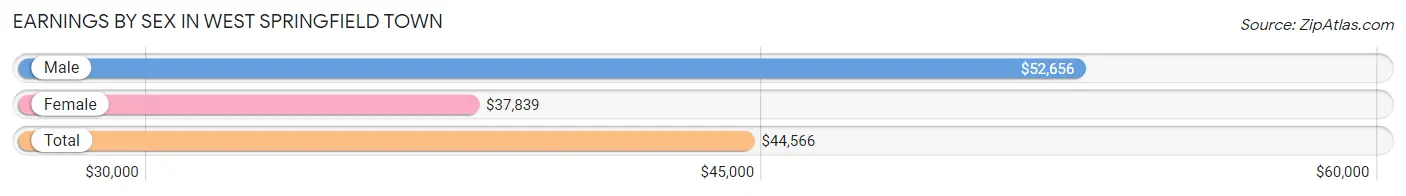
Earnings by Sex in West Springfield Town
Average Earnings in West Springfield Town are $44,566, $52,656 for men and $37,839 for women, a difference of 28.1%.
| Sex | Number | Average Earnings |
| Male | 8,321 (50.4%) | $52,656 |
| Female | 8,189 (49.6%) | $37,839 |
| Total | 16,510 (100.0%) | $44,566 |
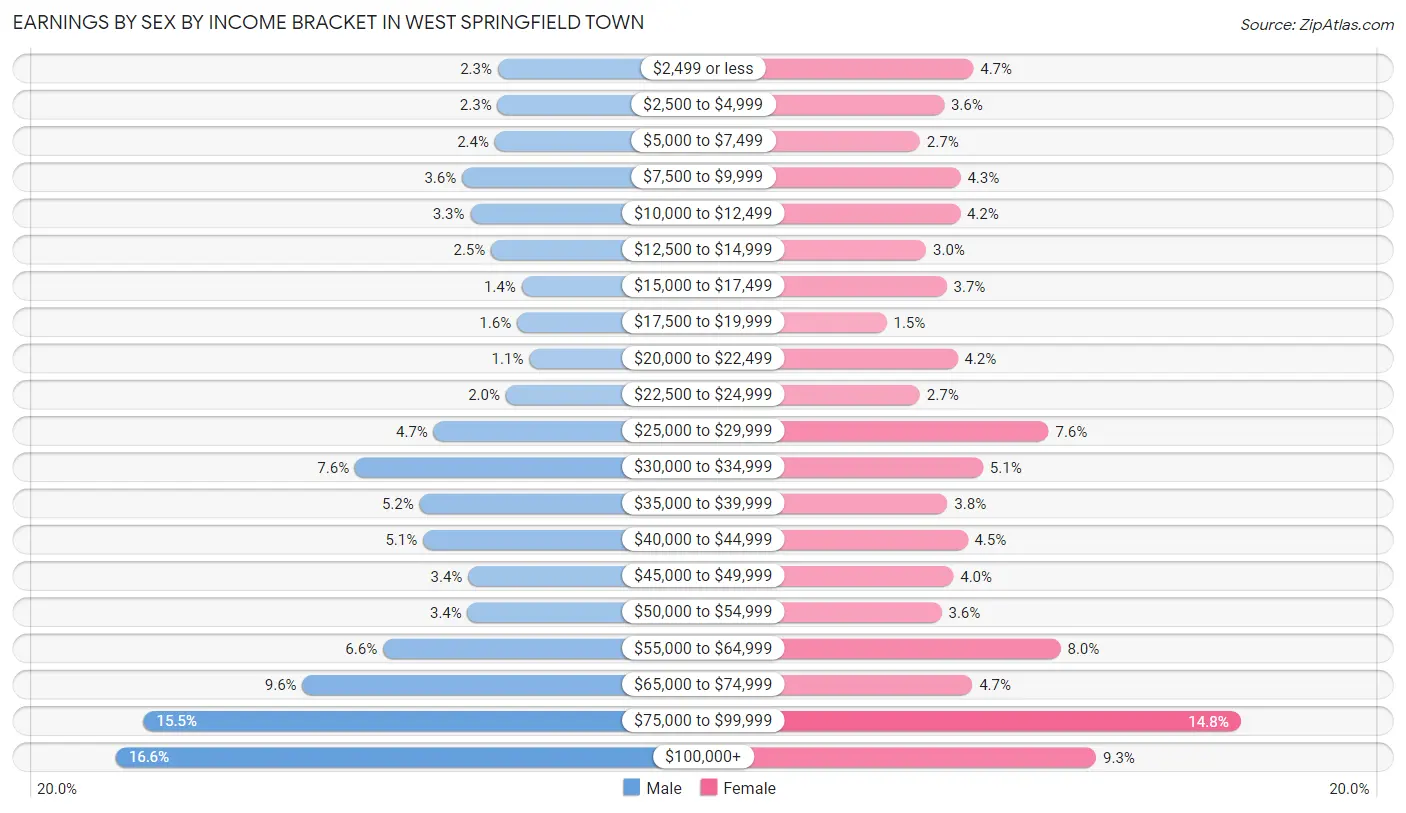
Earnings by Sex by Income Bracket in West Springfield Town
The most common earnings brackets in West Springfield Town are $100,000+ for men (1,380 | 16.6%) and $75,000 to $99,999 for women (1,208 | 14.7%).
| Income | Male | Female |
| $2,499 or less | 189 (2.3%) | 388 (4.7%) |
| $2,500 to $4,999 | 190 (2.3%) | 298 (3.6%) |
| $5,000 to $7,499 | 198 (2.4%) | 224 (2.7%) |
| $7,500 to $9,999 | 300 (3.6%) | 349 (4.3%) |
| $10,000 to $12,499 | 275 (3.3%) | 347 (4.2%) |
| $12,500 to $14,999 | 210 (2.5%) | 243 (3.0%) |
| $15,000 to $17,499 | 115 (1.4%) | 306 (3.7%) |
| $17,500 to $19,999 | 129 (1.5%) | 122 (1.5%) |
| $20,000 to $22,499 | 91 (1.1%) | 340 (4.2%) |
| $22,500 to $24,999 | 164 (2.0%) | 224 (2.7%) |
| $25,000 to $29,999 | 389 (4.7%) | 619 (7.6%) |
| $30,000 to $34,999 | 634 (7.6%) | 418 (5.1%) |
| $35,000 to $39,999 | 433 (5.2%) | 309 (3.8%) |
| $40,000 to $44,999 | 422 (5.1%) | 370 (4.5%) |
| $45,000 to $49,999 | 281 (3.4%) | 327 (4.0%) |
| $50,000 to $54,999 | 283 (3.4%) | 291 (3.5%) |
| $55,000 to $64,999 | 547 (6.6%) | 656 (8.0%) |
| $65,000 to $74,999 | 798 (9.6%) | 385 (4.7%) |
| $75,000 to $99,999 | 1,293 (15.5%) | 1,208 (14.7%) |
| $100,000+ | 1,380 (16.6%) | 765 (9.3%) |
| Total | 8,321 (100.0%) | 8,189 (100.0%) |
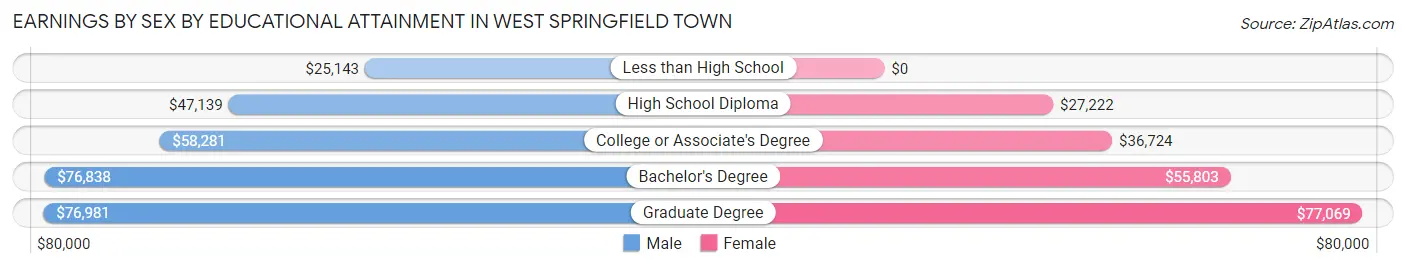
Earnings by Sex by Educational Attainment in West Springfield Town
Average earnings in West Springfield Town are $60,671 for men and $46,020 for women, a difference of 24.1%. Men with an educational attainment of graduate degree enjoy the highest average annual earnings of $76,981, while those with less than high school education earn the least with $25,143. Women with an educational attainment of graduate degree earn the most with the average annual earnings of $77,069, while those with high school diploma education have the smallest earnings of $27,222.
| Educational Attainment | Male Income | Female Income |
| Less than High School | $25,143 | $0 |
| High School Diploma | $47,139 | $27,222 |
| College or Associate's Degree | $58,281 | $36,724 |
| Bachelor's Degree | $76,838 | $55,803 |
| Graduate Degree | $76,981 | $77,069 |
| Total | $60,671 | $46,020 |
Family Income in West Springfield Town
Family Income Brackets in West Springfield Town
According to the West Springfield Town family income data, there are 1,635 families falling into the $100,000 to $149,999 income range, which is the most common income bracket and makes up 23.0% of all families. Conversely, the $10,000 to $14,999 income bracket is the least frequent group with only 142 families (2.0%) belonging to this category.
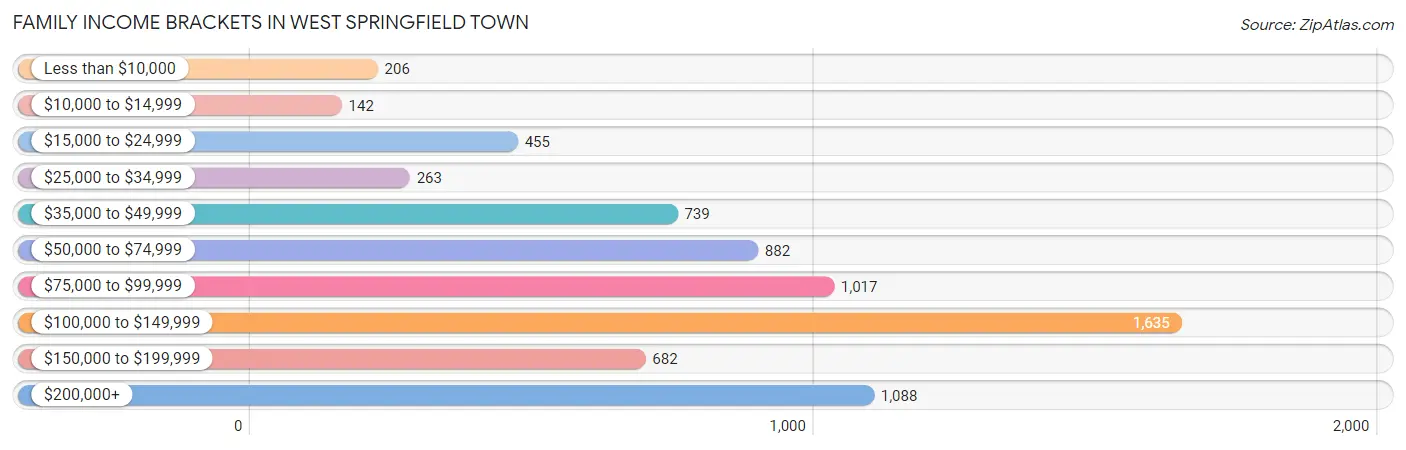
| Income Bracket | # Families | % Families |
| Less than $10,000 | 206 | 2.9% |
| $10,000 to $14,999 | 142 | 2.0% |
| $15,000 to $24,999 | 455 | 6.4% |
| $25,000 to $34,999 | 263 | 3.7% |
| $35,000 to $49,999 | 739 | 10.4% |
| $50,000 to $74,999 | 882 | 12.4% |
| $75,000 to $99,999 | 1,017 | 14.3% |
| $100,000 to $149,999 | 1,635 | 23.0% |
| $150,000 to $199,999 | 682 | 9.6% |
| $200,000+ | 1,088 | 15.3% |
Family Income by Famaliy Size in West Springfield Town
7+ person families (107 | 1.5%) account for the highest median family income in West Springfield Town with $250,001 per family, while 2-person families (3,342 | 47.0%) have the highest median income of $41,300 per family member.
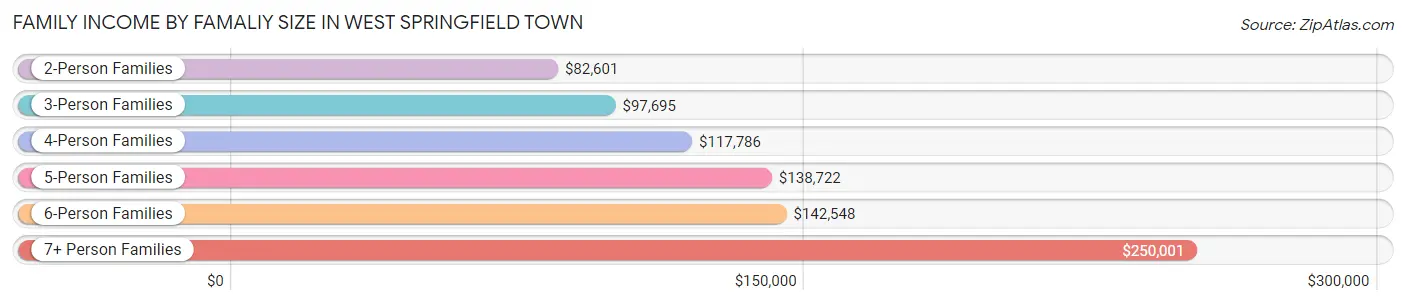
| Income Bracket | # Families | Median Income |
| 2-Person Families | 3,342 (47.0%) | $82,601 |
| 3-Person Families | 1,431 (20.1%) | $97,695 |
| 4-Person Families | 1,612 (22.7%) | $117,786 |
| 5-Person Families | 526 (7.4%) | $138,722 |
| 6-Person Families | 91 (1.3%) | $142,548 |
| 7+ Person Families | 107 (1.5%) | $250,001 |
| Total | 7,109 (100.0%) | $93,441 |
Family Income by Number of Earners in West Springfield Town
The median family income in West Springfield Town is $93,441, with families comprising 3+ earners (1,119) having the highest median family income of $169,279, while families with no earners (868) have the lowest median family income of $51,087, accounting for 15.7% and 12.2% of families, respectively.
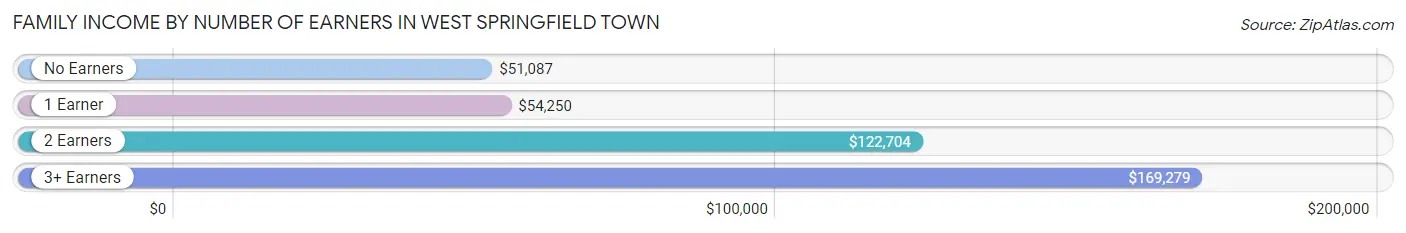
| Number of Earners | # Families | Median Income |
| No Earners | 868 (12.2%) | $51,087 |
| 1 Earner | 1,976 (27.8%) | $54,250 |
| 2 Earners | 3,146 (44.3%) | $122,704 |
| 3+ Earners | 1,119 (15.7%) | $169,279 |
| Total | 7,109 (100.0%) | $93,441 |
Household Income in West Springfield Town
Household Income Brackets in West Springfield Town
With 2,310 households falling in the category, the $100,000 to $149,999 income range is the most frequent in West Springfield Town, accounting for 18.2% of all households. In contrast, only 660 households (5.2%) fall into the less than $10,000 income bracket, making it the least populous group.
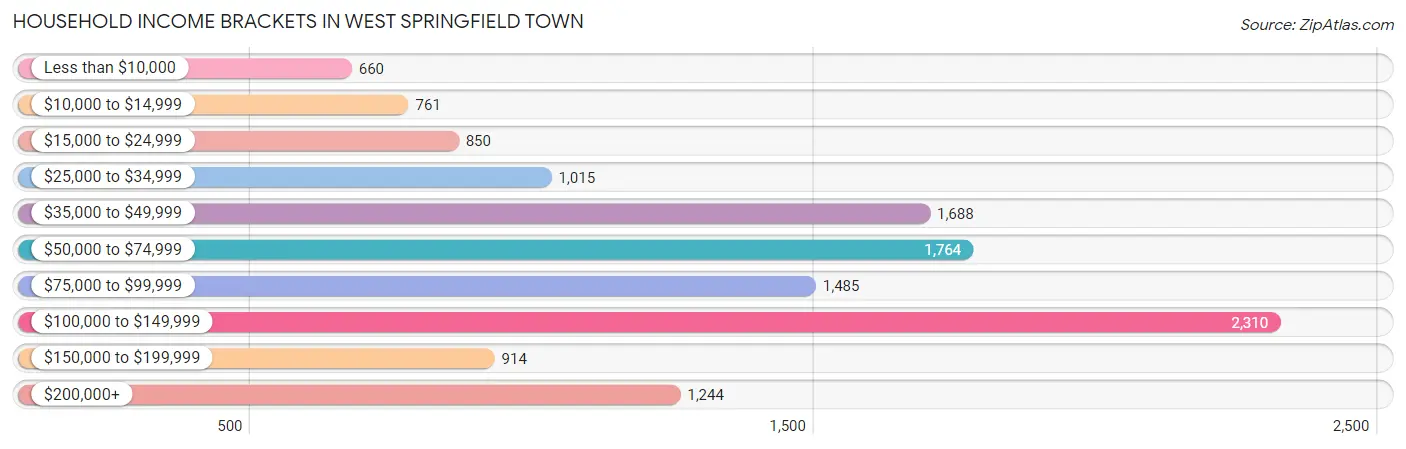
| Income Bracket | # Households | % Households |
| Less than $10,000 | 660 | 5.2% |
| $10,000 to $14,999 | 761 | 6.0% |
| $15,000 to $24,999 | 850 | 6.7% |
| $25,000 to $34,999 | 1,015 | 8.0% |
| $35,000 to $49,999 | 1,688 | 13.3% |
| $50,000 to $74,999 | 1,764 | 13.9% |
| $75,000 to $99,999 | 1,485 | 11.7% |
| $100,000 to $149,999 | 2,310 | 18.2% |
| $150,000 to $199,999 | 914 | 7.2% |
| $200,000+ | 1,244 | 9.8% |
Household Income by Householder Age in West Springfield Town
The median household income in West Springfield Town is $67,297, with the highest median household income of $83,697 found in the 45 to 64 years age bracket for the primary householder. A total of 4,790 households (37.7%) fall into this category. Meanwhile, the 15 to 24 years age bracket for the primary householder has the lowest median household income of $36,571, with 474 households (3.7%) in this group.
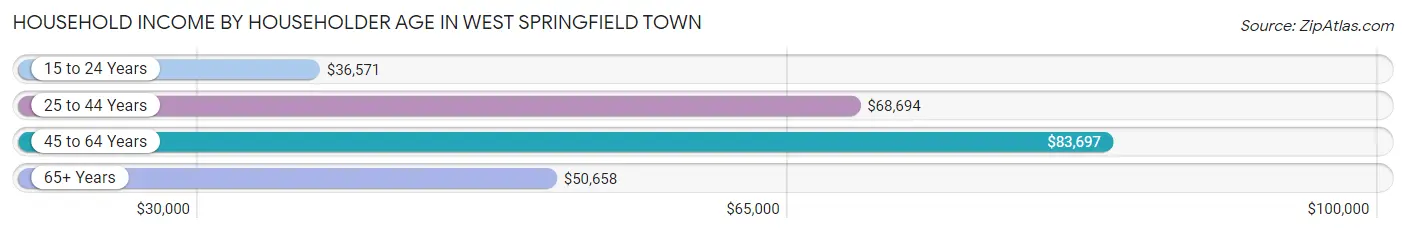
| Income Bracket | # Households | Median Income |
| 15 to 24 Years | 474 (3.7%) | $36,571 |
| 25 to 44 Years | 4,537 (35.7%) | $68,694 |
| 45 to 64 Years | 4,790 (37.7%) | $83,697 |
| 65+ Years | 2,890 (22.8%) | $50,658 |
| Total | 12,691 (100.0%) | $67,297 |
Poverty in West Springfield Town
Income Below Poverty by Sex and Age in West Springfield Town
With 9.9% poverty level for males and 11.2% for females among the residents of West Springfield Town, 15 year old males and 18 to 24 year old females are the most vulnerable to poverty, with 13 males (56.5%) and 329 females (25.2%) in their respective age groups living below the poverty level.
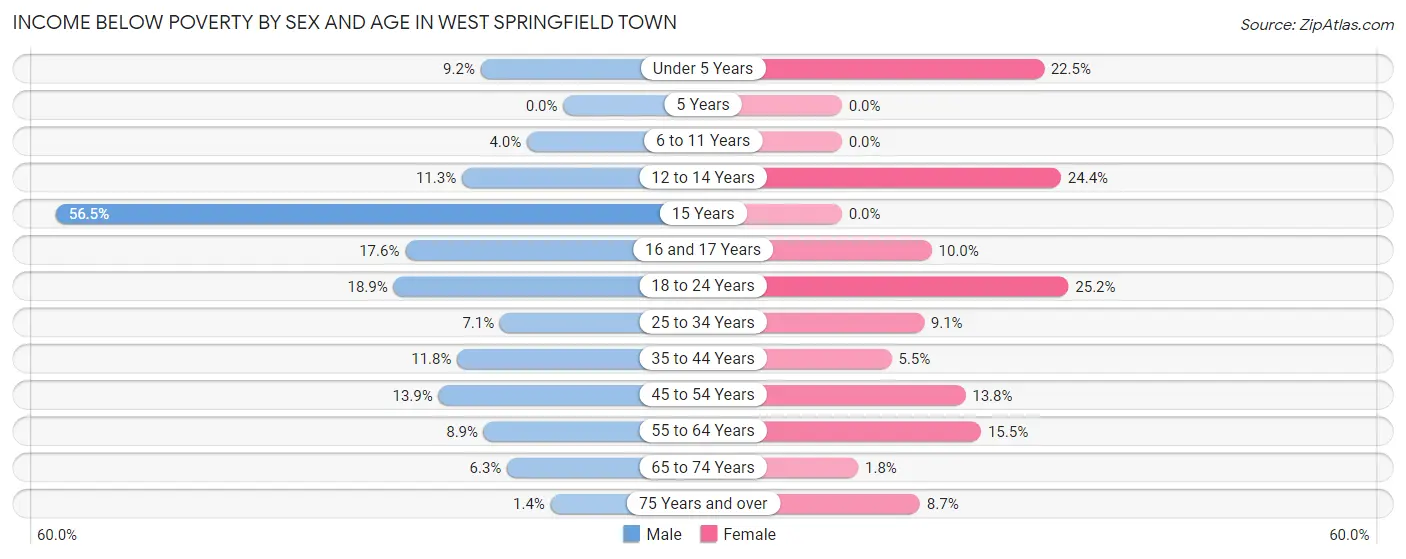
| Age Bracket | Male | Female |
| Under 5 Years | 67 (9.2%) | 179 (22.5%) |
| 5 Years | 0 (0.0%) | 0 (0.0%) |
| 6 to 11 Years | 31 (4.0%) | 0 (0.0%) |
| 12 to 14 Years | 62 (11.3%) | 91 (24.4%) |
| 15 Years | 13 (56.5%) | 0 (0.0%) |
| 16 and 17 Years | 25 (17.6%) | 37 (10.0%) |
| 18 to 24 Years | 258 (18.9%) | 329 (25.2%) |
| 25 to 34 Years | 175 (7.0%) | 213 (9.1%) |
| 35 to 44 Years | 248 (11.8%) | 92 (5.5%) |
| 45 to 54 Years | 244 (13.9%) | 271 (13.8%) |
| 55 to 64 Years | 160 (8.8%) | 316 (15.5%) |
| 65 to 74 Years | 81 (6.3%) | 25 (1.8%) |
| 75 Years and over | 9 (1.4%) | 96 (8.7%) |
| Total | 1,373 (9.9%) | 1,649 (11.2%) |
Income Above Poverty by Sex and Age in West Springfield Town
According to the poverty statistics in West Springfield Town, males aged 5 years and females aged 5 years are the age groups that are most secure financially, with 100.0% of males and 100.0% of females in these age groups living above the poverty line.
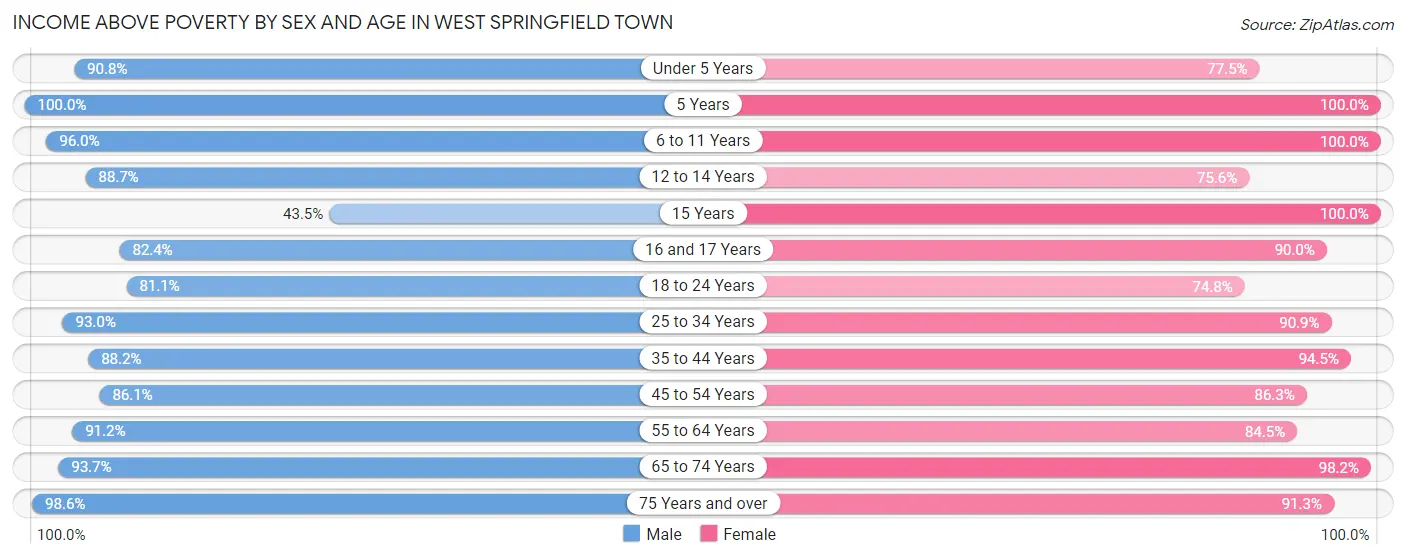
| Age Bracket | Male | Female |
| Under 5 Years | 661 (90.8%) | 617 (77.5%) |
| 5 Years | 250 (100.0%) | 106 (100.0%) |
| 6 to 11 Years | 737 (96.0%) | 1,103 (100.0%) |
| 12 to 14 Years | 487 (88.7%) | 282 (75.6%) |
| 15 Years | 10 (43.5%) | 239 (100.0%) |
| 16 and 17 Years | 117 (82.4%) | 333 (90.0%) |
| 18 to 24 Years | 1,106 (81.1%) | 975 (74.8%) |
| 25 to 34 Years | 2,306 (92.9%) | 2,118 (90.9%) |
| 35 to 44 Years | 1,852 (88.2%) | 1,568 (94.5%) |
| 45 to 54 Years | 1,511 (86.1%) | 1,700 (86.3%) |
| 55 to 64 Years | 1,647 (91.1%) | 1,723 (84.5%) |
| 65 to 74 Years | 1,212 (93.7%) | 1,347 (98.2%) |
| 75 Years and over | 629 (98.6%) | 1,007 (91.3%) |
| Total | 12,525 (90.1%) | 13,118 (88.8%) |
Income Below Poverty Among Married-Couple Families in West Springfield Town
The poverty statistics for married-couple families in West Springfield Town show that 1.6% or 87 of the total 5,370 families live below the poverty line. Families with 3 or 4 children have the highest poverty rate of 4.1%, comprising of 9 families. On the other hand, families with 5 or more children have the lowest poverty rate of 0.0%, which includes 0 families.
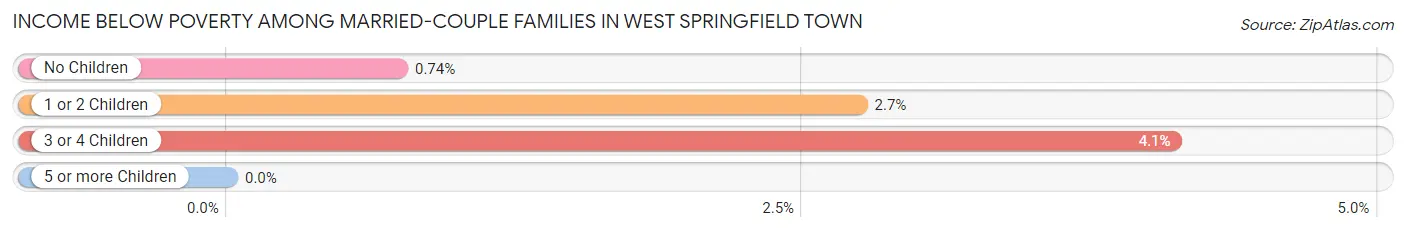
| Children | Above Poverty | Below Poverty |
| No Children | 3,065 (99.3%) | 23 (0.7%) |
| 1 or 2 Children | 1,951 (97.3%) | 55 (2.7%) |
| 3 or 4 Children | 210 (95.9%) | 9 (4.1%) |
| 5 or more Children | 57 (100.0%) | 0 (0.0%) |
| Total | 5,283 (98.4%) | 87 (1.6%) |
Income Below Poverty Among Single-Parent Households in West Springfield Town
According to the poverty data in West Springfield Town, 33.5% or 205 single-father households and 20.1% or 226 single-mother households are living below the poverty line. Among single-father households, those with 1 or 2 children have the highest poverty rate, with 182 households (71.1%) experiencing poverty. Likewise, among single-mother households, those with 3 or 4 children have the highest poverty rate, with 24 households (70.6%) falling below the poverty line.
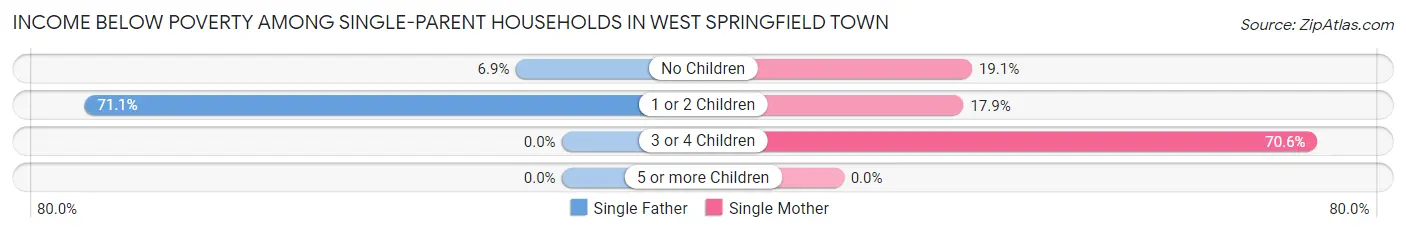
| Children | Single Father | Single Mother |
| No Children | 23 (6.9%) | 104 (19.1%) |
| 1 or 2 Children | 182 (71.1%) | 98 (17.8%) |
| 3 or 4 Children | 0 (0.0%) | 24 (70.6%) |
| 5 or more Children | 0 (0.0%) | 0 (0.0%) |
| Total | 205 (33.5%) | 226 (20.1%) |
Income Below Poverty Among Married-Couple vs Single-Parent Households in West Springfield Town
The poverty data for West Springfield Town shows that 87 of the married-couple family households (1.6%) and 431 of the single-parent households (24.8%) are living below the poverty level. Within the married-couple family households, those with 3 or 4 children have the highest poverty rate, with 9 households (4.1%) falling below the poverty line. Among the single-parent households, those with 3 or 4 children have the highest poverty rate, with 24 household (42.9%) living below poverty.
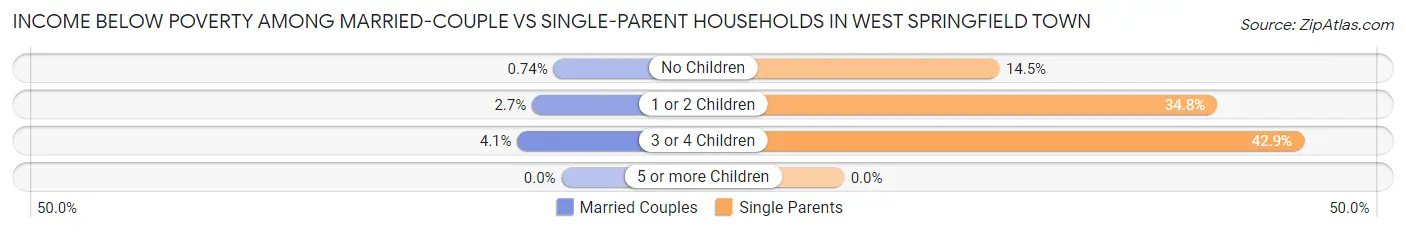
| Children | Married-Couple Families | Single-Parent Households |
| No Children | 23 (0.7%) | 127 (14.5%) |
| 1 or 2 Children | 55 (2.7%) | 280 (34.8%) |
| 3 or 4 Children | 9 (4.1%) | 24 (42.9%) |
| 5 or more Children | 0 (0.0%) | 0 (0.0%) |
| Total | 87 (1.6%) | 431 (24.8%) |
Race in West Springfield Town
The most populous races in West Springfield Town are White / Caucasian (23,198 | 80.7%), Hispanic or Latino (3,419 | 11.9%), and Two or more Races (1,982 | 6.9%).
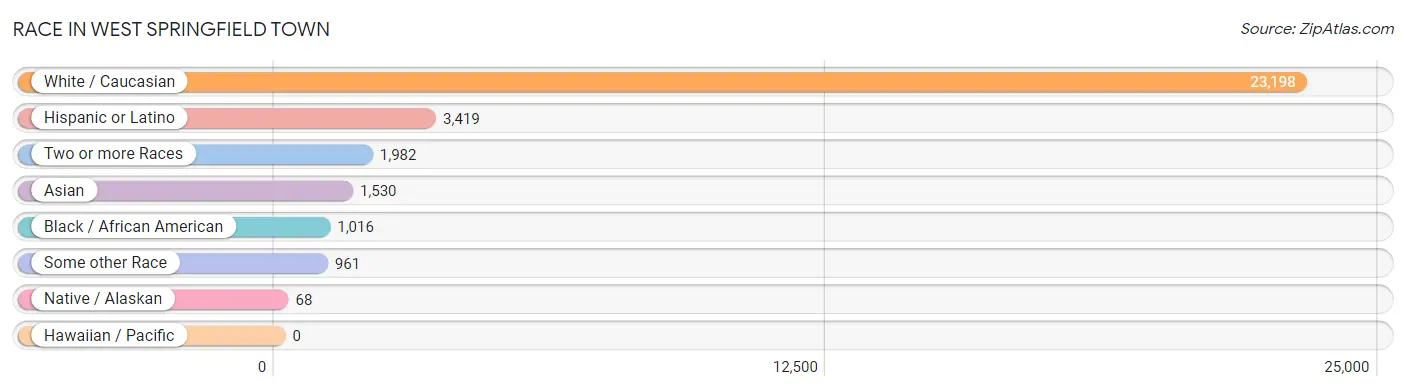
| Race | # Population | % Population |
| Asian | 1,530 | 5.3% |
| Black / African American | 1,016 | 3.5% |
| Hawaiian / Pacific | 0 | 0.0% |
| Hispanic or Latino | 3,419 | 11.9% |
| Native / Alaskan | 68 | 0.2% |
| White / Caucasian | 23,198 | 80.7% |
| Two or more Races | 1,982 | 6.9% |
| Some other Race | 961 | 3.3% |
| Total | 28,755 | 100.0% |
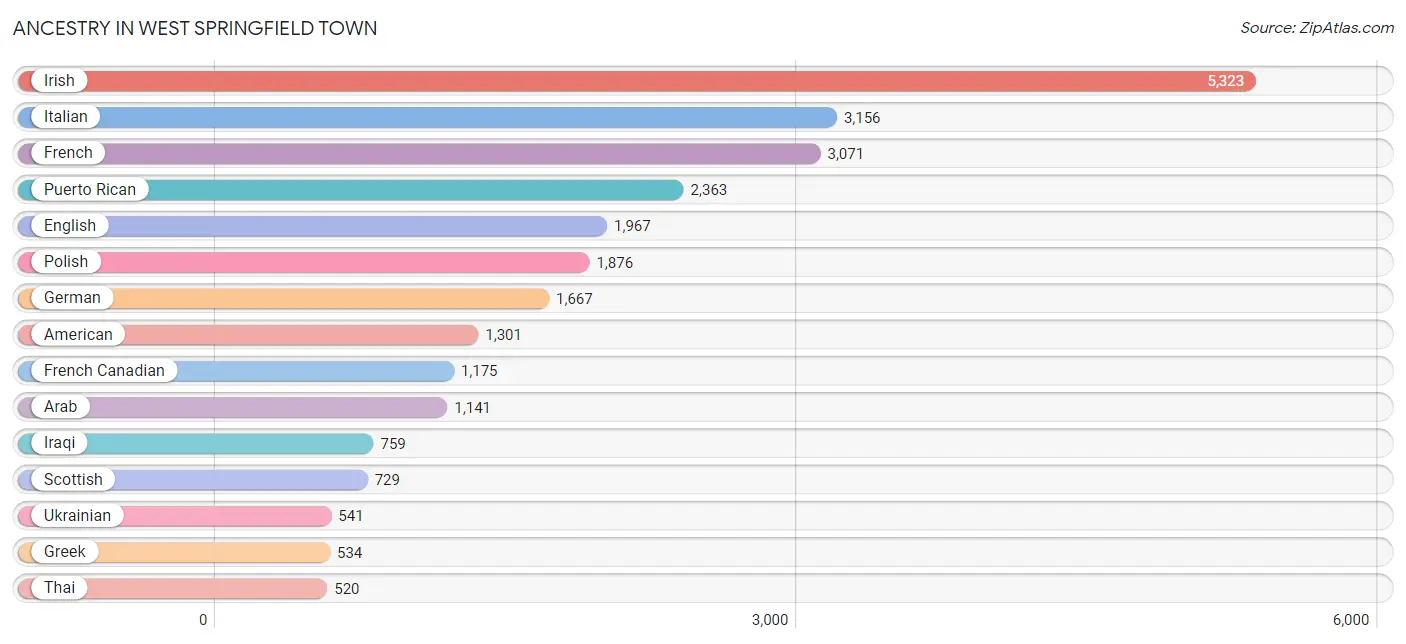
Ancestry in West Springfield Town
The most populous ancestries reported in West Springfield Town are Irish (5,323 | 18.5%), Italian (3,156 | 11.0%), French (3,071 | 10.7%), Puerto Rican (2,363 | 8.2%), and English (1,967 | 6.8%), together accounting for 55.2% of all West Springfield Town residents.
| Ancestry | # Population | % Population |
| African | 59 | 0.2% |
| Albanian | 39 | 0.1% |
| American | 1,301 | 4.5% |
| Arab | 1,141 | 4.0% |
| Armenian | 51 | 0.2% |
| Austrian | 166 | 0.6% |
| Barbadian | 29 | 0.1% |
| Blackfeet | 24 | 0.1% |
| Brazilian | 22 | 0.1% |
| British | 34 | 0.1% |
| Bulgarian | 42 | 0.2% |
| Burmese | 30 | 0.1% |
| Canadian | 166 | 0.6% |
| Central American | 174 | 0.6% |
| Cherokee | 37 | 0.1% |
| Chilean | 33 | 0.1% |
| Chippewa | 2 | 0.0% |
| Colombian | 56 | 0.2% |
| Croatian | 15 | 0.1% |
| Cuban | 72 | 0.3% |
| Czech | 67 | 0.2% |
| Czechoslovakian | 28 | 0.1% |
| Dominican | 244 | 0.9% |
| Dutch | 68 | 0.2% |
| Eastern European | 123 | 0.4% |
| Ecuadorian | 91 | 0.3% |
| English | 1,967 | 6.8% |
| European | 158 | 0.5% |
| Finnish | 32 | 0.1% |
| French | 3,071 | 10.7% |
| French American Indian | 20 | 0.1% |
| French Canadian | 1,175 | 4.1% |
| German | 1,667 | 5.8% |
| Ghanaian | 72 | 0.3% |
| Greek | 534 | 1.9% |
| Haitian | 4 | 0.0% |
| Hungarian | 83 | 0.3% |
| Indian (Asian) | 314 | 1.1% |
| Indonesian | 46 | 0.2% |
| Iranian | 12 | 0.0% |
| Iraqi | 759 | 2.6% |
| Irish | 5,323 | 18.5% |
| Iroquois | 19 | 0.1% |
| Italian | 3,156 | 11.0% |
| Jamaican | 23 | 0.1% |
| Korean | 153 | 0.5% |
| Latvian | 35 | 0.1% |
| Lebanese | 183 | 0.6% |
| Lithuanian | 76 | 0.3% |
| Mexican | 31 | 0.1% |
| Native Hawaiian | 228 | 0.8% |
| Navajo | 18 | 0.1% |
| Nicaraguan | 28 | 0.1% |
| Nigerian | 19 | 0.1% |
| Norwegian | 135 | 0.5% |
| Okinawan | 22 | 0.1% |
| Palestinian | 125 | 0.4% |
| Panamanian | 67 | 0.2% |
| Peruvian | 16 | 0.1% |
| Polish | 1,876 | 6.5% |
| Portuguese | 316 | 1.1% |
| Puerto Rican | 2,363 | 8.2% |
| Romanian | 377 | 1.3% |
| Russian | 204 | 0.7% |
| Salvadoran | 79 | 0.3% |
| Scandinavian | 13 | 0.1% |
| Scotch-Irish | 137 | 0.5% |
| Scottish | 729 | 2.5% |
| Slovak | 21 | 0.1% |
| Slovene | 15 | 0.1% |
| Somali | 80 | 0.3% |
| South American | 197 | 0.7% |
| Spanish | 253 | 0.9% |
| Sri Lankan | 81 | 0.3% |
| Subsaharan African | 245 | 0.9% |
| Swedish | 226 | 0.8% |
| Swiss | 14 | 0.1% |
| Thai | 520 | 1.8% |
| Turkish | 446 | 1.5% |
| Ukrainian | 541 | 1.9% |
| Uruguayan | 1 | 0.0% |
| Vietnamese | 74 | 0.3% |
| Welsh | 174 | 0.6% |
| West Indian | 29 | 0.1% | View All 84 Rows |
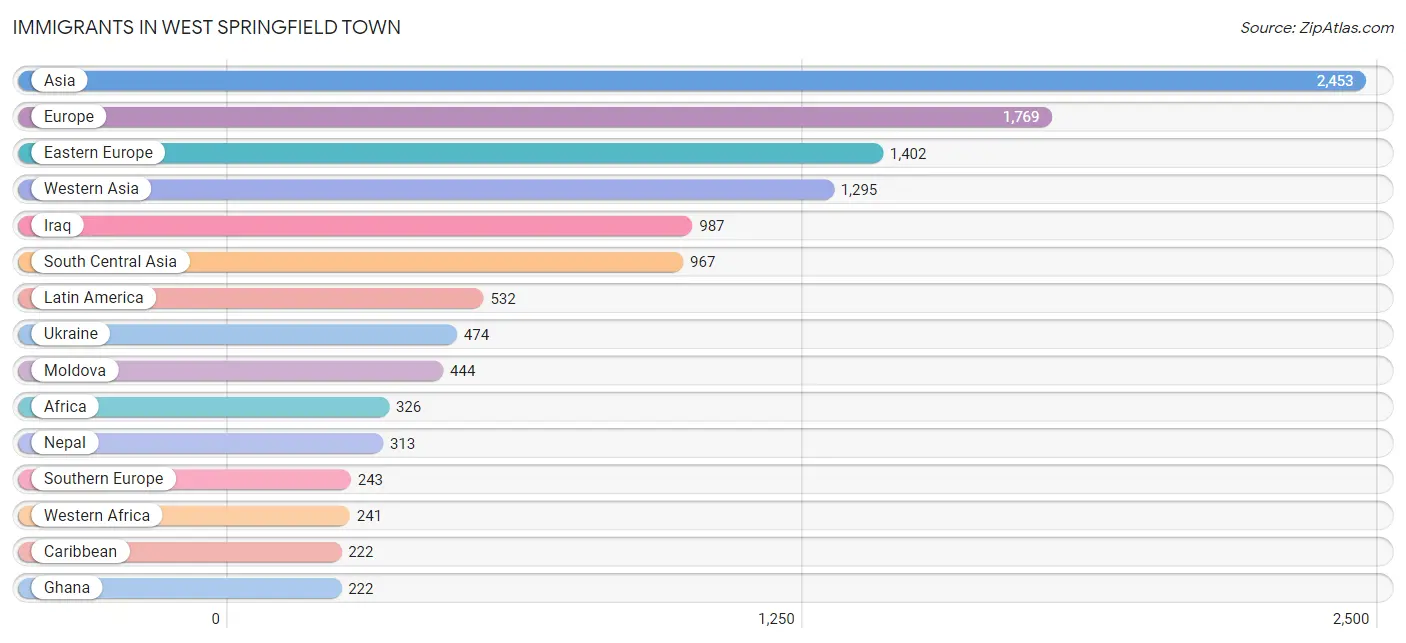
Immigrants in West Springfield Town
The most numerous immigrant groups reported in West Springfield Town came from Asia (2,453 | 8.5%), Europe (1,769 | 6.1%), Eastern Europe (1,402 | 4.9%), Western Asia (1,295 | 4.5%), and Iraq (987 | 3.4%), together accounting for 27.5% of all West Springfield Town residents.
| Immigration Origin | # Population | % Population |
| Africa | 326 | 1.1% |
| Asia | 2,453 | 8.5% |
| Bangladesh | 33 | 0.1% |
| Belarus | 129 | 0.4% |
| Brazil | 22 | 0.1% |
| Bulgaria | 42 | 0.2% |
| Canada | 99 | 0.3% |
| Caribbean | 222 | 0.8% |
| Central America | 98 | 0.3% |
| China | 32 | 0.1% |
| Colombia | 48 | 0.2% |
| Cuba | 3 | 0.0% |
| Dominican Republic | 170 | 0.6% |
| Eastern Africa | 82 | 0.3% |
| Eastern Asia | 49 | 0.2% |
| Eastern Europe | 1,402 | 4.9% |
| Ecuador | 91 | 0.3% |
| El Salvador | 70 | 0.2% |
| England | 29 | 0.1% |
| Europe | 1,769 | 6.1% |
| Germany | 73 | 0.3% |
| Ghana | 222 | 0.8% |
| Greece | 86 | 0.3% |
| India | 193 | 0.7% |
| Iran | 12 | 0.0% |
| Iraq | 987 | 3.4% |
| Ireland | 22 | 0.1% |
| Italy | 157 | 0.5% |
| Kazakhstan | 74 | 0.3% |
| Korea | 17 | 0.1% |
| Latin America | 532 | 1.8% |
| Latvia | 52 | 0.2% |
| Lebanon | 93 | 0.3% |
| Moldova | 444 | 1.5% |
| Nepal | 313 | 1.1% |
| Nicaragua | 28 | 0.1% |
| Nigeria | 19 | 0.1% |
| Northern Europe | 51 | 0.2% |
| Pakistan | 132 | 0.5% |
| Peru | 50 | 0.2% |
| Philippines | 117 | 0.4% |
| Poland | 107 | 0.4% |
| Russia | 87 | 0.3% |
| Saudi Arabia | 9 | 0.0% |
| Somalia | 67 | 0.2% |
| South America | 212 | 0.7% |
| South Central Asia | 967 | 3.4% |
| South Eastern Asia | 142 | 0.5% |
| Southern Europe | 243 | 0.9% |
| Syria | 89 | 0.3% |
| Trinidad and Tobago | 7 | 0.0% |
| Uganda | 15 | 0.1% |
| Ukraine | 474 | 1.7% |
| Uruguay | 1 | 0.0% |
| Uzbekistan | 30 | 0.1% |
| Vietnam | 5 | 0.0% |
| Western Africa | 241 | 0.8% |
| Western Asia | 1,295 | 4.5% |
| Western Europe | 73 | 0.3% |
| Yemen | 45 | 0.2% | View All 60 Rows |
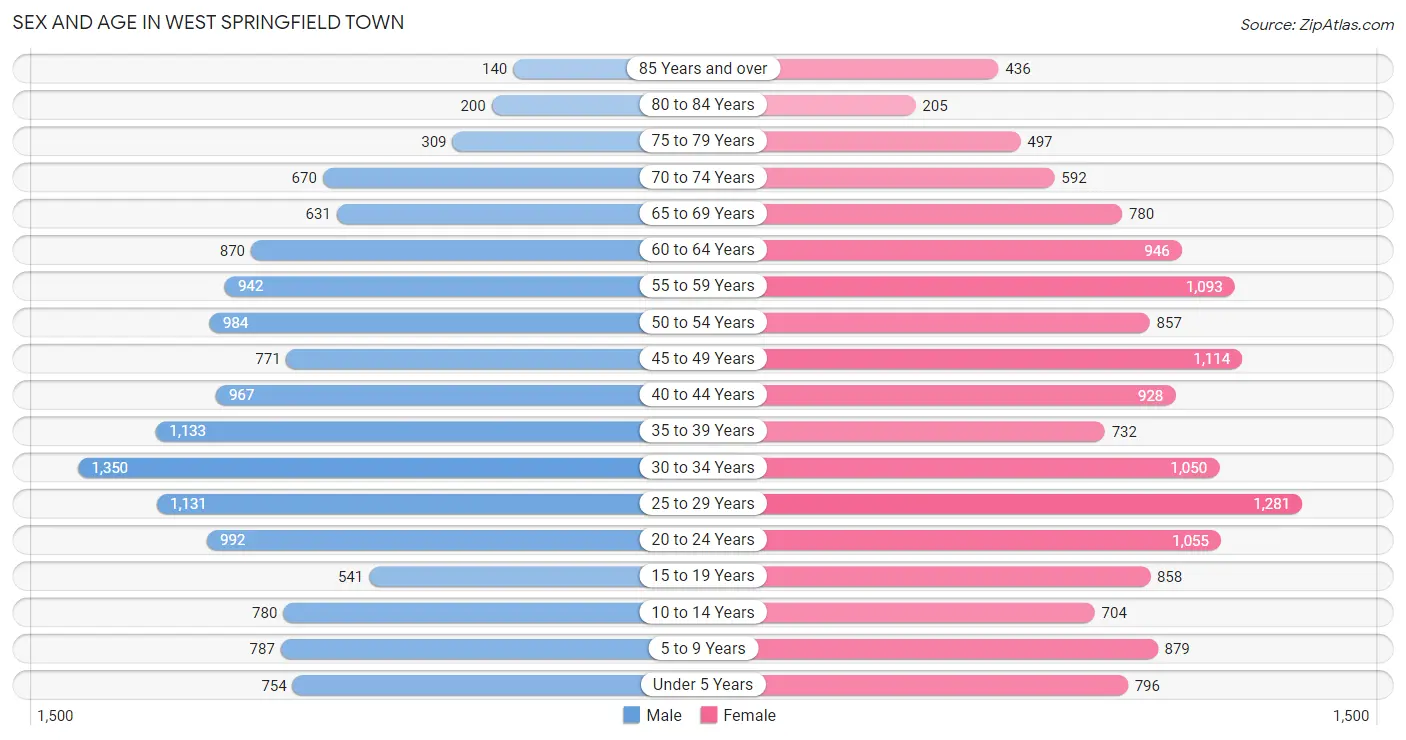
Sex and Age in West Springfield Town
Sex and Age in West Springfield Town
The most populous age groups in West Springfield Town are 30 to 34 Years (1,350 | 9.7%) for men and 25 to 29 Years (1,281 | 8.6%) for women.
| Age Bracket | Male | Female |
| Under 5 Years | 754 (5.4%) | 796 (5.4%) |
| 5 to 9 Years | 787 (5.6%) | 879 (5.9%) |
| 10 to 14 Years | 780 (5.6%) | 704 (4.8%) |
| 15 to 19 Years | 541 (3.9%) | 858 (5.8%) |
| 20 to 24 Years | 992 (7.1%) | 1,055 (7.1%) |
| 25 to 29 Years | 1,131 (8.1%) | 1,281 (8.6%) |
| 30 to 34 Years | 1,350 (9.7%) | 1,050 (7.1%) |
| 35 to 39 Years | 1,133 (8.1%) | 732 (4.9%) |
| 40 to 44 Years | 967 (6.9%) | 928 (6.3%) |
| 45 to 49 Years | 771 (5.5%) | 1,114 (7.5%) |
| 50 to 54 Years | 984 (7.0%) | 857 (5.8%) |
| 55 to 59 Years | 942 (6.8%) | 1,093 (7.4%) |
| 60 to 64 Years | 870 (6.2%) | 946 (6.4%) |
| 65 to 69 Years | 631 (4.5%) | 780 (5.3%) |
| 70 to 74 Years | 670 (4.8%) | 592 (4.0%) |
| 75 to 79 Years | 309 (2.2%) | 497 (3.4%) |
| 80 to 84 Years | 200 (1.4%) | 205 (1.4%) |
| 85 Years and over | 140 (1.0%) | 436 (2.9%) |
| Total | 13,952 (100.0%) | 14,803 (100.0%) |
Families and Households in West Springfield Town
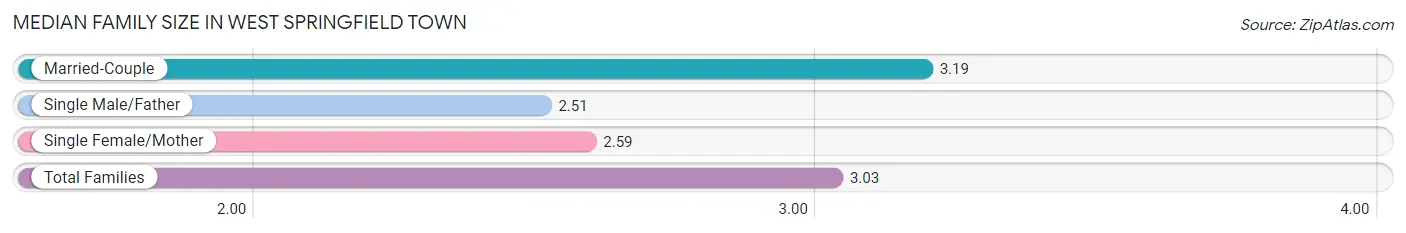
Median Family Size in West Springfield Town
The median family size in West Springfield Town is 3.03 persons per family, with married-couple families (5,370 | 75.5%) accounting for the largest median family size of 3.19 persons per family. On the other hand, single male/father families (612 | 8.6%) represent the smallest median family size with 2.51 persons per family.
| Family Type | # Families | Family Size |
| Married-Couple | 5,370 (75.5%) | 3.19 |
| Single Male/Father | 612 (8.6%) | 2.51 |
| Single Female/Mother | 1,127 (15.9%) | 2.59 |
| Total Families | 7,109 (100.0%) | 3.03 |
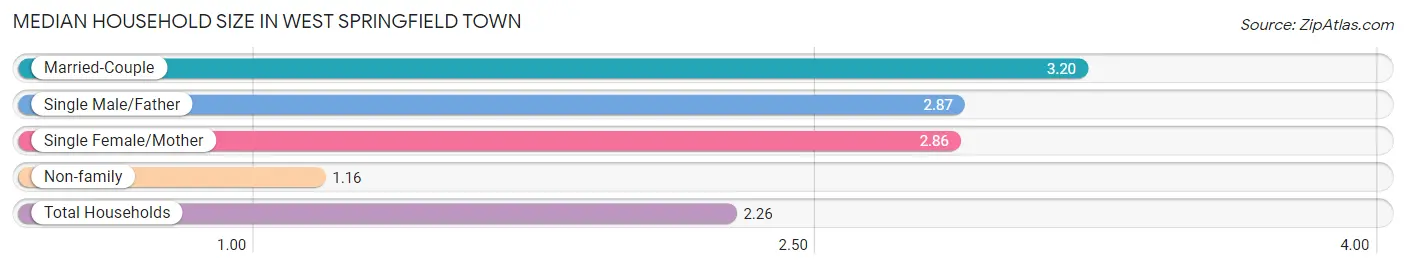
Median Household Size in West Springfield Town
The median household size in West Springfield Town is 2.26 persons per household, with married-couple households (5,370 | 42.3%) accounting for the largest median household size of 3.2 persons per household. non-family households (5,582 | 44.0%) represent the smallest median household size with 1.16 persons per household.
| Household Type | # Households | Household Size |
| Married-Couple | 5,370 (42.3%) | 3.20 |
| Single Male/Father | 612 (4.8%) | 2.87 |
| Single Female/Mother | 1,127 (8.9%) | 2.86 |
| Non-family | 5,582 (44.0%) | 1.16 |
| Total Households | 12,691 (100.0%) | 2.26 |
Household Size by Marriage Status in West Springfield Town
Out of a total of 12,691 households in West Springfield Town, 7,109 (56.0%) are family households, while 5,582 (44.0%) are nonfamily households. The most numerous type of family households are 2-person households, comprising 3,059, and the most common type of nonfamily households are 1-person households, comprising 4,806.
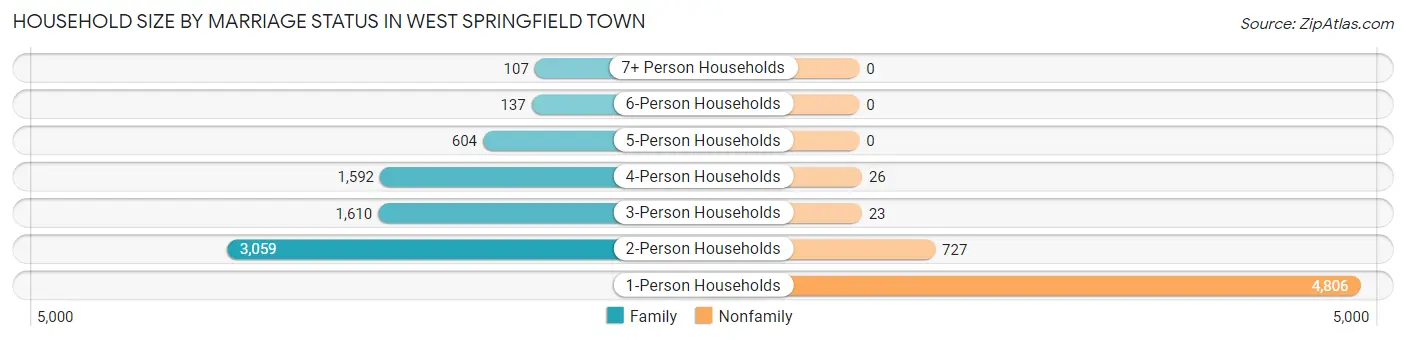
| Household Size | Family Households | Nonfamily Households |
| 1-Person Households | - | 4,806 (37.9%) |
| 2-Person Households | 3,059 (24.1%) | 727 (5.7%) |
| 3-Person Households | 1,610 (12.7%) | 23 (0.2%) |
| 4-Person Households | 1,592 (12.5%) | 26 (0.2%) |
| 5-Person Households | 604 (4.8%) | 0 (0.0%) |
| 6-Person Households | 137 (1.1%) | 0 (0.0%) |
| 7+ Person Households | 107 (0.8%) | 0 (0.0%) |
| Total | 7,109 (56.0%) | 5,582 (44.0%) |
Female Fertility in West Springfield Town
Fertility by Age in West Springfield Town
Average fertility rate in West Springfield Town is 55.0 births per 1,000 women. Women in the age bracket of 20 to 34 years have the highest fertility rate with 106.0 births per 1,000 women. Women in the age bracket of 20 to 34 years acount for 90.2% of all women with births.
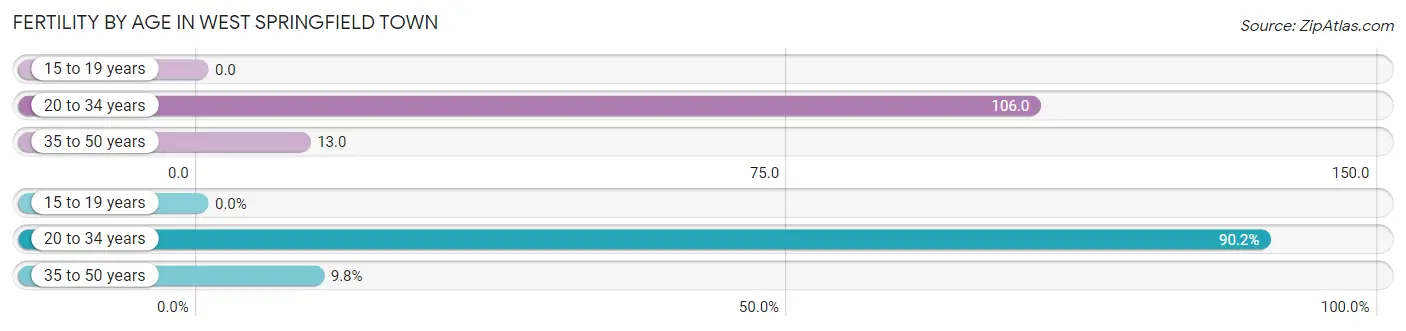
| Age Bracket | Women with Births | Births / 1,000 Women |
| 15 to 19 years | 0 (0.0%) | 0.0 |
| 20 to 34 years | 358 (90.2%) | 106.0 |
| 35 to 50 years | 39 (9.8%) | 13.0 |
| Total | 397 (100.0%) | 55.0 |
Fertility by Age by Marriage Status in West Springfield Town
82.1% of women with births (397) in West Springfield Town are married. The highest percentage of unmarried women with births falls into 35 to 50 years age bracket with 38.5% of them unmarried at the time of birth, while the lowest percentage of unmarried women with births belong to 20 to 34 years age bracket with 15.6% of them unmarried.
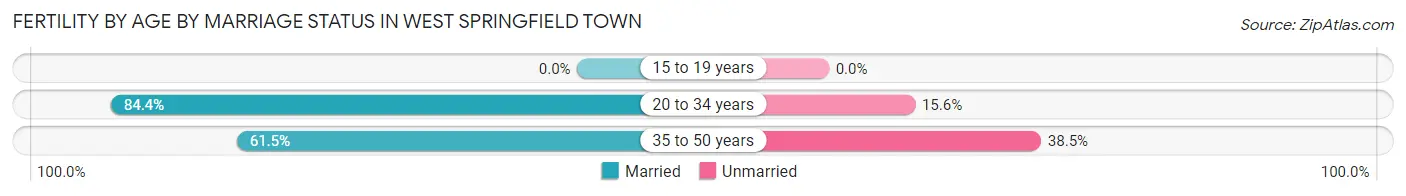
| Age Bracket | Married | Unmarried |
| 15 to 19 years | 0 (0.0%) | 0 (0.0%) |
| 20 to 34 years | 302 (84.4%) | 56 (15.6%) |
| 35 to 50 years | 24 (61.5%) | 15 (38.5%) |
| Total | 326 (82.1%) | 71 (17.9%) |
Fertility by Education in West Springfield Town
Average fertility rate in West Springfield Town is 55.0 births per 1,000 women. Women with the education attainment of graduate degree have the highest fertility rate of 135.0 births per 1,000 women, while women with the education attainment of high school diploma have the lowest fertility at 9.0 births per 1,000 women. Women with the education attainment of graduate degree represent 40.6% of all women with births.
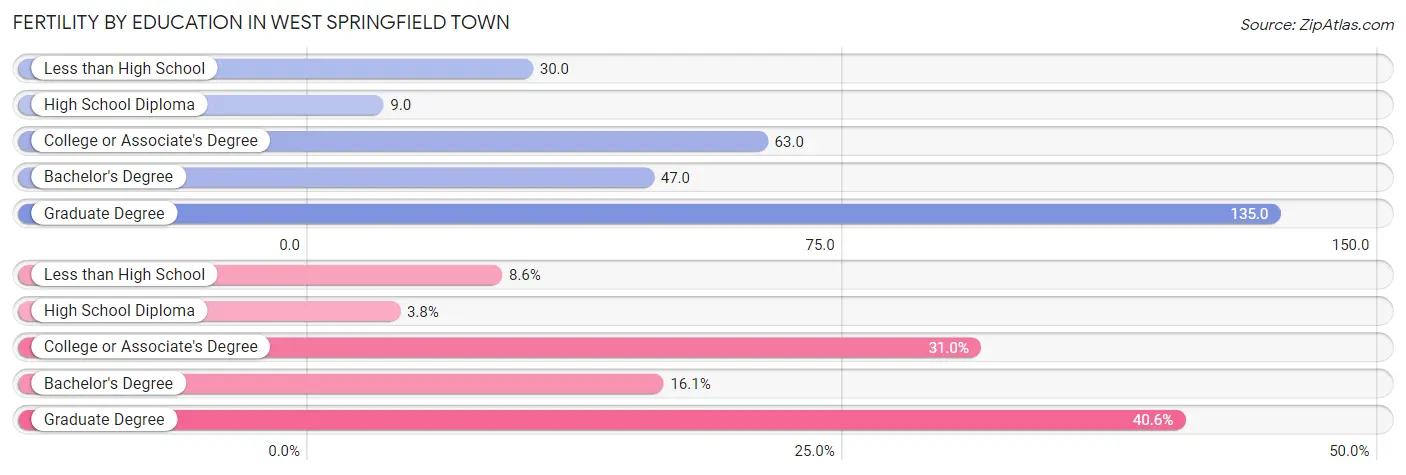
| Educational Attainment | Women with Births | Births / 1,000 Women |
| Less than High School | 34 (8.6%) | 30.0 |
| High School Diploma | 15 (3.8%) | 9.0 |
| College or Associate's Degree | 123 (31.0%) | 63.0 |
| Bachelor's Degree | 64 (16.1%) | 47.0 |
| Graduate Degree | 161 (40.6%) | 135.0 |
| Total | 397 (100.0%) | 55.0 |
Fertility by Education by Marriage Status in West Springfield Town
17.9% of women with births in West Springfield Town are unmarried. Women with the educational attainment of bachelor's degree are most likely to be married with 100.0% of them married at childbirth, while women with the educational attainment of high school diploma are least likely to be married with 100.0% of them unmarried at childbirth.
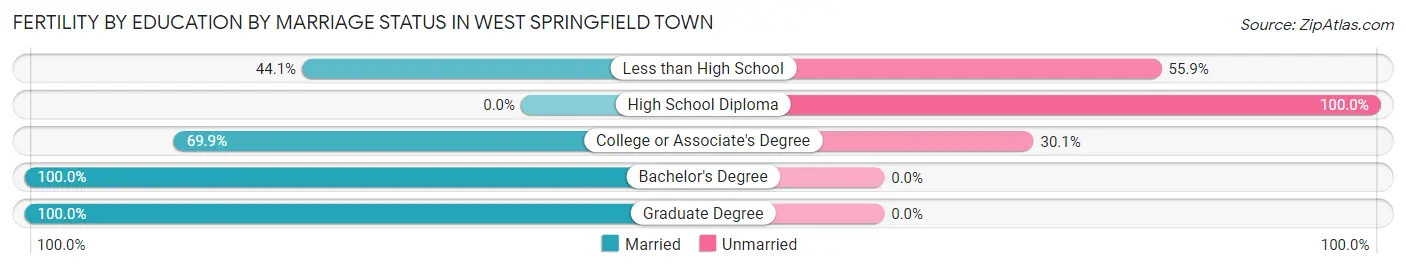
| Educational Attainment | Married | Unmarried |
| Less than High School | 15 (44.1%) | 19 (55.9%) |
| High School Diploma | 0 (0.0%) | 15 (100.0%) |
| College or Associate's Degree | 86 (69.9%) | 37 (30.1%) |
| Bachelor's Degree | 64 (100.0%) | 0 (0.0%) |
| Graduate Degree | 161 (100.0%) | 0 (0.0%) |
| Total | 326 (82.1%) | 71 (17.9%) |
Employment Characteristics in West Springfield Town
Employment by Class of Employer in West Springfield Town
Among the 14,941 employed individuals in West Springfield Town, private company employees (9,436 | 63.2%), not-for-profit organizations (1,810 | 12.1%), and local government employees (1,415 | 9.5%) make up the most common classes of employment.
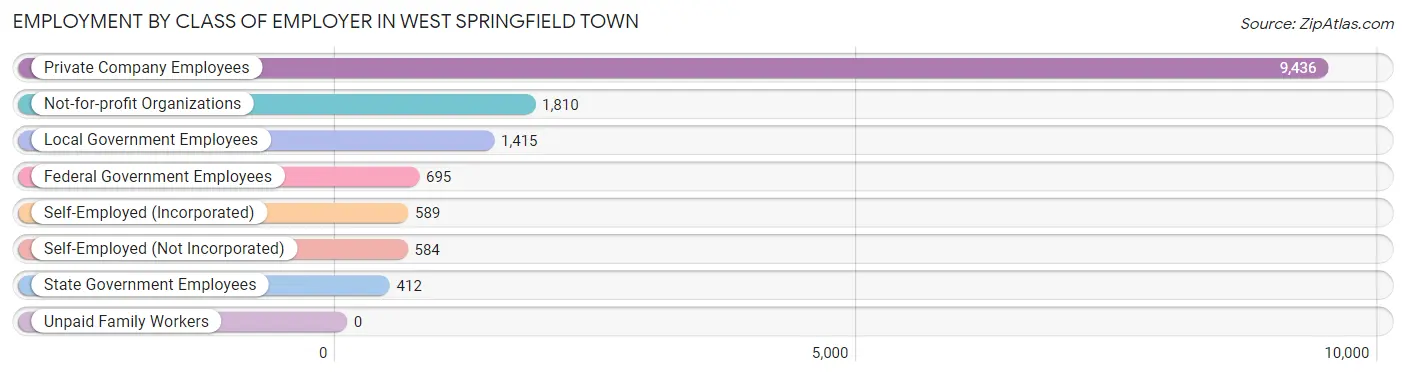
| Employer Class | # Employees | % Employees |
| Private Company Employees | 9,436 | 63.2% |
| Self-Employed (Incorporated) | 589 | 3.9% |
| Self-Employed (Not Incorporated) | 584 | 3.9% |
| Not-for-profit Organizations | 1,810 | 12.1% |
| Local Government Employees | 1,415 | 9.5% |
| State Government Employees | 412 | 2.8% |
| Federal Government Employees | 695 | 4.6% |
| Unpaid Family Workers | 0 | 0.0% |
| Total | 14,941 | 100.0% |
Employment Status by Age in West Springfield Town
According to the labor force statistics for West Springfield Town, out of the total population over 16 years of age (23,791), 67.6% or 16,083 individuals are in the labor force, with 5.8% or 933 of them unemployed. The age group with the highest labor force participation rate is 20 to 24 years, with 92.0% or 1,883 individuals in the labor force. Within the labor force, the 20 to 24 years age range has the highest percentage of unemployed individuals, with 20.1% or 378 of them being unemployed.
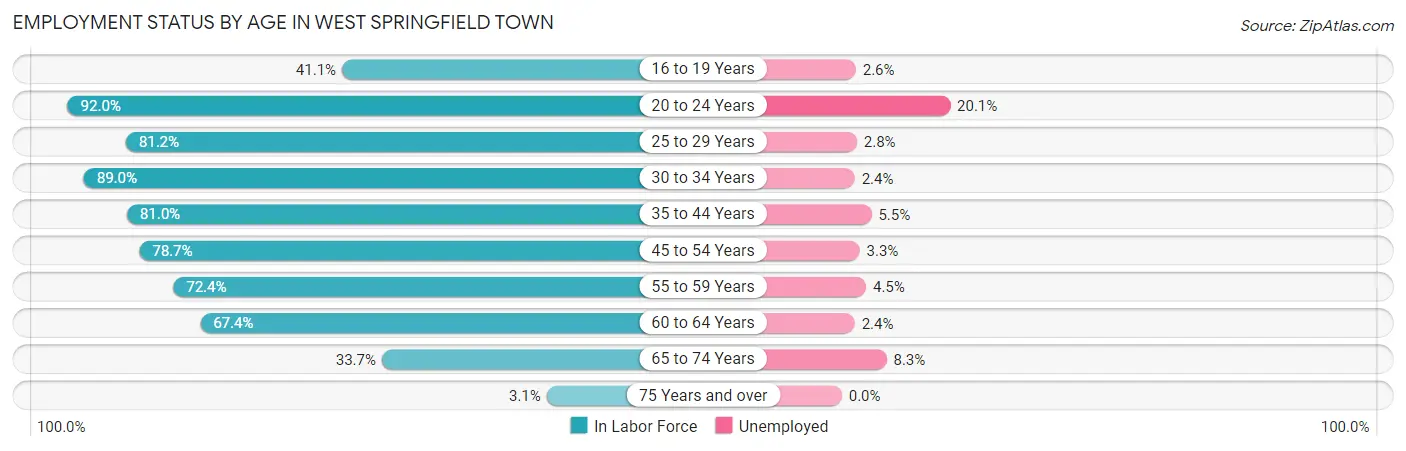
| Age Bracket | In Labor Force | Unemployed |
| 16 to 19 Years | 466 (41.1%) | 12 (2.6%) |
| 20 to 24 Years | 1,883 (92.0%) | 378 (20.1%) |
| 25 to 29 Years | 1,959 (81.2%) | 55 (2.8%) |
| 30 to 34 Years | 2,136 (89.0%) | 51 (2.4%) |
| 35 to 44 Years | 3,046 (81.0%) | 168 (5.5%) |
| 45 to 54 Years | 2,932 (78.7%) | 97 (3.3%) |
| 55 to 59 Years | 1,473 (72.4%) | 66 (4.5%) |
| 60 to 64 Years | 1,224 (67.4%) | 29 (2.4%) |
| 65 to 74 Years | 901 (33.7%) | 75 (8.3%) |
| 75 Years and over | 55 (3.1%) | 0 (0.0%) |
| Total | 16,083 (67.6%) | 933 (5.8%) |
Employment Status by Educational Attainment in West Springfield Town
According to labor force statistics for West Springfield Town, 79.1% of individuals (12,774) out of the total population between 25 and 64 years of age (16,149) are in the labor force, with 3.7% or 473 of them being unemployed. The group with the highest labor force participation rate are those with the educational attainment of bachelor's degree or higher, with 88.9% or 5,343 individuals in the labor force. Within the labor force, individuals with less than high school education have the highest percentage of unemployment, with 11.0% or 93 of them being unemployed.
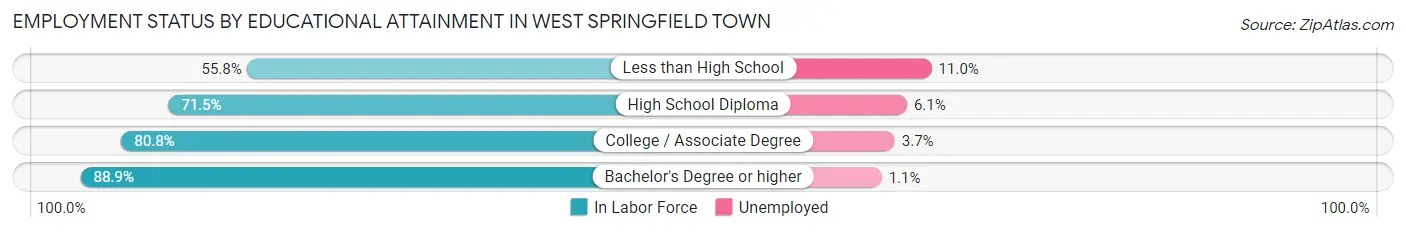
| Educational Attainment | In Labor Force | Unemployed |
| Less than High School | 844 (55.8%) | 166 (11.0%) |
| High School Diploma | 3,014 (71.5%) | 257 (6.1%) |
| College / Associate Degree | 3,564 (80.8%) | 163 (3.7%) |
| Bachelor's Degree or higher | 5,343 (88.9%) | 66 (1.1%) |
| Total | 12,774 (79.1%) | 598 (3.7%) |
Employment Occupations by Sex in West Springfield Town
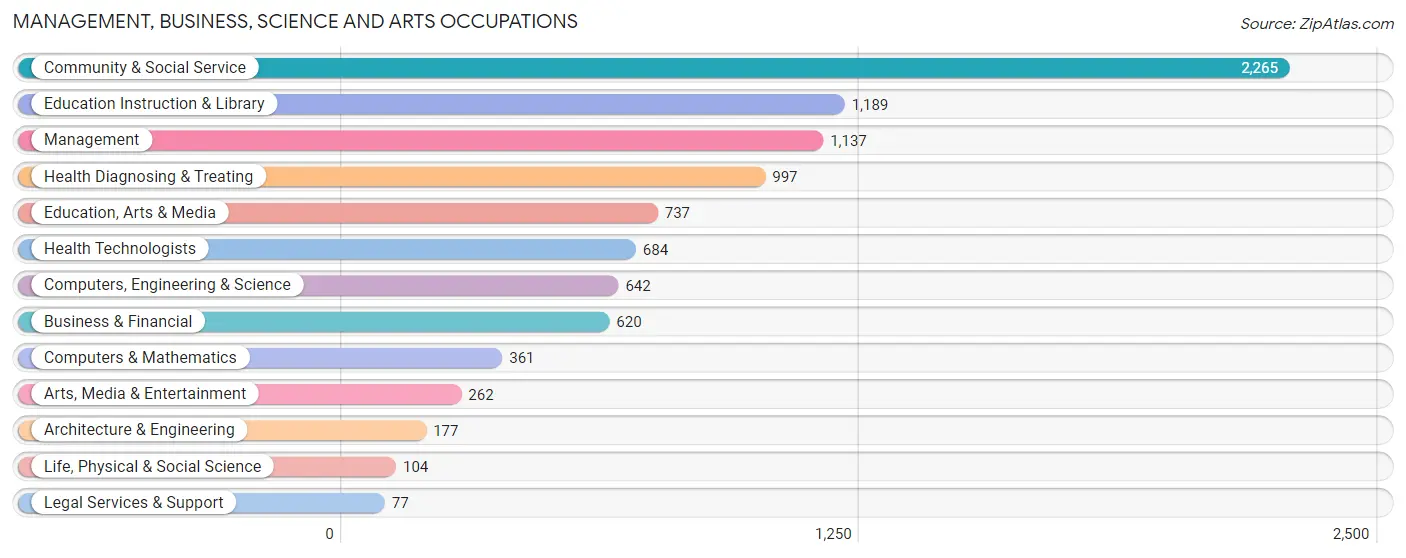
Management, Business, Science and Arts Occupations
The most common Management, Business, Science and Arts occupations in West Springfield Town are Community & Social Service (2,265 | 15.0%), Education Instruction & Library (1,189 | 7.9%), Management (1,137 | 7.5%), Health Diagnosing & Treating (997 | 6.6%), and Education, Arts & Media (737 | 4.9%).
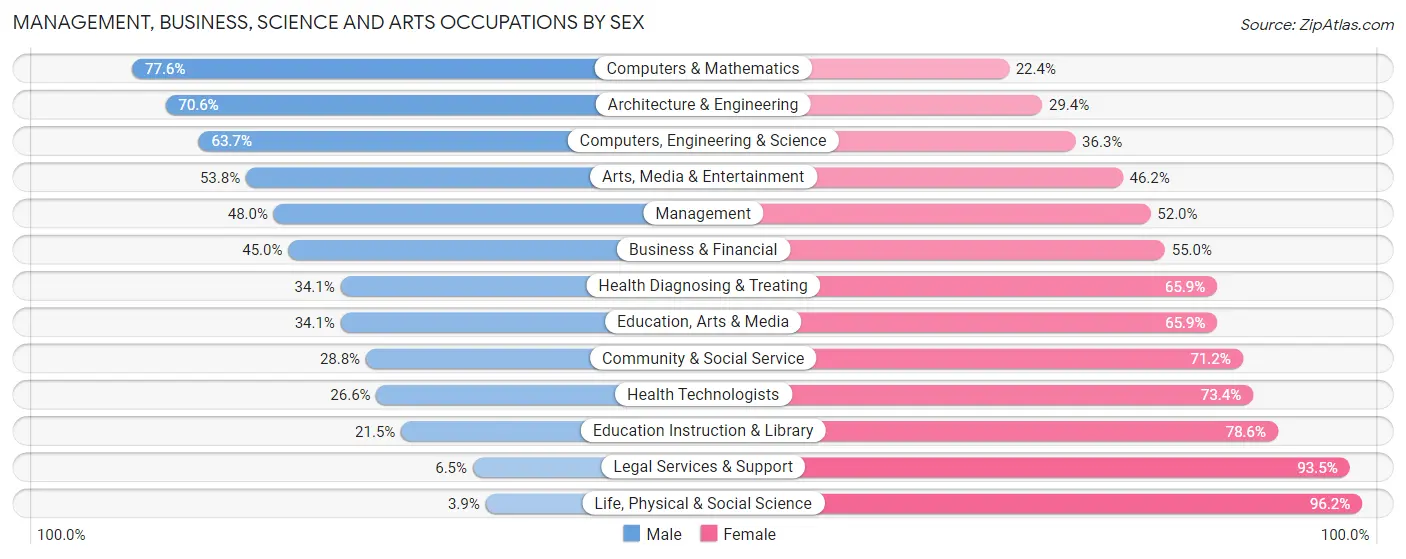
Management, Business, Science and Arts Occupations by Sex
Within the Management, Business, Science and Arts occupations in West Springfield Town, the most male-oriented occupations are Computers & Mathematics (77.6%), Architecture & Engineering (70.6%), and Computers, Engineering & Science (63.7%), while the most female-oriented occupations are Life, Physical & Social Science (96.2%), Legal Services & Support (93.5%), and Education Instruction & Library (78.5%).
| Occupation | Male | Female |
| Management | 546 (48.0%) | 591 (52.0%) |
| Business & Financial | 279 (45.0%) | 341 (55.0%) |
| Computers, Engineering & Science | 409 (63.7%) | 233 (36.3%) |
| Computers & Mathematics | 280 (77.6%) | 81 (22.4%) |
| Architecture & Engineering | 125 (70.6%) | 52 (29.4%) |
| Life, Physical & Social Science | 4 (3.8%) | 100 (96.2%) |
| Community & Social Service | 652 (28.8%) | 1,613 (71.2%) |
| Education, Arts & Media | 251 (34.1%) | 486 (65.9%) |
| Legal Services & Support | 5 (6.5%) | 72 (93.5%) |
| Education Instruction & Library | 255 (21.4%) | 934 (78.5%) |
| Arts, Media & Entertainment | 141 (53.8%) | 121 (46.2%) |
| Health Diagnosing & Treating | 340 (34.1%) | 657 (65.9%) |
| Health Technologists | 182 (26.6%) | 502 (73.4%) |
| Total (Category) | 2,226 (39.3%) | 3,435 (60.7%) |
| Total (Overall) | 7,695 (51.0%) | 7,401 (49.0%) |
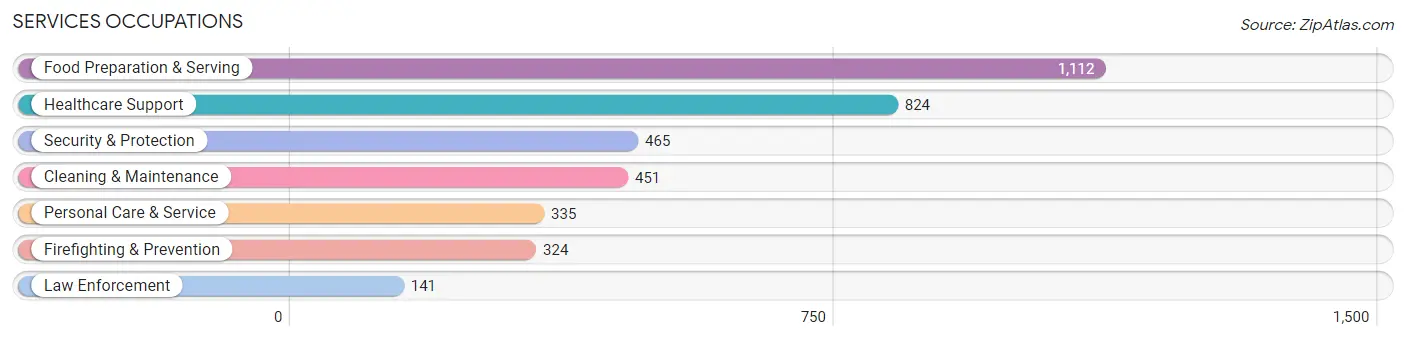
Services Occupations
The most common Services occupations in West Springfield Town are Food Preparation & Serving (1,112 | 7.4%), Healthcare Support (824 | 5.5%), Security & Protection (465 | 3.1%), Cleaning & Maintenance (451 | 3.0%), and Personal Care & Service (335 | 2.2%).
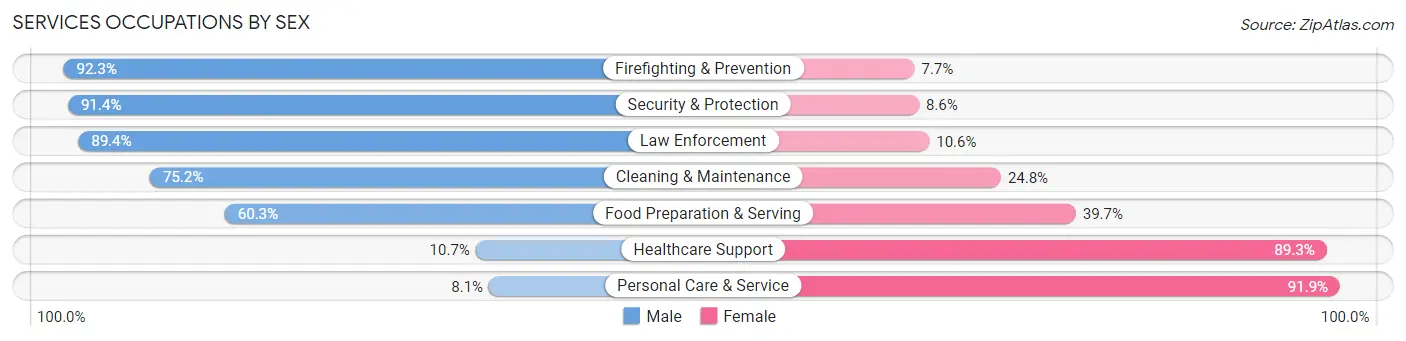
Services Occupations by Sex
Within the Services occupations in West Springfield Town, the most male-oriented occupations are Firefighting & Prevention (92.3%), Security & Protection (91.4%), and Law Enforcement (89.4%), while the most female-oriented occupations are Personal Care & Service (91.9%), Healthcare Support (89.3%), and Food Preparation & Serving (39.7%).
| Occupation | Male | Female |
| Healthcare Support | 88 (10.7%) | 736 (89.3%) |
| Security & Protection | 425 (91.4%) | 40 (8.6%) |
| Firefighting & Prevention | 299 (92.3%) | 25 (7.7%) |
| Law Enforcement | 126 (89.4%) | 15 (10.6%) |
| Food Preparation & Serving | 671 (60.3%) | 441 (39.7%) |
| Cleaning & Maintenance | 339 (75.2%) | 112 (24.8%) |
| Personal Care & Service | 27 (8.1%) | 308 (91.9%) |
| Total (Category) | 1,550 (48.6%) | 1,637 (51.4%) |
| Total (Overall) | 7,695 (51.0%) | 7,401 (49.0%) |
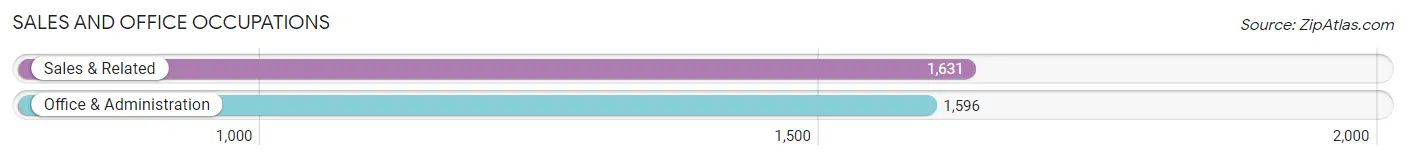
Sales and Office Occupations
The most common Sales and Office occupations in West Springfield Town are Sales & Related (1,631 | 10.8%), and Office & Administration (1,596 | 10.6%).
Sales and Office Occupations by Sex
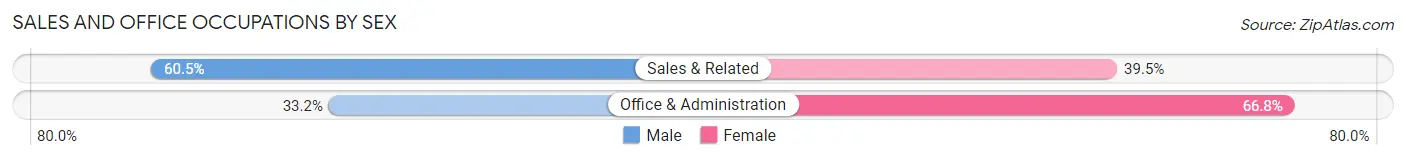
| Occupation | Male | Female |
| Sales & Related | 987 (60.5%) | 644 (39.5%) |
| Office & Administration | 530 (33.2%) | 1,066 (66.8%) |
| Total (Category) | 1,517 (47.0%) | 1,710 (53.0%) |
| Total (Overall) | 7,695 (51.0%) | 7,401 (49.0%) |
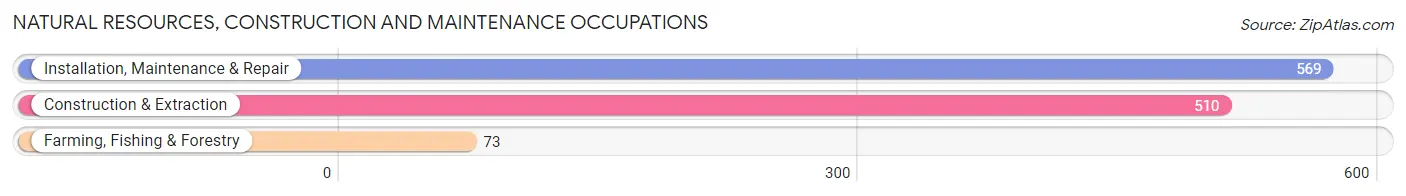
Natural Resources, Construction and Maintenance Occupations
The most common Natural Resources, Construction and Maintenance occupations in West Springfield Town are Installation, Maintenance & Repair (569 | 3.8%), Construction & Extraction (510 | 3.4%), and Farming, Fishing & Forestry (73 | 0.5%).
Natural Resources, Construction and Maintenance Occupations by Sex
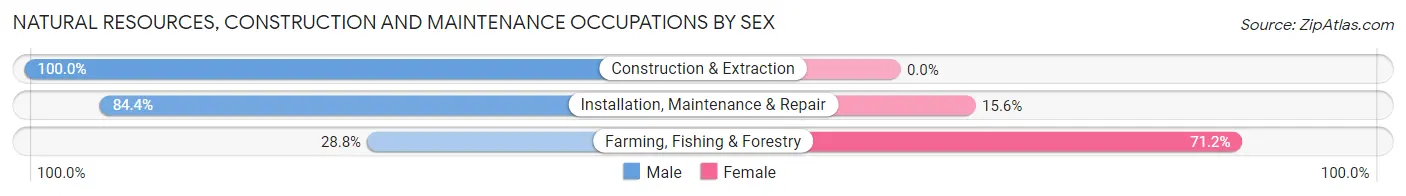
| Occupation | Male | Female |
| Farming, Fishing & Forestry | 21 (28.8%) | 52 (71.2%) |
| Construction & Extraction | 510 (100.0%) | 0 (0.0%) |
| Installation, Maintenance & Repair | 480 (84.4%) | 89 (15.6%) |
| Total (Category) | 1,011 (87.8%) | 141 (12.2%) |
| Total (Overall) | 7,695 (51.0%) | 7,401 (49.0%) |
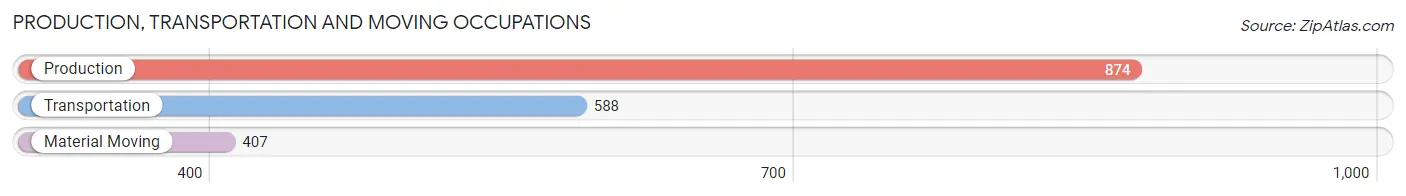
Production, Transportation and Moving Occupations
The most common Production, Transportation and Moving occupations in West Springfield Town are Production (874 | 5.8%), Transportation (588 | 3.9%), and Material Moving (407 | 2.7%).
Production, Transportation and Moving Occupations by Sex
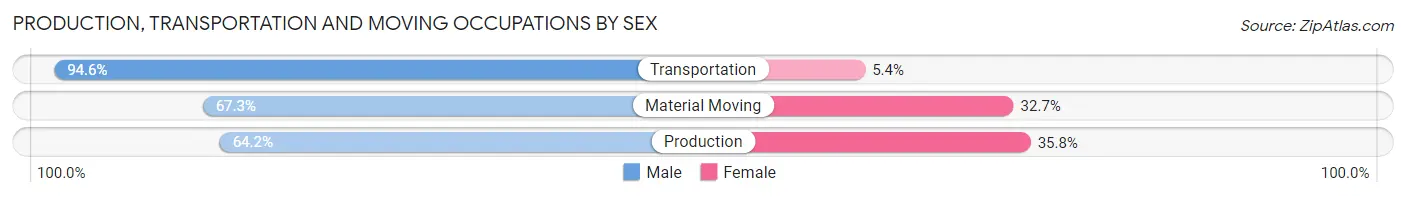
| Occupation | Male | Female |
| Production | 561 (64.2%) | 313 (35.8%) |
| Transportation | 556 (94.6%) | 32 (5.4%) |
| Material Moving | 274 (67.3%) | 133 (32.7%) |
| Total (Category) | 1,391 (74.4%) | 478 (25.6%) |
| Total (Overall) | 7,695 (51.0%) | 7,401 (49.0%) |
Employment Industries by Sex in West Springfield Town
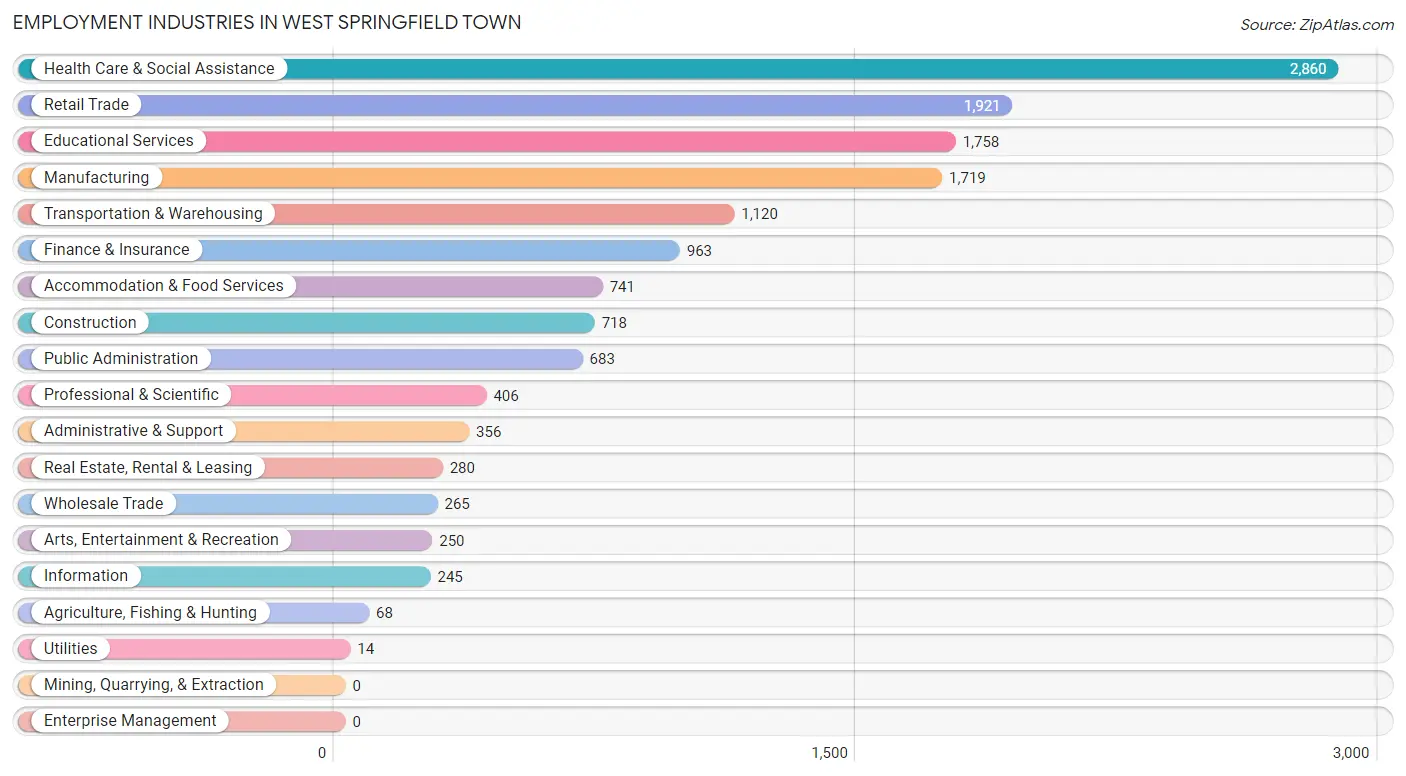
Employment Industries in West Springfield Town
The major employment industries in West Springfield Town include Health Care & Social Assistance (2,860 | 19.0%), Retail Trade (1,921 | 12.7%), Educational Services (1,758 | 11.7%), Manufacturing (1,719 | 11.4%), and Transportation & Warehousing (1,120 | 7.4%).
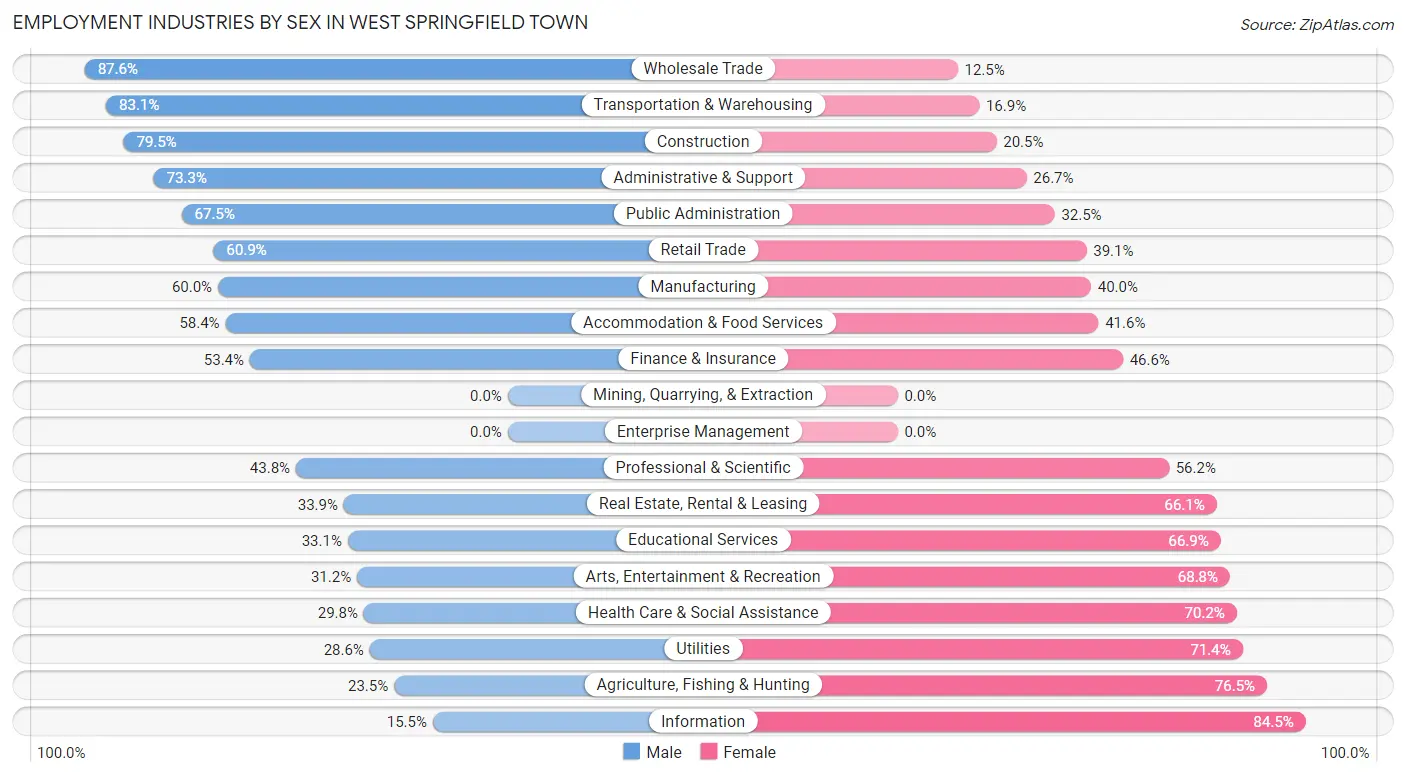
Employment Industries by Sex in West Springfield Town
The West Springfield Town industries that see more men than women are Wholesale Trade (87.5%), Transportation & Warehousing (83.1%), and Construction (79.5%), whereas the industries that tend to have a higher number of women are Information (84.5%), Agriculture, Fishing & Hunting (76.5%), and Utilities (71.4%).
| Industry | Male | Female |
| Agriculture, Fishing & Hunting | 16 (23.5%) | 52 (76.5%) |
| Mining, Quarrying, & Extraction | 0 (0.0%) | 0 (0.0%) |
| Construction | 571 (79.5%) | 147 (20.5%) |
| Manufacturing | 1,031 (60.0%) | 688 (40.0%) |
| Wholesale Trade | 232 (87.5%) | 33 (12.4%) |
| Retail Trade | 1,170 (60.9%) | 751 (39.1%) |
| Transportation & Warehousing | 931 (83.1%) | 189 (16.9%) |
| Utilities | 4 (28.6%) | 10 (71.4%) |
| Information | 38 (15.5%) | 207 (84.5%) |
| Finance & Insurance | 514 (53.4%) | 449 (46.6%) |
| Real Estate, Rental & Leasing | 95 (33.9%) | 185 (66.1%) |
| Professional & Scientific | 178 (43.8%) | 228 (56.2%) |
| Enterprise Management | 0 (0.0%) | 0 (0.0%) |
| Administrative & Support | 261 (73.3%) | 95 (26.7%) |
| Educational Services | 582 (33.1%) | 1,176 (66.9%) |
| Health Care & Social Assistance | 852 (29.8%) | 2,008 (70.2%) |
| Arts, Entertainment & Recreation | 78 (31.2%) | 172 (68.8%) |
| Accommodation & Food Services | 433 (58.4%) | 308 (41.6%) |
| Public Administration | 461 (67.5%) | 222 (32.5%) |
| Total | 7,695 (51.0%) | 7,401 (49.0%) |
Education in West Springfield Town
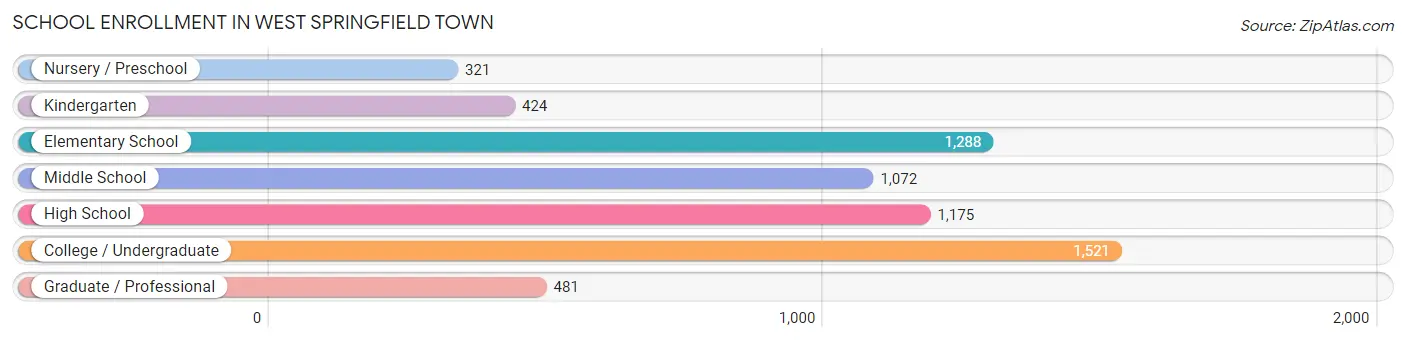
School Enrollment in West Springfield Town
The most common levels of schooling among the 6,282 students in West Springfield Town are college / undergraduate (1,521 | 24.2%), elementary school (1,288 | 20.5%), and high school (1,175 | 18.7%).
| School Level | # Students | % Students |
| Nursery / Preschool | 321 | 5.1% |
| Kindergarten | 424 | 6.8% |
| Elementary School | 1,288 | 20.5% |
| Middle School | 1,072 | 17.1% |
| High School | 1,175 | 18.7% |
| College / Undergraduate | 1,521 | 24.2% |
| Graduate / Professional | 481 | 7.7% |
| Total | 6,282 | 100.0% |
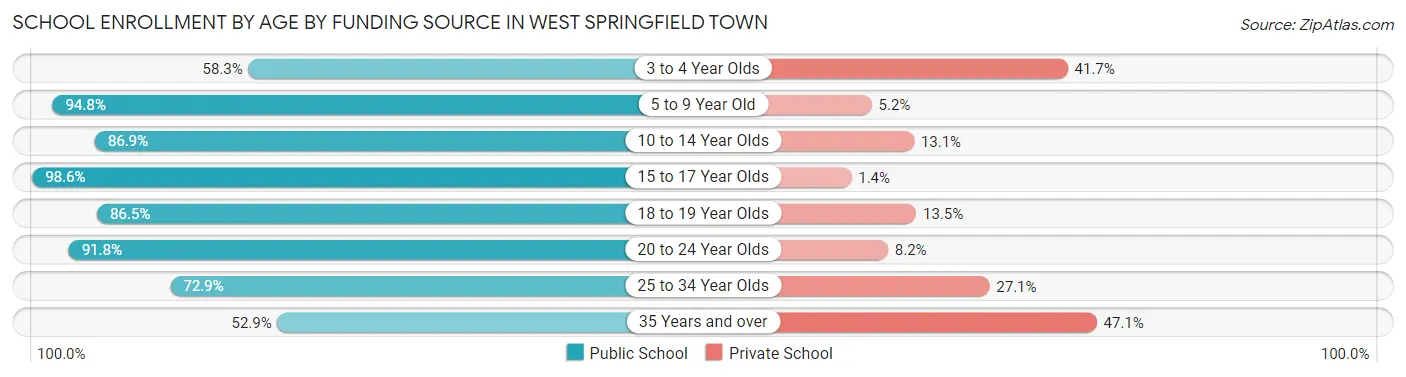
School Enrollment by Age by Funding Source in West Springfield Town
Out of a total of 6,282 students who are enrolled in schools in West Springfield Town, 867 (13.8%) attend a private institution, while the remaining 5,415 (86.2%) are enrolled in public schools. The age group of 35 years and over has the highest likelihood of being enrolled in private schools, with 236 (47.1% in the age bracket) enrolled. Conversely, the age group of 15 to 17 year olds has the lowest likelihood of being enrolled in a private school, with 766 (98.6% in the age bracket) attending a public institution.
| Age Bracket | Public School | Private School |
| 3 to 4 Year Olds | 116 (58.3%) | 83 (41.7%) |
| 5 to 9 Year Old | 1,550 (94.8%) | 85 (5.2%) |
| 10 to 14 Year Olds | 1,268 (86.9%) | 191 (13.1%) |
| 15 to 17 Year Olds | 766 (98.6%) | 11 (1.4%) |
| 18 to 19 Year Olds | 436 (86.5%) | 68 (13.5%) |
| 20 to 24 Year Olds | 658 (91.8%) | 59 (8.2%) |
| 25 to 34 Year Olds | 357 (72.9%) | 133 (27.1%) |
| 35 Years and over | 265 (52.9%) | 236 (47.1%) |
| Total | 5,415 (86.2%) | 867 (13.8%) |
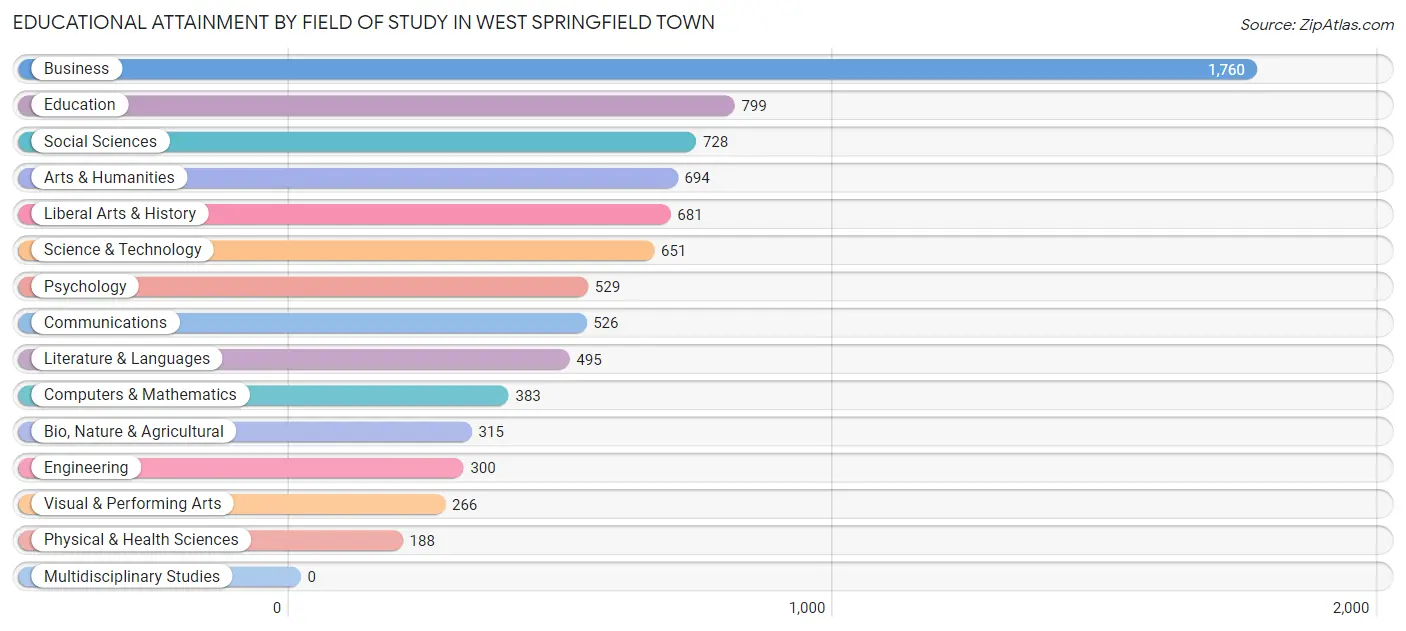
Educational Attainment by Field of Study in West Springfield Town
Business (1,760 | 21.2%), education (799 | 9.6%), social sciences (728 | 8.8%), arts & humanities (694 | 8.4%), and liberal arts & history (681 | 8.2%) are the most common fields of study among 8,315 individuals in West Springfield Town who have obtained a bachelor's degree or higher.
| Field of Study | # Graduates | % Graduates |
| Computers & Mathematics | 383 | 4.6% |
| Bio, Nature & Agricultural | 315 | 3.8% |
| Physical & Health Sciences | 188 | 2.3% |
| Psychology | 529 | 6.4% |
| Social Sciences | 728 | 8.8% |
| Engineering | 300 | 3.6% |
| Multidisciplinary Studies | 0 | 0.0% |
| Science & Technology | 651 | 7.8% |
| Business | 1,760 | 21.2% |
| Education | 799 | 9.6% |
| Literature & Languages | 495 | 5.9% |
| Liberal Arts & History | 681 | 8.2% |
| Visual & Performing Arts | 266 | 3.2% |
| Communications | 526 | 6.3% |
| Arts & Humanities | 694 | 8.4% |
| Total | 8,315 | 100.0% |
Transportation & Commute in West Springfield Town
Vehicle Availability by Sex in West Springfield Town
The most prevalent vehicle ownership categories in West Springfield Town are males with 2 vehicles (2,987, accounting for 39.1%) and females with 2 vehicles (3,281, making up 40.9%).
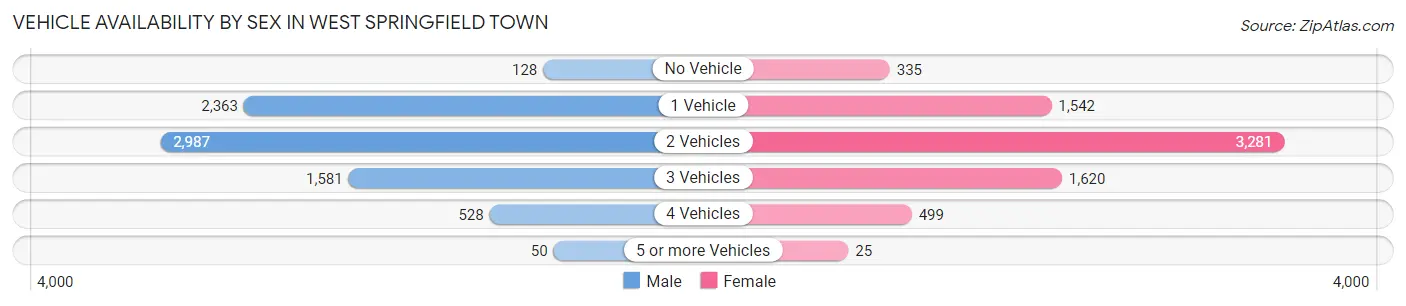
| Vehicles Available | Male | Female |
| No Vehicle | 128 (1.7%) | 335 (4.6%) |
| 1 Vehicle | 2,363 (30.9%) | 1,542 (21.1%) |
| 2 Vehicles | 2,987 (39.1%) | 3,281 (44.9%) |
| 3 Vehicles | 1,581 (20.7%) | 1,620 (22.2%) |
| 4 Vehicles | 528 (6.9%) | 499 (6.8%) |
| 5 or more Vehicles | 50 (0.6%) | 25 (0.3%) |
| Total | 7,637 (100.0%) | 7,302 (100.0%) |
Commute Time in West Springfield Town
The most frequently occuring commute durations in West Springfield Town are 15 to 19 minutes (3,599 commuters, 26.4%), 10 to 14 minutes (3,042 commuters, 22.3%), and 20 to 24 minutes (1,945 commuters, 14.3%).
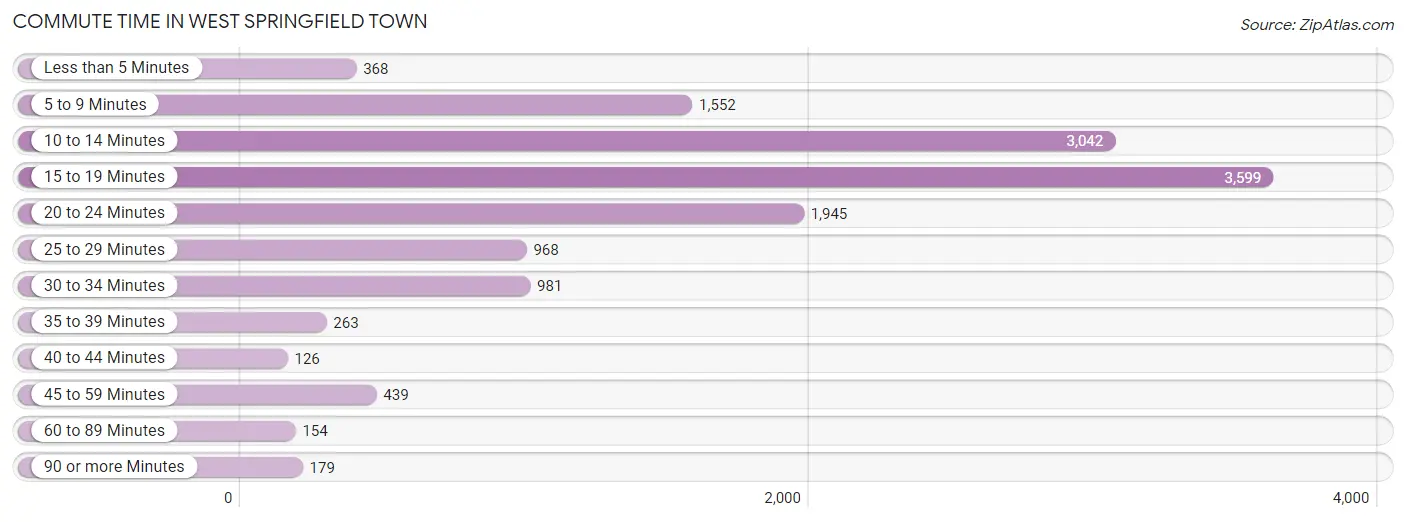
| Commute Time | # Commuters | % Commuters |
| Less than 5 Minutes | 368 | 2.7% |
| 5 to 9 Minutes | 1,552 | 11.4% |
| 10 to 14 Minutes | 3,042 | 22.3% |
| 15 to 19 Minutes | 3,599 | 26.4% |
| 20 to 24 Minutes | 1,945 | 14.3% |
| 25 to 29 Minutes | 968 | 7.1% |
| 30 to 34 Minutes | 981 | 7.2% |
| 35 to 39 Minutes | 263 | 1.9% |
| 40 to 44 Minutes | 126 | 0.9% |
| 45 to 59 Minutes | 439 | 3.2% |
| 60 to 89 Minutes | 154 | 1.1% |
| 90 or more Minutes | 179 | 1.3% |
Commute Time by Sex in West Springfield Town
The most common commute times in West Springfield Town are 15 to 19 minutes (2,006 commuters, 27.8%) for males and 15 to 19 minutes (1,593 commuters, 24.9%) for females.
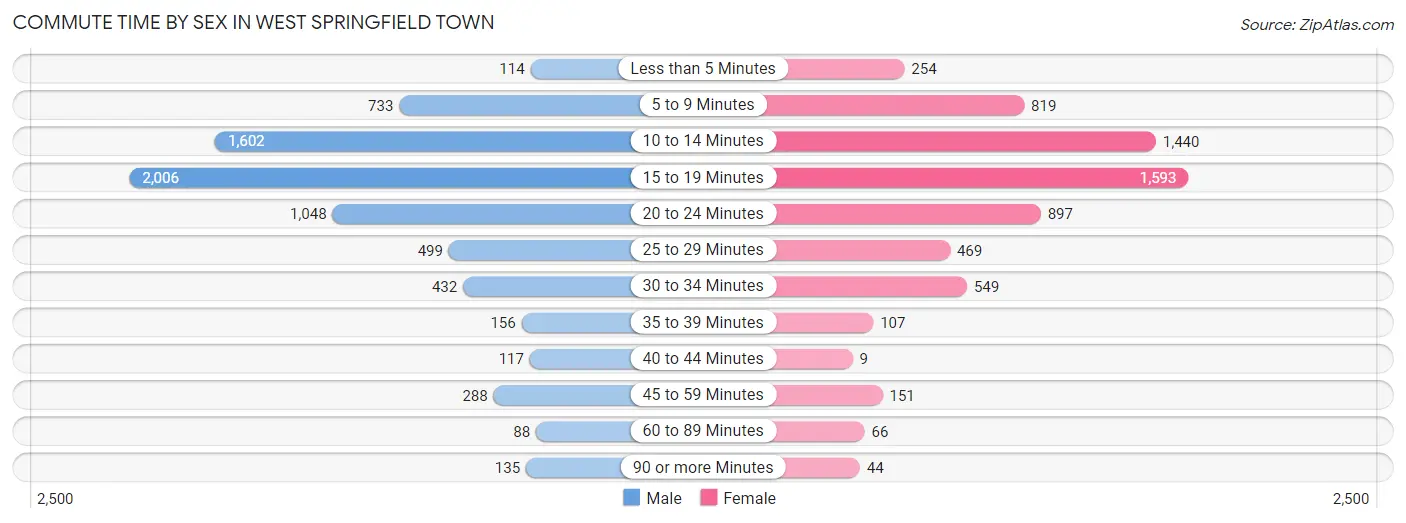
| Commute Time | Male | Female |
| Less than 5 Minutes | 114 (1.6%) | 254 (4.0%) |
| 5 to 9 Minutes | 733 (10.2%) | 819 (12.8%) |
| 10 to 14 Minutes | 1,602 (22.2%) | 1,440 (22.5%) |
| 15 to 19 Minutes | 2,006 (27.8%) | 1,593 (24.9%) |
| 20 to 24 Minutes | 1,048 (14.5%) | 897 (14.0%) |
| 25 to 29 Minutes | 499 (6.9%) | 469 (7.3%) |
| 30 to 34 Minutes | 432 (6.0%) | 549 (8.6%) |
| 35 to 39 Minutes | 156 (2.2%) | 107 (1.7%) |
| 40 to 44 Minutes | 117 (1.6%) | 9 (0.1%) |
| 45 to 59 Minutes | 288 (4.0%) | 151 (2.4%) |
| 60 to 89 Minutes | 88 (1.2%) | 66 (1.0%) |
| 90 or more Minutes | 135 (1.9%) | 44 (0.7%) |
Time of Departure to Work by Sex in West Springfield Town
The most frequent times of departure to work in West Springfield Town are 7:30 AM to 7:59 AM (1,011, 14.0%) for males and 7:30 AM to 7:59 AM (1,236, 19.3%) for females.
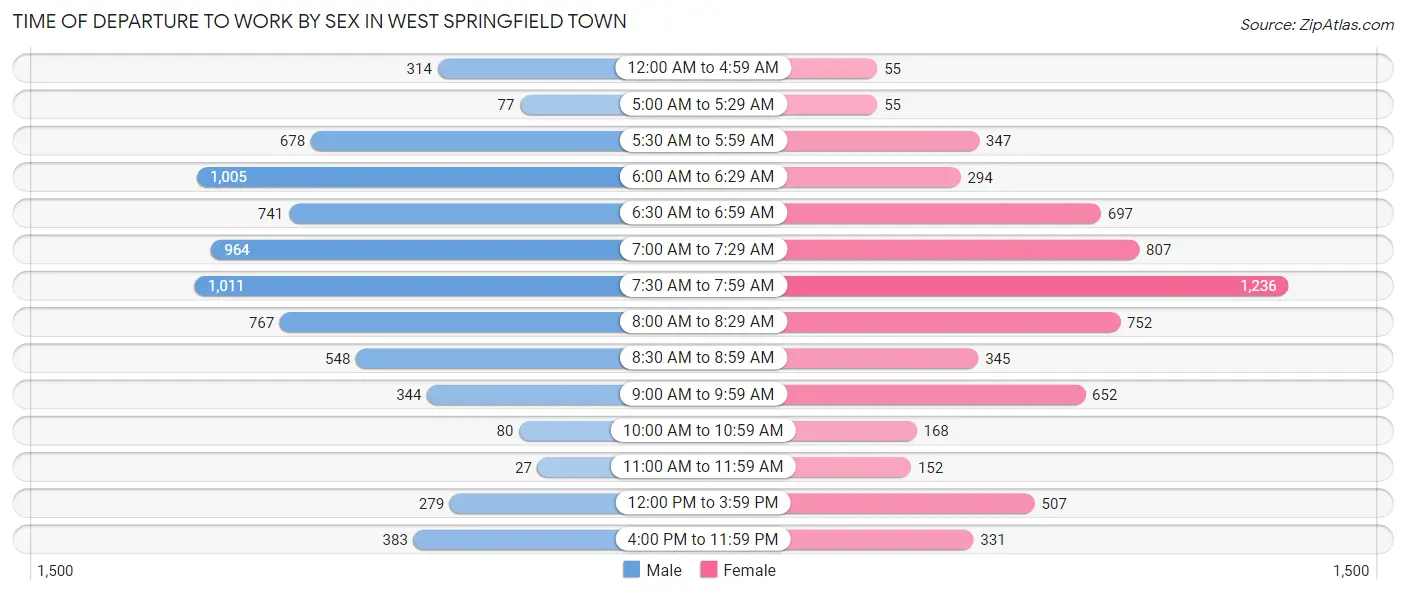
| Time of Departure | Male | Female |
| 12:00 AM to 4:59 AM | 314 (4.3%) | 55 (0.9%) |
| 5:00 AM to 5:29 AM | 77 (1.1%) | 55 (0.9%) |
| 5:30 AM to 5:59 AM | 678 (9.4%) | 347 (5.4%) |
| 6:00 AM to 6:29 AM | 1,005 (13.9%) | 294 (4.6%) |
| 6:30 AM to 6:59 AM | 741 (10.3%) | 697 (10.9%) |
| 7:00 AM to 7:29 AM | 964 (13.4%) | 807 (12.6%) |
| 7:30 AM to 7:59 AM | 1,011 (14.0%) | 1,236 (19.3%) |
| 8:00 AM to 8:29 AM | 767 (10.6%) | 752 (11.7%) |
| 8:30 AM to 8:59 AM | 548 (7.6%) | 345 (5.4%) |
| 9:00 AM to 9:59 AM | 344 (4.8%) | 652 (10.2%) |
| 10:00 AM to 10:59 AM | 80 (1.1%) | 168 (2.6%) |
| 11:00 AM to 11:59 AM | 27 (0.4%) | 152 (2.4%) |
| 12:00 PM to 3:59 PM | 279 (3.9%) | 507 (7.9%) |
| 4:00 PM to 11:59 PM | 383 (5.3%) | 331 (5.2%) |
| Total | 7,218 (100.0%) | 6,398 (100.0%) |
Housing Occupancy in West Springfield Town
Occupancy by Ownership in West Springfield Town
Of the total 12,691 dwellings in West Springfield Town, owner-occupied units account for 7,207 (56.8%), while renter-occupied units make up 5,484 (43.2%).
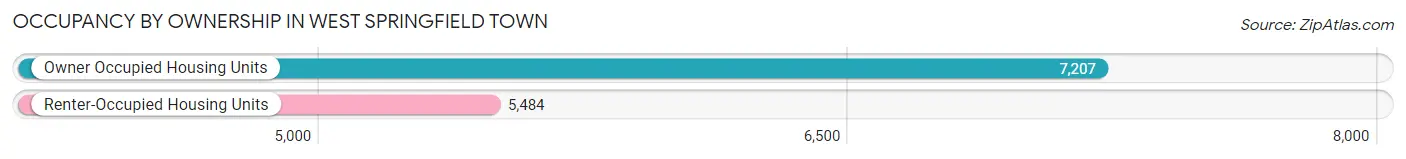
| Occupancy | # Housing Units | % Housing Units |
| Owner Occupied Housing Units | 7,207 | 56.8% |
| Renter-Occupied Housing Units | 5,484 | 43.2% |
| Total Occupied Housing Units | 12,691 | 100.0% |
Occupancy by Household Size in West Springfield Town
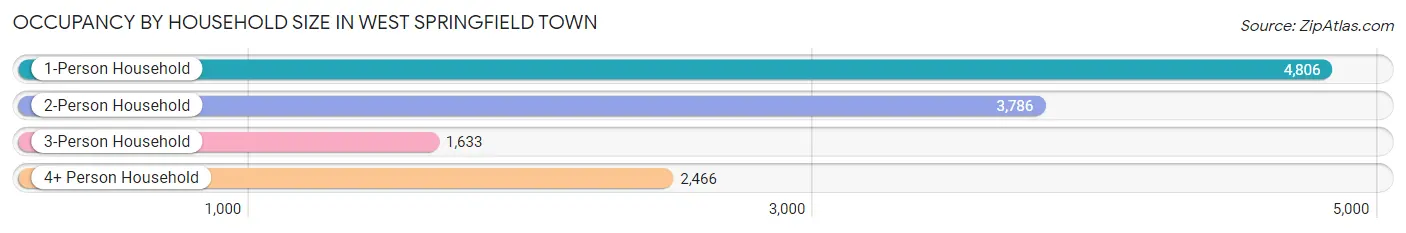
| Household Size | # Housing Units | % Housing Units |
| 1-Person Household | 4,806 | 37.9% |
| 2-Person Household | 3,786 | 29.8% |
| 3-Person Household | 1,633 | 12.9% |
| 4+ Person Household | 2,466 | 19.4% |
| Total Housing Units | 12,691 | 100.0% |
Occupancy by Ownership by Household Size in West Springfield Town
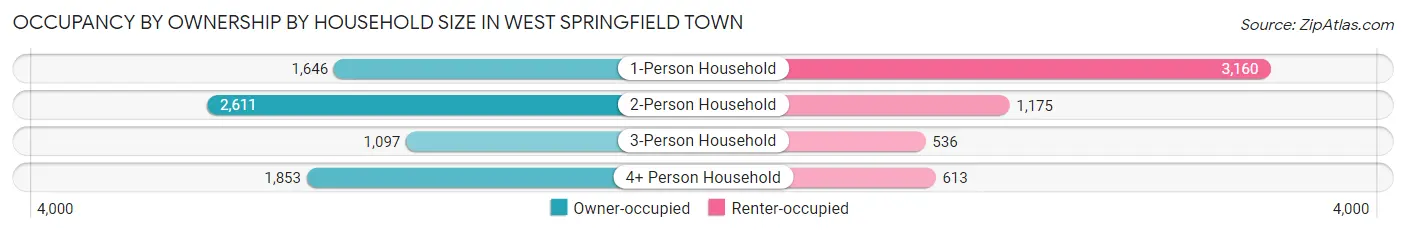
| Household Size | Owner-occupied | Renter-occupied |
| 1-Person Household | 1,646 (34.3%) | 3,160 (65.7%) |
| 2-Person Household | 2,611 (69.0%) | 1,175 (31.0%) |
| 3-Person Household | 1,097 (67.2%) | 536 (32.8%) |
| 4+ Person Household | 1,853 (75.1%) | 613 (24.9%) |
| Total Housing Units | 7,207 (56.8%) | 5,484 (43.2%) |
Occupancy by Educational Attainment in West Springfield Town
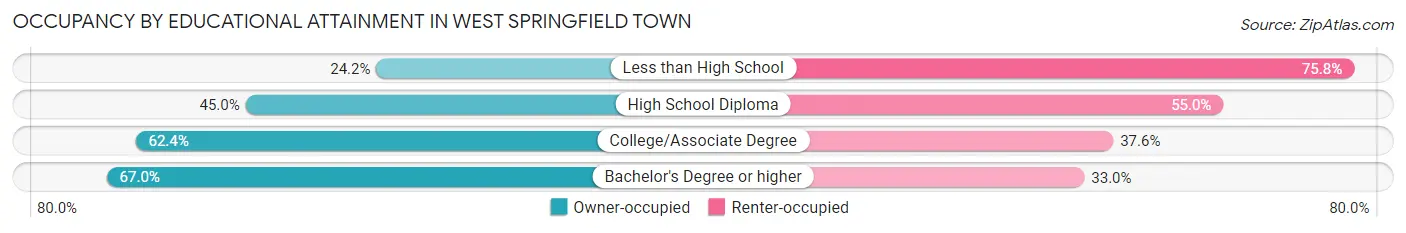
| Household Size | Owner-occupied | Renter-occupied |
| Less than High School | 201 (24.2%) | 629 (75.8%) |
| High School Diploma | 1,556 (45.0%) | 1,905 (55.0%) |
| College/Associate Degree | 2,403 (62.4%) | 1,448 (37.6%) |
| Bachelor's Degree or higher | 3,047 (67.0%) | 1,502 (33.0%) |
Occupancy by Age of Householder in West Springfield Town
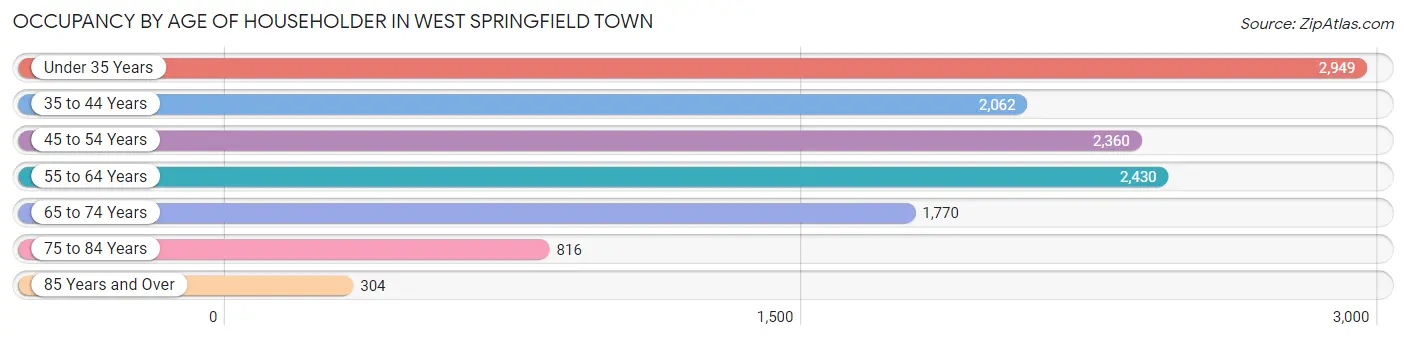
| Age Bracket | # Households | % Households |
| Under 35 Years | 2,949 | 23.2% |
| 35 to 44 Years | 2,062 | 16.3% |
| 45 to 54 Years | 2,360 | 18.6% |
| 55 to 64 Years | 2,430 | 19.2% |
| 65 to 74 Years | 1,770 | 14.0% |
| 75 to 84 Years | 816 | 6.4% |
| 85 Years and Over | 304 | 2.4% |
| Total | 12,691 | 100.0% |
Housing Finances in West Springfield Town
Median Income by Occupancy in West Springfield Town
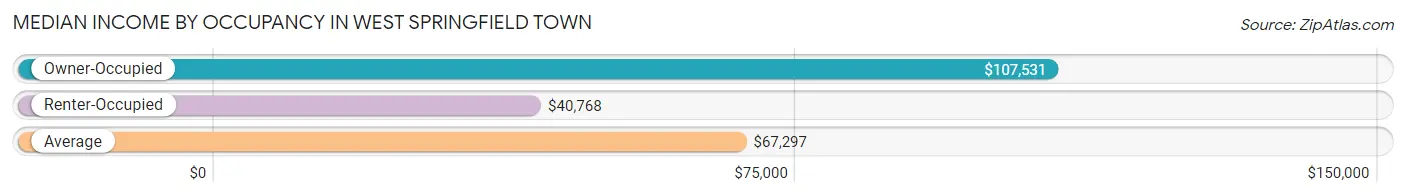
| Occupancy Type | # Households | Median Income |
| Owner-Occupied | 7,207 (56.8%) | $107,531 |
| Renter-Occupied | 5,484 (43.2%) | $40,768 |
| Average | 12,691 (100.0%) | $67,297 |
Occupancy by Householder Income Bracket in West Springfield Town
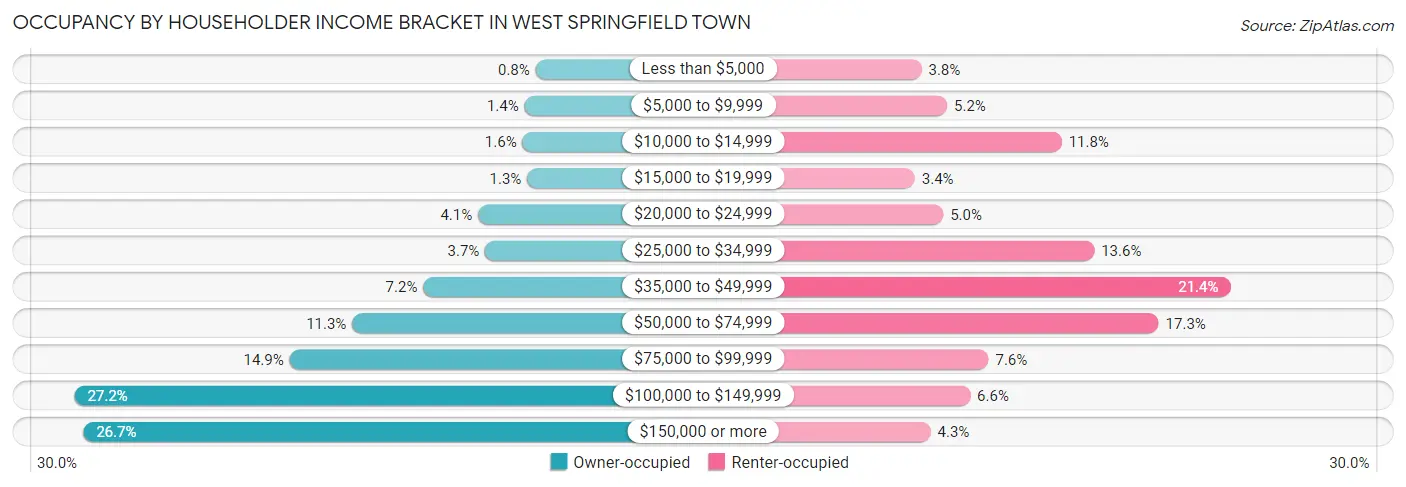
| Income Bracket | Owner-occupied | Renter-occupied |
| Less than $5,000 | 58 (0.8%) | 207 (3.8%) |
| $5,000 to $9,999 | 103 (1.4%) | 287 (5.2%) |
| $10,000 to $14,999 | 112 (1.5%) | 646 (11.8%) |
| $15,000 to $19,999 | 92 (1.3%) | 186 (3.4%) |
| $20,000 to $24,999 | 295 (4.1%) | 275 (5.0%) |
| $25,000 to $34,999 | 265 (3.7%) | 748 (13.6%) |
| $35,000 to $49,999 | 520 (7.2%) | 1,174 (21.4%) |
| $50,000 to $74,999 | 813 (11.3%) | 950 (17.3%) |
| $75,000 to $99,999 | 1,071 (14.9%) | 417 (7.6%) |
| $100,000 to $149,999 | 1,957 (27.2%) | 359 (6.6%) |
| $150,000 or more | 1,921 (26.7%) | 235 (4.3%) |
| Total | 7,207 (100.0%) | 5,484 (100.0%) |
Monthly Housing Cost Tiers in West Springfield Town
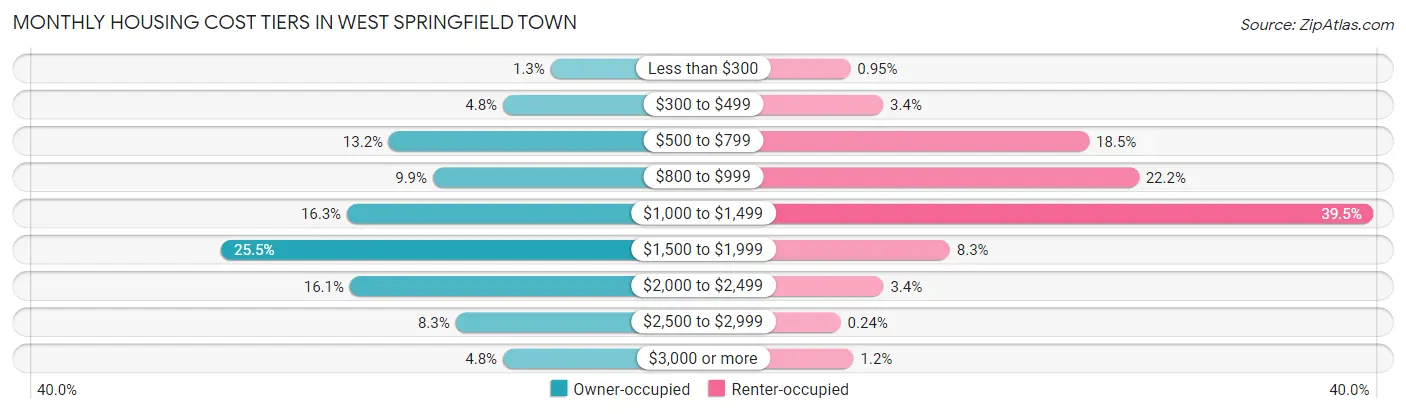
| Monthly Cost | Owner-occupied | Renter-occupied |
| Less than $300 | 91 (1.3%) | 52 (0.9%) |
| $300 to $499 | 344 (4.8%) | 185 (3.4%) |
| $500 to $799 | 949 (13.2%) | 1,017 (18.5%) |
| $800 to $999 | 716 (9.9%) | 1,217 (22.2%) |
| $1,000 to $1,499 | 1,172 (16.3%) | 2,165 (39.5%) |
| $1,500 to $1,999 | 1,839 (25.5%) | 454 (8.3%) |
| $2,000 to $2,499 | 1,157 (16.1%) | 186 (3.4%) |
| $2,500 to $2,999 | 595 (8.3%) | 13 (0.2%) |
| $3,000 or more | 344 (4.8%) | 65 (1.2%) |
| Total | 7,207 (100.0%) | 5,484 (100.0%) |
Physical Housing Characteristics in West Springfield Town
Housing Structures in West Springfield Town
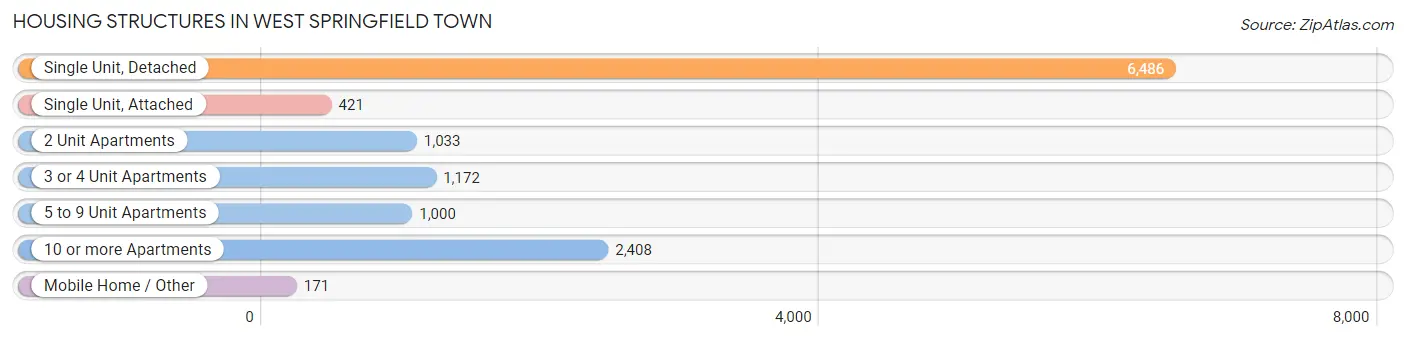
| Structure Type | # Housing Units | % Housing Units |
| Single Unit, Detached | 6,486 | 51.1% |
| Single Unit, Attached | 421 | 3.3% |
| 2 Unit Apartments | 1,033 | 8.1% |
| 3 or 4 Unit Apartments | 1,172 | 9.2% |
| 5 to 9 Unit Apartments | 1,000 | 7.9% |
| 10 or more Apartments | 2,408 | 19.0% |
| Mobile Home / Other | 171 | 1.3% |
| Total | 12,691 | 100.0% |
Housing Structures by Occupancy in West Springfield Town
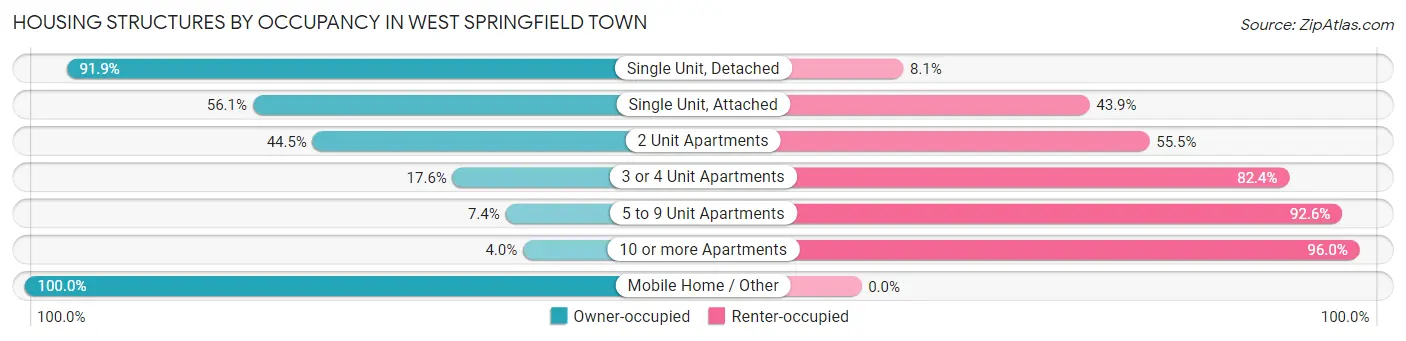
| Structure Type | Owner-occupied | Renter-occupied |
| Single Unit, Detached | 5,963 (91.9%) | 523 (8.1%) |
| Single Unit, Attached | 236 (56.1%) | 185 (43.9%) |
| 2 Unit Apartments | 460 (44.5%) | 573 (55.5%) |
| 3 or 4 Unit Apartments | 206 (17.6%) | 966 (82.4%) |
| 5 to 9 Unit Apartments | 74 (7.4%) | 926 (92.6%) |
| 10 or more Apartments | 97 (4.0%) | 2,311 (96.0%) |
| Mobile Home / Other | 171 (100.0%) | 0 (0.0%) |
| Total | 7,207 (56.8%) | 5,484 (43.2%) |
Housing Structures by Number of Rooms in West Springfield Town
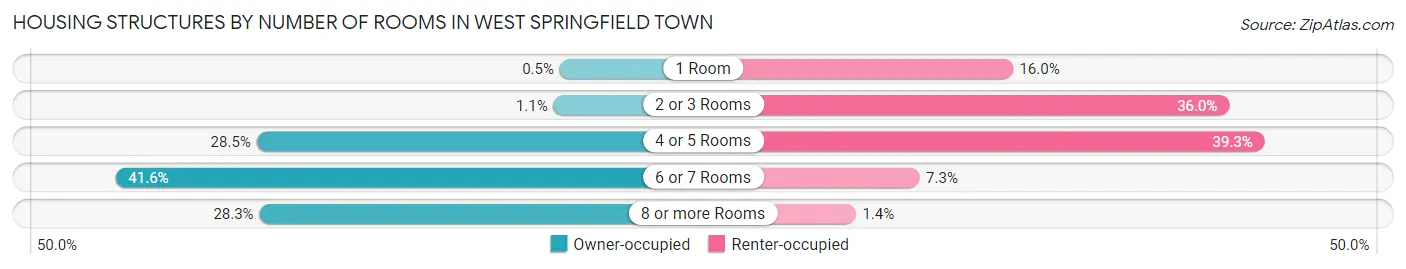
| Number of Rooms | Owner-occupied | Renter-occupied |
| 1 Room | 36 (0.5%) | 875 (16.0%) |
| 2 or 3 Rooms | 78 (1.1%) | 1,974 (36.0%) |
| 4 or 5 Rooms | 2,057 (28.5%) | 2,154 (39.3%) |
| 6 or 7 Rooms | 2,998 (41.6%) | 402 (7.3%) |
| 8 or more Rooms | 2,038 (28.3%) | 79 (1.4%) |
| Total | 7,207 (100.0%) | 5,484 (100.0%) |
Housing Structure by Heating Type in West Springfield Town
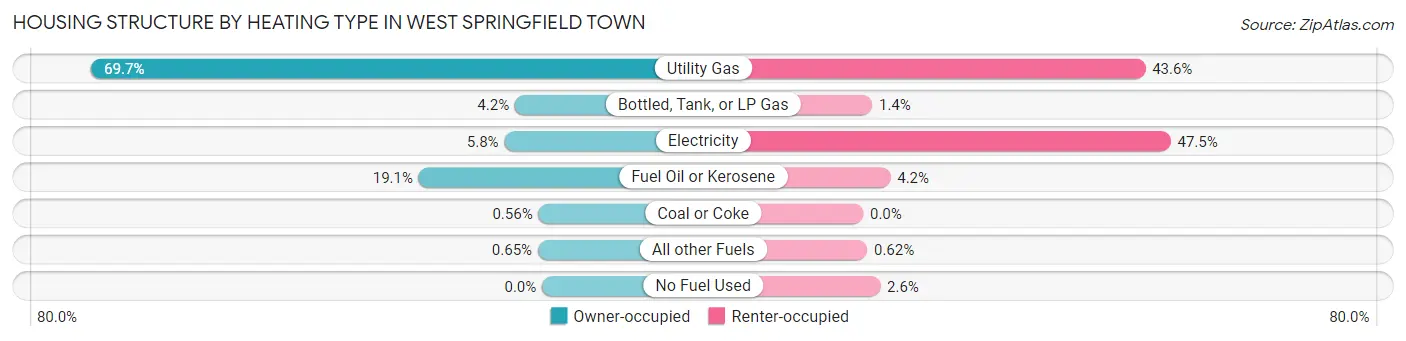
| Heating Type | Owner-occupied | Renter-occupied |
| Utility Gas | 5,024 (69.7%) | 2,392 (43.6%) |
| Bottled, Tank, or LP Gas | 302 (4.2%) | 76 (1.4%) |
| Electricity | 420 (5.8%) | 2,607 (47.5%) |
| Fuel Oil or Kerosene | 1,374 (19.1%) | 231 (4.2%) |
| Coal or Coke | 40 (0.6%) | 0 (0.0%) |
| All other Fuels | 47 (0.6%) | 34 (0.6%) |
| No Fuel Used | 0 (0.0%) | 144 (2.6%) |
| Total | 7,207 (100.0%) | 5,484 (100.0%) |
Household Vehicle Usage in West Springfield Town
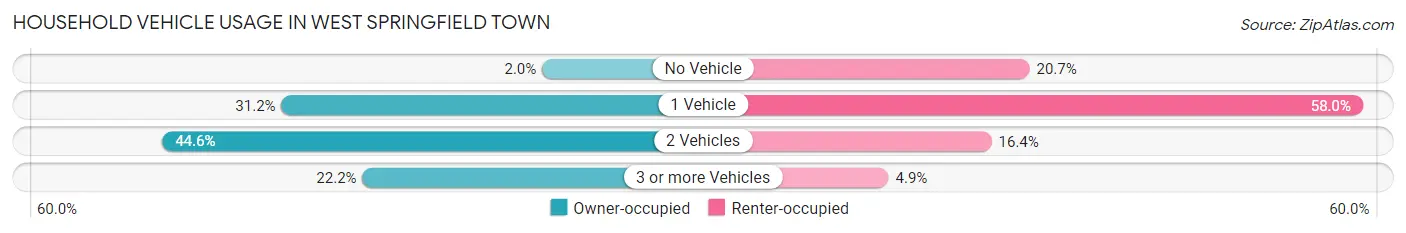
| Vehicles per Household | Owner-occupied | Renter-occupied |
| No Vehicle | 146 (2.0%) | 1,134 (20.7%) |
| 1 Vehicle | 2,251 (31.2%) | 3,181 (58.0%) |
| 2 Vehicles | 3,213 (44.6%) | 901 (16.4%) |
| 3 or more Vehicles | 1,597 (22.2%) | 268 (4.9%) |
| Total | 7,207 (100.0%) | 5,484 (100.0%) |
Real Estate & Mortgages in West Springfield Town
Real Estate and Mortgage Overview in West Springfield Town
| Characteristic | Without Mortgage | With Mortgage |
| Housing Units | 2,435 | 4,772 |
| Median Property Value | $275,500 | $300,800 |
| Median Household Income | $83,169 | $1,420 |
| Monthly Housing Costs | $802 | $344 |
| Real Estate Taxes | $4,059 | $149 |
Property Value by Mortgage Status in West Springfield Town
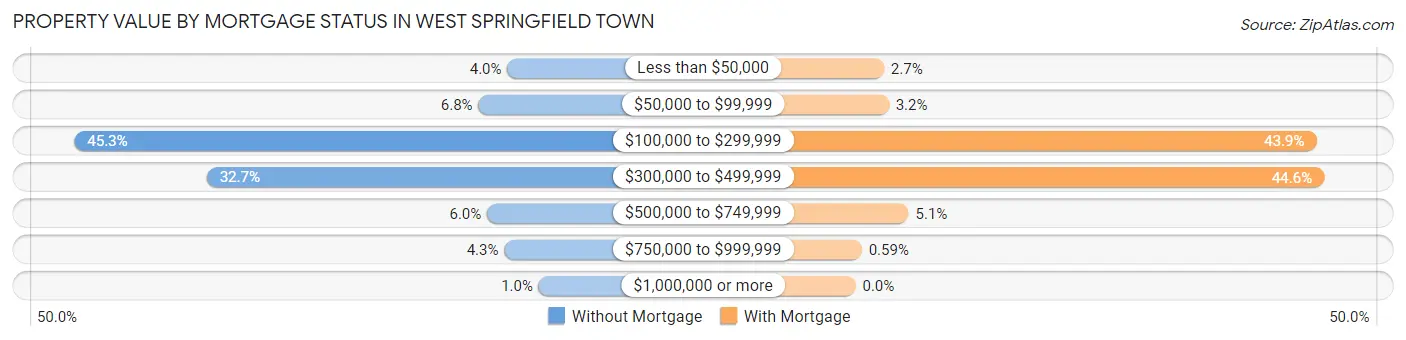
| Property Value | Without Mortgage | With Mortgage |
| Less than $50,000 | 98 (4.0%) | 129 (2.7%) |
| $50,000 to $99,999 | 165 (6.8%) | 151 (3.2%) |
| $100,000 to $299,999 | 1,102 (45.3%) | 2,094 (43.9%) |
| $300,000 to $499,999 | 795 (32.7%) | 2,129 (44.6%) |
| $500,000 to $749,999 | 145 (5.9%) | 241 (5.1%) |
| $750,000 to $999,999 | 105 (4.3%) | 28 (0.6%) |
| $1,000,000 or more | 25 (1.0%) | 0 (0.0%) |
| Total | 2,435 (100.0%) | 4,772 (100.0%) |
Household Income by Mortgage Status in West Springfield Town
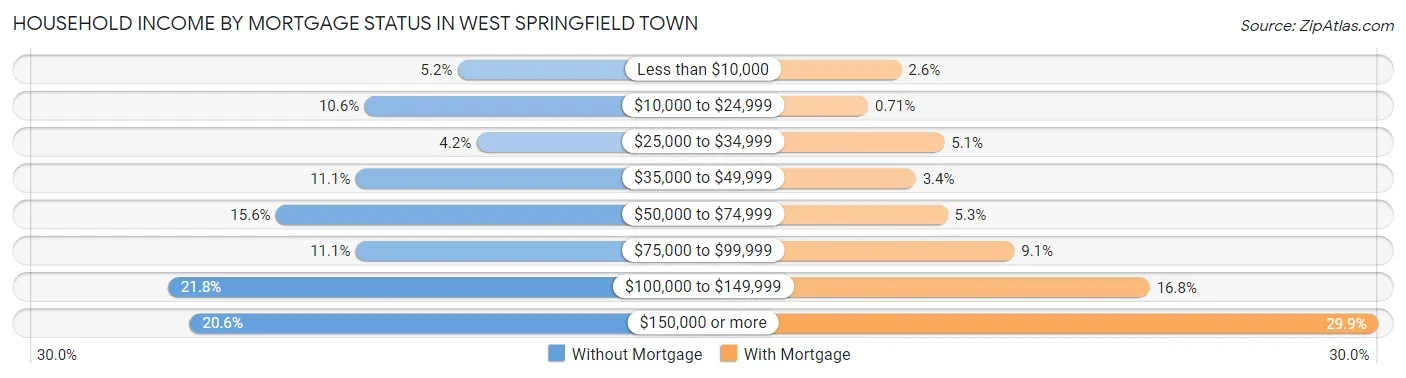
| Household Income | Without Mortgage | With Mortgage |
| Less than $10,000 | 127 (5.2%) | 125 (2.6%) |
| $10,000 to $24,999 | 257 (10.5%) | 34 (0.7%) |
| $25,000 to $34,999 | 101 (4.2%) | 242 (5.1%) |
| $35,000 to $49,999 | 269 (11.1%) | 164 (3.4%) |
| $50,000 to $74,999 | 380 (15.6%) | 251 (5.3%) |
| $75,000 to $99,999 | 269 (11.1%) | 433 (9.1%) |
| $100,000 to $149,999 | 531 (21.8%) | 802 (16.8%) |
| $150,000 or more | 501 (20.6%) | 1,426 (29.9%) |
| Total | 2,435 (100.0%) | 4,772 (100.0%) |
Property Value to Household Income Ratio in West Springfield Town
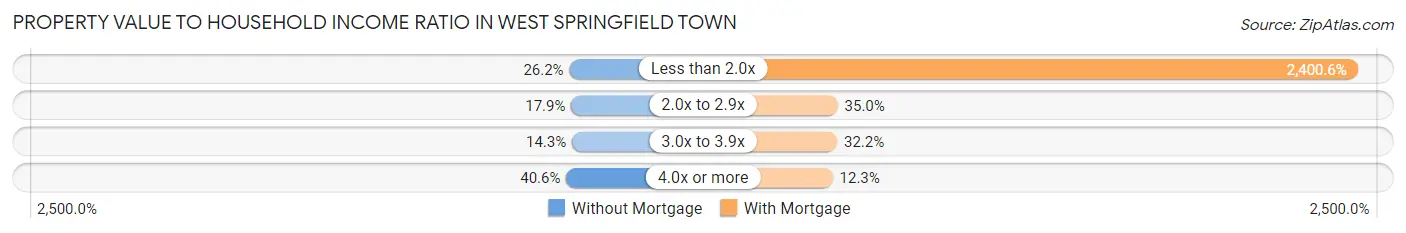
| Value-to-Income Ratio | Without Mortgage | With Mortgage |
| Less than 2.0x | 637 (26.2%) | 114,557 (2,400.6%) |
| 2.0x to 2.9x | 435 (17.9%) | 1,670 (35.0%) |
| 3.0x to 3.9x | 349 (14.3%) | 1,538 (32.2%) |
| 4.0x or more | 988 (40.6%) | 588 (12.3%) |
| Total | 2,435 (100.0%) | 4,772 (100.0%) |
Real Estate Taxes by Mortgage Status in West Springfield Town
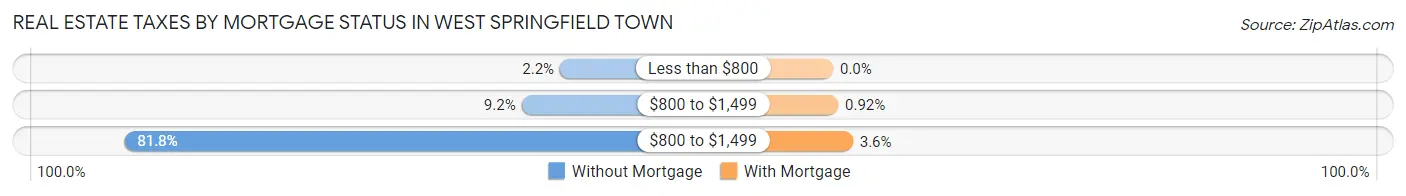
| Property Taxes | Without Mortgage | With Mortgage |
| Less than $800 | 54 (2.2%) | 0 (0.0%) |
| $800 to $1,499 | 225 (9.2%) | 44 (0.9%) |
| $800 to $1,499 | 1,991 (81.8%) | 172 (3.6%) |
| Total | 2,435 (100.0%) | 4,772 (100.0%) |
Health & Disability in West Springfield Town
Health Insurance Coverage by Age in West Springfield Town
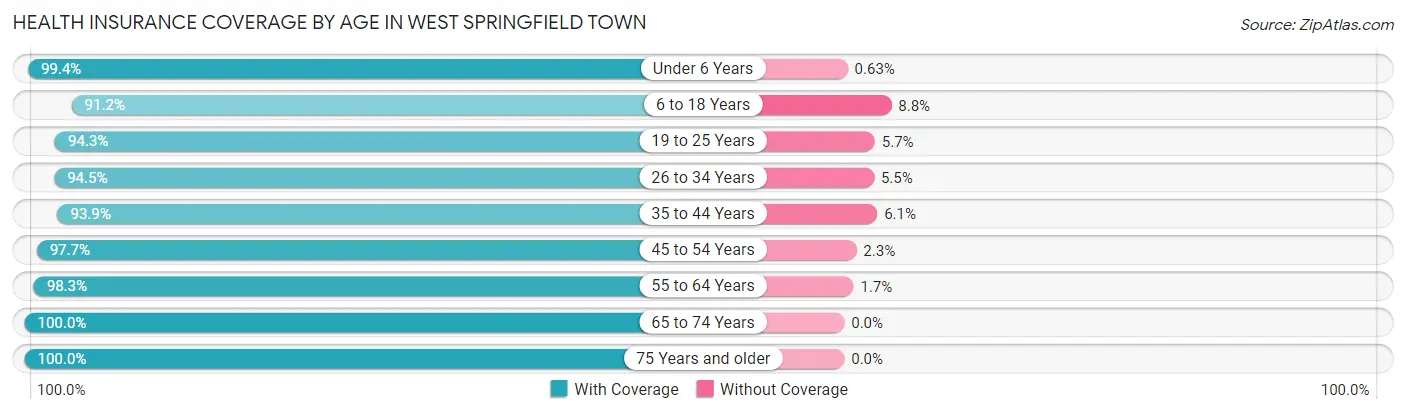
| Age Bracket | With Coverage | Without Coverage |
| Under 6 Years | 1,894 (99.4%) | 12 (0.6%) |
| 6 to 18 Years | 3,407 (91.2%) | 328 (8.8%) |
| 19 to 25 Years | 2,586 (94.3%) | 156 (5.7%) |
| 26 to 34 Years | 4,308 (94.5%) | 252 (5.5%) |
| 35 to 44 Years | 3,514 (93.9%) | 230 (6.1%) |
| 45 to 54 Years | 3,625 (97.7%) | 84 (2.3%) |
| 55 to 64 Years | 3,780 (98.3%) | 66 (1.7%) |
| 65 to 74 Years | 2,665 (100.0%) | 0 (0.0%) |
| 75 Years and older | 1,741 (100.0%) | 0 (0.0%) |
| Total | 27,520 (96.1%) | 1,128 (3.9%) |
Health Insurance Coverage by Citizenship Status in West Springfield Town
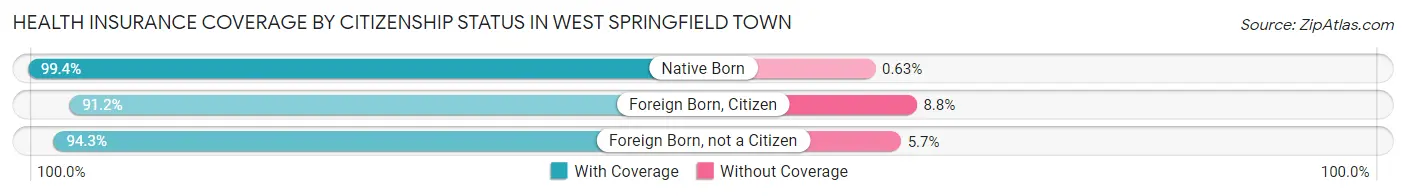
| Citizenship Status | With Coverage | Without Coverage |
| Native Born | 1,894 (99.4%) | 12 (0.6%) |
| Foreign Born, Citizen | 3,407 (91.2%) | 328 (8.8%) |
| Foreign Born, not a Citizen | 2,586 (94.3%) | 156 (5.7%) |
Health Insurance Coverage by Household Income in West Springfield Town
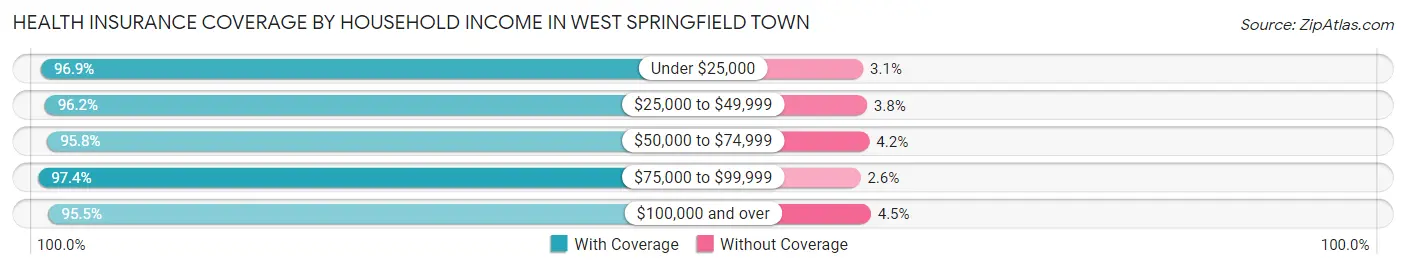
| Household Income | With Coverage | Without Coverage |
| Under $25,000 | 3,383 (96.9%) | 107 (3.1%) |
| $25,000 to $49,999 | 4,235 (96.2%) | 166 (3.8%) |
| $50,000 to $74,999 | 3,682 (95.8%) | 163 (4.2%) |
| $75,000 to $99,999 | 3,573 (97.4%) | 94 (2.6%) |
| $100,000 and over | 12,597 (95.5%) | 592 (4.5%) |
Public vs Private Health Insurance Coverage by Age in West Springfield Town
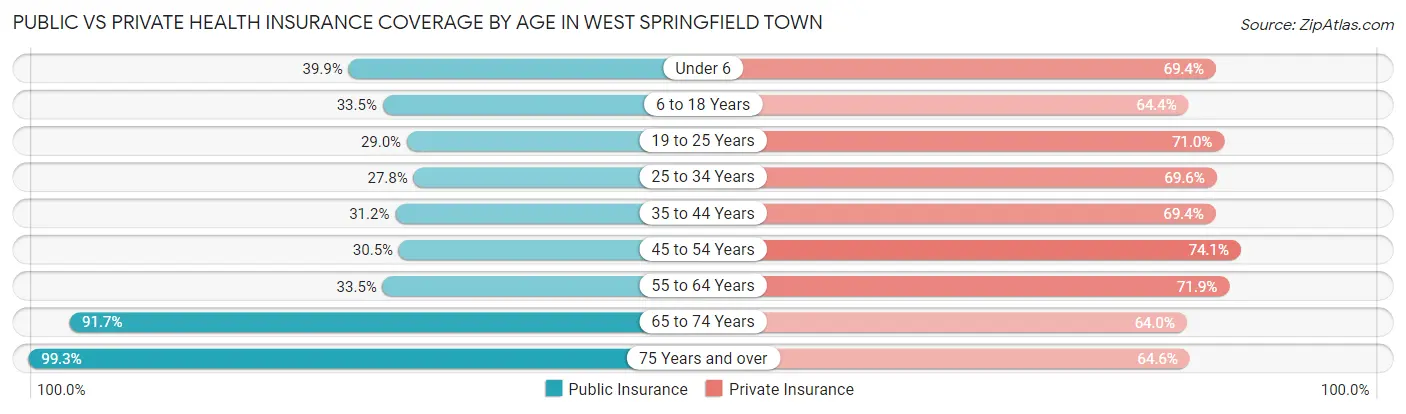
| Age Bracket | Public Insurance | Private Insurance |
| Under 6 | 760 (39.9%) | 1,323 (69.4%) |
| 6 to 18 Years | 1,252 (33.5%) | 2,404 (64.4%) |
| 19 to 25 Years | 796 (29.0%) | 1,946 (71.0%) |
| 25 to 34 Years | 1,268 (27.8%) | 3,172 (69.6%) |
| 35 to 44 Years | 1,168 (31.2%) | 2,597 (69.4%) |
| 45 to 54 Years | 1,132 (30.5%) | 2,747 (74.1%) |
| 55 to 64 Years | 1,290 (33.5%) | 2,765 (71.9%) |
| 65 to 74 Years | 2,445 (91.7%) | 1,706 (64.0%) |
| 75 Years and over | 1,729 (99.3%) | 1,124 (64.6%) |
| Total | 11,840 (41.3%) | 19,784 (69.1%) |
Disability Status by Sex by Age in West Springfield Town
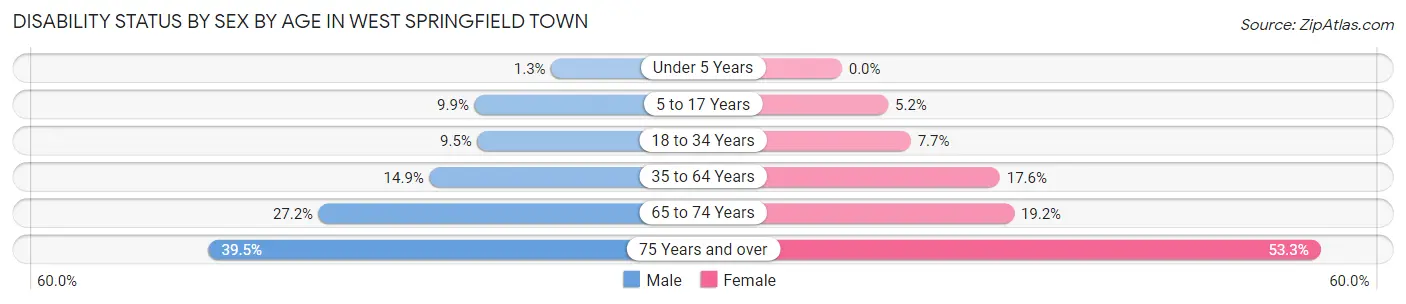
| Age Bracket | Male | Female |
| Under 5 Years | 10 (1.3%) | 0 (0.0%) |
| 5 to 17 Years | 171 (9.9%) | 113 (5.2%) |
| 18 to 34 Years | 366 (9.5%) | 279 (7.7%) |
| 35 to 64 Years | 838 (14.9%) | 998 (17.6%) |
| 65 to 74 Years | 352 (27.2%) | 263 (19.2%) |
| 75 Years and over | 252 (39.5%) | 588 (53.3%) |
Disability Class by Sex by Age in West Springfield Town
Disability Class: Hearing Difficulty
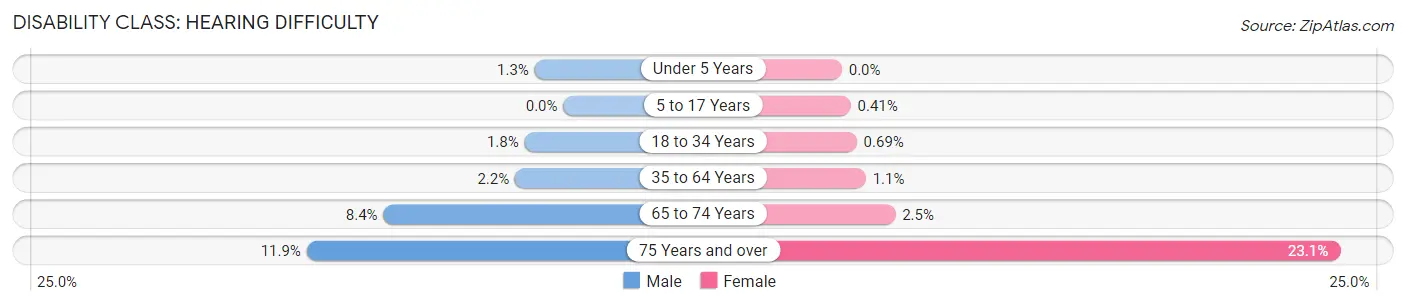
| Age Bracket | Male | Female |
| Under 5 Years | 10 (1.3%) | 0 (0.0%) |
| 5 to 17 Years | 0 (0.0%) | 9 (0.4%) |
| 18 to 34 Years | 69 (1.8%) | 25 (0.7%) |
| 35 to 64 Years | 126 (2.2%) | 63 (1.1%) |
| 65 to 74 Years | 108 (8.4%) | 34 (2.5%) |
| 75 Years and over | 76 (11.9%) | 255 (23.1%) |
Disability Class: Vision Difficulty
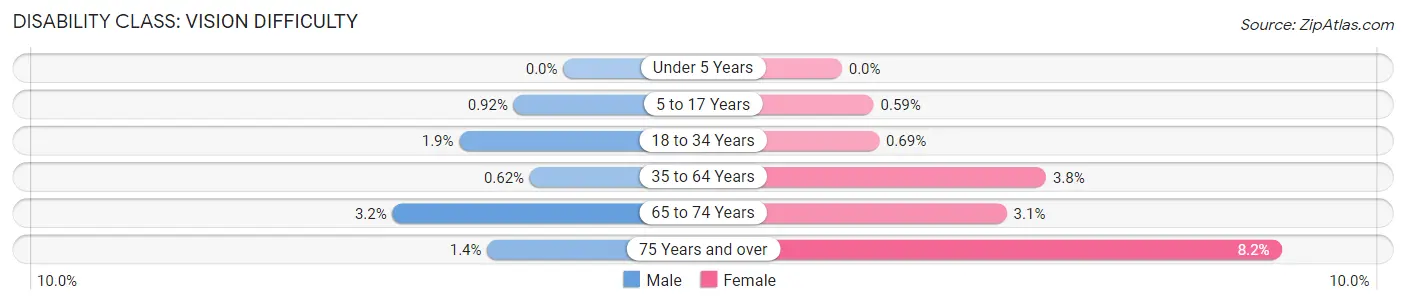
| Age Bracket | Male | Female |
| Under 5 Years | 0 (0.0%) | 0 (0.0%) |
| 5 to 17 Years | 16 (0.9%) | 13 (0.6%) |
| 18 to 34 Years | 74 (1.9%) | 25 (0.7%) |
| 35 to 64 Years | 35 (0.6%) | 215 (3.8%) |
| 65 to 74 Years | 41 (3.2%) | 42 (3.1%) |
| 75 Years and over | 9 (1.4%) | 90 (8.2%) |
Disability Class: Cognitive Difficulty

| Age Bracket | Male | Female |
| 5 to 17 Years | 171 (9.9%) | 104 (4.8%) |
| 18 to 34 Years | 232 (6.0%) | 121 (3.3%) |
| 35 to 64 Years | 354 (6.3%) | 461 (8.1%) |
| 65 to 74 Years | 139 (10.7%) | 38 (2.8%) |
| 75 Years and over | 16 (2.5%) | 166 (15.0%) |
Disability Class: Ambulatory Difficulty
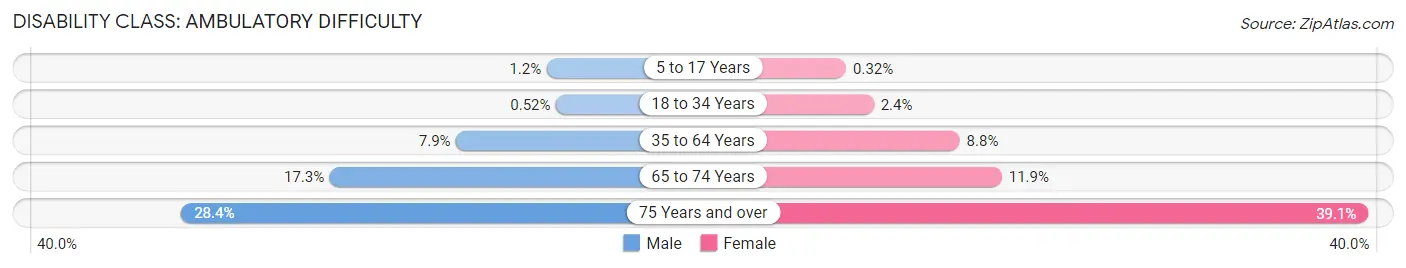
| Age Bracket | Male | Female |
| 5 to 17 Years | 21 (1.2%) | 7 (0.3%) |
| 18 to 34 Years | 20 (0.5%) | 86 (2.4%) |
| 35 to 64 Years | 447 (7.9%) | 496 (8.7%) |
| 65 to 74 Years | 224 (17.3%) | 163 (11.9%) |
| 75 Years and over | 181 (28.4%) | 431 (39.1%) |
Disability Class: Self-Care Difficulty
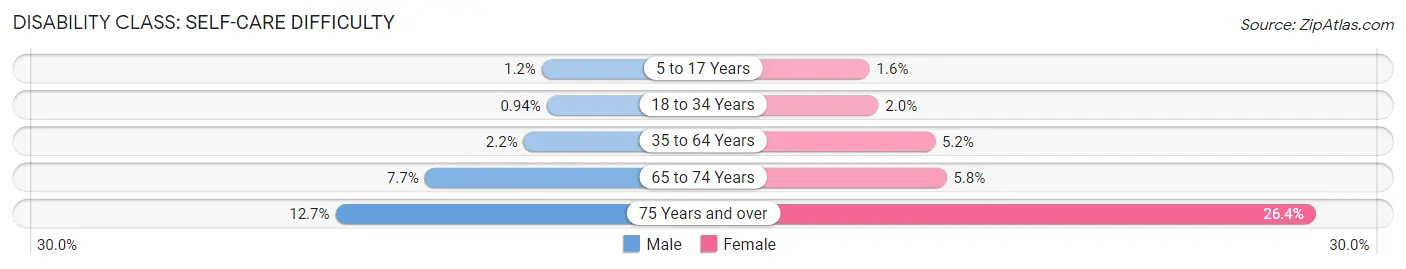
| Age Bracket | Male | Female |
| 5 to 17 Years | 21 (1.2%) | 34 (1.5%) |
| 18 to 34 Years | 36 (0.9%) | 74 (2.0%) |
| 35 to 64 Years | 125 (2.2%) | 294 (5.2%) |
| 65 to 74 Years | 100 (7.7%) | 80 (5.8%) |
| 75 Years and over | 81 (12.7%) | 291 (26.4%) |
Technology Access in West Springfield Town
Computing Device Access in West Springfield Town
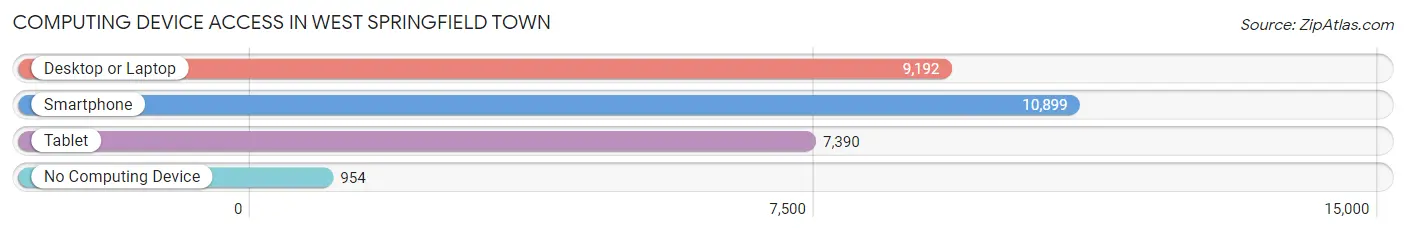
| Device Type | # Households | % Households |
| Desktop or Laptop | 9,192 | 72.4% |
| Smartphone | 10,899 | 85.9% |
| Tablet | 7,390 | 58.2% |
| No Computing Device | 954 | 7.5% |
| Total | 12,691 | 100.0% |
Internet Access in West Springfield Town
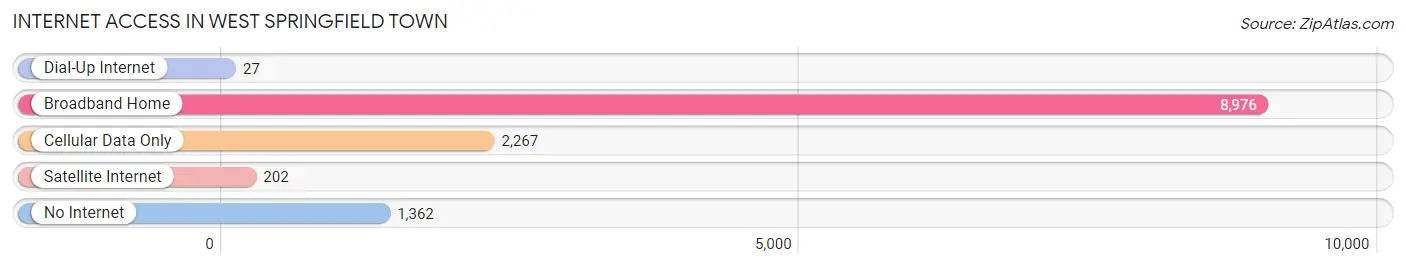
| Internet Type | # Households | % Households |
| Dial-Up Internet | 27 | 0.2% |
| Broadband Home | 8,976 | 70.7% |
| Cellular Data Only | 2,267 | 17.9% |
| Satellite Internet | 202 | 1.6% |
| No Internet | 1,362 | 10.7% |
| Total | 12,691 | 100.0% |
West Springfield Town Summary
West Springfield Town, MA is a town located in Hampden County, Massachusetts. It is part of the Springfield, Massachusetts Metropolitan Statistical Area. The town has a population of 28,391 as of the 2010 census.
History
West Springfield Town was first settled in 1636 by William Pynchon, a prominent English settler. The town was originally part of Springfield, Massachusetts, but was incorporated as its own town in 1774. The town was named after the English city of West Springfield, which was the birthplace of Pynchon.
The town was an important agricultural center in the 19th century, and was home to several mills and factories. The town was also home to the West Springfield Armory, which was built in 1837 and served as a military training facility until it was closed in 1968.
Geography
West Springfield Town is located in Hampden County, Massachusetts. It is bordered by the towns of Agawam, Longmeadow, and Springfield to the north, Chicopee to the east, and Westfield to the south. The town is located on the Connecticut River, and is approximately 10 miles north of the city of Springfield.
The town has a total area of 11.3 square miles, of which 11.2 square miles is land and 0.1 square miles is water. The town is located in the Pioneer Valley region of Massachusetts, and is part of the Connecticut River Valley.
Economy
West Springfield Town has a diverse economy, with a mix of manufacturing, retail, and service industries. The town is home to several large employers, including the Big Y supermarket chain, the West Springfield Public Schools, and the West Springfield Town Hall.
The town is also home to several smaller businesses, including restaurants, retail stores, and professional services. The town is also home to several industrial parks, which are home to a variety of manufacturing and distribution companies.
Demographics
As of the 2010 census, West Springfield Town had a population of 28,391. The racial makeup of the town was 87.3% White, 5.2% African American, 0.4% Native American, 2.3% Asian, 0.1% Pacific Islander, 2.2% from other races, and 2.5% from two or more races. Hispanic or Latino of any race were 6.2% of the population.
The median income for a household in the town was $54,945, and the median income for a family was $63,945. The per capita income for the town was $25,945. About 5.2% of families and 7.2% of the population were below the poverty line, including 9.2% of those under age 18 and 5.2% of those age 65 or over.
West Springfield Town is a diverse and vibrant community, with a mix of cultures and backgrounds. The town is home to a variety of businesses, industries, and services, and is a great place to live and work.
Common Questions
What is Per Capita Income in West Springfield Town?
Per Capita income in West Springfield Town is $41,129.
What is the Median Family Income in West Springfield Town?
Median Family Income in West Springfield Town is $93,441.
What is the Median Household income in West Springfield Town?
Median Household Income in West Springfield Town is $67,297.
What is Income or Wage Gap in West Springfield Town?
Income or Wage Gap in West Springfield Town is 28.1%.
Women in West Springfield Town earn 71.9 cents for every dollar earned by a man.
What is Family Income Deficit in West Springfield Town?
Family Income Deficit in West Springfield Town is $8,398.
Families that are below poverty line in West Springfield Town earn $8,398 less on average than the poverty threshold level.
What is Inequality or Gini Index in West Springfield Town?
Inequality or Gini Index in West Springfield Town is 0.46.
What is the Total Population of West Springfield Town?
Total Population of West Springfield Town is 28,755.
What is the Total Male Population of West Springfield Town?
Total Male Population of West Springfield Town is 13,952.
What is the Total Female Population of West Springfield Town?
Total Female Population of West Springfield Town is 14,803.
What is the Ratio of Males per 100 Females in West Springfield Town?
There are 94.25 Males per 100 Females in West Springfield Town.
What is the Ratio of Females per 100 Males in West Springfield Town?
There are 106.10 Females per 100 Males in West Springfield Town.
What is the Median Population Age in West Springfield Town?
Median Population Age in West Springfield Town is 38.7 Years.
What is the Average Family Size in West Springfield Town
Average Family Size in West Springfield Town is 3.0 People.
What is the Average Household Size in West Springfield Town
Average Household Size in West Springfield Town is 2.3 People.
How Large is the Labor Force in West Springfield Town?
There are 16,083 People in the Labor Forcein in West Springfield Town.
What is the Percentage of People in the Labor Force in West Springfield Town?
67.6% of People are in the Labor Force in West Springfield Town.
What is the Unemployment Rate in West Springfield Town?
Unemployment Rate in West Springfield Town is 5.8%.