Zip Codes with the Highest Percentage of Population Employed in Security & Protection in Lynn, MA
RELATED REPORTS & OPTIONS
Security & Protection
Lynn
Compare Zip Codes
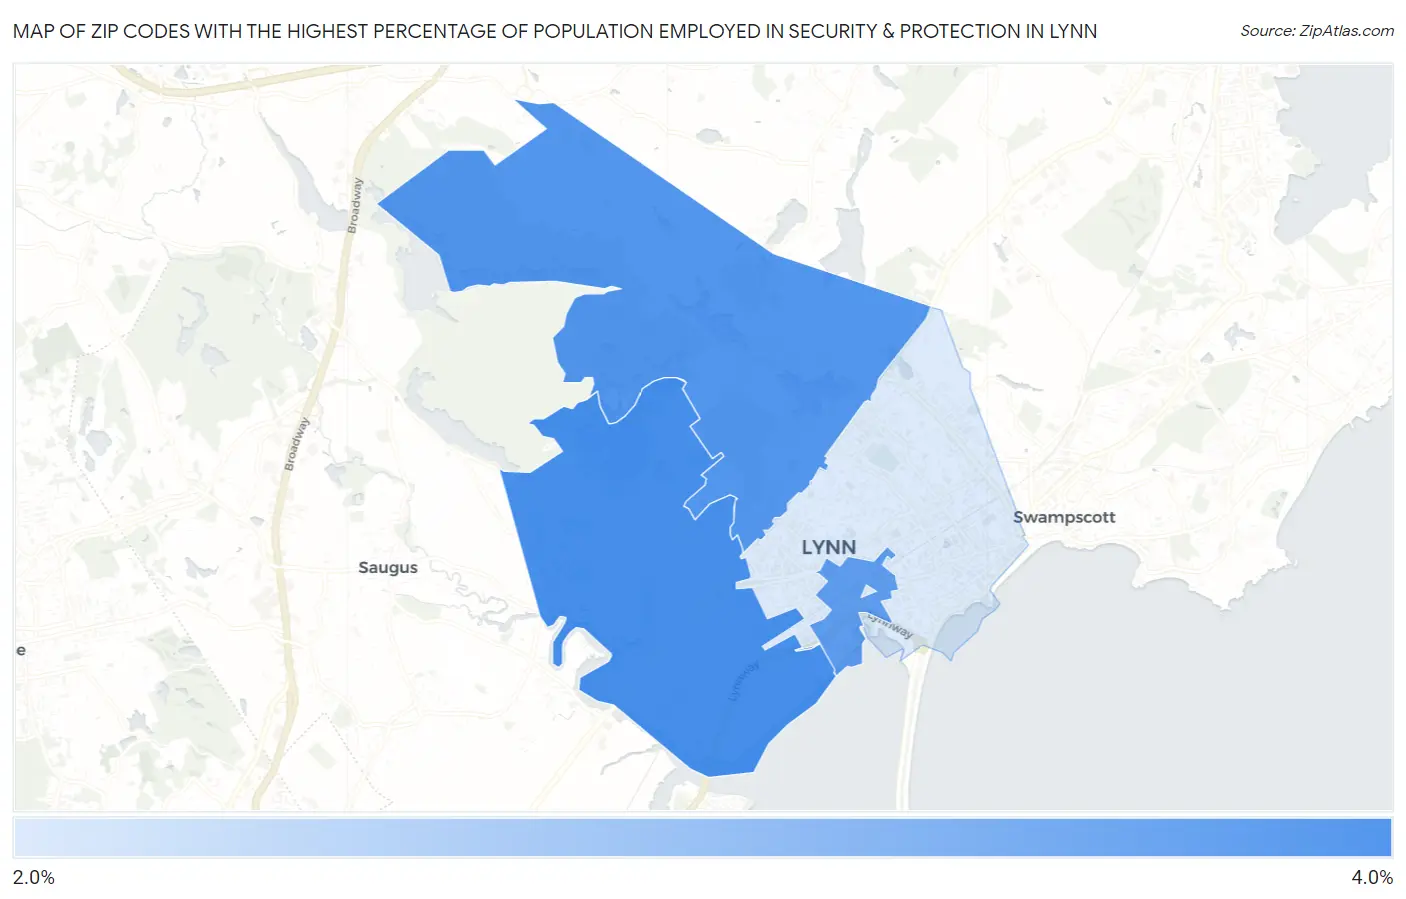
Map of Zip Codes with the Highest Percentage of Population Employed in Security & Protection in Lynn
2.3%
3.9%
Zip Codes with the Highest Percentage of Population Employed in Security & Protection in Lynn, MA
| Zip Code | % Employed | vs State | vs National | |
| 1. | 01905 | 3.9% | 2.0%(+1.84)#45 | 2.1%(+1.70)#4,800 |
| 2. | 01904 | 3.7% | 2.0%(+1.71)#50 | 2.1%(+1.57)#5,095 |
| 3. | 01901 | 3.6% | 2.0%(+1.60)#54 | 2.1%(+1.46)#5,378 |
| 4. | 01902 | 2.3% | 2.0%(+0.245)#181 | 2.1%(+0.111)#10,888 |
1
Common Questions
What are the Top 3 Zip Codes with the Highest Percentage of Population Employed in Security & Protection in Lynn, MA?
Top 3 Zip Codes with the Highest Percentage of Population Employed in Security & Protection in Lynn, MA are:
What zip code has the Highest Percentage of Population Employed in Security & Protection in Lynn, MA?
01905 has the Highest Percentage of Population Employed in Security & Protection in Lynn, MA with 3.9%.
What is the Percentage of Population Employed in Security & Protection in Lynn, MA?
Percentage of Population Employed in Security & Protection in Lynn is 3.0%.
What is the Percentage of Population Employed in Security & Protection in Massachusetts?
Percentage of Population Employed in Security & Protection in Massachusetts is 2.0%.
What is the Percentage of Population Employed in Security & Protection in the United States?
Percentage of Population Employed in Security & Protection in the United States is 2.1%.