Lee, MA Map & Demographics
Lee Map
Lee Overview
$46,136
PER CAPITA INCOME
$107,012
AVG FAMILY INCOME
$78,021
AVG HOUSEHOLD INCOME
68.0%
WAGE / INCOME GAP [ % ]
32.0¢/ $1
WAGE / INCOME GAP [ $ ]
0.37
INEQUALITY / GINI INDEX
1,507
TOTAL POPULATION
832
MALE POPULATION
675
FEMALE POPULATION
123.26
MALES / 100 FEMALES
81.13
FEMALES / 100 MALES
50.0
MEDIAN AGE
2.9
AVG FAMILY SIZE
2.0
AVG HOUSEHOLD SIZE
842
LABOR FORCE [ PEOPLE ]
62.8%
PERCENT IN LABOR FORCE
5.8%
UNEMPLOYMENT RATE
Lee Zip Codes
Lee Area Codes
Income in Lee
Income Overview in Lee
Per Capita Income in Lee is $46,136, while median incomes of families and households are $107,012 and $78,021 respectively.
| Characteristic | Number | Measure |
| Per Capita Income | 1,507 | $46,136 |
| Median Family Income | 332 | $107,012 |
| Mean Family Income | 332 | $113,200 |
| Median Household Income | 696 | $78,021 |
| Mean Household Income | 696 | $94,100 |
| Income Deficit | 332 | $0 |
| Wage / Income Gap (%) | 1,507 | 68.02% |
| Wage / Income Gap ($) | 1,507 | 31.98¢ per $1 |
| Gini / Inequality Index | 1,507 | 0.37 |
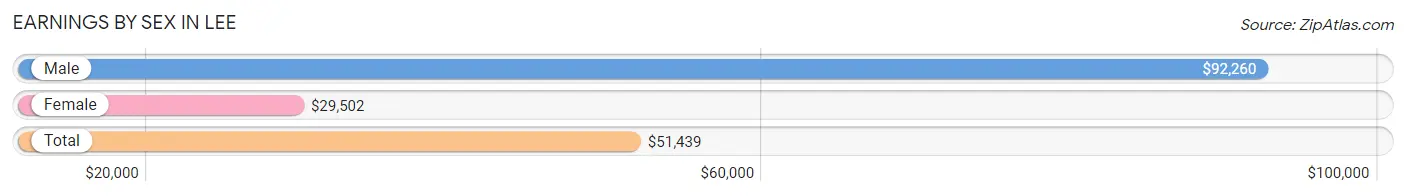
Earnings by Sex in Lee
Average Earnings in Lee are $51,439, $92,260 for men and $29,502 for women, a difference of 68.0%.
| Sex | Number | Average Earnings |
| Male | 515 (59.3%) | $92,260 |
| Female | 353 (40.7%) | $29,502 |
| Total | 868 (100.0%) | $51,439 |
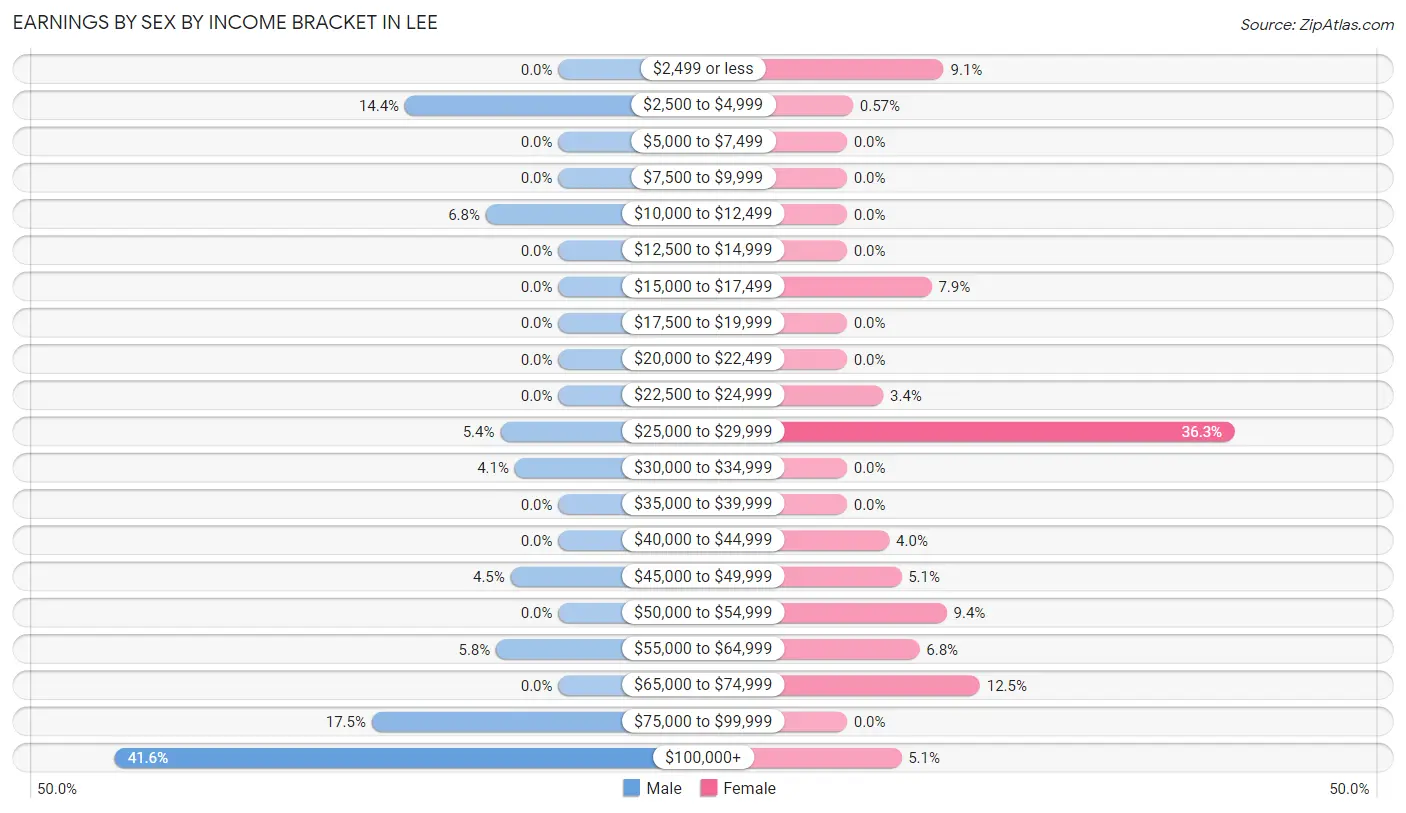
Earnings by Sex by Income Bracket in Lee
The most common earnings brackets in Lee are $100,000+ for men (214 | 41.5%) and $25,000 to $29,999 for women (128 | 36.3%).
| Income | Male | Female |
| $2,499 or less | 0 (0.0%) | 32 (9.1%) |
| $2,500 to $4,999 | 74 (14.4%) | 2 (0.6%) |
| $5,000 to $7,499 | 0 (0.0%) | 0 (0.0%) |
| $7,500 to $9,999 | 0 (0.0%) | 0 (0.0%) |
| $10,000 to $12,499 | 35 (6.8%) | 0 (0.0%) |
| $12,500 to $14,999 | 0 (0.0%) | 0 (0.0%) |
| $15,000 to $17,499 | 0 (0.0%) | 28 (7.9%) |
| $17,500 to $19,999 | 0 (0.0%) | 0 (0.0%) |
| $20,000 to $22,499 | 0 (0.0%) | 0 (0.0%) |
| $22,500 to $24,999 | 0 (0.0%) | 12 (3.4%) |
| $25,000 to $29,999 | 28 (5.4%) | 128 (36.3%) |
| $30,000 to $34,999 | 21 (4.1%) | 0 (0.0%) |
| $35,000 to $39,999 | 0 (0.0%) | 0 (0.0%) |
| $40,000 to $44,999 | 0 (0.0%) | 14 (4.0%) |
| $45,000 to $49,999 | 23 (4.5%) | 18 (5.1%) |
| $50,000 to $54,999 | 0 (0.0%) | 33 (9.3%) |
| $55,000 to $64,999 | 30 (5.8%) | 24 (6.8%) |
| $65,000 to $74,999 | 0 (0.0%) | 44 (12.5%) |
| $75,000 to $99,999 | 90 (17.5%) | 0 (0.0%) |
| $100,000+ | 214 (41.5%) | 18 (5.1%) |
| Total | 515 (100.0%) | 353 (100.0%) |
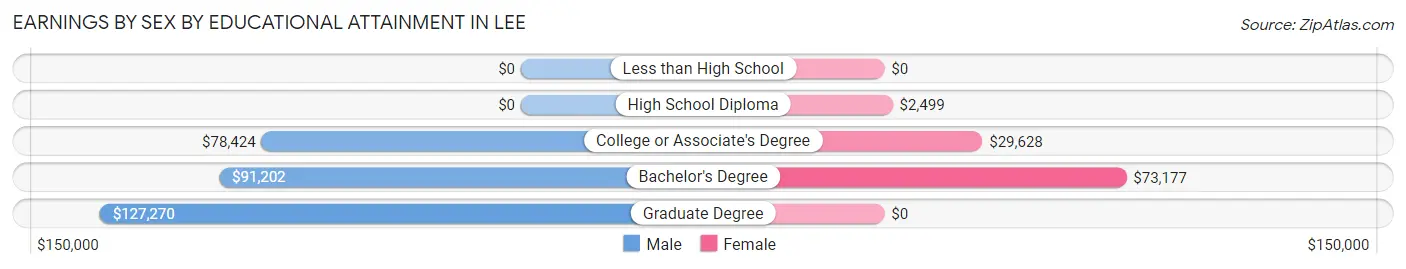
Earnings by Sex by Educational Attainment in Lee
Average earnings in Lee are $97,348 for men and $29,531 for women, a difference of 69.7%. Men with an educational attainment of graduate degree enjoy the highest average annual earnings of $127,270, while those with college or associate's degree education earn the least with $78,424. Women with an educational attainment of bachelor's degree earn the most with the average annual earnings of $73,177, while those with high school diploma education have the smallest earnings of $2,499.
| Educational Attainment | Male Income | Female Income |
| Less than High School | - | - |
| High School Diploma | - | - |
| College or Associate's Degree | $78,424 | $29,628 |
| Bachelor's Degree | $91,202 | $73,177 |
| Graduate Degree | $127,270 | $0 |
| Total | $97,348 | $29,531 |
Family Income in Lee
Family Income Brackets in Lee
According to the Lee family income data, there are 140 families falling into the $100,000 to $149,999 income range, which is the most common income bracket and makes up 42.2% of all families.
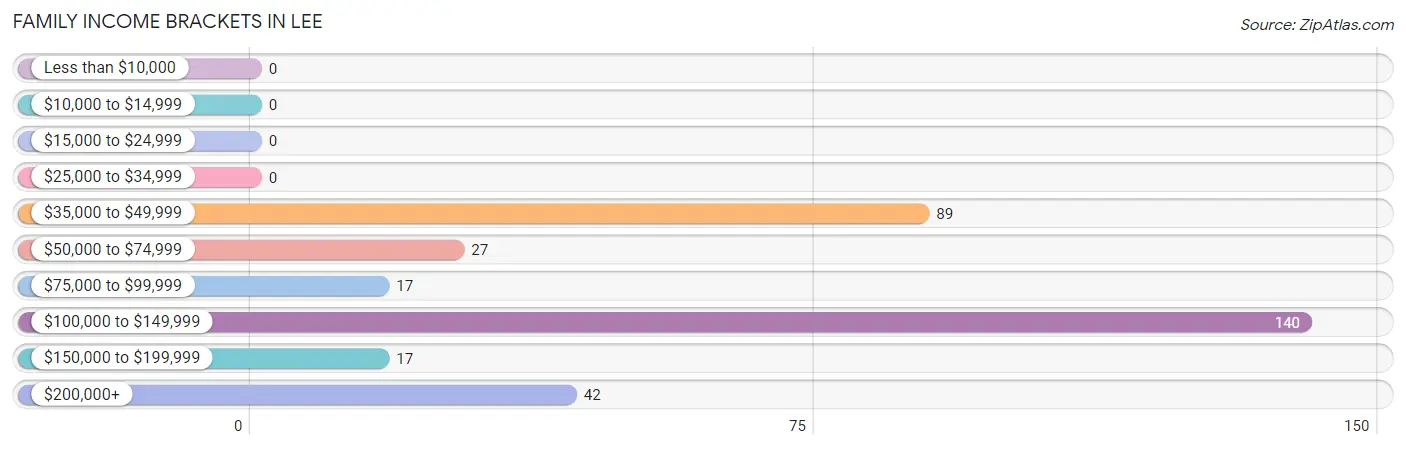
| Income Bracket | # Families | % Families |
| Less than $10,000 | 0 | 0.0% |
| $10,000 to $14,999 | 0 | 0.0% |
| $15,000 to $24,999 | 0 | 0.0% |
| $25,000 to $34,999 | 0 | 0.0% |
| $35,000 to $49,999 | 89 | 26.8% |
| $50,000 to $74,999 | 27 | 8.1% |
| $75,000 to $99,999 | 17 | 5.1% |
| $100,000 to $149,999 | 140 | 42.2% |
| $150,000 to $199,999 | 17 | 5.1% |
| $200,000+ | 42 | 12.7% |
Family Income by Famaliy Size in Lee
2-person families (152 | 45.8%) account for the highest median family income in Lee with $122,115 per family, while 2-person families (152 | 45.8%) have the highest median income of $61,058 per family member.
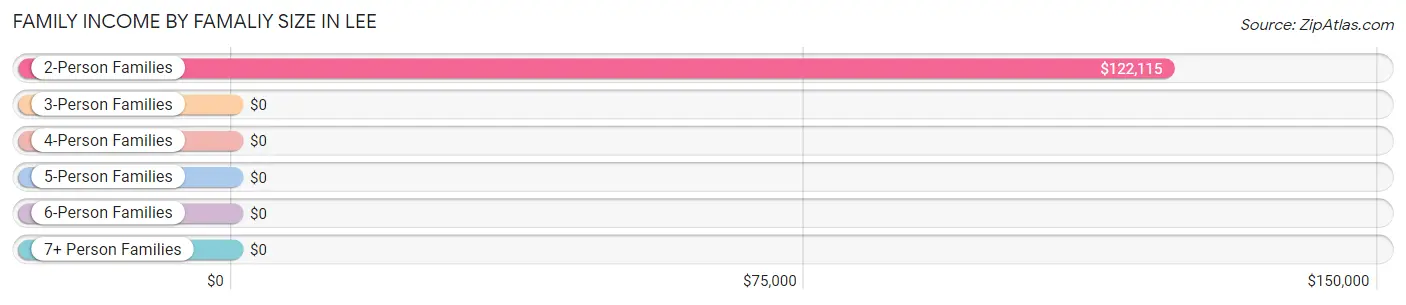
| Income Bracket | # Families | Median Income |
| 2-Person Families | 152 (45.8%) | $122,115 |
| 3-Person Families | 113 (34.0%) | $0 |
| 4-Person Families | 67 (20.2%) | $0 |
| 5-Person Families | 0 (0.0%) | $0 |
| 6-Person Families | 0 (0.0%) | $0 |
| 7+ Person Families | 0 (0.0%) | $0 |
| Total | 332 (100.0%) | $107,012 |
Family Income by Number of Earners in Lee
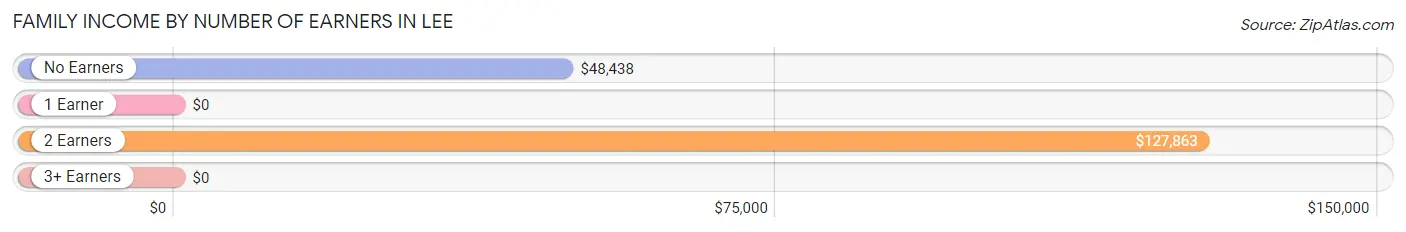
| Number of Earners | # Families | Median Income |
| No Earners | 30 (9.0%) | $48,438 |
| 1 Earner | 108 (32.5%) | $0 |
| 2 Earners | 167 (50.3%) | $127,863 |
| 3+ Earners | 27 (8.1%) | $0 |
| Total | 332 (100.0%) | $107,012 |
Household Income in Lee
Household Income Brackets in Lee
With 163 households falling in the category, the $100,000 to $149,999 income range is the most frequent in Lee, accounting for 23.4% of all households. In contrast, only 19 households (2.7%) fall into the $10,000 to $14,999 income bracket, making it the least populous group.
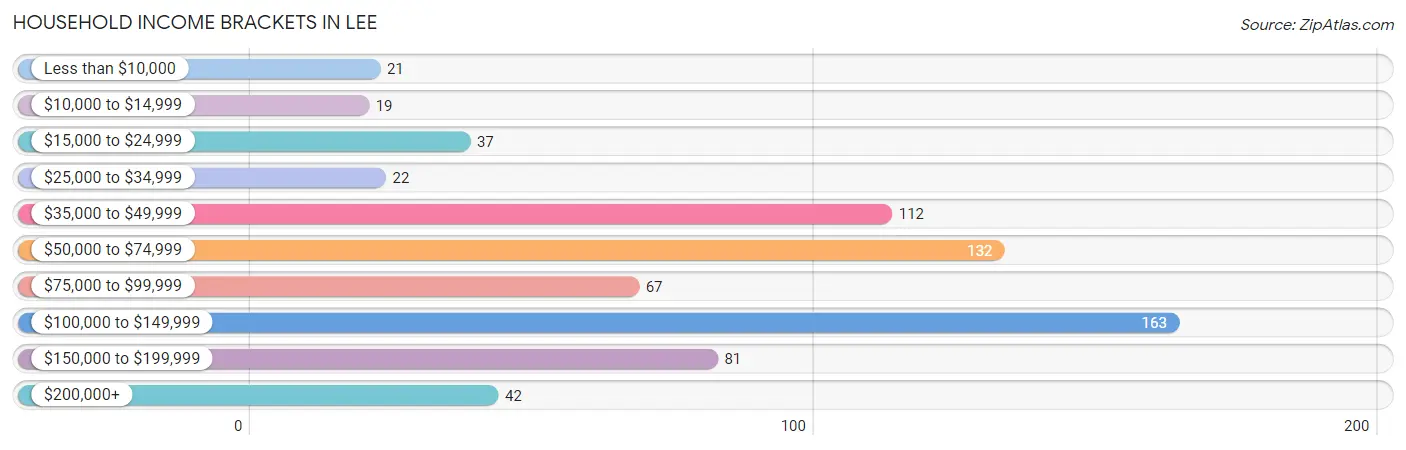
| Income Bracket | # Households | % Households |
| Less than $10,000 | 21 | 3.0% |
| $10,000 to $14,999 | 19 | 2.7% |
| $15,000 to $24,999 | 37 | 5.3% |
| $25,000 to $34,999 | 22 | 3.2% |
| $35,000 to $49,999 | 112 | 16.1% |
| $50,000 to $74,999 | 132 | 19.0% |
| $75,000 to $99,999 | 67 | 9.6% |
| $100,000 to $149,999 | 163 | 23.4% |
| $150,000 to $199,999 | 81 | 11.6% |
| $200,000+ | 42 | 6.0% |
Household Income by Householder Age in Lee
The median household income in Lee is $78,021, with the highest median household income of $120,385 found in the 45 to 64 years age bracket for the primary householder. A total of 224 households (32.2%) fall into this category.
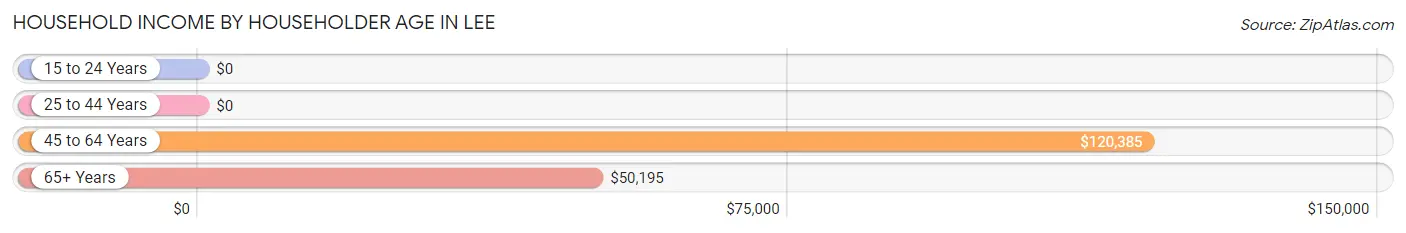
| Income Bracket | # Households | Median Income |
| 15 to 24 Years | 0 (0.0%) | $0 |
| 25 to 44 Years | 155 (22.3%) | $0 |
| 45 to 64 Years | 224 (32.2%) | $120,385 |
| 65+ Years | 317 (45.6%) | $50,195 |
| Total | 696 (100.0%) | $78,021 |
Poverty in Lee
Income Below Poverty by Sex and Age in Lee
With 3.5% poverty level for males and 11.6% for females among the residents of Lee, 55 to 64 year old males and 75 year old and over females are the most vulnerable to poverty, with 23 males (14.6%) and 57 females (51.3%) in their respective age groups living below the poverty level.
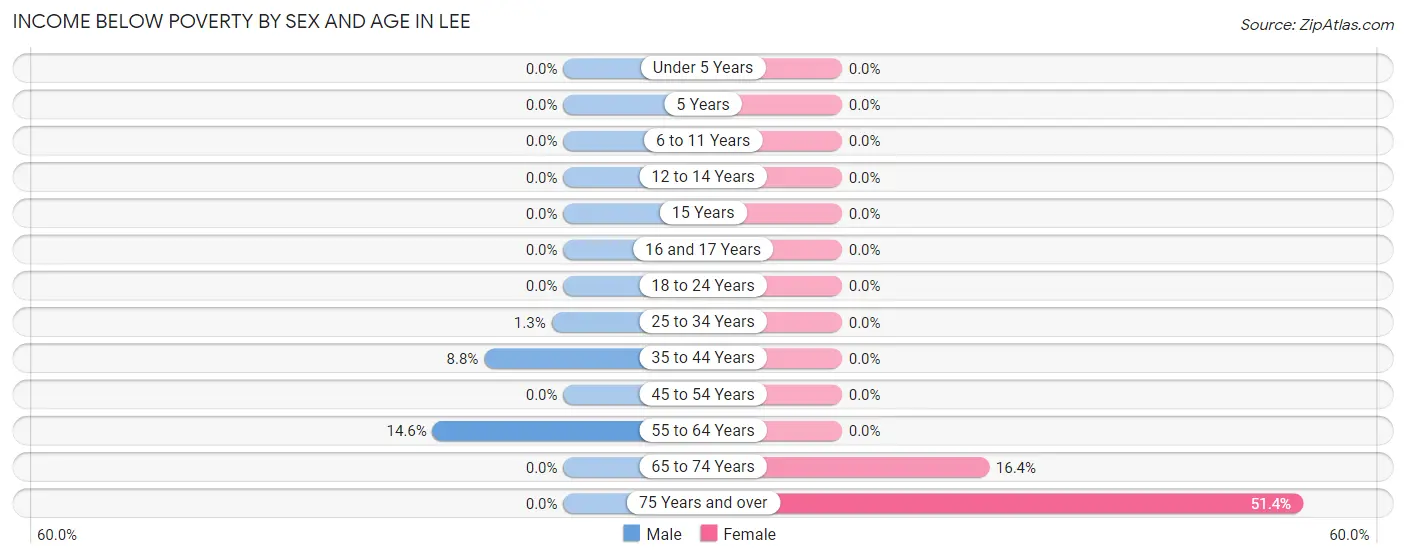
| Age Bracket | Male | Female |
| Under 5 Years | 0 (0.0%) | 0 (0.0%) |
| 5 Years | 0 (0.0%) | 0 (0.0%) |
| 6 to 11 Years | 0 (0.0%) | 0 (0.0%) |
| 12 to 14 Years | 0 (0.0%) | 0 (0.0%) |
| 15 Years | 0 (0.0%) | 0 (0.0%) |
| 16 and 17 Years | 0 (0.0%) | 0 (0.0%) |
| 18 to 24 Years | 0 (0.0%) | 0 (0.0%) |
| 25 to 34 Years | 2 (1.3%) | 0 (0.0%) |
| 35 to 44 Years | 3 (8.8%) | 0 (0.0%) |
| 45 to 54 Years | 0 (0.0%) | 0 (0.0%) |
| 55 to 64 Years | 23 (14.6%) | 0 (0.0%) |
| 65 to 74 Years | 0 (0.0%) | 19 (16.4%) |
| 75 Years and over | 0 (0.0%) | 57 (51.3%) |
| Total | 28 (3.5%) | 76 (11.6%) |
Income Above Poverty by Sex and Age in Lee
According to the poverty statistics in Lee, males aged 6 to 11 years and females aged under 5 years are the age groups that are most secure financially, with 100.0% of males and 100.0% of females in these age groups living above the poverty line.
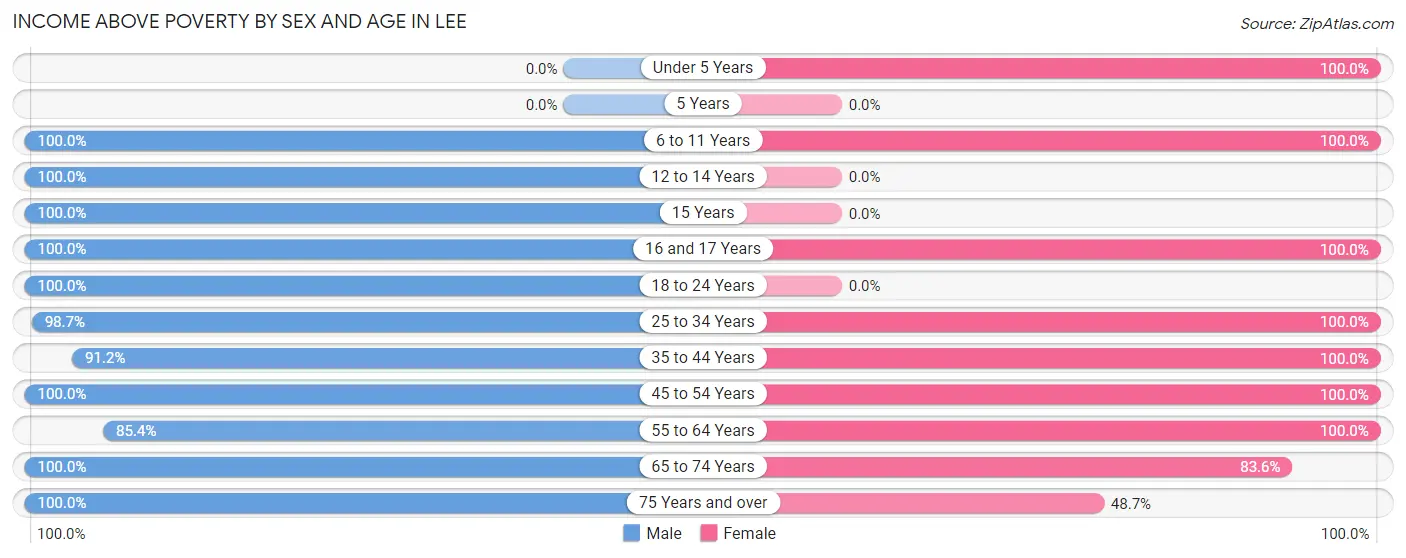
| Age Bracket | Male | Female |
| Under 5 Years | 0 (0.0%) | 19 (100.0%) |
| 5 Years | 0 (0.0%) | 0 (0.0%) |
| 6 to 11 Years | 45 (100.0%) | 17 (100.0%) |
| 12 to 14 Years | 46 (100.0%) | 0 (0.0%) |
| 15 Years | 39 (100.0%) | 0 (0.0%) |
| 16 and 17 Years | 53 (100.0%) | 11 (100.0%) |
| 18 to 24 Years | 41 (100.0%) | 0 (0.0%) |
| 25 to 34 Years | 149 (98.7%) | 113 (100.0%) |
| 35 to 44 Years | 31 (91.2%) | 46 (100.0%) |
| 45 to 54 Years | 38 (100.0%) | 93 (100.0%) |
| 55 to 64 Years | 135 (85.4%) | 128 (100.0%) |
| 65 to 74 Years | 131 (100.0%) | 97 (83.6%) |
| 75 Years and over | 61 (100.0%) | 54 (48.6%) |
| Total | 769 (96.5%) | 578 (88.4%) |
Income Below Poverty Among Married-Couple Families in Lee
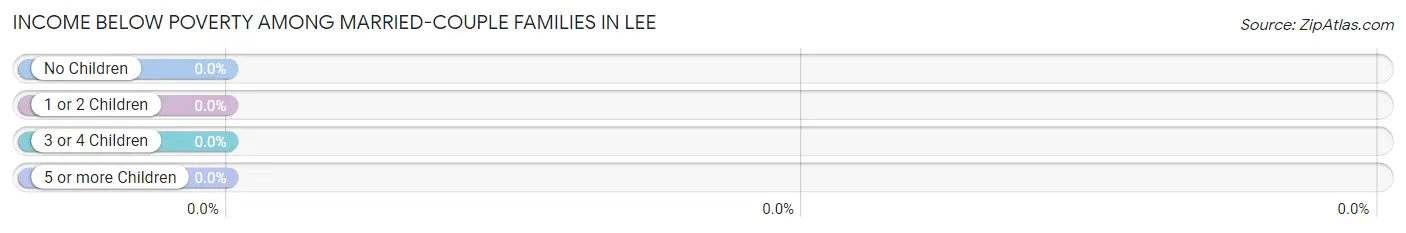
| Children | Above Poverty | Below Poverty |
| No Children | 143 (100.0%) | 0 (0.0%) |
| 1 or 2 Children | 74 (100.0%) | 0 (0.0%) |
| 3 or 4 Children | 0 (0.0%) | 0 (0.0%) |
| 5 or more Children | 0 (0.0%) | 0 (0.0%) |
| Total | 217 (100.0%) | 0 (0.0%) |
Income Below Poverty Among Single-Parent Households in Lee
| Children | Single Father | Single Mother |
| No Children | 0 (0.0%) | 0 (0.0%) |
| 1 or 2 Children | 0 (0.0%) | 0 (0.0%) |
| 3 or 4 Children | 0 (0.0%) | 0 (0.0%) |
| 5 or more Children | 0 (0.0%) | 0 (0.0%) |
| Total | 0 (0.0%) | 0 (0.0%) |
Income Below Poverty Among Married-Couple vs Single-Parent Households in Lee
| Children | Married-Couple Families | Single-Parent Households |
| No Children | 0 (0.0%) | 0 (0.0%) |
| 1 or 2 Children | 0 (0.0%) | 0 (0.0%) |
| 3 or 4 Children | 0 (0.0%) | 0 (0.0%) |
| 5 or more Children | 0 (0.0%) | 0 (0.0%) |
| Total | 0 (0.0%) | 0 (0.0%) |
Race in Lee
The most populous races in Lee are White / Caucasian (1,344 | 89.2%), Asian (105 | 7.0%), and Black / African American (36 | 2.4%).
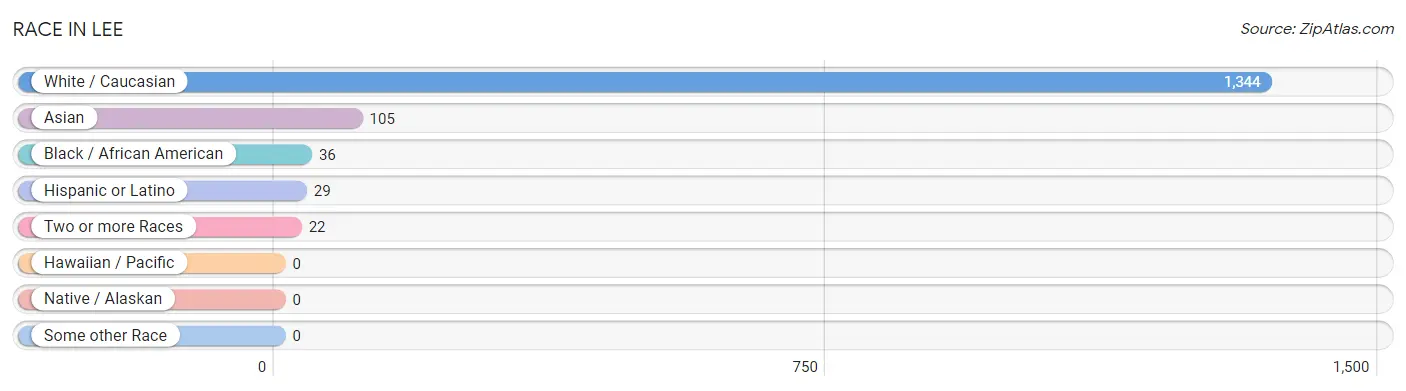
| Race | # Population | % Population |
| Asian | 105 | 7.0% |
| Black / African American | 36 | 2.4% |
| Hawaiian / Pacific | 0 | 0.0% |
| Hispanic or Latino | 29 | 1.9% |
| Native / Alaskan | 0 | 0.0% |
| White / Caucasian | 1,344 | 89.2% |
| Two or more Races | 22 | 1.5% |
| Some other Race | 0 | 0.0% |
| Total | 1,507 | 100.0% |
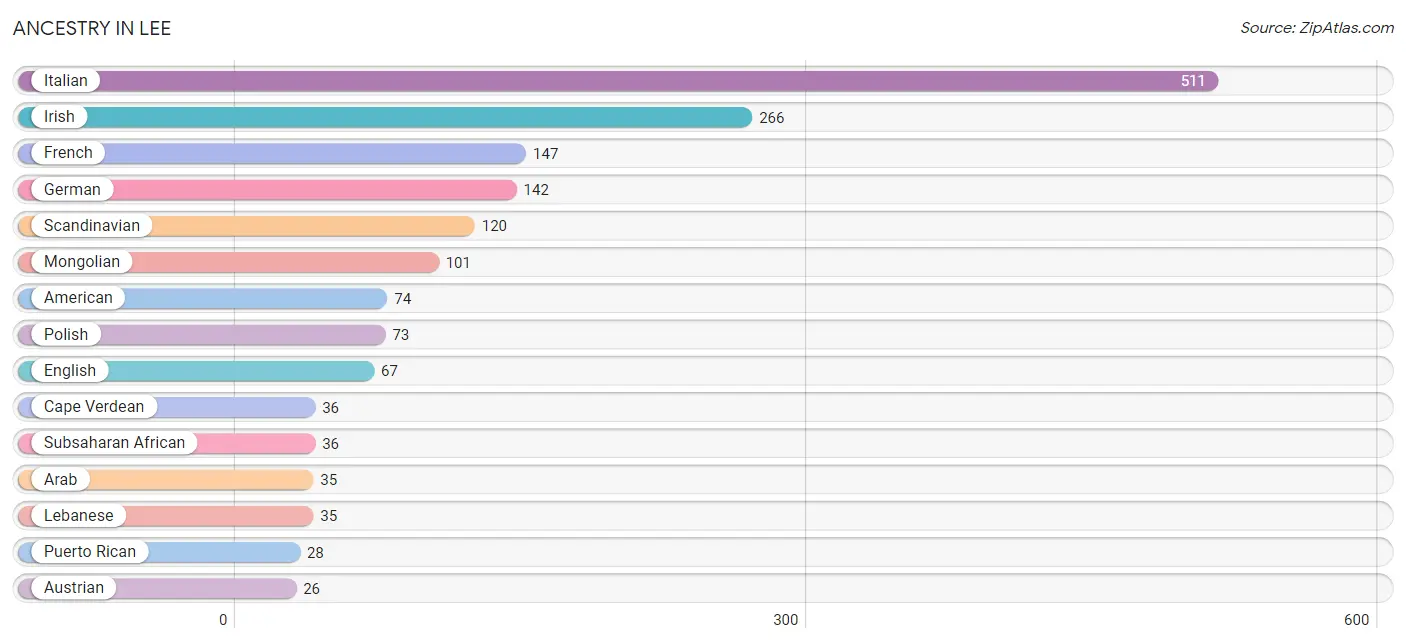
Ancestry in Lee
The most populous ancestries reported in Lee are Italian (511 | 33.9%), Irish (266 | 17.6%), French (147 | 9.8%), German (142 | 9.4%), and Scandinavian (120 | 8.0%), together accounting for 78.7% of all Lee residents.
| Ancestry | # Population | % Population |
| American | 74 | 4.9% |
| Arab | 35 | 2.3% |
| Austrian | 26 | 1.7% |
| Cape Verdean | 36 | 2.4% |
| Eastern European | 19 | 1.3% |
| English | 67 | 4.4% |
| European | 24 | 1.6% |
| French | 147 | 9.8% |
| German | 142 | 9.4% |
| Irish | 266 | 17.6% |
| Italian | 511 | 33.9% |
| Korean | 2 | 0.1% |
| Lebanese | 35 | 2.3% |
| Mongolian | 101 | 6.7% |
| Pakistani | 1 | 0.1% |
| Polish | 73 | 4.8% |
| Puerto Rican | 28 | 1.9% |
| Romanian | 26 | 1.7% |
| Scandinavian | 120 | 8.0% |
| Scotch-Irish | 26 | 1.7% |
| Scottish | 23 | 1.5% |
| Subsaharan African | 36 | 2.4% |
| Swedish | 9 | 0.6% |
| Ukrainian | 19 | 1.3% | View All 24 Rows |
Immigrants in Lee
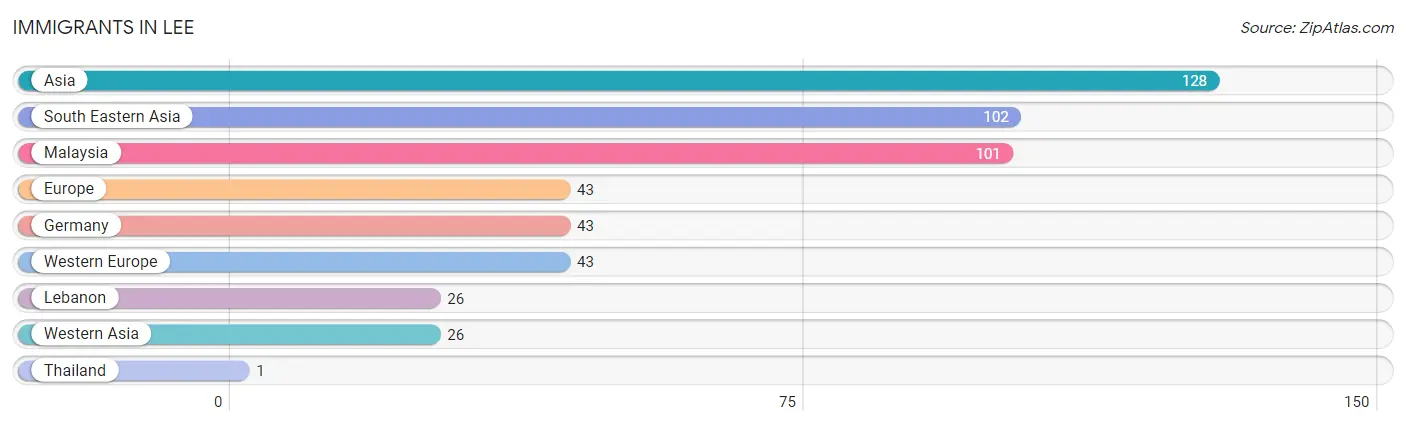
The most numerous immigrant groups reported in Lee came from Asia (128 | 8.5%), South Eastern Asia (102 | 6.8%), Malaysia (101 | 6.7%), Europe (43 | 2.9%), and Germany (43 | 2.9%), together accounting for 27.7% of all Lee residents.
| Immigration Origin | # Population | % Population |
| Asia | 128 | 8.5% |
| Europe | 43 | 2.9% |
| Germany | 43 | 2.9% |
| Lebanon | 26 | 1.7% |
| Malaysia | 101 | 6.7% |
| South Eastern Asia | 102 | 6.8% |
| Thailand | 1 | 0.1% |
| Western Asia | 26 | 1.7% |
| Western Europe | 43 | 2.9% | View All 9 Rows |
Sex and Age in Lee
Sex and Age in Lee
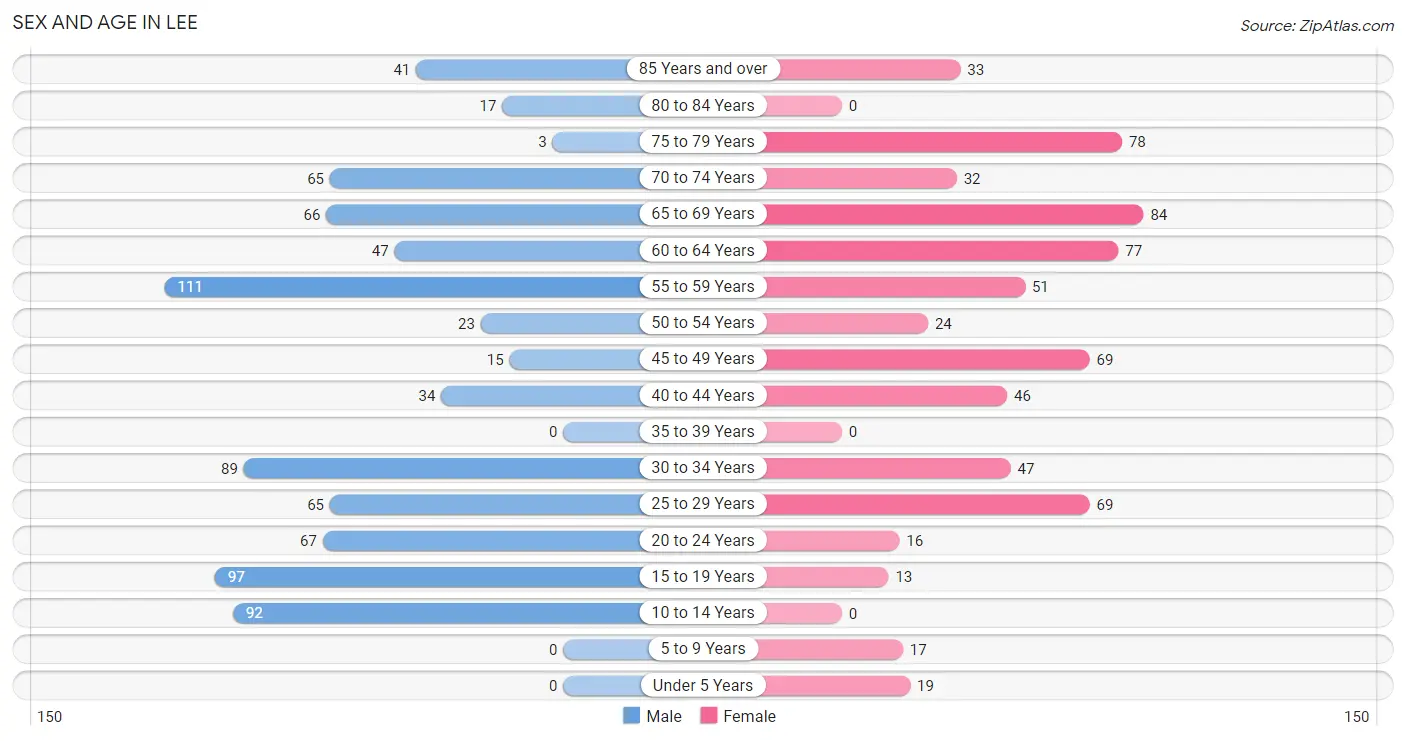
The most populous age groups in Lee are 55 to 59 Years (111 | 13.3%) for men and 65 to 69 Years (84 | 12.4%) for women.
| Age Bracket | Male | Female |
| Under 5 Years | 0 (0.0%) | 19 (2.8%) |
| 5 to 9 Years | 0 (0.0%) | 17 (2.5%) |
| 10 to 14 Years | 92 (11.1%) | 0 (0.0%) |
| 15 to 19 Years | 97 (11.7%) | 13 (1.9%) |
| 20 to 24 Years | 67 (8.1%) | 16 (2.4%) |
| 25 to 29 Years | 65 (7.8%) | 69 (10.2%) |
| 30 to 34 Years | 89 (10.7%) | 47 (7.0%) |
| 35 to 39 Years | 0 (0.0%) | 0 (0.0%) |
| 40 to 44 Years | 34 (4.1%) | 46 (6.8%) |
| 45 to 49 Years | 15 (1.8%) | 69 (10.2%) |
| 50 to 54 Years | 23 (2.8%) | 24 (3.6%) |
| 55 to 59 Years | 111 (13.3%) | 51 (7.6%) |
| 60 to 64 Years | 47 (5.7%) | 77 (11.4%) |
| 65 to 69 Years | 66 (7.9%) | 84 (12.4%) |
| 70 to 74 Years | 65 (7.8%) | 32 (4.7%) |
| 75 to 79 Years | 3 (0.4%) | 78 (11.6%) |
| 80 to 84 Years | 17 (2.0%) | 0 (0.0%) |
| 85 Years and over | 41 (4.9%) | 33 (4.9%) |
| Total | 832 (100.0%) | 675 (100.0%) |
Families and Households in Lee
Median Family Size in Lee
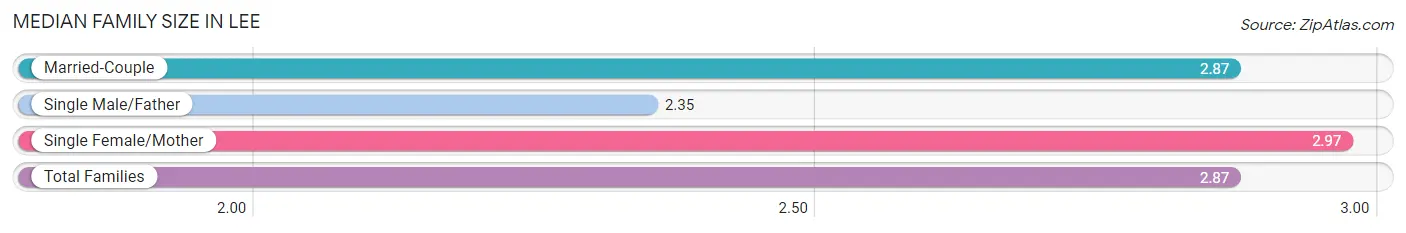
The median family size in Lee is 2.87 persons per family, with single female/mother families (98 | 29.5%) accounting for the largest median family size of 2.97 persons per family. On the other hand, single male/father families (17 | 5.1%) represent the smallest median family size with 2.35 persons per family.
| Family Type | # Families | Family Size |
| Married-Couple | 217 (65.4%) | 2.87 |
| Single Male/Father | 17 (5.1%) | 2.35 |
| Single Female/Mother | 98 (29.5%) | 2.97 |
| Total Families | 332 (100.0%) | 2.87 |
Median Household Size in Lee
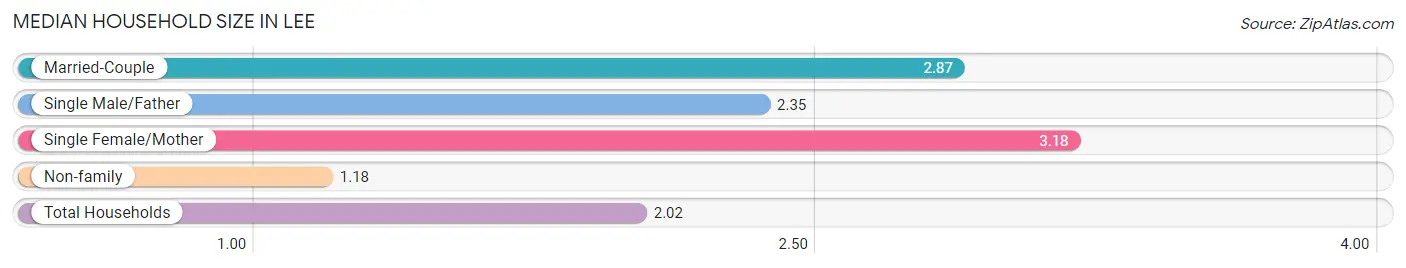
The median household size in Lee is 2.02 persons per household, with single female/mother households (98 | 14.1%) accounting for the largest median household size of 3.18 persons per household. non-family households (364 | 52.3%) represent the smallest median household size with 1.18 persons per household.
| Household Type | # Households | Household Size |
| Married-Couple | 217 (31.2%) | 2.87 |
| Single Male/Father | 17 (2.4%) | 2.35 |
| Single Female/Mother | 98 (14.1%) | 3.18 |
| Non-family | 364 (52.3%) | 1.18 |
| Total Households | 696 (100.0%) | 2.02 |
Household Size by Marriage Status in Lee
Out of a total of 696 households in Lee, 332 (47.7%) are family households, while 364 (52.3%) are nonfamily households. The most numerous type of family households are 3-person households, comprising 144, and the most common type of nonfamily households are 1-person households, comprising 300.
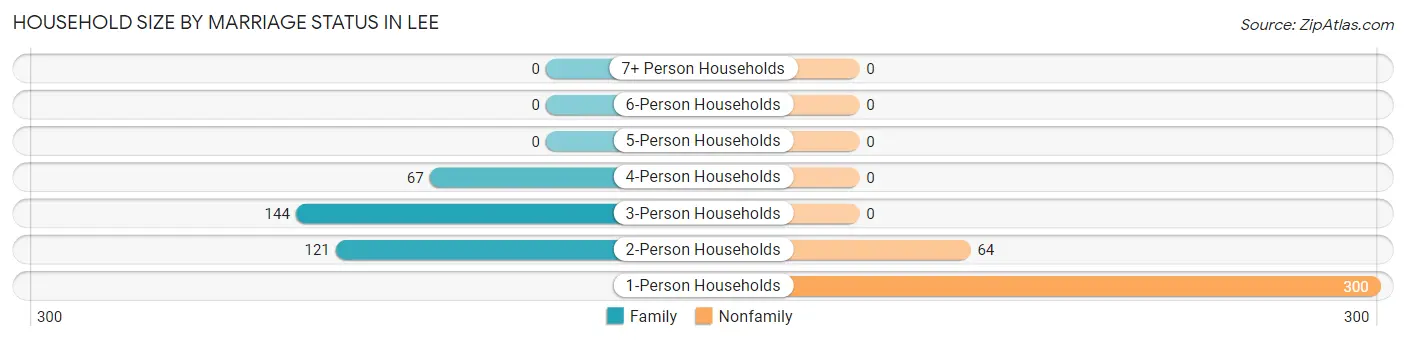
| Household Size | Family Households | Nonfamily Households |
| 1-Person Households | - | 300 (43.1%) |
| 2-Person Households | 121 (17.4%) | 64 (9.2%) |
| 3-Person Households | 144 (20.7%) | 0 (0.0%) |
| 4-Person Households | 67 (9.6%) | 0 (0.0%) |
| 5-Person Households | 0 (0.0%) | 0 (0.0%) |
| 6-Person Households | 0 (0.0%) | 0 (0.0%) |
| 7+ Person Households | 0 (0.0%) | 0 (0.0%) |
| Total | 332 (47.7%) | 364 (52.3%) |
Female Fertility in Lee
Fertility by Age in Lee
| Age Bracket | Women with Births | Births / 1,000 Women |
| 15 to 19 years | 0 (0.0%) | 0.0 |
| 20 to 34 years | 0 (0.0%) | 0.0 |
| 35 to 50 years | 0 (0.0%) | 0.0 |
| Total | 0 (0.0%) | 0.0 |
Fertility by Age by Marriage Status in Lee
| Age Bracket | Married | Unmarried |
| 15 to 19 years | 0 (0.0%) | 0 (0.0%) |
| 20 to 34 years | 0 (0.0%) | 0 (0.0%) |
| 35 to 50 years | 0 (0.0%) | 0 (0.0%) |
| Total | 0 (0.0%) | 0 (0.0%) |
Fertility by Education in Lee
| Educational Attainment | Women with Births | Births / 1,000 Women |
| Less than High School | 0 (0.0%) | 0.0 |
| High School Diploma | 0 (0.0%) | 0.0 |
| College or Associate's Degree | 0 (0.0%) | 0.0 |
| Bachelor's Degree | 0 (0.0%) | 0.0 |
| Graduate Degree | 0 (0.0%) | 0.0 |
| Total | 0 (0.0%) | 0.0 |
Fertility by Education by Marriage Status in Lee
| Educational Attainment | Married | Unmarried |
| Less than High School | 0 (0.0%) | 0 (0.0%) |
| High School Diploma | 0 (0.0%) | 0 (0.0%) |
| College or Associate's Degree | 0 (0.0%) | 0 (0.0%) |
| Bachelor's Degree | 0 (0.0%) | 0 (0.0%) |
| Graduate Degree | 0 (0.0%) | 0 (0.0%) |
| Total | 0 (0.0%) | 0 (0.0%) |
Employment Characteristics in Lee
Employment by Class of Employer in Lee
Among the 793 employed individuals in Lee, private company employees (389 | 49.0%), not-for-profit organizations (198 | 25.0%), and state government employees (95 | 12.0%) make up the most common classes of employment.
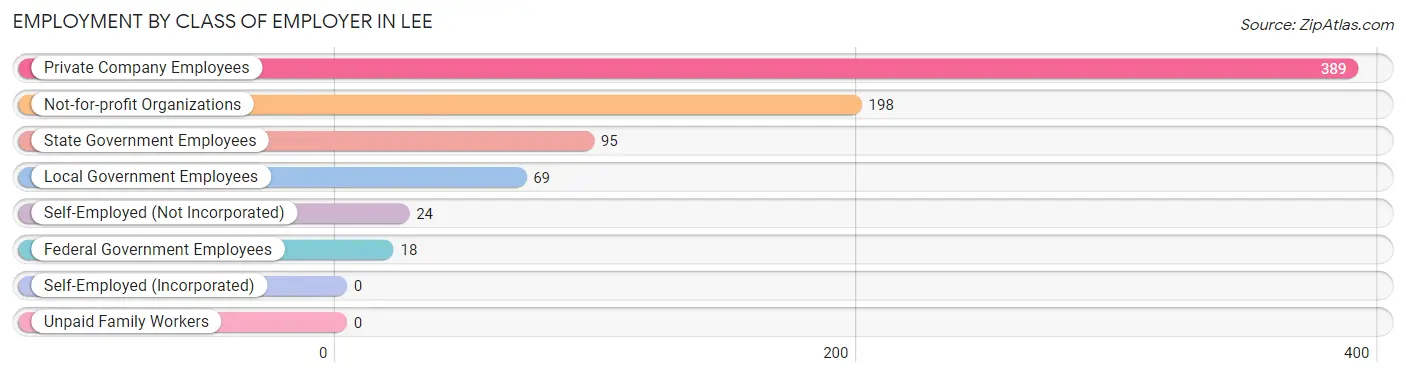
| Employer Class | # Employees | % Employees |
| Private Company Employees | 389 | 49.0% |
| Self-Employed (Incorporated) | 0 | 0.0% |
| Self-Employed (Not Incorporated) | 24 | 3.0% |
| Not-for-profit Organizations | 198 | 25.0% |
| Local Government Employees | 69 | 8.7% |
| State Government Employees | 95 | 12.0% |
| Federal Government Employees | 18 | 2.3% |
| Unpaid Family Workers | 0 | 0.0% |
| Total | 793 | 100.0% |
Employment Status by Age in Lee
According to the labor force statistics for Lee, out of the total population over 16 years of age (1,340), 62.8% or 842 individuals are in the labor force, with 5.8% or 49 of them unemployed. The age group with the highest labor force participation rate is 55 to 59 years, with 100.0% or 162 individuals in the labor force. Within the labor force, the 55 to 59 years age range has the highest percentage of unemployed individuals, with 19.1% or 31 of them being unemployed.
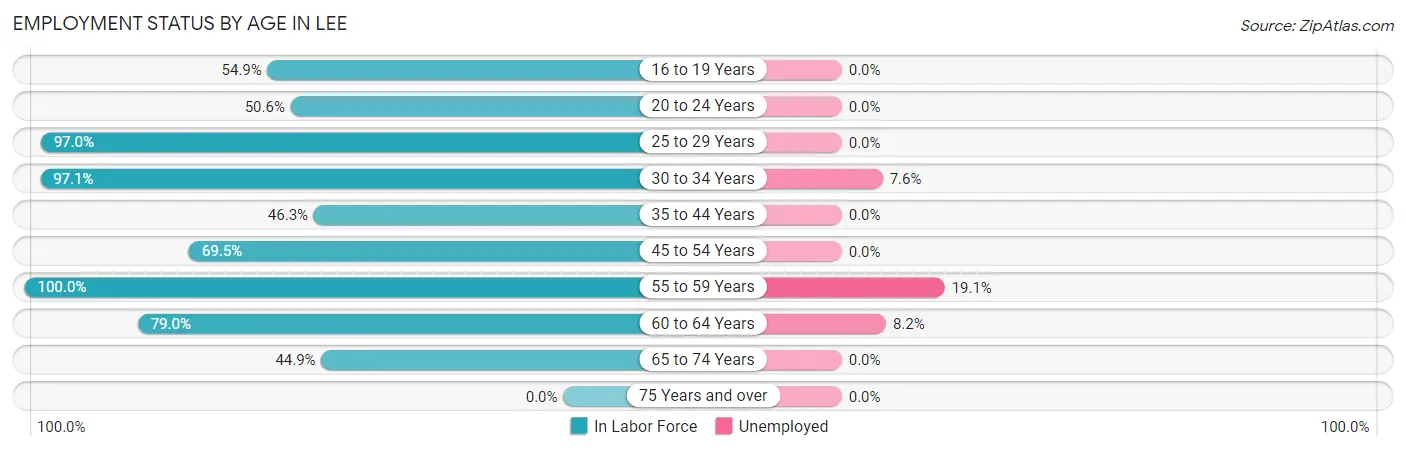
| Age Bracket | In Labor Force | Unemployed |
| 16 to 19 Years | 39 (54.9%) | 0 (0.0%) |
| 20 to 24 Years | 42 (50.6%) | 0 (0.0%) |
| 25 to 29 Years | 130 (97.0%) | 0 (0.0%) |
| 30 to 34 Years | 132 (97.1%) | 10 (7.6%) |
| 35 to 44 Years | 37 (46.3%) | 0 (0.0%) |
| 45 to 54 Years | 91 (69.5%) | 0 (0.0%) |
| 55 to 59 Years | 162 (100.0%) | 31 (19.1%) |
| 60 to 64 Years | 98 (79.0%) | 8 (8.2%) |
| 65 to 74 Years | 111 (44.9%) | 0 (0.0%) |
| 75 Years and over | 0 (0.0%) | 0 (0.0%) |
| Total | 842 (62.8%) | 49 (5.8%) |
Employment Status by Educational Attainment in Lee
According to labor force statistics for Lee, 84.7% of individuals (650) out of the total population between 25 and 64 years of age (767) are in the labor force, with 7.5% or 49 of them being unemployed. The group with the highest labor force participation rate are those with the educational attainment of bachelor's degree or higher, with 95.0% or 341 individuals in the labor force. Within the labor force, individuals with high school diploma education have the highest percentage of unemployment, with 21.7% or 31 of them being unemployed.
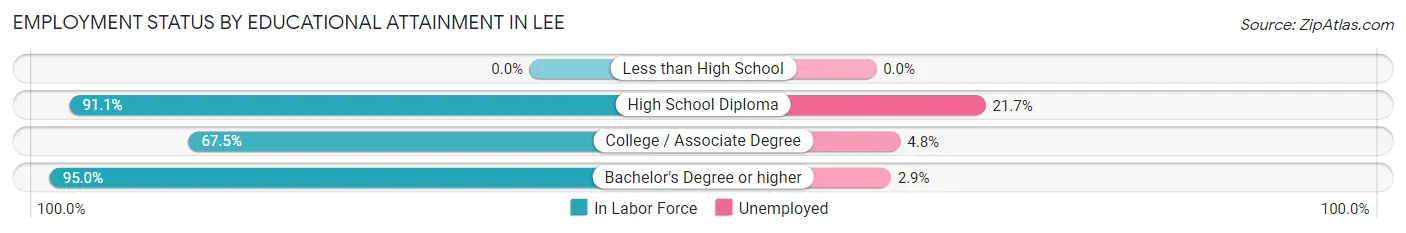
| Educational Attainment | In Labor Force | Unemployed |
| Less than High School | 0 (0.0%) | 0 (0.0%) |
| High School Diploma | 143 (91.1%) | 34 (21.7%) |
| College / Associate Degree | 166 (67.5%) | 12 (4.8%) |
| Bachelor's Degree or higher | 341 (95.0%) | 10 (2.9%) |
| Total | 650 (84.7%) | 58 (7.5%) |
Employment Occupations by Sex in Lee
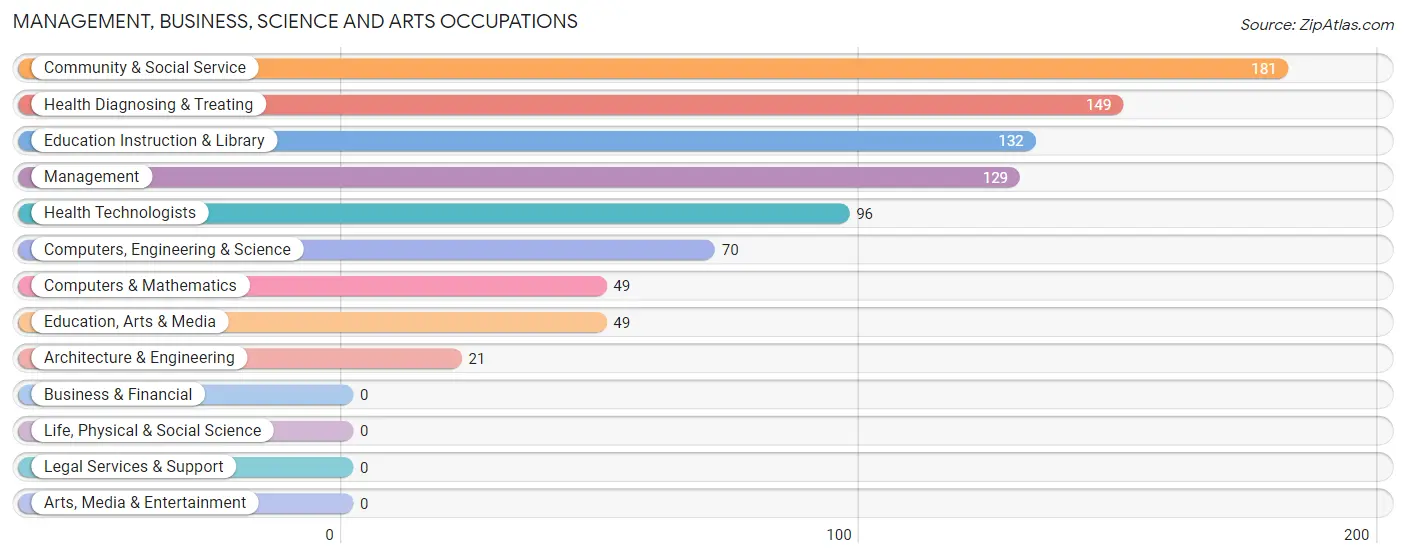
Management, Business, Science and Arts Occupations
The most common Management, Business, Science and Arts occupations in Lee are Community & Social Service (181 | 22.8%), Health Diagnosing & Treating (149 | 18.8%), Education Instruction & Library (132 | 16.7%), Management (129 | 16.3%), and Health Technologists (96 | 12.1%).
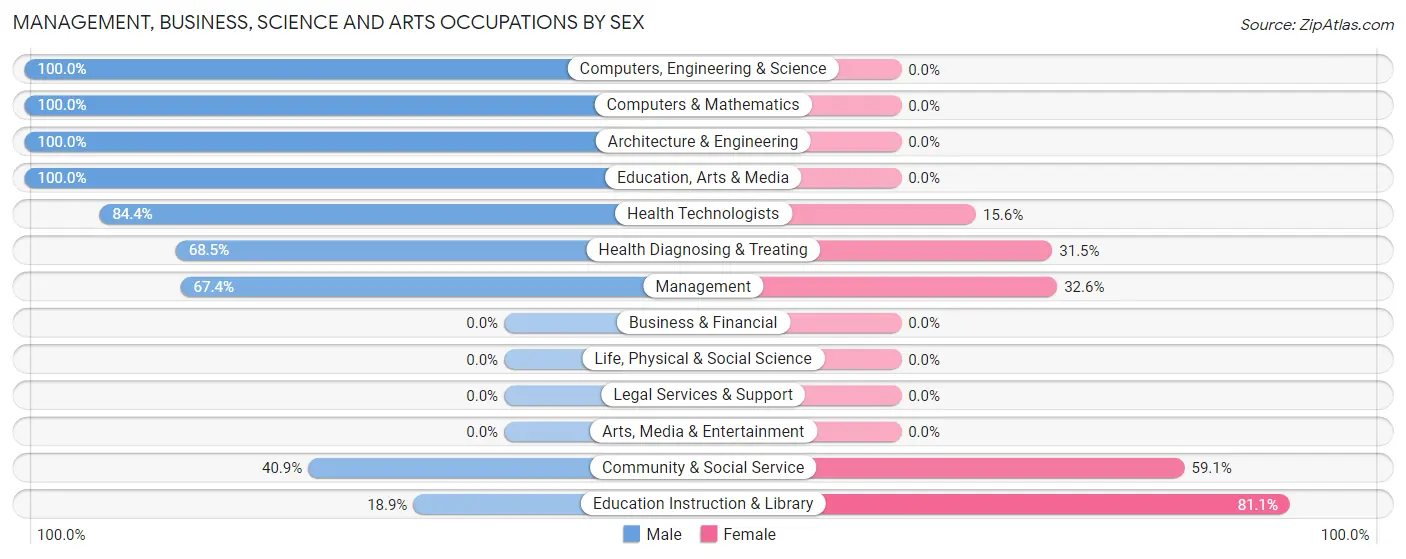
Management, Business, Science and Arts Occupations by Sex
Within the Management, Business, Science and Arts occupations in Lee, the most male-oriented occupations are Computers, Engineering & Science (100.0%), Computers & Mathematics (100.0%), and Architecture & Engineering (100.0%), while the most female-oriented occupations are Education Instruction & Library (81.1%), Community & Social Service (59.1%), and Management (32.6%).
| Occupation | Male | Female |
| Management | 87 (67.4%) | 42 (32.6%) |
| Business & Financial | 0 (0.0%) | 0 (0.0%) |
| Computers, Engineering & Science | 70 (100.0%) | 0 (0.0%) |
| Computers & Mathematics | 49 (100.0%) | 0 (0.0%) |
| Architecture & Engineering | 21 (100.0%) | 0 (0.0%) |
| Life, Physical & Social Science | 0 (0.0%) | 0 (0.0%) |
| Community & Social Service | 74 (40.9%) | 107 (59.1%) |
| Education, Arts & Media | 49 (100.0%) | 0 (0.0%) |
| Legal Services & Support | 0 (0.0%) | 0 (0.0%) |
| Education Instruction & Library | 25 (18.9%) | 107 (81.1%) |
| Arts, Media & Entertainment | 0 (0.0%) | 0 (0.0%) |
| Health Diagnosing & Treating | 102 (68.5%) | 47 (31.5%) |
| Health Technologists | 81 (84.4%) | 15 (15.6%) |
| Total (Category) | 333 (62.9%) | 196 (37.0%) |
| Total (Overall) | 502 (63.3%) | 291 (36.7%) |
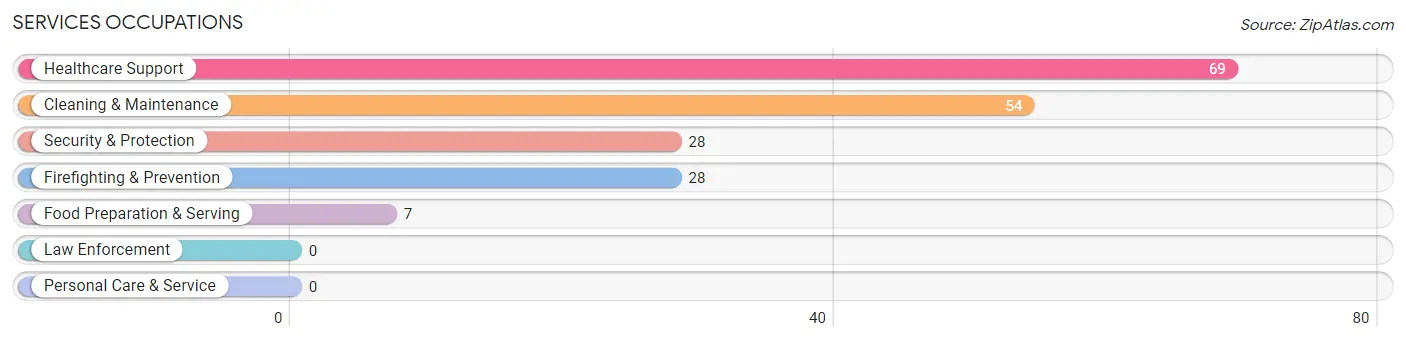
Services Occupations
The most common Services occupations in Lee are Healthcare Support (69 | 8.7%), Cleaning & Maintenance (54 | 6.8%), Security & Protection (28 | 3.5%), Firefighting & Prevention (28 | 3.5%), and Food Preparation & Serving (7 | 0.9%).
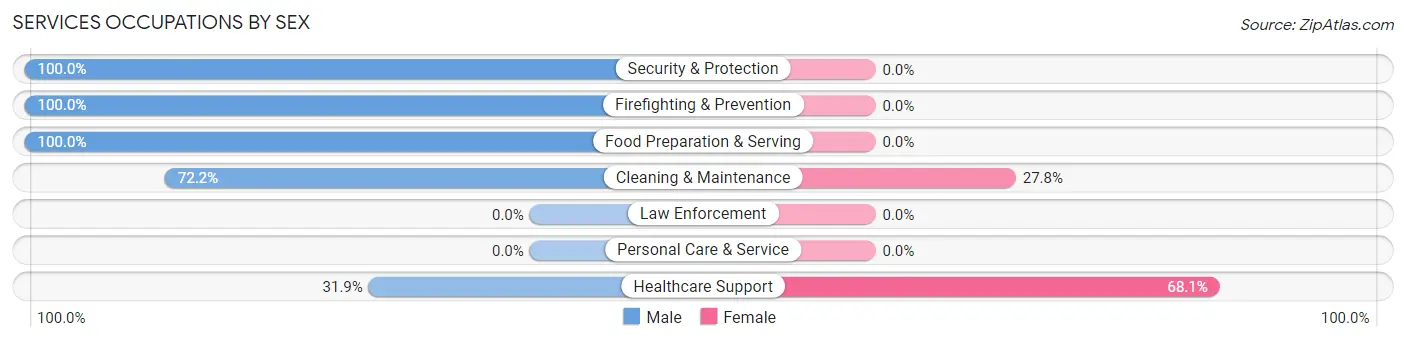
Services Occupations by Sex
Within the Services occupations in Lee, the most male-oriented occupations are Security & Protection (100.0%), Firefighting & Prevention (100.0%), and Food Preparation & Serving (100.0%), while the most female-oriented occupations are Healthcare Support (68.1%), and Cleaning & Maintenance (27.8%).
| Occupation | Male | Female |
| Healthcare Support | 22 (31.9%) | 47 (68.1%) |
| Security & Protection | 28 (100.0%) | 0 (0.0%) |
| Firefighting & Prevention | 28 (100.0%) | 0 (0.0%) |
| Law Enforcement | 0 (0.0%) | 0 (0.0%) |
| Food Preparation & Serving | 7 (100.0%) | 0 (0.0%) |
| Cleaning & Maintenance | 39 (72.2%) | 15 (27.8%) |
| Personal Care & Service | 0 (0.0%) | 0 (0.0%) |
| Total (Category) | 96 (60.8%) | 62 (39.2%) |
| Total (Overall) | 502 (63.3%) | 291 (36.7%) |
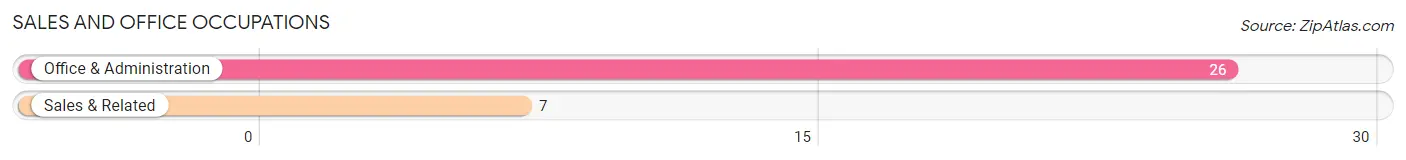
Sales and Office Occupations
The most common Sales and Office occupations in Lee are Office & Administration (26 | 3.3%), and Sales & Related (7 | 0.9%).
Sales and Office Occupations by Sex
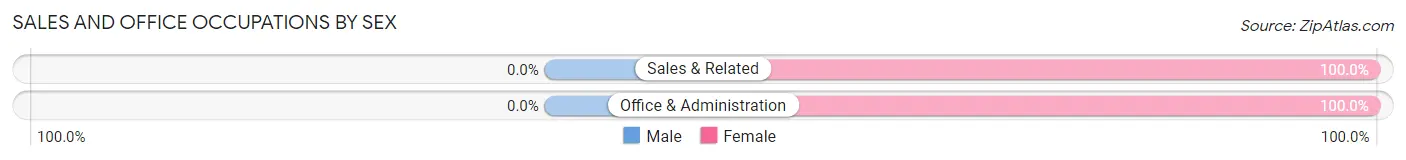
| Occupation | Male | Female |
| Sales & Related | 0 (0.0%) | 7 (100.0%) |
| Office & Administration | 0 (0.0%) | 26 (100.0%) |
| Total (Category) | 0 (0.0%) | 33 (100.0%) |
| Total (Overall) | 502 (63.3%) | 291 (36.7%) |
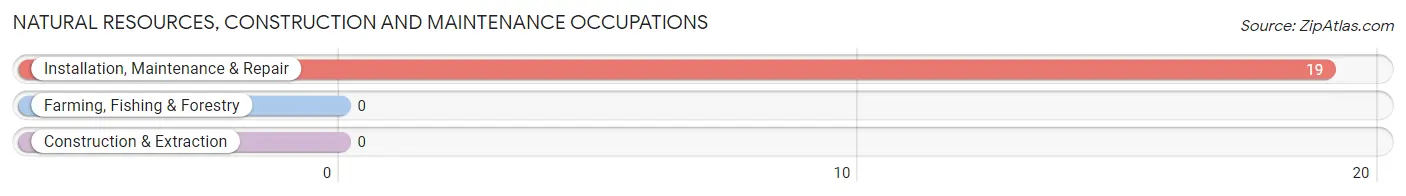
Natural Resources, Construction and Maintenance Occupations
The most common Natural Resources, Construction and Maintenance occupations in Lee are , and Installation, Maintenance & Repair (19 | 2.4%).
Natural Resources, Construction and Maintenance Occupations by Sex
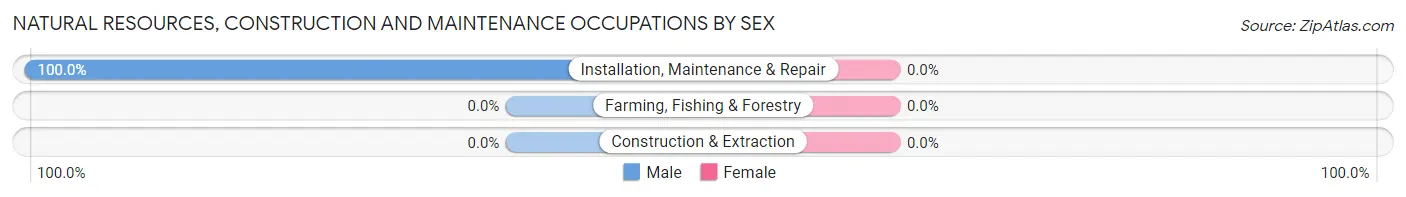
| Occupation | Male | Female |
| Farming, Fishing & Forestry | 0 (0.0%) | 0 (0.0%) |
| Construction & Extraction | 0 (0.0%) | 0 (0.0%) |
| Installation, Maintenance & Repair | 19 (100.0%) | 0 (0.0%) |
| Total (Category) | 19 (100.0%) | 0 (0.0%) |
| Total (Overall) | 502 (63.3%) | 291 (36.7%) |
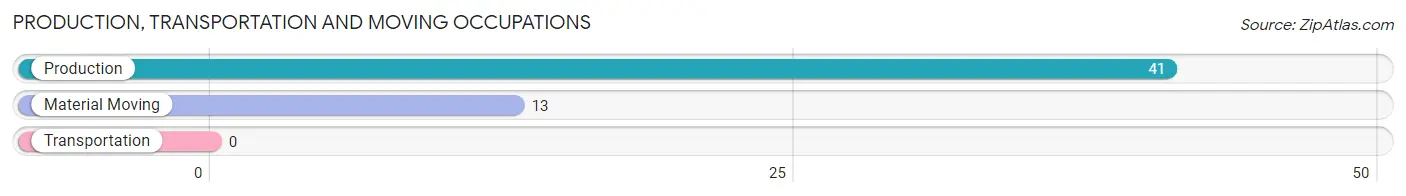
Production, Transportation and Moving Occupations
The most common Production, Transportation and Moving occupations in Lee are Production (41 | 5.2%), and Material Moving (13 | 1.6%).
Production, Transportation and Moving Occupations by Sex
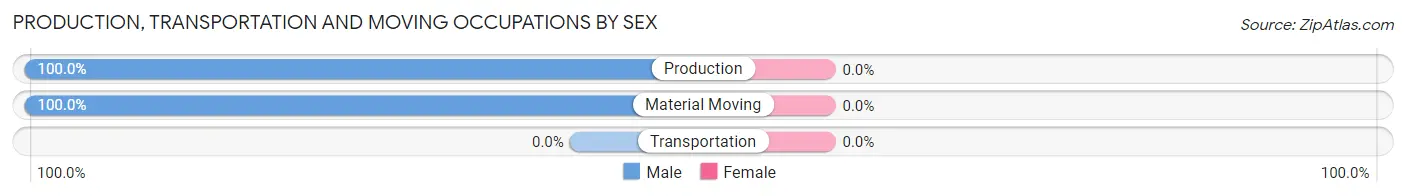
| Occupation | Male | Female |
| Production | 41 (100.0%) | 0 (0.0%) |
| Transportation | 0 (0.0%) | 0 (0.0%) |
| Material Moving | 13 (100.0%) | 0 (0.0%) |
| Total (Category) | 54 (100.0%) | 0 (0.0%) |
| Total (Overall) | 502 (63.3%) | 291 (36.7%) |
Employment Industries by Sex in Lee
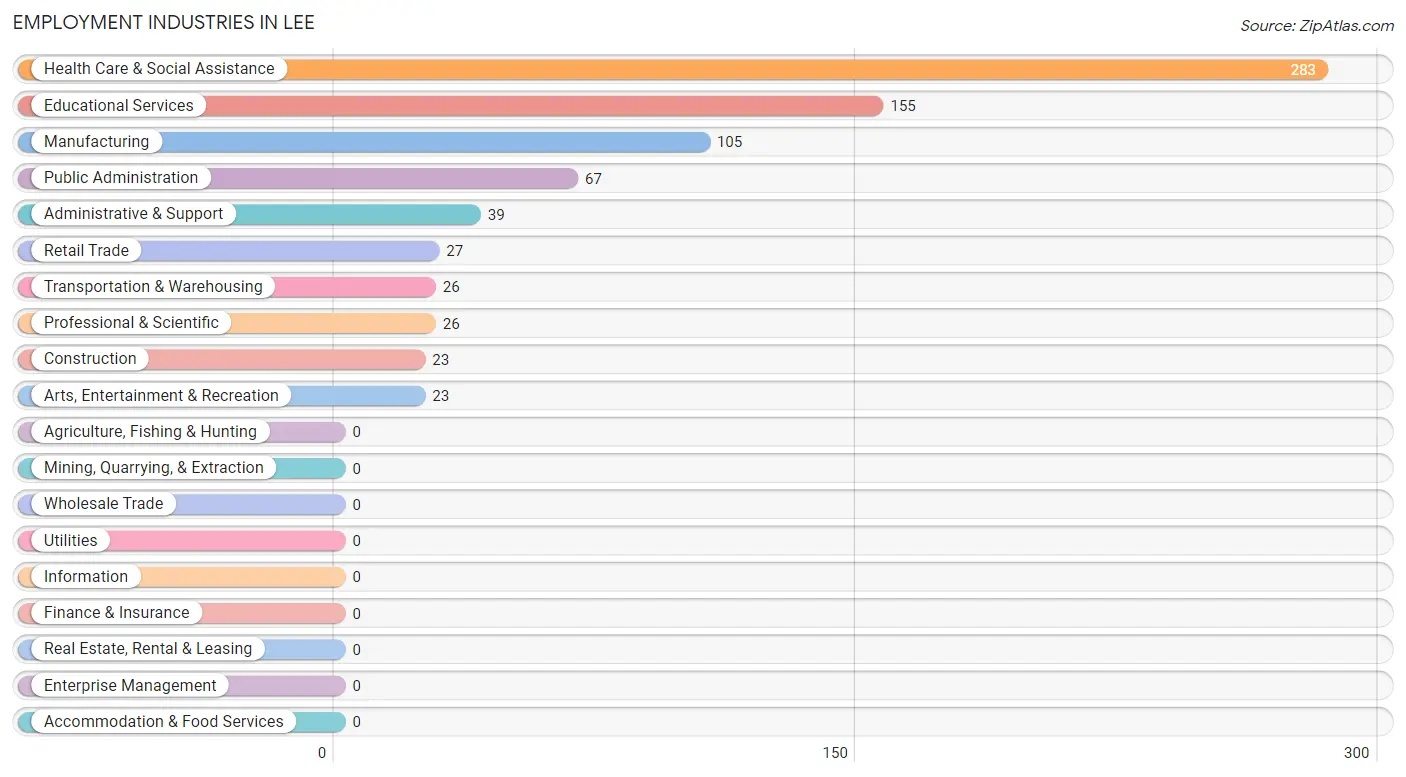
Employment Industries in Lee
The major employment industries in Lee include Health Care & Social Assistance (283 | 35.7%), Educational Services (155 | 19.6%), Manufacturing (105 | 13.2%), Public Administration (67 | 8.5%), and Administrative & Support (39 | 4.9%).
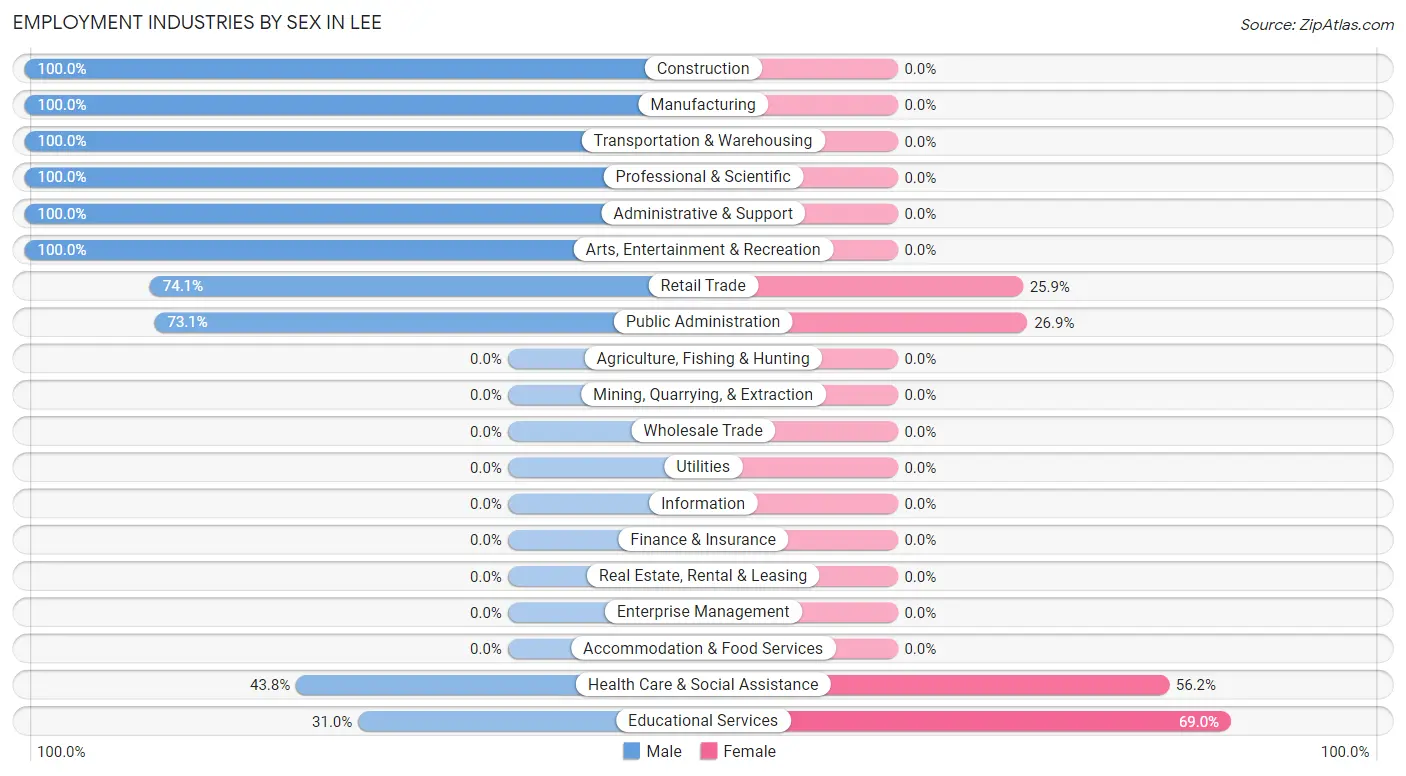
Employment Industries by Sex in Lee
The Lee industries that see more men than women are Construction (100.0%), Manufacturing (100.0%), and Transportation & Warehousing (100.0%), whereas the industries that tend to have a higher number of women are Educational Services (69.0%), Health Care & Social Assistance (56.2%), and Public Administration (26.9%).
| Industry | Male | Female |
| Agriculture, Fishing & Hunting | 0 (0.0%) | 0 (0.0%) |
| Mining, Quarrying, & Extraction | 0 (0.0%) | 0 (0.0%) |
| Construction | 23 (100.0%) | 0 (0.0%) |
| Manufacturing | 105 (100.0%) | 0 (0.0%) |
| Wholesale Trade | 0 (0.0%) | 0 (0.0%) |
| Retail Trade | 20 (74.1%) | 7 (25.9%) |
| Transportation & Warehousing | 26 (100.0%) | 0 (0.0%) |
| Utilities | 0 (0.0%) | 0 (0.0%) |
| Information | 0 (0.0%) | 0 (0.0%) |
| Finance & Insurance | 0 (0.0%) | 0 (0.0%) |
| Real Estate, Rental & Leasing | 0 (0.0%) | 0 (0.0%) |
| Professional & Scientific | 26 (100.0%) | 0 (0.0%) |
| Enterprise Management | 0 (0.0%) | 0 (0.0%) |
| Administrative & Support | 39 (100.0%) | 0 (0.0%) |
| Educational Services | 48 (31.0%) | 107 (69.0%) |
| Health Care & Social Assistance | 124 (43.8%) | 159 (56.2%) |
| Arts, Entertainment & Recreation | 23 (100.0%) | 0 (0.0%) |
| Accommodation & Food Services | 0 (0.0%) | 0 (0.0%) |
| Public Administration | 49 (73.1%) | 18 (26.9%) |
| Total | 502 (63.3%) | 291 (36.7%) |
Education in Lee
School Enrollment in Lee
The most common levels of schooling among the 312 students in Lee are high school (117 | 37.5%), college / undergraduate (66 | 21.1%), and elementary school (62 | 19.9%).
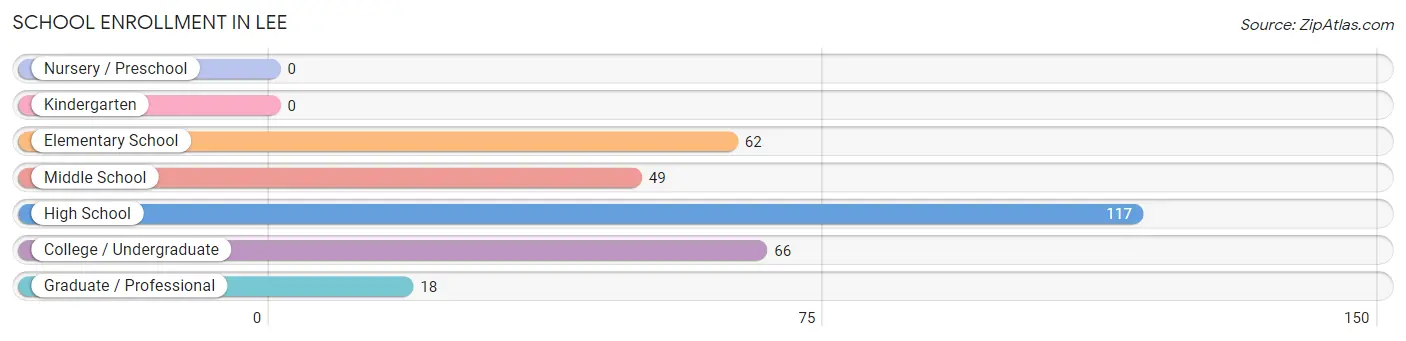
| School Level | # Students | % Students |
| Nursery / Preschool | 0 | 0.0% |
| Kindergarten | 0 | 0.0% |
| Elementary School | 62 | 19.9% |
| Middle School | 49 | 15.7% |
| High School | 117 | 37.5% |
| College / Undergraduate | 66 | 21.1% |
| Graduate / Professional | 18 | 5.8% |
| Total | 312 | 100.0% |
School Enrollment by Age by Funding Source in Lee
Out of a total of 312 students who are enrolled in schools in Lee, 61 (19.6%) attend a private institution, while the remaining 251 (80.4%) are enrolled in public schools. The age group of 18 to 19 year olds has the highest likelihood of being enrolled in private schools, with 5 (83.3% in the age bracket) enrolled. Conversely, the age group of 5 to 9 year old has the lowest likelihood of being enrolled in a private school, with 17 (100.0% in the age bracket) attending a public institution.
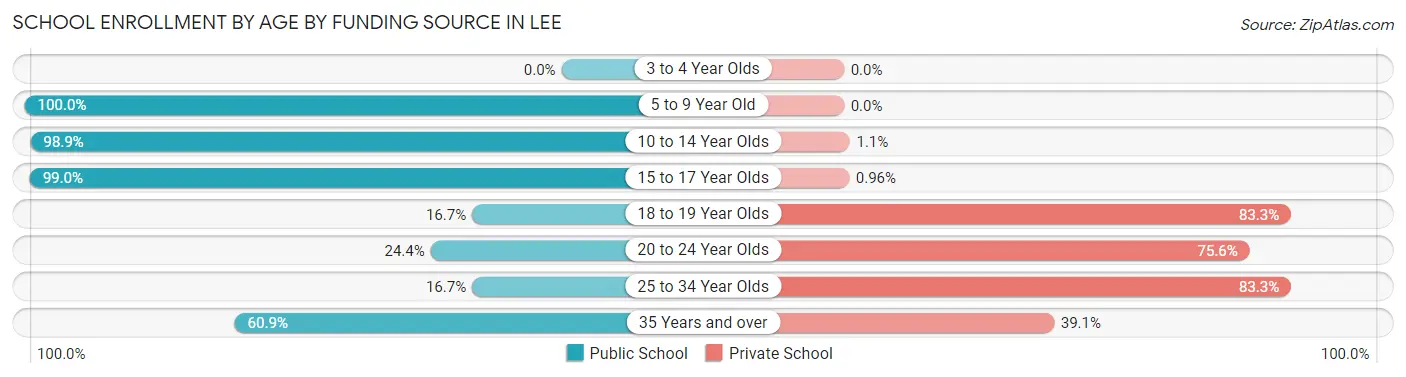
| Age Bracket | Public School | Private School |
| 3 to 4 Year Olds | 0 (0.0%) | 0 (0.0%) |
| 5 to 9 Year Old | 17 (100.0%) | 0 (0.0%) |
| 10 to 14 Year Olds | 91 (98.9%) | 1 (1.1%) |
| 15 to 17 Year Olds | 103 (99.0%) | 1 (1.0%) |
| 18 to 19 Year Olds | 1 (16.7%) | 5 (83.3%) |
| 20 to 24 Year Olds | 10 (24.4%) | 31 (75.6%) |
| 25 to 34 Year Olds | 1 (16.7%) | 5 (83.3%) |
| 35 Years and over | 28 (60.9%) | 18 (39.1%) |
| Total | 251 (80.4%) | 61 (19.6%) |
Educational Attainment by Field of Study in Lee
Science & technology (81 | 17.4%), bio, nature & agricultural (66 | 14.2%), business (63 | 13.5%), psychology (58 | 12.4%), and engineering (53 | 11.4%) are the most common fields of study among 466 individuals in Lee who have obtained a bachelor's degree or higher.
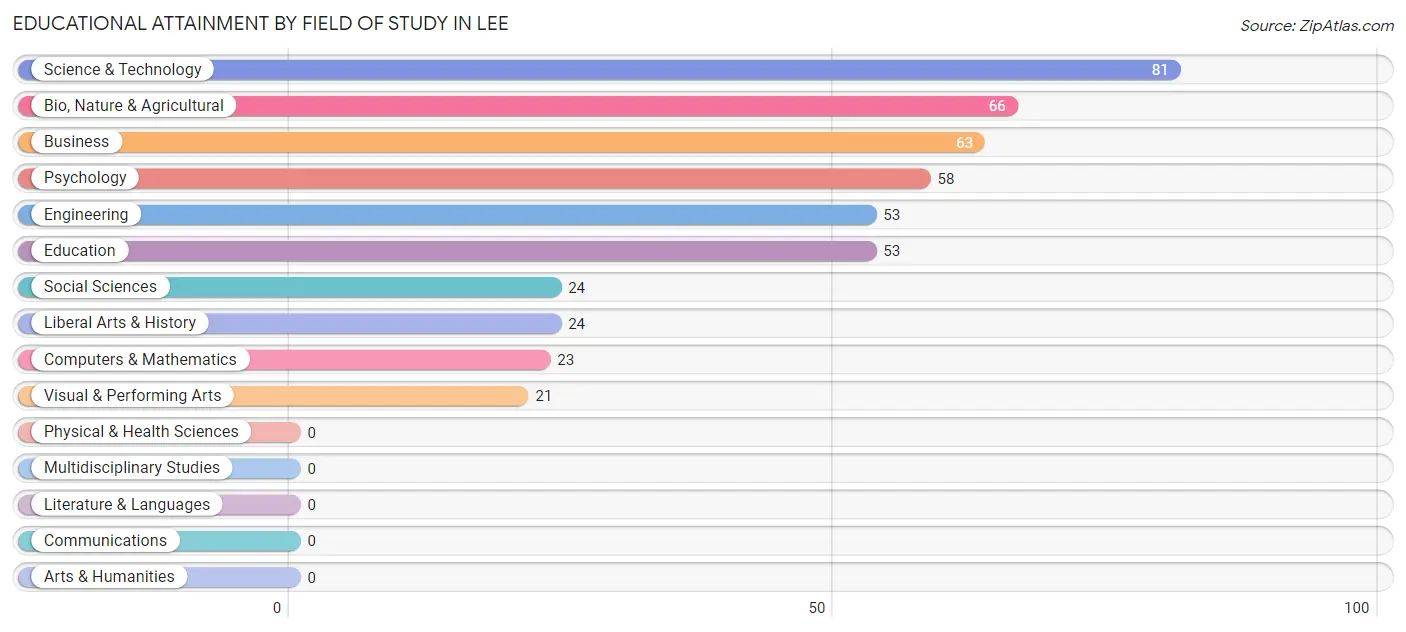
| Field of Study | # Graduates | % Graduates |
| Computers & Mathematics | 23 | 4.9% |
| Bio, Nature & Agricultural | 66 | 14.2% |
| Physical & Health Sciences | 0 | 0.0% |
| Psychology | 58 | 12.4% |
| Social Sciences | 24 | 5.1% |
| Engineering | 53 | 11.4% |
| Multidisciplinary Studies | 0 | 0.0% |
| Science & Technology | 81 | 17.4% |
| Business | 63 | 13.5% |
| Education | 53 | 11.4% |
| Literature & Languages | 0 | 0.0% |
| Liberal Arts & History | 24 | 5.1% |
| Visual & Performing Arts | 21 | 4.5% |
| Communications | 0 | 0.0% |
| Arts & Humanities | 0 | 0.0% |
| Total | 466 | 100.0% |
Transportation & Commute in Lee
Vehicle Availability by Sex in Lee
The most prevalent vehicle ownership categories in Lee are males with 3 vehicles (225, accounting for 44.9%) and females with 3 vehicles (20, making up 77.3%).
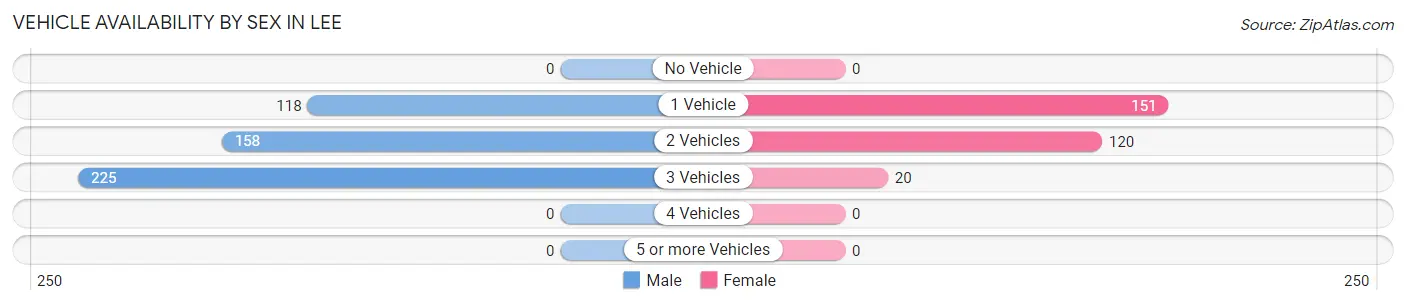
| Vehicles Available | Male | Female |
| No Vehicle | 0 (0.0%) | 0 (0.0%) |
| 1 Vehicle | 118 (23.5%) | 151 (51.9%) |
| 2 Vehicles | 158 (31.5%) | 120 (41.2%) |
| 3 Vehicles | 225 (44.9%) | 20 (6.9%) |
| 4 Vehicles | 0 (0.0%) | 0 (0.0%) |
| 5 or more Vehicles | 0 (0.0%) | 0 (0.0%) |
| Total | 501 (100.0%) | 291 (100.0%) |
Commute Time in Lee
The most frequently occuring commute durations in Lee are 25 to 29 minutes (160 commuters, 20.9%), 30 to 34 minutes (139 commuters, 18.1%), and 5 to 9 minutes (102 commuters, 13.3%).
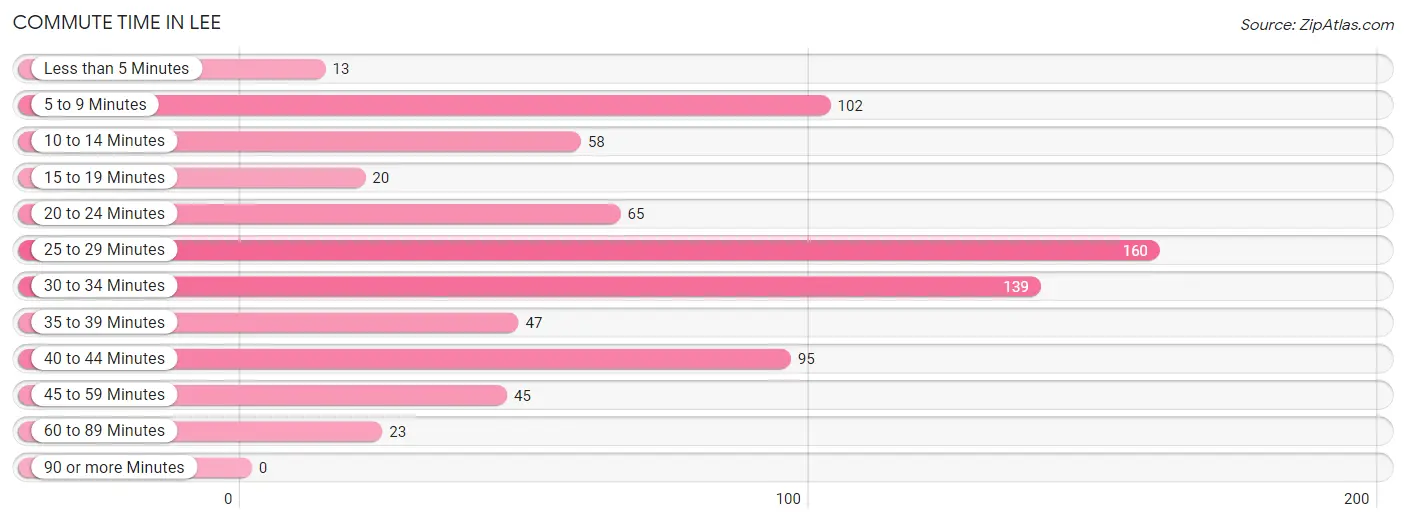
| Commute Time | # Commuters | % Commuters |
| Less than 5 Minutes | 13 | 1.7% |
| 5 to 9 Minutes | 102 | 13.3% |
| 10 to 14 Minutes | 58 | 7.6% |
| 15 to 19 Minutes | 20 | 2.6% |
| 20 to 24 Minutes | 65 | 8.5% |
| 25 to 29 Minutes | 160 | 20.9% |
| 30 to 34 Minutes | 139 | 18.1% |
| 35 to 39 Minutes | 47 | 6.1% |
| 40 to 44 Minutes | 95 | 12.4% |
| 45 to 59 Minutes | 45 | 5.9% |
| 60 to 89 Minutes | 23 | 3.0% |
| 90 or more Minutes | 0 | 0.0% |
Commute Time by Sex in Lee
The most common commute times in Lee are 30 to 34 minutes (139 commuters, 27.7%) for males and 40 to 44 minutes (95 commuters, 35.8%) for females.
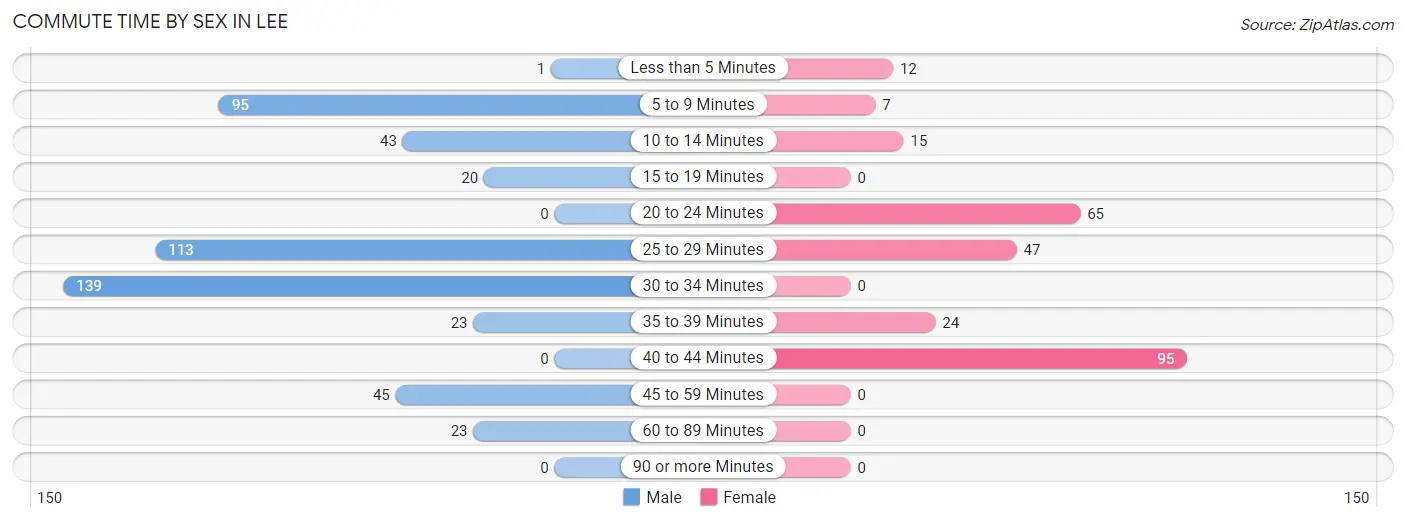
| Commute Time | Male | Female |
| Less than 5 Minutes | 1 (0.2%) | 12 (4.5%) |
| 5 to 9 Minutes | 95 (18.9%) | 7 (2.6%) |
| 10 to 14 Minutes | 43 (8.6%) | 15 (5.7%) |
| 15 to 19 Minutes | 20 (4.0%) | 0 (0.0%) |
| 20 to 24 Minutes | 0 (0.0%) | 65 (24.5%) |
| 25 to 29 Minutes | 113 (22.5%) | 47 (17.7%) |
| 30 to 34 Minutes | 139 (27.7%) | 0 (0.0%) |
| 35 to 39 Minutes | 23 (4.6%) | 24 (9.1%) |
| 40 to 44 Minutes | 0 (0.0%) | 95 (35.8%) |
| 45 to 59 Minutes | 45 (9.0%) | 0 (0.0%) |
| 60 to 89 Minutes | 23 (4.6%) | 0 (0.0%) |
| 90 or more Minutes | 0 (0.0%) | 0 (0.0%) |
Time of Departure to Work by Sex in Lee
The most frequent times of departure to work in Lee are 6:30 AM to 6:59 AM (131, 26.1%) for males and 8:00 AM to 8:29 AM (82, 30.9%) for females.
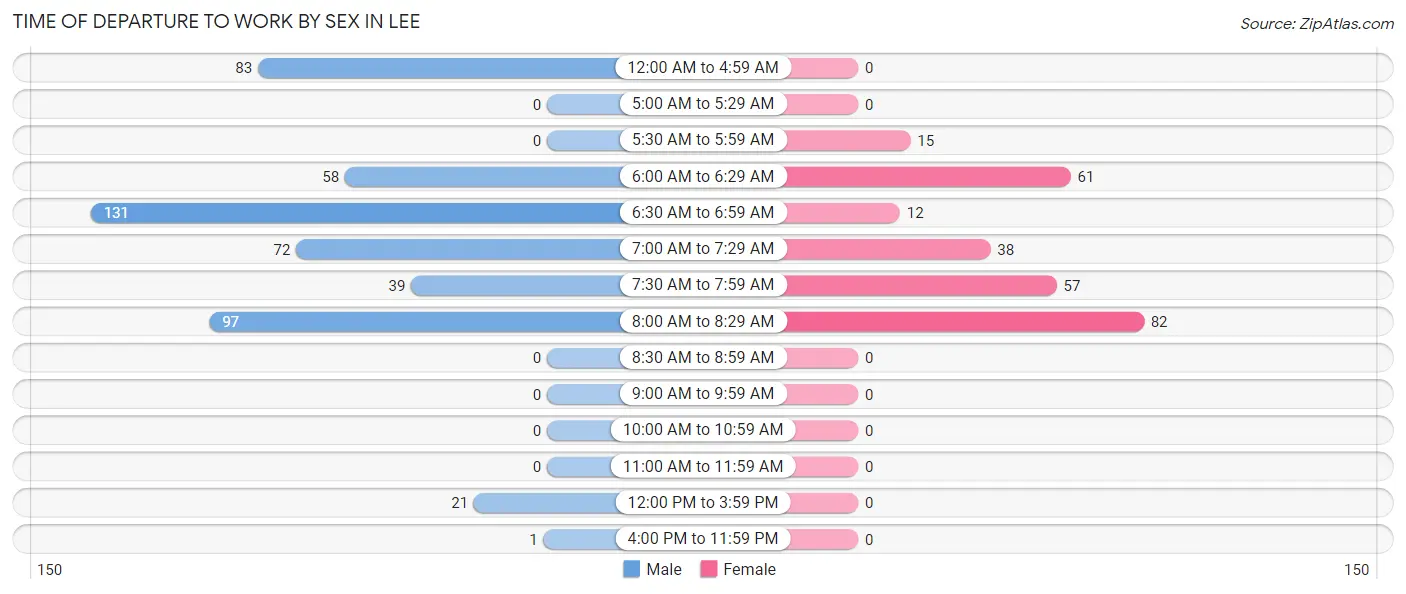
| Time of Departure | Male | Female |
| 12:00 AM to 4:59 AM | 83 (16.5%) | 0 (0.0%) |
| 5:00 AM to 5:29 AM | 0 (0.0%) | 0 (0.0%) |
| 5:30 AM to 5:59 AM | 0 (0.0%) | 15 (5.7%) |
| 6:00 AM to 6:29 AM | 58 (11.6%) | 61 (23.0%) |
| 6:30 AM to 6:59 AM | 131 (26.1%) | 12 (4.5%) |
| 7:00 AM to 7:29 AM | 72 (14.3%) | 38 (14.3%) |
| 7:30 AM to 7:59 AM | 39 (7.8%) | 57 (21.5%) |
| 8:00 AM to 8:29 AM | 97 (19.3%) | 82 (30.9%) |
| 8:30 AM to 8:59 AM | 0 (0.0%) | 0 (0.0%) |
| 9:00 AM to 9:59 AM | 0 (0.0%) | 0 (0.0%) |
| 10:00 AM to 10:59 AM | 0 (0.0%) | 0 (0.0%) |
| 11:00 AM to 11:59 AM | 0 (0.0%) | 0 (0.0%) |
| 12:00 PM to 3:59 PM | 21 (4.2%) | 0 (0.0%) |
| 4:00 PM to 11:59 PM | 1 (0.2%) | 0 (0.0%) |
| Total | 502 (100.0%) | 265 (100.0%) |
Housing Occupancy in Lee
Occupancy by Ownership in Lee
Of the total 696 dwellings in Lee, owner-occupied units account for 457 (65.7%), while renter-occupied units make up 239 (34.3%).
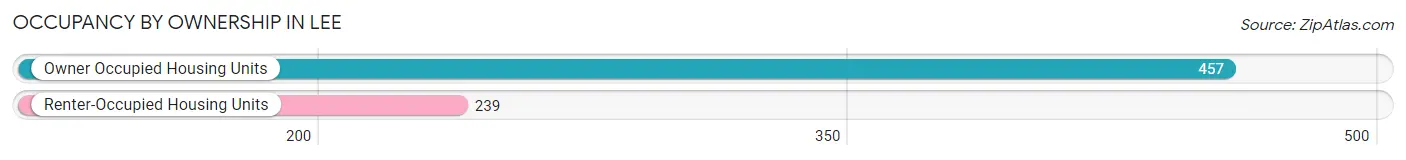
| Occupancy | # Housing Units | % Housing Units |
| Owner Occupied Housing Units | 457 | 65.7% |
| Renter-Occupied Housing Units | 239 | 34.3% |
| Total Occupied Housing Units | 696 | 100.0% |
Occupancy by Household Size in Lee
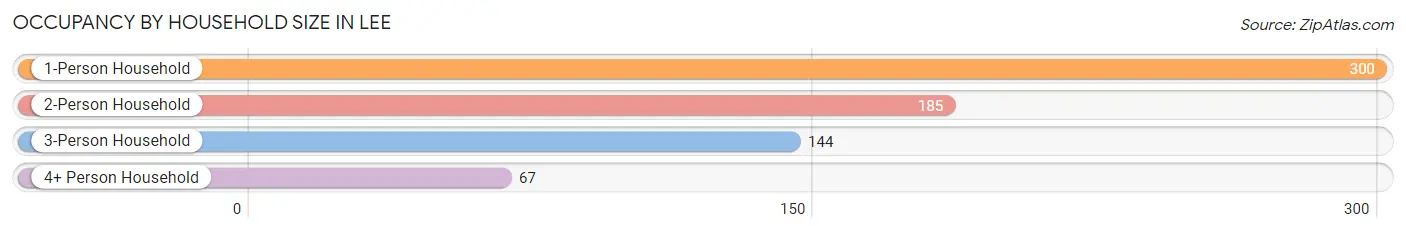
| Household Size | # Housing Units | % Housing Units |
| 1-Person Household | 300 | 43.1% |
| 2-Person Household | 185 | 26.6% |
| 3-Person Household | 144 | 20.7% |
| 4+ Person Household | 67 | 9.6% |
| Total Housing Units | 696 | 100.0% |
Occupancy by Ownership by Household Size in Lee
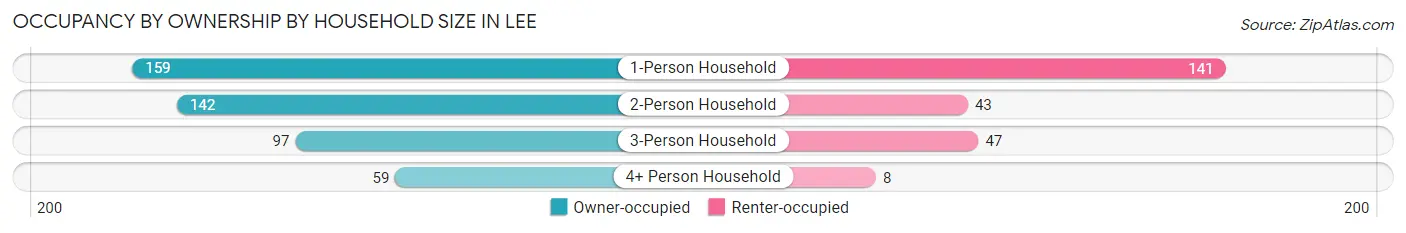
| Household Size | Owner-occupied | Renter-occupied |
| 1-Person Household | 159 (53.0%) | 141 (47.0%) |
| 2-Person Household | 142 (76.8%) | 43 (23.2%) |
| 3-Person Household | 97 (67.4%) | 47 (32.6%) |
| 4+ Person Household | 59 (88.1%) | 8 (11.9%) |
| Total Housing Units | 457 (65.7%) | 239 (34.3%) |
Occupancy by Educational Attainment in Lee
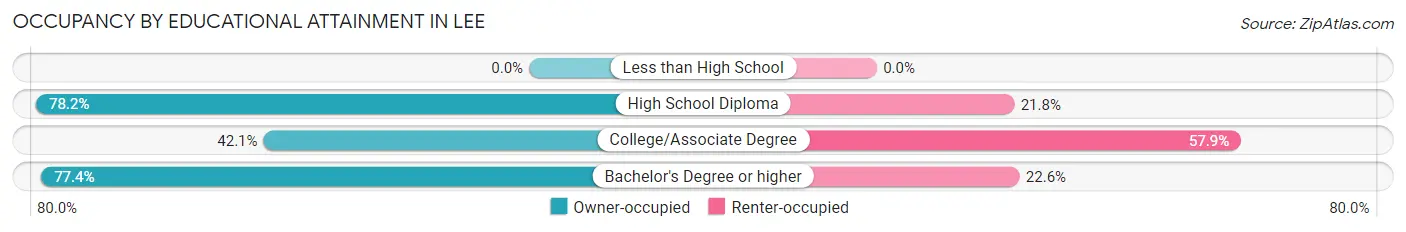
| Household Size | Owner-occupied | Renter-occupied |
| Less than High School | 0 (0.0%) | 0 (0.0%) |
| High School Diploma | 129 (78.2%) | 36 (21.8%) |
| College/Associate Degree | 99 (42.1%) | 136 (57.9%) |
| Bachelor's Degree or higher | 229 (77.4%) | 67 (22.6%) |
Occupancy by Age of Householder in Lee
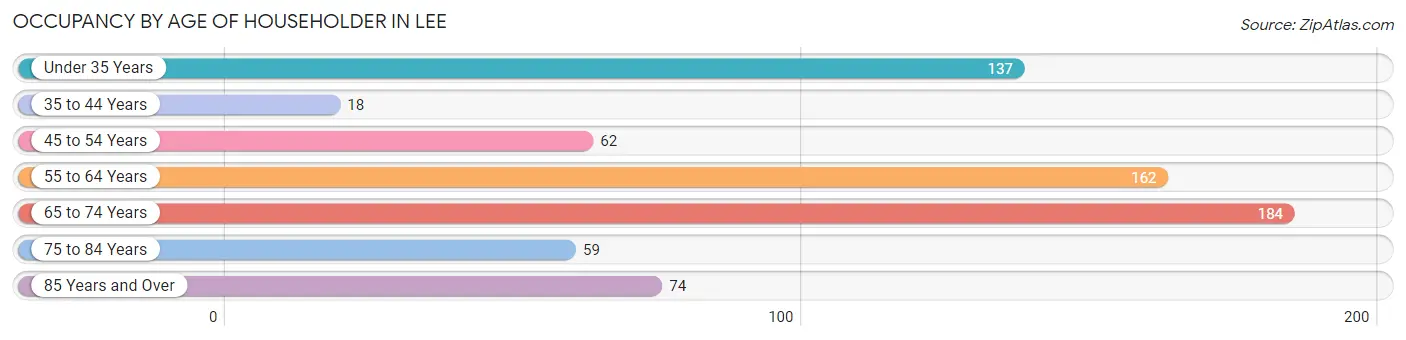
| Age Bracket | # Households | % Households |
| Under 35 Years | 137 | 19.7% |
| 35 to 44 Years | 18 | 2.6% |
| 45 to 54 Years | 62 | 8.9% |
| 55 to 64 Years | 162 | 23.3% |
| 65 to 74 Years | 184 | 26.4% |
| 75 to 84 Years | 59 | 8.5% |
| 85 Years and Over | 74 | 10.6% |
| Total | 696 | 100.0% |
Housing Finances in Lee
Median Income by Occupancy in Lee
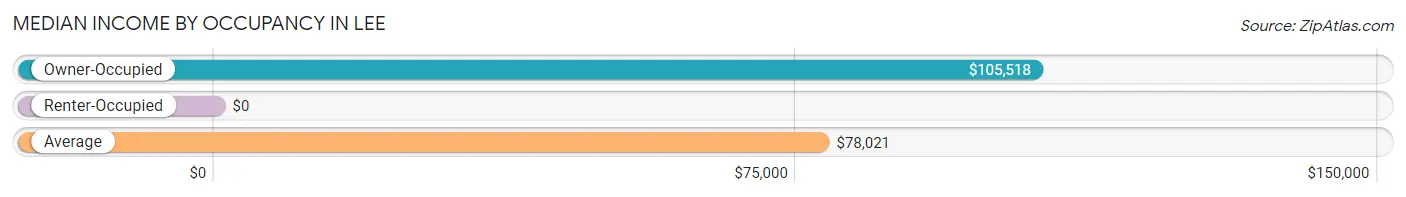
| Occupancy Type | # Households | Median Income |
| Owner-Occupied | 457 (65.7%) | $105,518 |
| Renter-Occupied | 239 (34.3%) | $0 |
| Average | 696 (100.0%) | $78,021 |
Occupancy by Householder Income Bracket in Lee
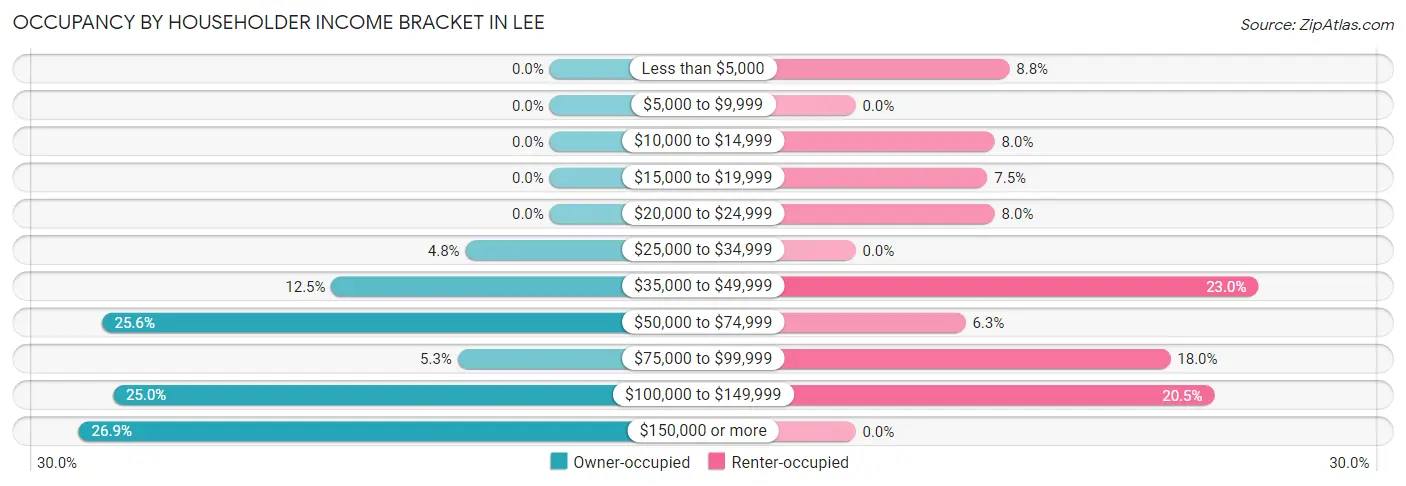
| Income Bracket | Owner-occupied | Renter-occupied |
| Less than $5,000 | 0 (0.0%) | 21 (8.8%) |
| $5,000 to $9,999 | 0 (0.0%) | 0 (0.0%) |
| $10,000 to $14,999 | 0 (0.0%) | 19 (8.0%) |
| $15,000 to $19,999 | 0 (0.0%) | 18 (7.5%) |
| $20,000 to $24,999 | 0 (0.0%) | 19 (8.0%) |
| $25,000 to $34,999 | 22 (4.8%) | 0 (0.0%) |
| $35,000 to $49,999 | 57 (12.5%) | 55 (23.0%) |
| $50,000 to $74,999 | 117 (25.6%) | 15 (6.3%) |
| $75,000 to $99,999 | 24 (5.2%) | 43 (18.0%) |
| $100,000 to $149,999 | 114 (24.9%) | 49 (20.5%) |
| $150,000 or more | 123 (26.9%) | 0 (0.0%) |
| Total | 457 (100.0%) | 239 (100.0%) |
Monthly Housing Cost Tiers in Lee
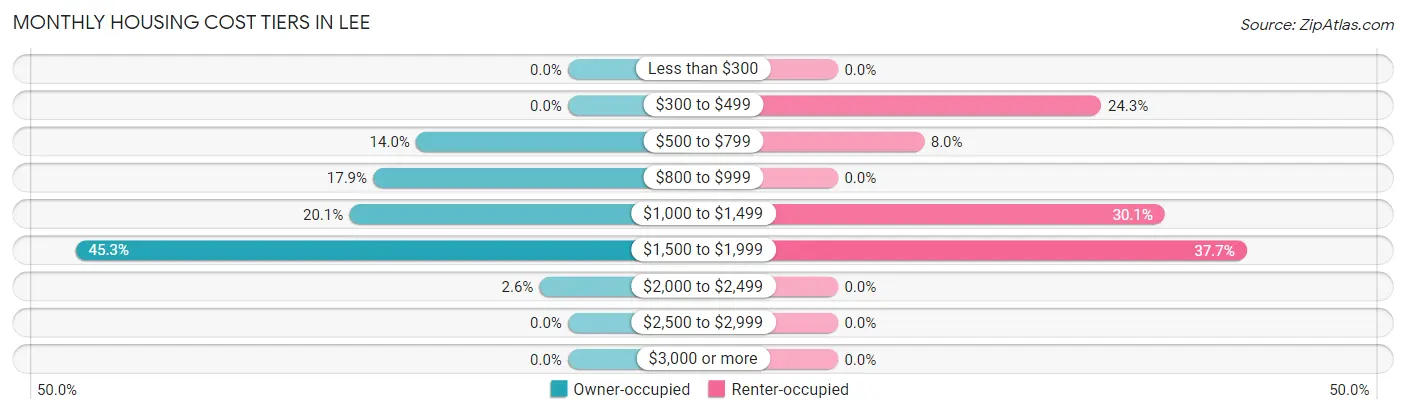
| Monthly Cost | Owner-occupied | Renter-occupied |
| Less than $300 | 0 (0.0%) | 0 (0.0%) |
| $300 to $499 | 0 (0.0%) | 58 (24.3%) |
| $500 to $799 | 64 (14.0%) | 19 (8.0%) |
| $800 to $999 | 82 (17.9%) | 0 (0.0%) |
| $1,000 to $1,499 | 92 (20.1%) | 72 (30.1%) |
| $1,500 to $1,999 | 207 (45.3%) | 90 (37.7%) |
| $2,000 to $2,499 | 12 (2.6%) | 0 (0.0%) |
| $2,500 to $2,999 | 0 (0.0%) | 0 (0.0%) |
| $3,000 or more | 0 (0.0%) | 0 (0.0%) |
| Total | 457 (100.0%) | 239 (100.0%) |
Physical Housing Characteristics in Lee
Housing Structures in Lee
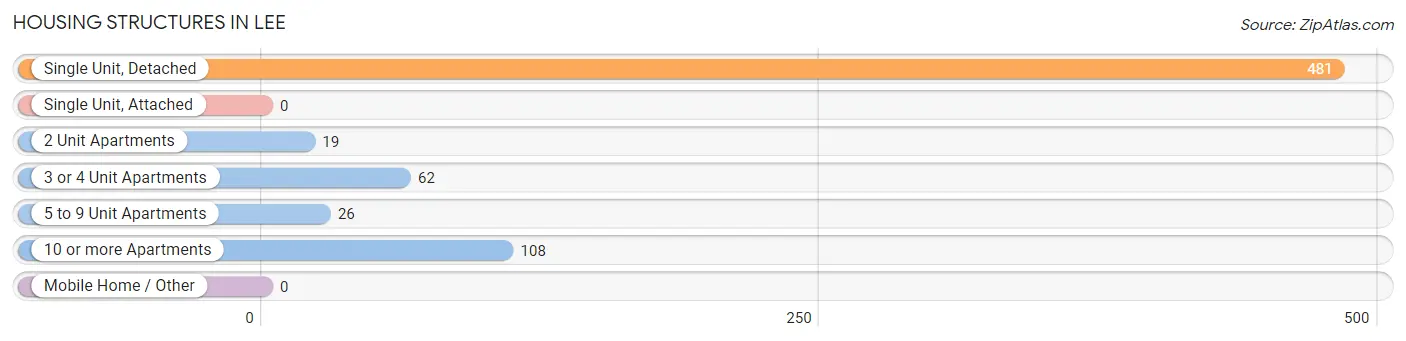
| Structure Type | # Housing Units | % Housing Units |
| Single Unit, Detached | 481 | 69.1% |
| Single Unit, Attached | 0 | 0.0% |
| 2 Unit Apartments | 19 | 2.7% |
| 3 or 4 Unit Apartments | 62 | 8.9% |
| 5 to 9 Unit Apartments | 26 | 3.7% |
| 10 or more Apartments | 108 | 15.5% |
| Mobile Home / Other | 0 | 0.0% |
| Total | 696 | 100.0% |
Housing Structures by Occupancy in Lee
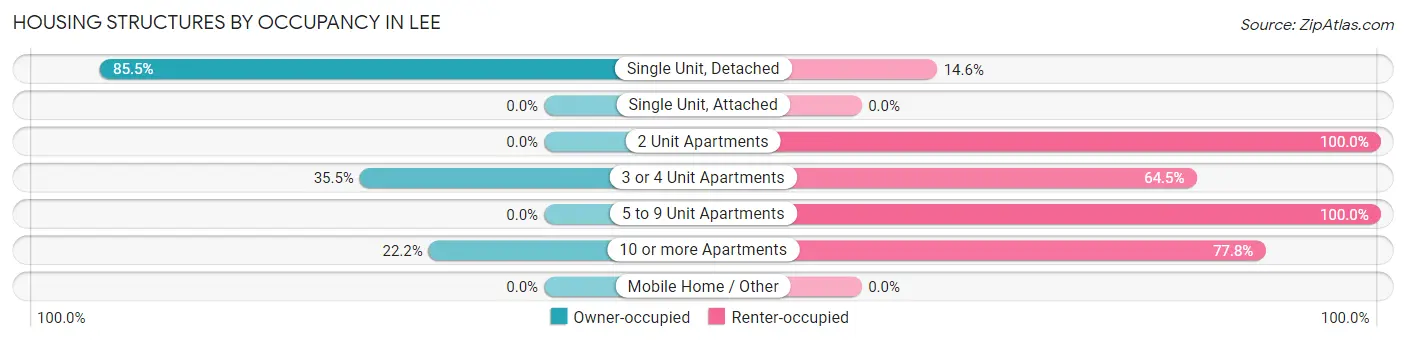
| Structure Type | Owner-occupied | Renter-occupied |
| Single Unit, Detached | 411 (85.5%) | 70 (14.5%) |
| Single Unit, Attached | 0 (0.0%) | 0 (0.0%) |
| 2 Unit Apartments | 0 (0.0%) | 19 (100.0%) |
| 3 or 4 Unit Apartments | 22 (35.5%) | 40 (64.5%) |
| 5 to 9 Unit Apartments | 0 (0.0%) | 26 (100.0%) |
| 10 or more Apartments | 24 (22.2%) | 84 (77.8%) |
| Mobile Home / Other | 0 (0.0%) | 0 (0.0%) |
| Total | 457 (65.7%) | 239 (34.3%) |
Housing Structures by Number of Rooms in Lee
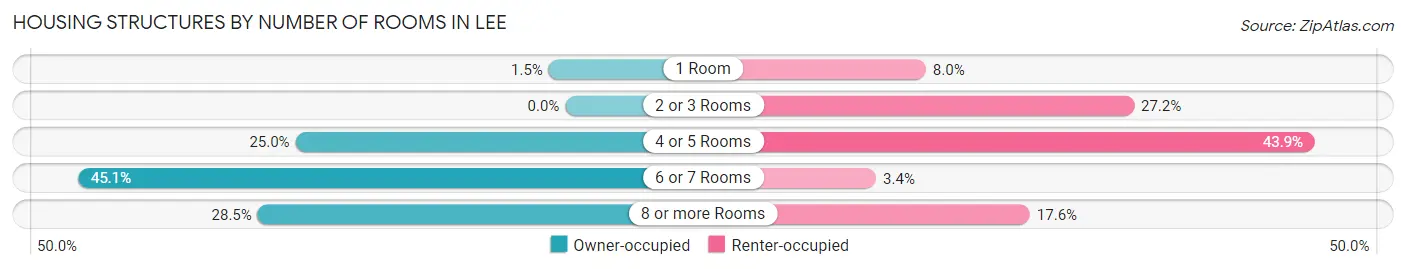
| Number of Rooms | Owner-occupied | Renter-occupied |
| 1 Room | 7 (1.5%) | 19 (8.0%) |
| 2 or 3 Rooms | 0 (0.0%) | 65 (27.2%) |
| 4 or 5 Rooms | 114 (24.9%) | 105 (43.9%) |
| 6 or 7 Rooms | 206 (45.1%) | 8 (3.4%) |
| 8 or more Rooms | 130 (28.4%) | 42 (17.6%) |
| Total | 457 (100.0%) | 239 (100.0%) |
Housing Structure by Heating Type in Lee
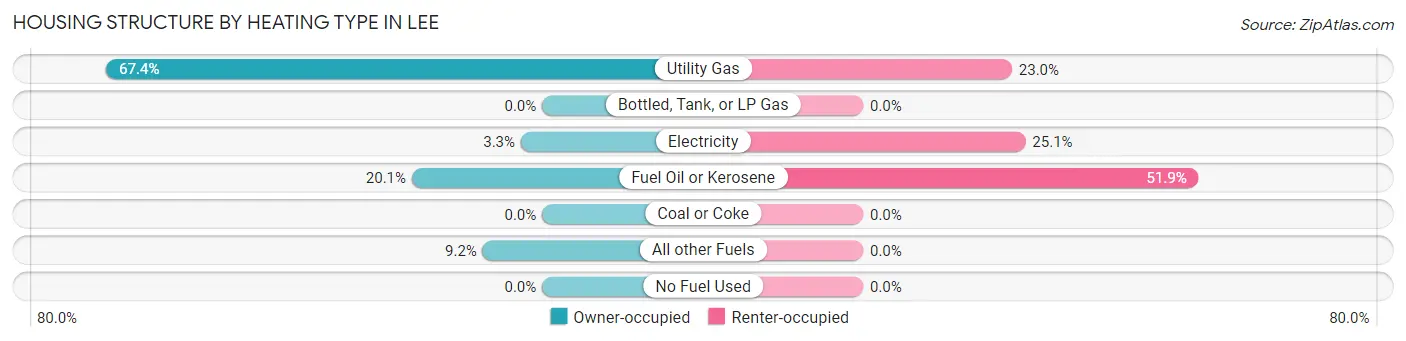
| Heating Type | Owner-occupied | Renter-occupied |
| Utility Gas | 308 (67.4%) | 55 (23.0%) |
| Bottled, Tank, or LP Gas | 0 (0.0%) | 0 (0.0%) |
| Electricity | 15 (3.3%) | 60 (25.1%) |
| Fuel Oil or Kerosene | 92 (20.1%) | 124 (51.9%) |
| Coal or Coke | 0 (0.0%) | 0 (0.0%) |
| All other Fuels | 42 (9.2%) | 0 (0.0%) |
| No Fuel Used | 0 (0.0%) | 0 (0.0%) |
| Total | 457 (100.0%) | 239 (100.0%) |
Household Vehicle Usage in Lee
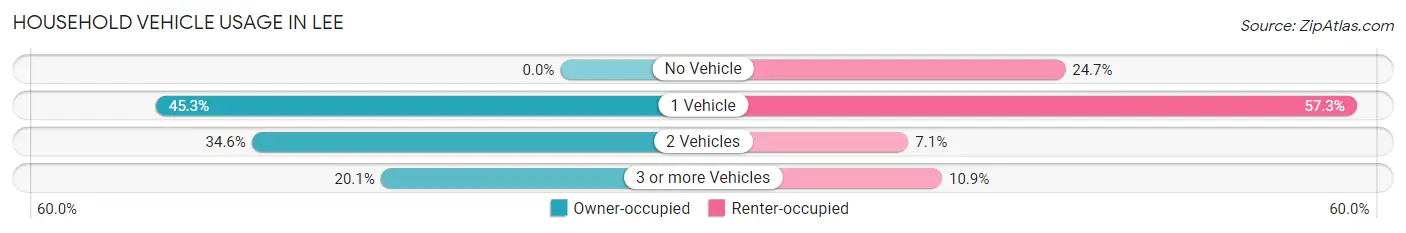
| Vehicles per Household | Owner-occupied | Renter-occupied |
| No Vehicle | 0 (0.0%) | 59 (24.7%) |
| 1 Vehicle | 207 (45.3%) | 137 (57.3%) |
| 2 Vehicles | 158 (34.6%) | 17 (7.1%) |
| 3 or more Vehicles | 92 (20.1%) | 26 (10.9%) |
| Total | 457 (100.0%) | 239 (100.0%) |
Real Estate & Mortgages in Lee
Real Estate and Mortgage Overview in Lee
| Characteristic | Without Mortgage | With Mortgage |
| Housing Units | 198 | 259 |
| Median Property Value | $301,700 | $246,600 |
| Median Household Income | $62,841 | $82 |
| Monthly Housing Costs | $878 | $0 |
| Real Estate Taxes | $4,042 | $0 |
Property Value by Mortgage Status in Lee
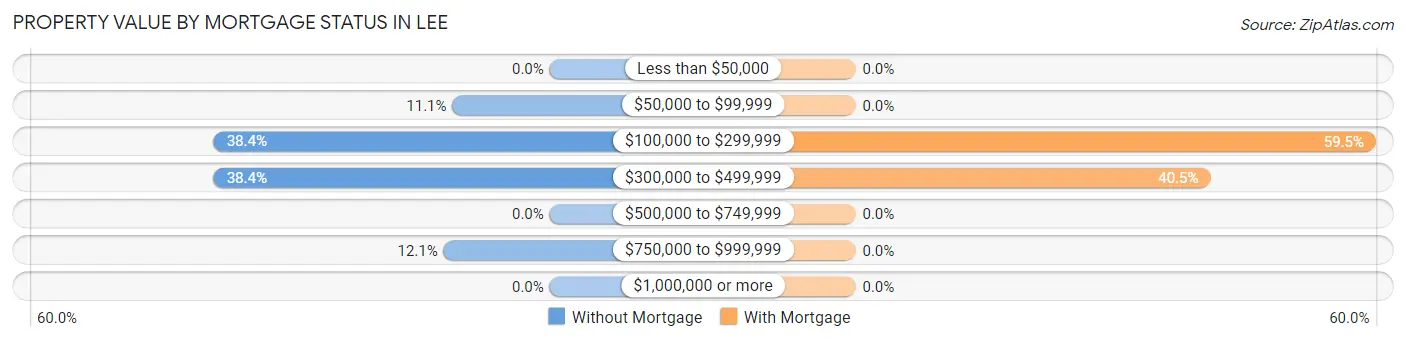
| Property Value | Without Mortgage | With Mortgage |
| Less than $50,000 | 0 (0.0%) | 0 (0.0%) |
| $50,000 to $99,999 | 22 (11.1%) | 0 (0.0%) |
| $100,000 to $299,999 | 76 (38.4%) | 154 (59.5%) |
| $300,000 to $499,999 | 76 (38.4%) | 105 (40.5%) |
| $500,000 to $749,999 | 0 (0.0%) | 0 (0.0%) |
| $750,000 to $999,999 | 24 (12.1%) | 0 (0.0%) |
| $1,000,000 or more | 0 (0.0%) | 0 (0.0%) |
| Total | 198 (100.0%) | 259 (100.0%) |
Household Income by Mortgage Status in Lee
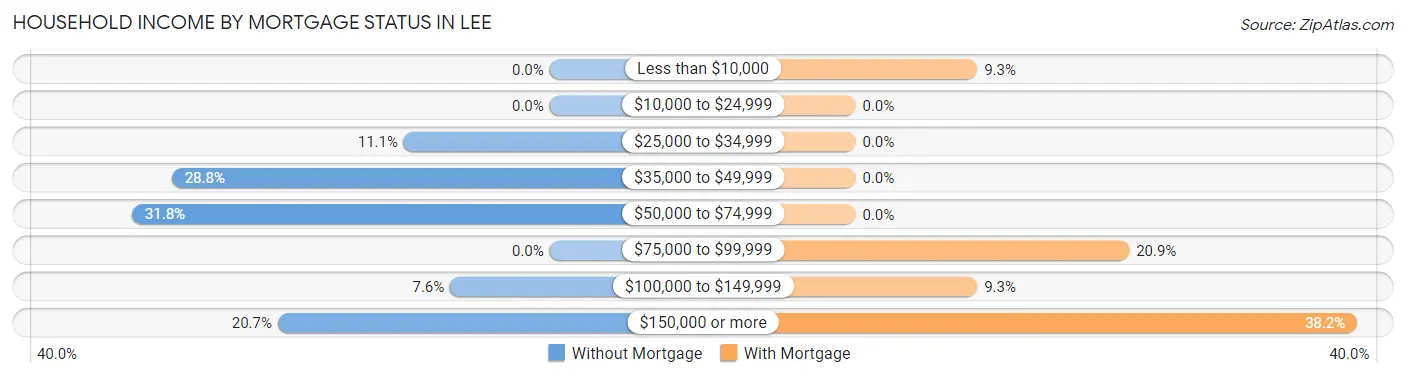
| Household Income | Without Mortgage | With Mortgage |
| Less than $10,000 | 0 (0.0%) | 24 (9.3%) |
| $10,000 to $24,999 | 0 (0.0%) | 0 (0.0%) |
| $25,000 to $34,999 | 22 (11.1%) | 0 (0.0%) |
| $35,000 to $49,999 | 57 (28.8%) | 0 (0.0%) |
| $50,000 to $74,999 | 63 (31.8%) | 0 (0.0%) |
| $75,000 to $99,999 | 0 (0.0%) | 54 (20.8%) |
| $100,000 to $149,999 | 15 (7.6%) | 24 (9.3%) |
| $150,000 or more | 41 (20.7%) | 99 (38.2%) |
| Total | 198 (100.0%) | 259 (100.0%) |
Property Value to Household Income Ratio in Lee
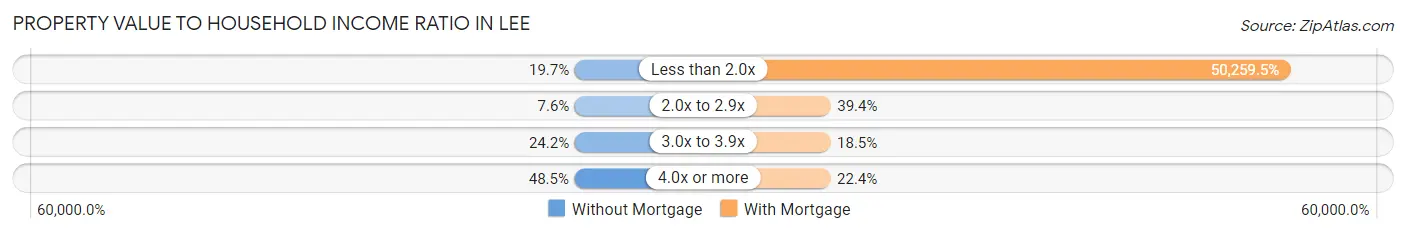
| Value-to-Income Ratio | Without Mortgage | With Mortgage |
| Less than 2.0x | 39 (19.7%) | 130,172 (50,259.5%) |
| 2.0x to 2.9x | 15 (7.6%) | 102 (39.4%) |
| 3.0x to 3.9x | 48 (24.2%) | 48 (18.5%) |
| 4.0x or more | 96 (48.5%) | 58 (22.4%) |
| Total | 198 (100.0%) | 259 (100.0%) |
Real Estate Taxes by Mortgage Status in Lee
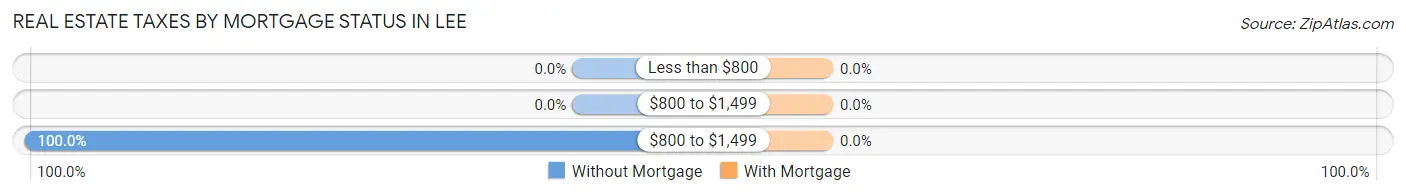
| Property Taxes | Without Mortgage | With Mortgage |
| Less than $800 | 0 (0.0%) | 0 (0.0%) |
| $800 to $1,499 | 0 (0.0%) | 0 (0.0%) |
| $800 to $1,499 | 198 (100.0%) | 0 (0.0%) |
| Total | 198 (100.0%) | 259 (100.0%) |
Health & Disability in Lee
Health Insurance Coverage by Age in Lee
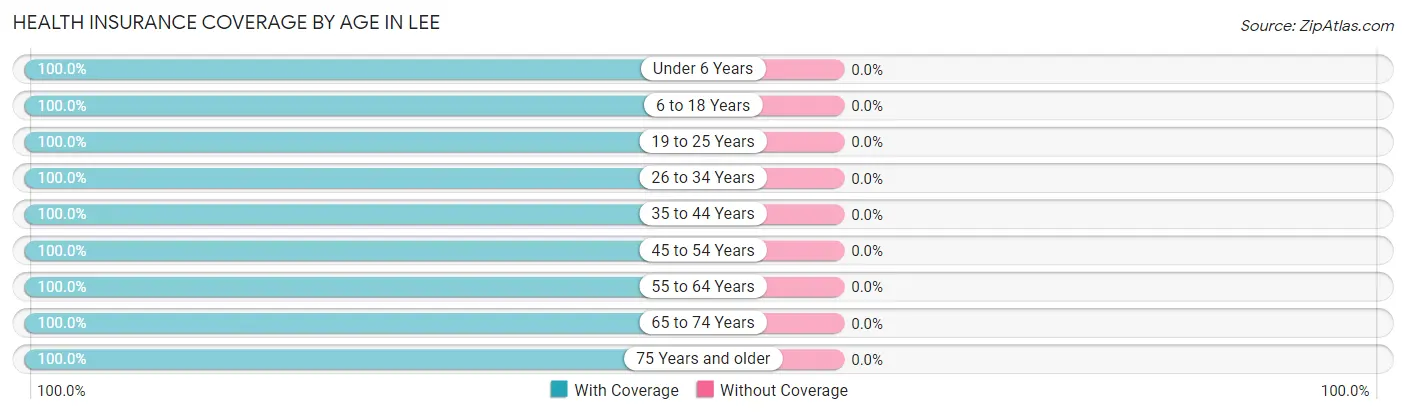
| Age Bracket | With Coverage | Without Coverage |
| Under 6 Years | 19 (100.0%) | 0 (0.0%) |
| 6 to 18 Years | 215 (100.0%) | 0 (0.0%) |
| 19 to 25 Years | 60 (100.0%) | 0 (0.0%) |
| 26 to 34 Years | 264 (100.0%) | 0 (0.0%) |
| 35 to 44 Years | 80 (100.0%) | 0 (0.0%) |
| 45 to 54 Years | 131 (100.0%) | 0 (0.0%) |
| 55 to 64 Years | 286 (100.0%) | 0 (0.0%) |
| 65 to 74 Years | 247 (100.0%) | 0 (0.0%) |
| 75 Years and older | 172 (100.0%) | 0 (0.0%) |
| Total | 1,474 (100.0%) | 0 (0.0%) |
Health Insurance Coverage by Citizenship Status in Lee
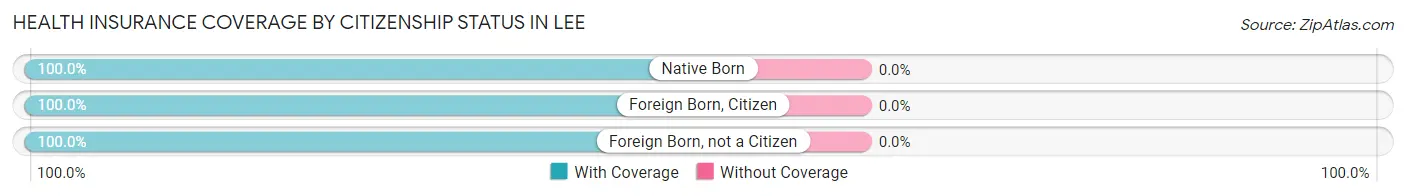
| Citizenship Status | With Coverage | Without Coverage |
| Native Born | 19 (100.0%) | 0 (0.0%) |
| Foreign Born, Citizen | 215 (100.0%) | 0 (0.0%) |
| Foreign Born, not a Citizen | 60 (100.0%) | 0 (0.0%) |
Health Insurance Coverage by Household Income in Lee
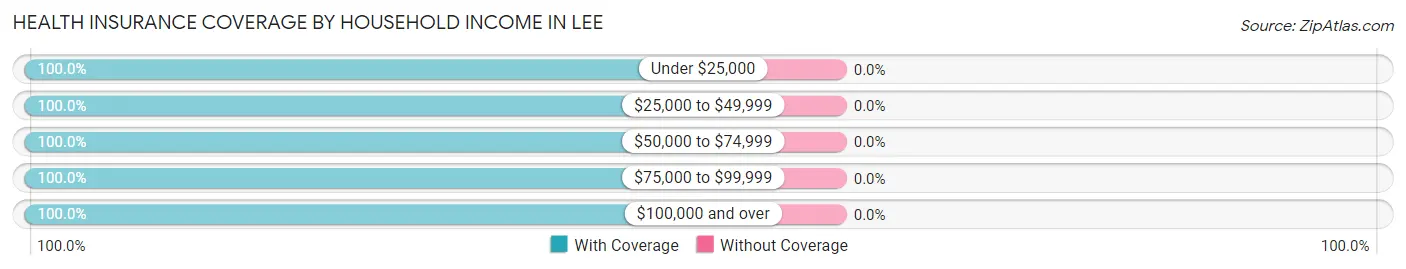
| Household Income | With Coverage | Without Coverage |
| Under $25,000 | 77 (100.0%) | 0 (0.0%) |
| $25,000 to $49,999 | 301 (100.0%) | 0 (0.0%) |
| $50,000 to $74,999 | 176 (100.0%) | 0 (0.0%) |
| $75,000 to $99,999 | 90 (100.0%) | 0 (0.0%) |
| $100,000 and over | 761 (100.0%) | 0 (0.0%) |
Public vs Private Health Insurance Coverage by Age in Lee
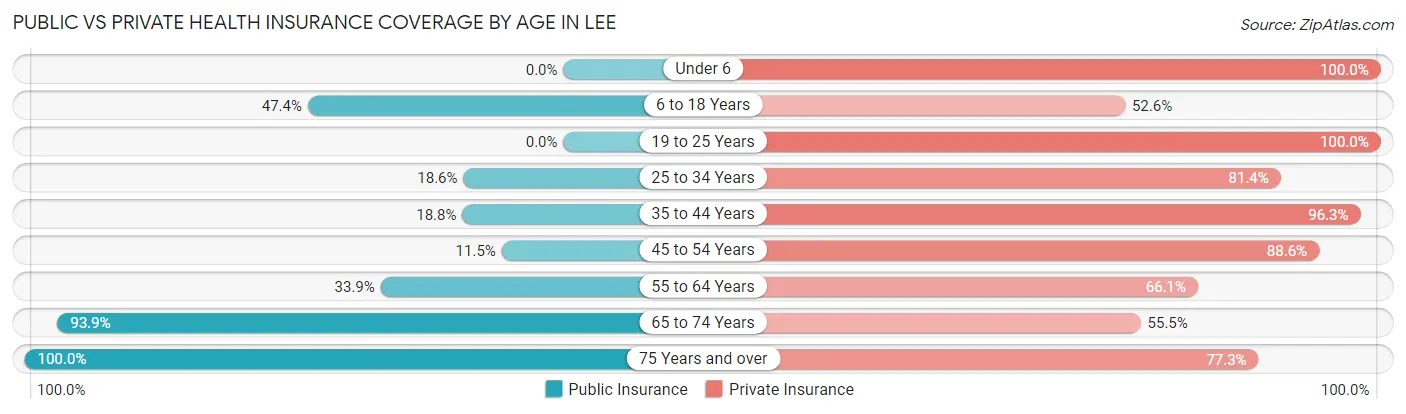
| Age Bracket | Public Insurance | Private Insurance |
| Under 6 | 0 (0.0%) | 19 (100.0%) |
| 6 to 18 Years | 102 (47.4%) | 113 (52.6%) |
| 19 to 25 Years | 0 (0.0%) | 60 (100.0%) |
| 25 to 34 Years | 49 (18.6%) | 215 (81.4%) |
| 35 to 44 Years | 15 (18.8%) | 77 (96.3%) |
| 45 to 54 Years | 15 (11.5%) | 116 (88.5%) |
| 55 to 64 Years | 97 (33.9%) | 189 (66.1%) |
| 65 to 74 Years | 232 (93.9%) | 137 (55.5%) |
| 75 Years and over | 172 (100.0%) | 133 (77.3%) |
| Total | 682 (46.3%) | 1,059 (71.9%) |
Disability Status by Sex by Age in Lee
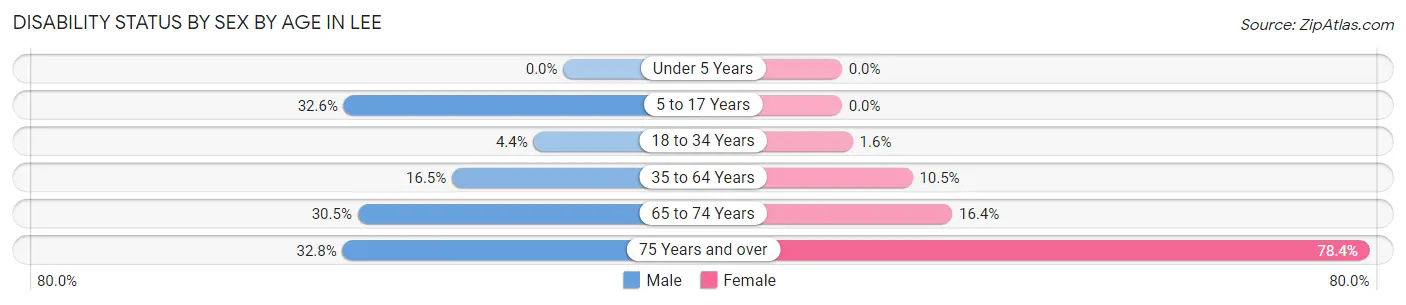
| Age Bracket | Male | Female |
| Under 5 Years | 0 (0.0%) | 0 (0.0%) |
| 5 to 17 Years | 60 (32.6%) | 0 (0.0%) |
| 18 to 34 Years | 9 (4.4%) | 2 (1.6%) |
| 35 to 64 Years | 38 (16.5%) | 28 (10.5%) |
| 65 to 74 Years | 40 (30.5%) | 19 (16.4%) |
| 75 Years and over | 20 (32.8%) | 87 (78.4%) |
Disability Class by Sex by Age in Lee
Disability Class: Hearing Difficulty
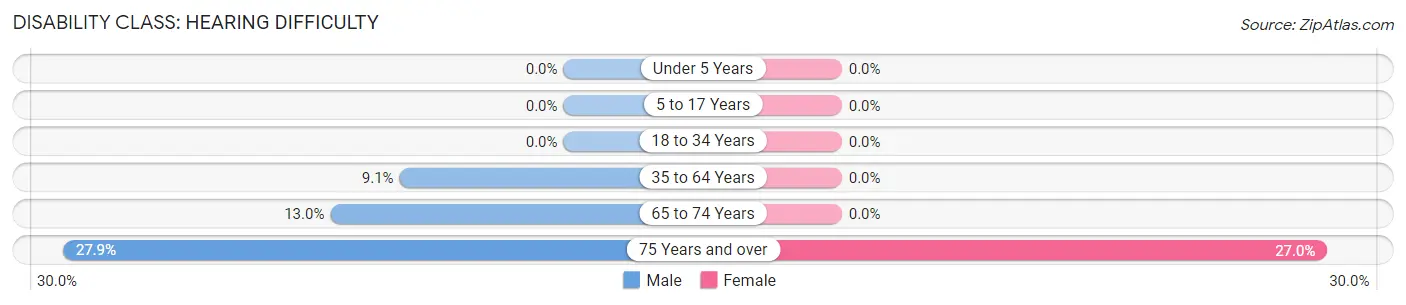
| Age Bracket | Male | Female |
| Under 5 Years | 0 (0.0%) | 0 (0.0%) |
| 5 to 17 Years | 0 (0.0%) | 0 (0.0%) |
| 18 to 34 Years | 0 (0.0%) | 0 (0.0%) |
| 35 to 64 Years | 21 (9.1%) | 0 (0.0%) |
| 65 to 74 Years | 17 (13.0%) | 0 (0.0%) |
| 75 Years and over | 17 (27.9%) | 30 (27.0%) |
Disability Class: Vision Difficulty
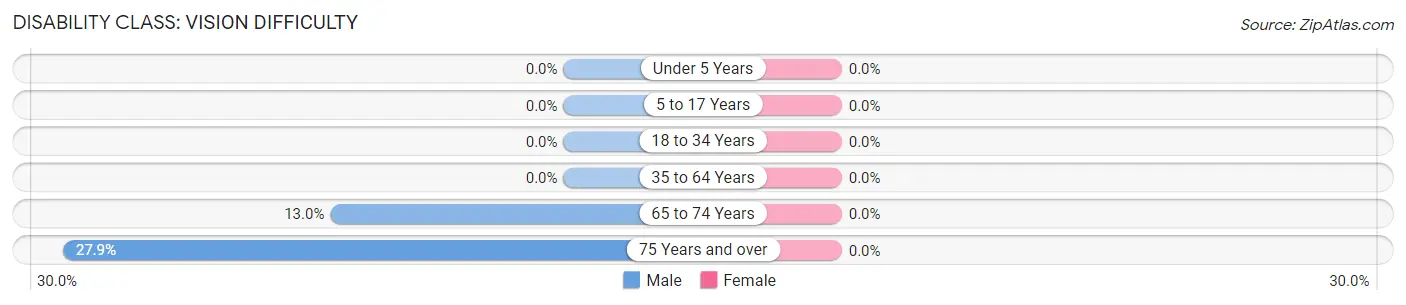
| Age Bracket | Male | Female |
| Under 5 Years | 0 (0.0%) | 0 (0.0%) |
| 5 to 17 Years | 0 (0.0%) | 0 (0.0%) |
| 18 to 34 Years | 0 (0.0%) | 0 (0.0%) |
| 35 to 64 Years | 0 (0.0%) | 0 (0.0%) |
| 65 to 74 Years | 17 (13.0%) | 0 (0.0%) |
| 75 Years and over | 17 (27.9%) | 0 (0.0%) |
Disability Class: Cognitive Difficulty
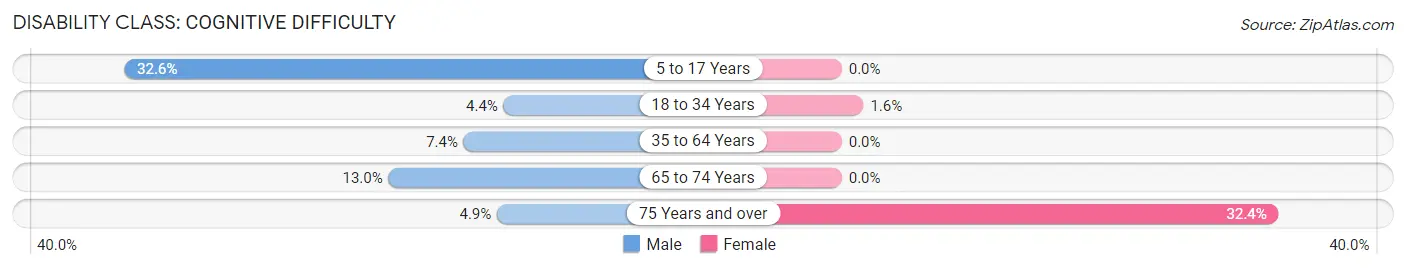
| Age Bracket | Male | Female |
| 5 to 17 Years | 60 (32.6%) | 0 (0.0%) |
| 18 to 34 Years | 9 (4.4%) | 2 (1.6%) |
| 35 to 64 Years | 17 (7.4%) | 0 (0.0%) |
| 65 to 74 Years | 17 (13.0%) | 0 (0.0%) |
| 75 Years and over | 3 (4.9%) | 36 (32.4%) |
Disability Class: Ambulatory Difficulty
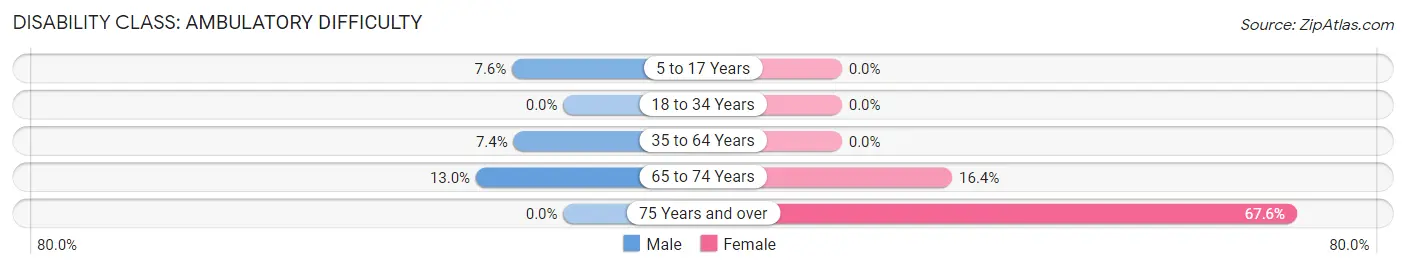
| Age Bracket | Male | Female |
| 5 to 17 Years | 14 (7.6%) | 0 (0.0%) |
| 18 to 34 Years | 0 (0.0%) | 0 (0.0%) |
| 35 to 64 Years | 17 (7.4%) | 0 (0.0%) |
| 65 to 74 Years | 17 (13.0%) | 19 (16.4%) |
| 75 Years and over | 0 (0.0%) | 75 (67.6%) |
Disability Class: Self-Care Difficulty
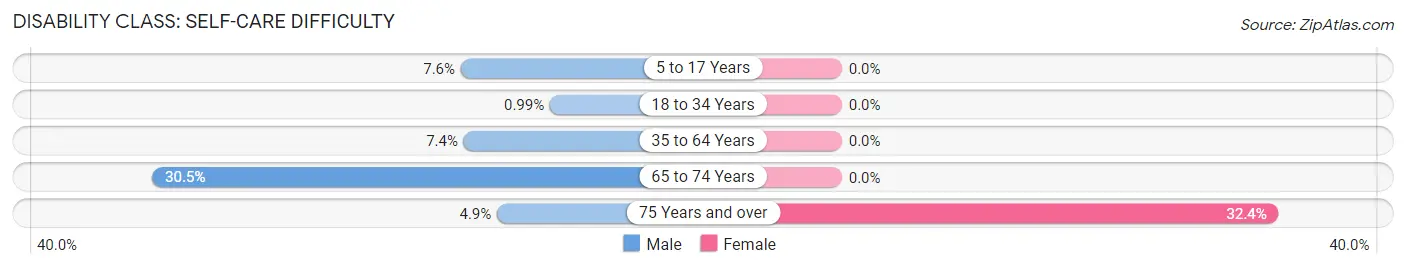
| Age Bracket | Male | Female |
| 5 to 17 Years | 14 (7.6%) | 0 (0.0%) |
| 18 to 34 Years | 2 (1.0%) | 0 (0.0%) |
| 35 to 64 Years | 17 (7.4%) | 0 (0.0%) |
| 65 to 74 Years | 40 (30.5%) | 0 (0.0%) |
| 75 Years and over | 3 (4.9%) | 36 (32.4%) |
Technology Access in Lee
Computing Device Access in Lee
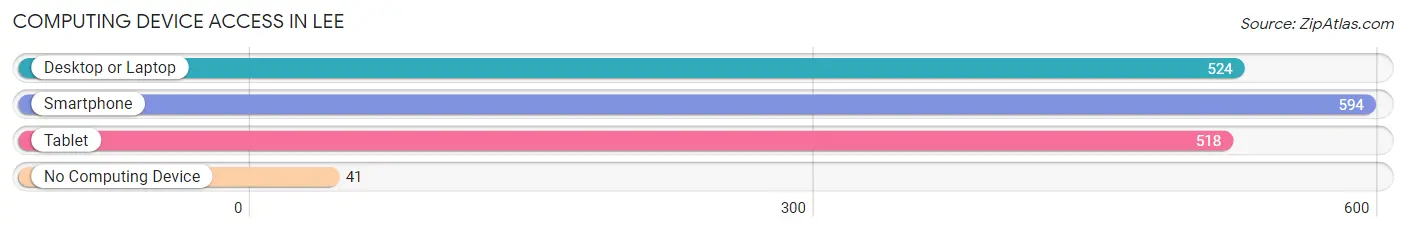
| Device Type | # Households | % Households |
| Desktop or Laptop | 524 | 75.3% |
| Smartphone | 594 | 85.3% |
| Tablet | 518 | 74.4% |
| No Computing Device | 41 | 5.9% |
| Total | 696 | 100.0% |
Internet Access in Lee
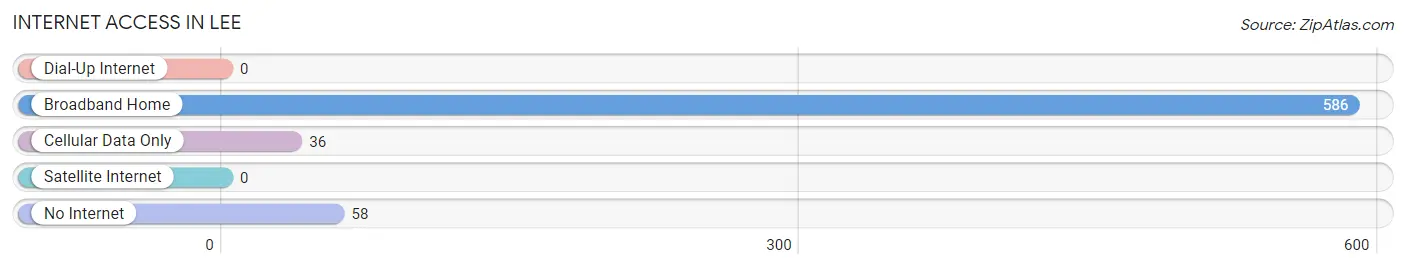
| Internet Type | # Households | % Households |
| Dial-Up Internet | 0 | 0.0% |
| Broadband Home | 586 | 84.2% |
| Cellular Data Only | 36 | 5.2% |
| Satellite Internet | 0 | 0.0% |
| No Internet | 58 | 8.3% |
| Total | 696 | 100.0% |
Lee Summary
MA History
Massachusetts is one of the original 13 colonies and was founded in 1620 by the Pilgrims. The colony was founded on the principles of religious freedom and self-governance. The colony was initially governed by the Mayflower Compact, which established a form of self-government. The colony was also the site of the first Thanksgiving in 1621.
In 1691, Massachusetts became a royal colony, and the government was controlled by the British monarchy. During this period, Massachusetts was a major center of the American Revolution. The colony was the site of the Boston Tea Party in 1773, and the Battles of Lexington and Concord in 1775. Massachusetts was also the birthplace of the American Revolution, with the Declaration of Independence being signed in 1776.
Massachusetts was the first state to ratify the United States Constitution in 1788, and it was the sixth state to join the Union. During the 19th century, Massachusetts was a major center of the Industrial Revolution, with the development of the textile industry and the growth of the railroad industry.
Massachusetts was also the site of the first public school in the United States, the Boston Latin School, which was founded in 1635. The state was also the birthplace of the American Transcendentalist movement, which was led by Ralph Waldo Emerson and Henry David Thoreau.
MA Geography
Massachusetts is located in the northeastern United States, bordered by New Hampshire, Vermont, Rhode Island, Connecticut, and New York. The state is divided into four distinct regions: the Berkshires, the Pioneer Valley, the Central Massachusetts Plateau, and the Coastal Plain.
The Berkshires are located in the western part of the state and are known for their rolling hills and forests. The Pioneer Valley is located in the central part of the state and is known for its agricultural and industrial production. The Central Massachusetts Plateau is located in the eastern part of the state and is known for its lakes and rivers. The Coastal Plain is located in the southeastern part of the state and is known for its beaches and coastal towns.
The highest point in Massachusetts is Mount Greylock, which is located in the Berkshires and has an elevation of 3,491 feet. The state is also home to several major rivers, including the Connecticut, Merrimack, and Charles Rivers.
MA Economy
Massachusetts has a diverse economy that is driven by a variety of industries. The state is home to a number of major corporations, including Fidelity Investments, Liberty Mutual Insurance, and Raytheon. The state is also home to a number of major universities, including Harvard University, MIT, and Boston University.
The state’s economy is also driven by the technology sector, with a number of major tech companies located in the state, including Amazon, Microsoft, and Oracle. The state is also home to a number of major healthcare companies, including Partners HealthCare and Boston Scientific.
The state’s economy is also driven by tourism, with a number of major attractions, including the Freedom Trail, Fenway Park, and the New England Aquarium.
MA Demographics
As of 2019, the population of Massachusetts was 6.9 million. The state is home to a diverse population, with the largest ethnic groups being White (77.3%), Hispanic or Latino (11.2%), and Black or African American (7.2%).
The median household income in Massachusetts is $77,385, and the median home value is $400,000. The state has a high rate of educational attainment, with over 90% of adults having at least a high school diploma.
The state is also home to a number of major cities, including Boston, Worcester, Springfield, and Cambridge. The state is also home to a number of major universities, including Harvard University, MIT, and Boston University.
Common Questions
What is Per Capita Income in Lee?
Per Capita income in Lee is $46,136.
What is the Median Family Income in Lee?
Median Family Income in Lee is $107,012.
What is the Median Household income in Lee?
Median Household Income in Lee is $78,021.
What is Income or Wage Gap in Lee?
Income or Wage Gap in Lee is 68.0%.
Women in Lee earn 32.0 cents for every dollar earned by a man.
What is Inequality or Gini Index in Lee?
Inequality or Gini Index in Lee is 0.37.
What is the Total Population of Lee?
Total Population of Lee is 1,507.
What is the Total Male Population of Lee?
Total Male Population of Lee is 832.
What is the Total Female Population of Lee?
Total Female Population of Lee is 675.
What is the Ratio of Males per 100 Females in Lee?
There are 123.26 Males per 100 Females in Lee.
What is the Ratio of Females per 100 Males in Lee?
There are 81.13 Females per 100 Males in Lee.
What is the Median Population Age in Lee?
Median Population Age in Lee is 50.0 Years.
What is the Average Family Size in Lee
Average Family Size in Lee is 2.9 People.
What is the Average Household Size in Lee
Average Household Size in Lee is 2.0 People.
How Large is the Labor Force in Lee?
There are 842 People in the Labor Forcein in Lee.
What is the Percentage of People in the Labor Force in Lee?
62.8% of People are in the Labor Force in Lee.
What is the Unemployment Rate in Lee?
Unemployment Rate in Lee is 5.8%.