Longmeadow, MA Map & Demographics
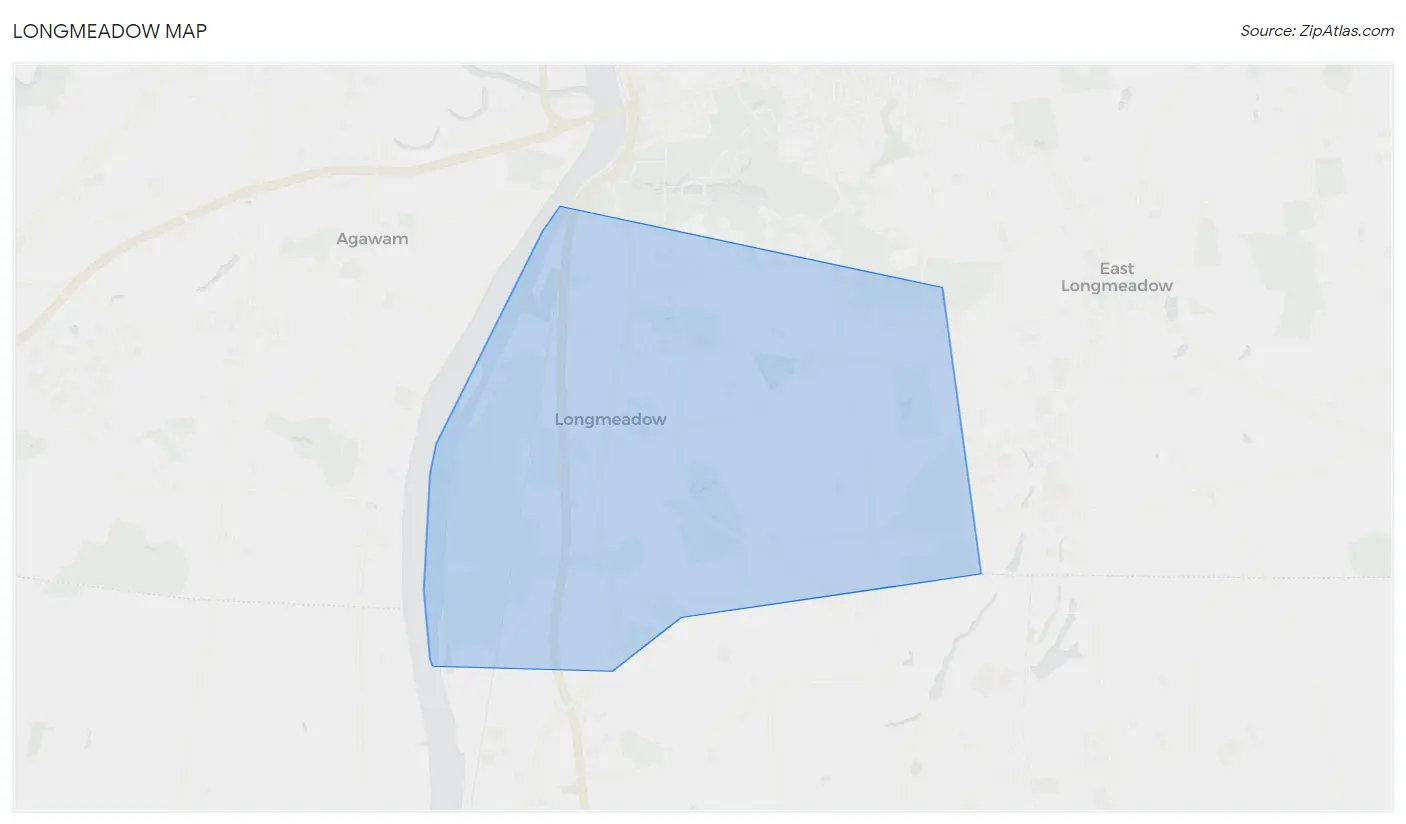
Longmeadow Map
Longmeadow Overview
$64,358
PER CAPITA INCOME
$171,929
AVG FAMILY INCOME
$138,218
AVG HOUSEHOLD INCOME
42.0%
WAGE / INCOME GAP [ % ]
58.0¢/ $1
WAGE / INCOME GAP [ $ ]
$13,492
FAMILY INCOME DEFICIT
0.42
INEQUALITY / GINI INDEX
15,789
TOTAL POPULATION
7,248
MALE POPULATION
8,541
FEMALE POPULATION
84.86
MALES / 100 FEMALES
117.84
FEMALES / 100 MALES
44.8
MEDIAN AGE
3.2
AVG FAMILY SIZE
2.6
AVG HOUSEHOLD SIZE
7,323
LABOR FORCE [ PEOPLE ]
58.8%
PERCENT IN LABOR FORCE
6.5%
UNEMPLOYMENT RATE
Longmeadow Zip Codes
Longmeadow Area Codes
Income in Longmeadow
Income Overview in Longmeadow
Per Capita Income in Longmeadow is $64,358, while median incomes of families and households are $171,929 and $138,218 respectively.
| Characteristic | Number | Measure |
| Per Capita Income | 15,789 | $64,358 |
| Median Family Income | 4,210 | $171,929 |
| Mean Family Income | 4,210 | $206,229 |
| Median Household Income | 5,811 | $138,218 |
| Mean Household Income | 5,811 | $176,443 |
| Income Deficit | 4,210 | $13,492 |
| Wage / Income Gap (%) | 15,789 | 41.96% |
| Wage / Income Gap ($) | 15,789 | 58.04¢ per $1 |
| Gini / Inequality Index | 15,789 | 0.42 |
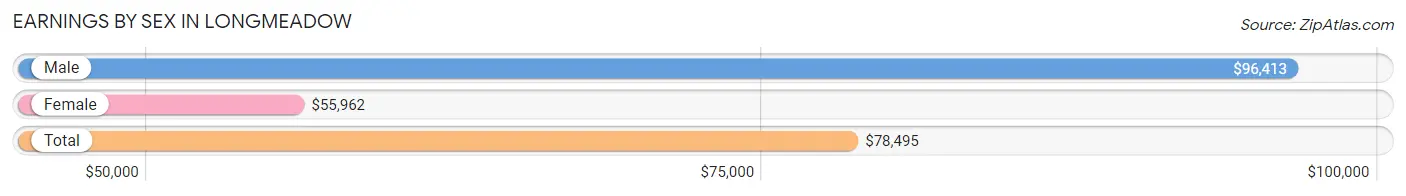
Earnings by Sex in Longmeadow
Average Earnings in Longmeadow are $78,495, $96,413 for men and $55,962 for women, a difference of 42.0%.
| Sex | Number | Average Earnings |
| Male | 4,294 (56.1%) | $96,413 |
| Female | 3,359 (43.9%) | $55,962 |
| Total | 7,653 (100.0%) | $78,495 |
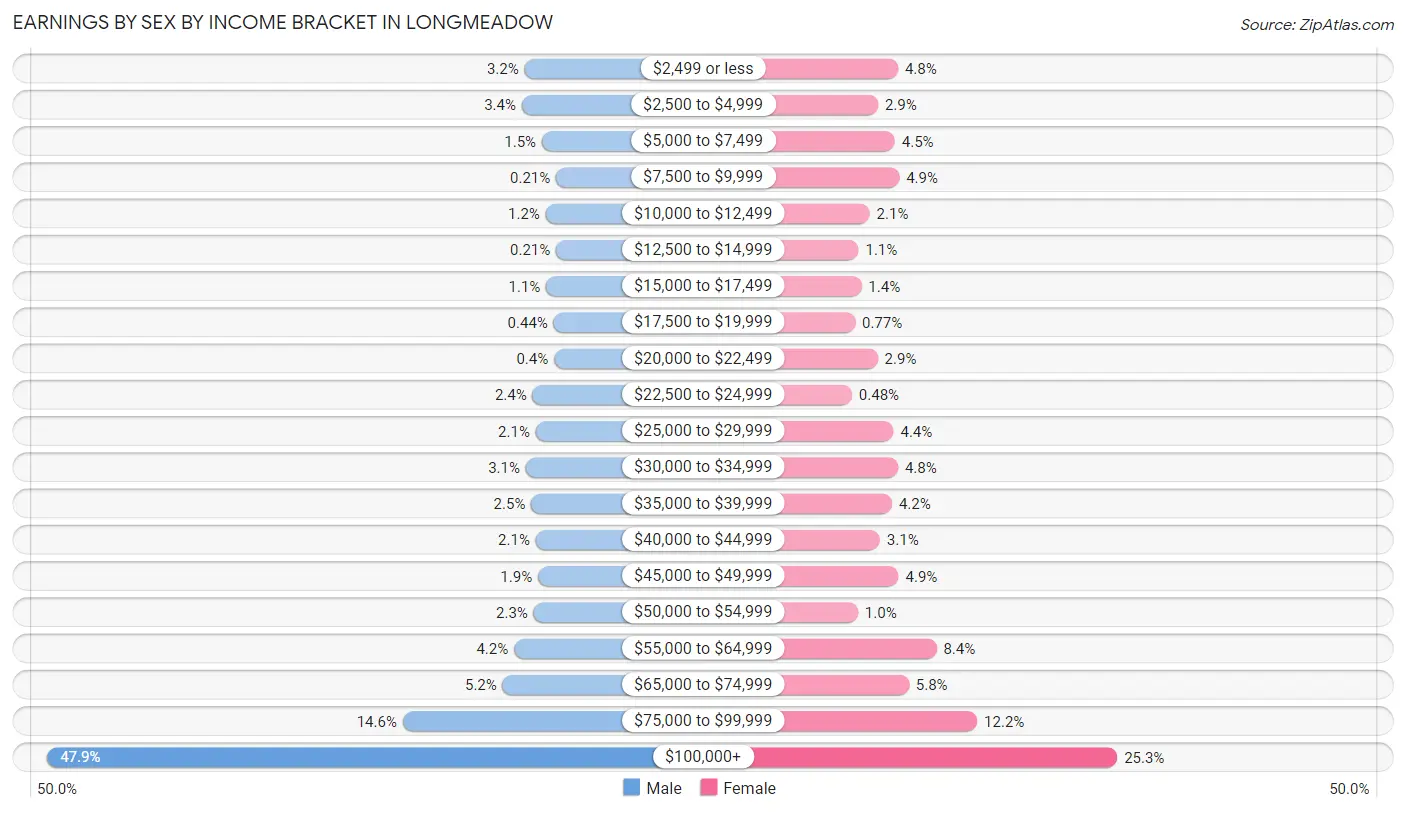
Earnings by Sex by Income Bracket in Longmeadow
The most common earnings brackets in Longmeadow are $100,000+ for men (2,056 | 47.9%) and $100,000+ for women (851 | 25.3%).
| Income | Male | Female |
| $2,499 or less | 136 (3.2%) | 161 (4.8%) |
| $2,500 to $4,999 | 147 (3.4%) | 98 (2.9%) |
| $5,000 to $7,499 | 66 (1.5%) | 151 (4.5%) |
| $7,500 to $9,999 | 9 (0.2%) | 165 (4.9%) |
| $10,000 to $12,499 | 51 (1.2%) | 72 (2.1%) |
| $12,500 to $14,999 | 9 (0.2%) | 37 (1.1%) |
| $15,000 to $17,499 | 49 (1.1%) | 46 (1.4%) |
| $17,500 to $19,999 | 19 (0.4%) | 26 (0.8%) |
| $20,000 to $22,499 | 17 (0.4%) | 97 (2.9%) |
| $22,500 to $24,999 | 104 (2.4%) | 16 (0.5%) |
| $25,000 to $29,999 | 91 (2.1%) | 147 (4.4%) |
| $30,000 to $34,999 | 131 (3.0%) | 161 (4.8%) |
| $35,000 to $39,999 | 109 (2.5%) | 142 (4.2%) |
| $40,000 to $44,999 | 91 (2.1%) | 104 (3.1%) |
| $45,000 to $49,999 | 82 (1.9%) | 163 (4.9%) |
| $50,000 to $54,999 | 99 (2.3%) | 35 (1.0%) |
| $55,000 to $64,999 | 178 (4.2%) | 282 (8.4%) |
| $65,000 to $74,999 | 224 (5.2%) | 195 (5.8%) |
| $75,000 to $99,999 | 626 (14.6%) | 410 (12.2%) |
| $100,000+ | 2,056 (47.9%) | 851 (25.3%) |
| Total | 4,294 (100.0%) | 3,359 (100.0%) |
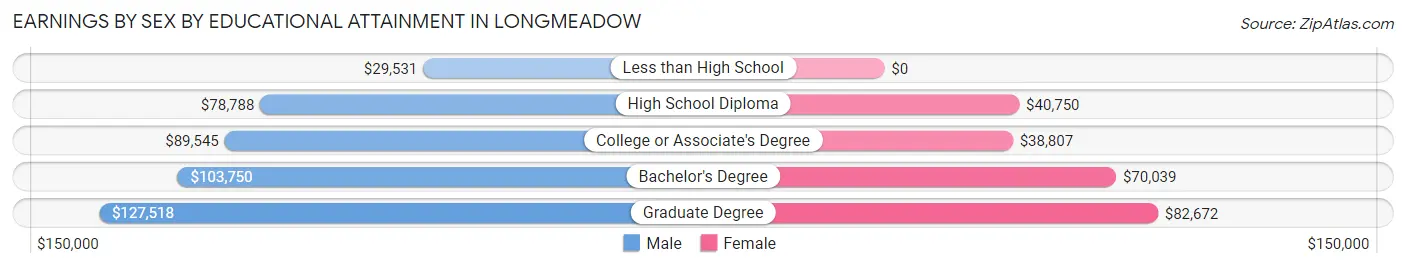
Earnings by Sex by Educational Attainment in Longmeadow
Average earnings in Longmeadow are $104,229 for men and $66,375 for women, a difference of 36.3%. Men with an educational attainment of graduate degree enjoy the highest average annual earnings of $127,518, while those with less than high school education earn the least with $29,531. Women with an educational attainment of graduate degree earn the most with the average annual earnings of $82,672, while those with college or associate's degree education have the smallest earnings of $38,807.
| Educational Attainment | Male Income | Female Income |
| Less than High School | $29,531 | $0 |
| High School Diploma | $78,788 | $40,750 |
| College or Associate's Degree | $89,545 | $38,807 |
| Bachelor's Degree | $103,750 | $70,039 |
| Graduate Degree | $127,518 | $82,672 |
| Total | $104,229 | $66,375 |
Family Income in Longmeadow
Family Income Brackets in Longmeadow
According to the Longmeadow family income data, there are 1,642 families falling into the $200,000+ income range, which is the most common income bracket and makes up 39.0% of all families.
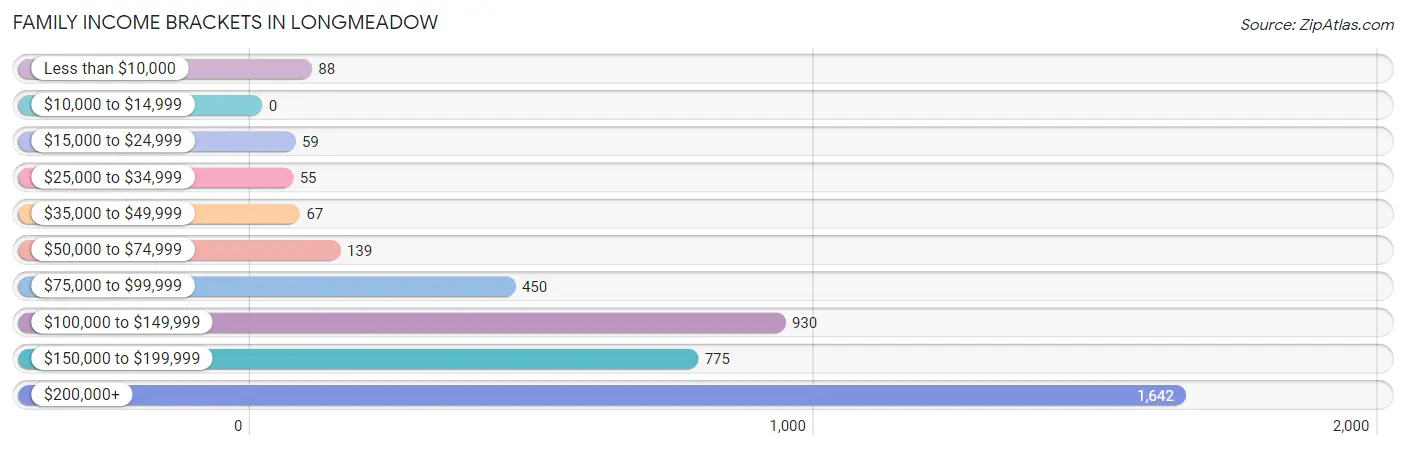
| Income Bracket | # Families | % Families |
| Less than $10,000 | 88 | 2.1% |
| $10,000 to $14,999 | 0 | 0.0% |
| $15,000 to $24,999 | 59 | 1.4% |
| $25,000 to $34,999 | 55 | 1.3% |
| $35,000 to $49,999 | 67 | 1.6% |
| $50,000 to $74,999 | 139 | 3.3% |
| $75,000 to $99,999 | 450 | 10.7% |
| $100,000 to $149,999 | 930 | 22.1% |
| $150,000 to $199,999 | 775 | 18.4% |
| $200,000+ | 1,642 | 39.0% |
Family Income by Famaliy Size in Longmeadow
7+ person families (46 | 1.1%) account for the highest median family income in Longmeadow with $250,001 per family, while 2-person families (1,675 | 39.8%) have the highest median income of $69,660 per family member.
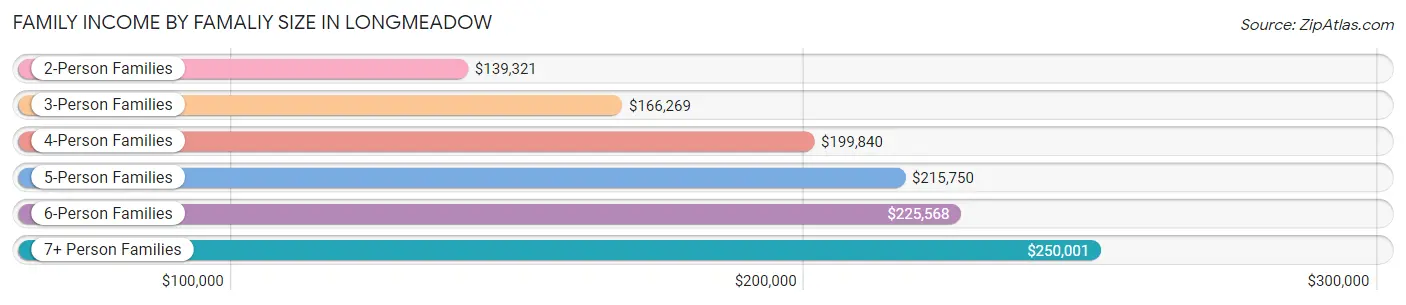
| Income Bracket | # Families | Median Income |
| 2-Person Families | 1,675 (39.8%) | $139,321 |
| 3-Person Families | 966 (23.0%) | $166,269 |
| 4-Person Families | 992 (23.6%) | $199,840 |
| 5-Person Families | 418 (9.9%) | $215,750 |
| 6-Person Families | 113 (2.7%) | $225,568 |
| 7+ Person Families | 46 (1.1%) | $250,001 |
| Total | 4,210 (100.0%) | $171,929 |
Family Income by Number of Earners in Longmeadow
The median family income in Longmeadow is $171,929, with families comprising 3+ earners (440) having the highest median family income of $203,988, while families with no earners (526) have the lowest median family income of $98,000, accounting for 10.4% and 12.5% of families, respectively.
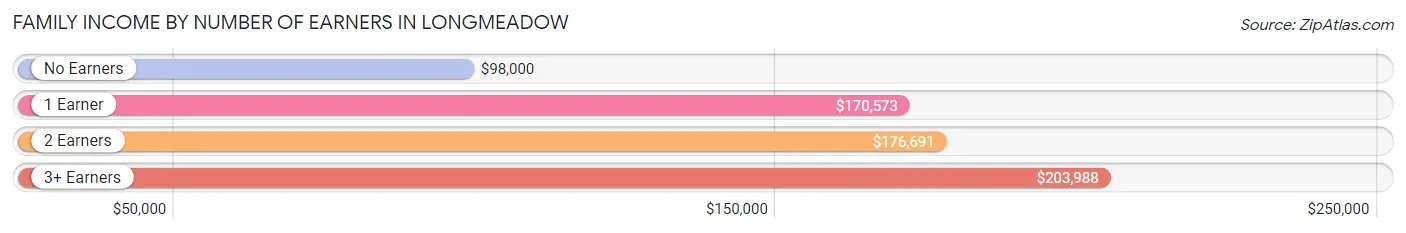
| Number of Earners | # Families | Median Income |
| No Earners | 526 (12.5%) | $98,000 |
| 1 Earner | 1,348 (32.0%) | $170,573 |
| 2 Earners | 1,896 (45.0%) | $176,691 |
| 3+ Earners | 440 (10.4%) | $203,988 |
| Total | 4,210 (100.0%) | $171,929 |
Household Income in Longmeadow
Household Income Brackets in Longmeadow
With 1,772 households falling in the category, the $200,000+ income range is the most frequent in Longmeadow, accounting for 30.5% of all households. In contrast, only 52 households (0.9%) fall into the $10,000 to $14,999 income bracket, making it the least populous group.
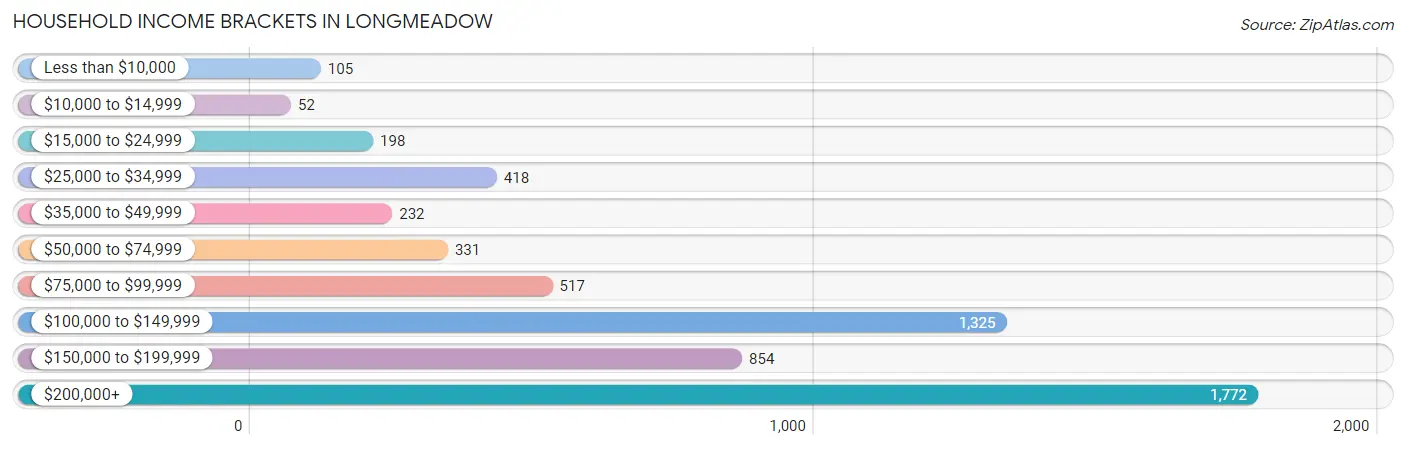
| Income Bracket | # Households | % Households |
| Less than $10,000 | 105 | 1.8% |
| $10,000 to $14,999 | 52 | 0.9% |
| $15,000 to $24,999 | 198 | 3.4% |
| $25,000 to $34,999 | 418 | 7.2% |
| $35,000 to $49,999 | 232 | 4.0% |
| $50,000 to $74,999 | 331 | 5.7% |
| $75,000 to $99,999 | 517 | 8.9% |
| $100,000 to $149,999 | 1,325 | 22.8% |
| $150,000 to $199,999 | 854 | 14.7% |
| $200,000+ | 1,772 | 30.5% |
Household Income by Householder Age in Longmeadow
The median household income in Longmeadow is $138,218, with the highest median household income of $170,341 found in the 45 to 64 years age bracket for the primary householder. A total of 2,316 households (39.9%) fall into this category.
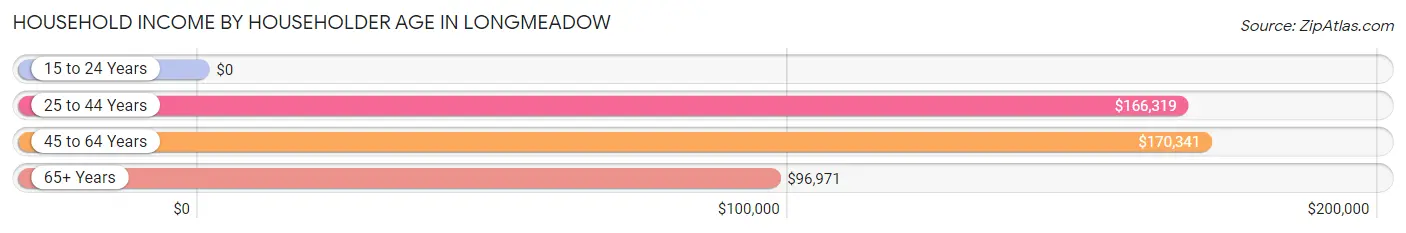
| Income Bracket | # Households | Median Income |
| 15 to 24 Years | 0 (0.0%) | $0 |
| 25 to 44 Years | 1,302 (22.4%) | $166,319 |
| 45 to 64 Years | 2,316 (39.9%) | $170,341 |
| 65+ Years | 2,193 (37.7%) | $96,971 |
| Total | 5,811 (100.0%) | $138,218 |
Poverty in Longmeadow
Income Below Poverty by Sex and Age in Longmeadow
With 2.9% poverty level for males and 4.6% for females among the residents of Longmeadow, 6 to 11 year old males and 18 to 24 year old females are the most vulnerable to poverty, with 80 males (14.4%) and 50 females (13.3%) in their respective age groups living below the poverty level.
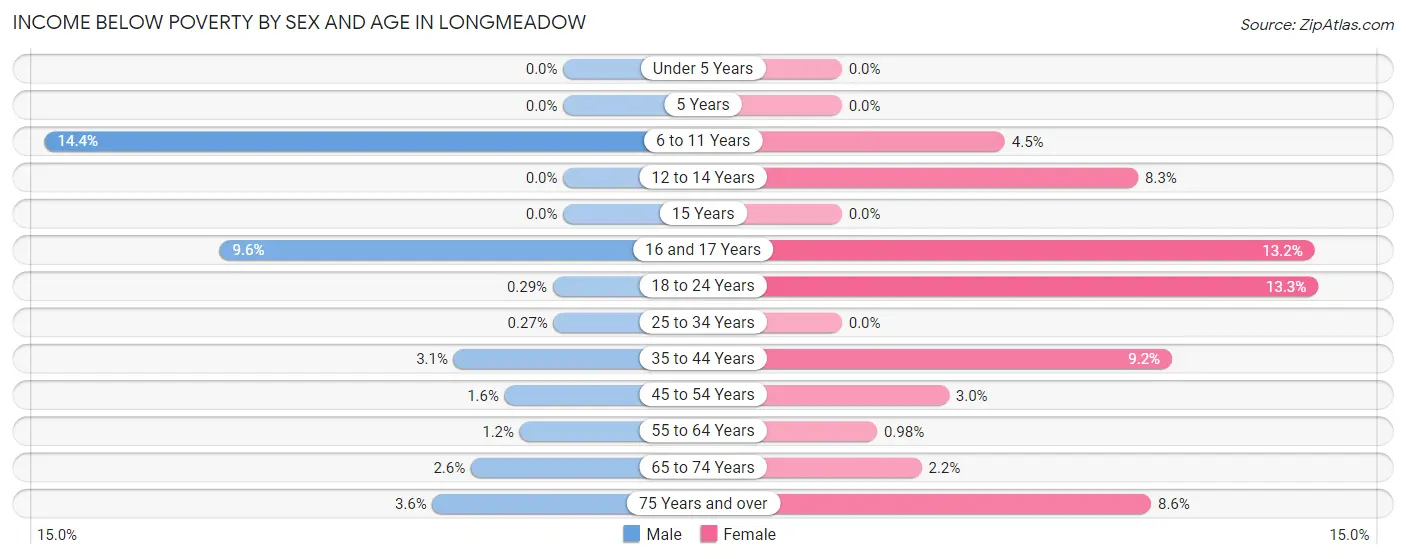
| Age Bracket | Male | Female |
| Under 5 Years | 0 (0.0%) | 0 (0.0%) |
| 5 Years | 0 (0.0%) | 0 (0.0%) |
| 6 to 11 Years | 80 (14.4%) | 33 (4.5%) |
| 12 to 14 Years | 0 (0.0%) | 33 (8.3%) |
| 15 Years | 0 (0.0%) | 0 (0.0%) |
| 16 and 17 Years | 31 (9.6%) | 20 (13.2%) |
| 18 to 24 Years | 1 (0.3%) | 50 (13.3%) |
| 25 to 34 Years | 2 (0.3%) | 0 (0.0%) |
| 35 to 44 Years | 26 (3.0%) | 87 (9.2%) |
| 45 to 54 Years | 16 (1.6%) | 35 (3.0%) |
| 55 to 64 Years | 12 (1.2%) | 11 (1.0%) |
| 65 to 74 Years | 19 (2.6%) | 23 (2.2%) |
| 75 Years and over | 24 (3.6%) | 82 (8.6%) |
| Total | 211 (2.9%) | 374 (4.6%) |
Income Above Poverty by Sex and Age in Longmeadow
According to the poverty statistics in Longmeadow, males aged under 5 years and females aged under 5 years are the age groups that are most secure financially, with 100.0% of males and 100.0% of females in these age groups living above the poverty line.
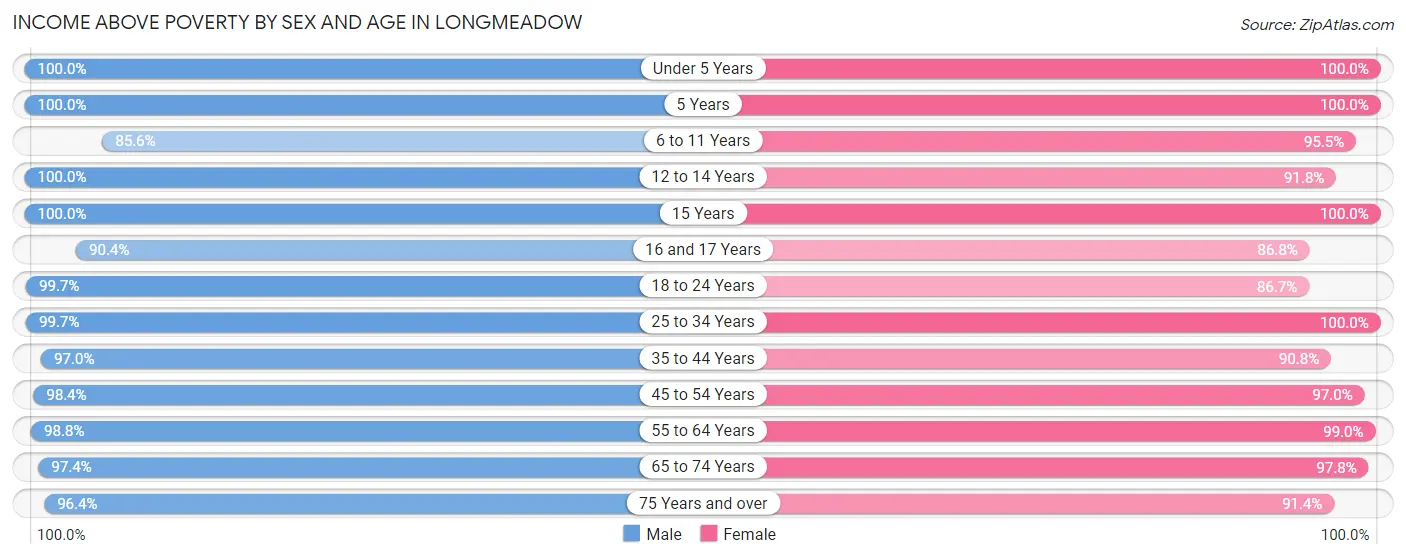
| Age Bracket | Male | Female |
| Under 5 Years | 460 (100.0%) | 450 (100.0%) |
| 5 Years | 79 (100.0%) | 90 (100.0%) |
| 6 to 11 Years | 474 (85.6%) | 694 (95.5%) |
| 12 to 14 Years | 336 (100.0%) | 367 (91.7%) |
| 15 Years | 112 (100.0%) | 104 (100.0%) |
| 16 and 17 Years | 293 (90.4%) | 132 (86.8%) |
| 18 to 24 Years | 348 (99.7%) | 327 (86.7%) |
| 25 to 34 Years | 738 (99.7%) | 548 (100.0%) |
| 35 to 44 Years | 827 (97.0%) | 860 (90.8%) |
| 45 to 54 Years | 964 (98.4%) | 1,141 (97.0%) |
| 55 to 64 Years | 978 (98.8%) | 1,111 (99.0%) |
| 65 to 74 Years | 721 (97.4%) | 1,014 (97.8%) |
| 75 Years and over | 635 (96.4%) | 870 (91.4%) |
| Total | 6,965 (97.1%) | 7,708 (95.4%) |
Income Below Poverty Among Married-Couple Families in Longmeadow
The poverty statistics for married-couple families in Longmeadow show that 1.7% or 63 of the total 3,714 families live below the poverty line. Families with 1 or 2 children have the highest poverty rate of 2.2%, comprising of 25 families. On the other hand, families with 3 or 4 children have the lowest poverty rate of 0.0%, which includes 0 families.

| Children | Above Poverty | Below Poverty |
| No Children | 2,029 (98.2%) | 38 (1.8%) |
| 1 or 2 Children | 1,109 (97.8%) | 25 (2.2%) |
| 3 or 4 Children | 478 (100.0%) | 0 (0.0%) |
| 5 or more Children | 35 (100.0%) | 0 (0.0%) |
| Total | 3,651 (98.3%) | 63 (1.7%) |
Income Below Poverty Among Single-Parent Households in Longmeadow
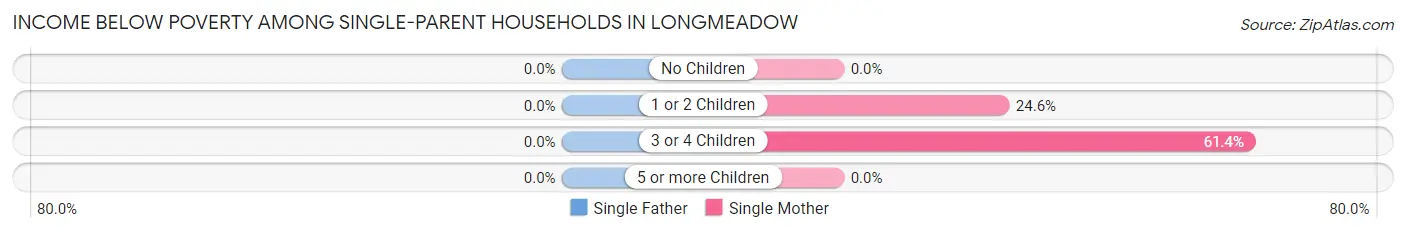
| Children | Single Father | Single Mother |
| No Children | 0 (0.0%) | 0 (0.0%) |
| 1 or 2 Children | 0 (0.0%) | 48 (24.6%) |
| 3 or 4 Children | 0 (0.0%) | 35 (61.4%) |
| 5 or more Children | 0 (0.0%) | 0 (0.0%) |
| Total | 0 (0.0%) | 83 (18.7%) |
Income Below Poverty Among Married-Couple vs Single-Parent Households in Longmeadow
The poverty data for Longmeadow shows that 63 of the married-couple family households (1.7%) and 83 of the single-parent households (16.7%) are living below the poverty level. Within the married-couple family households, those with 1 or 2 children have the highest poverty rate, with 25 households (2.2%) falling below the poverty line. Among the single-parent households, those with 3 or 4 children have the highest poverty rate, with 35 household (61.4%) living below poverty.
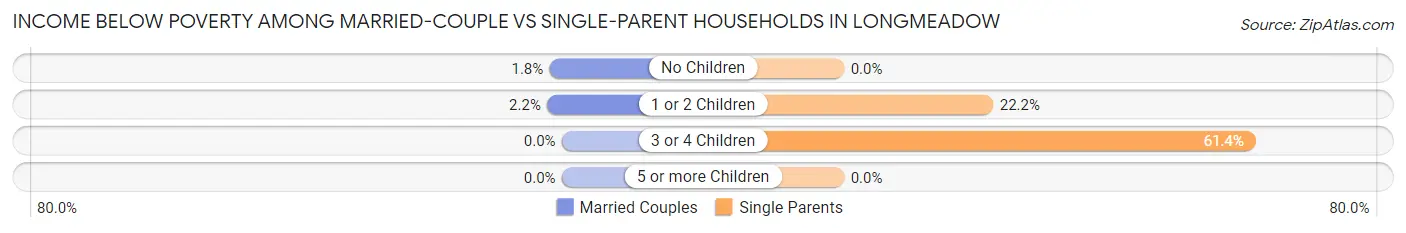
| Children | Married-Couple Families | Single-Parent Households |
| No Children | 38 (1.8%) | 0 (0.0%) |
| 1 or 2 Children | 25 (2.2%) | 48 (22.2%) |
| 3 or 4 Children | 0 (0.0%) | 35 (61.4%) |
| 5 or more Children | 0 (0.0%) | 0 (0.0%) |
| Total | 63 (1.7%) | 83 (16.7%) |
Race in Longmeadow
The most populous races in Longmeadow are White / Caucasian (13,918 | 88.1%), Asian (926 | 5.9%), and Two or more Races (680 | 4.3%).
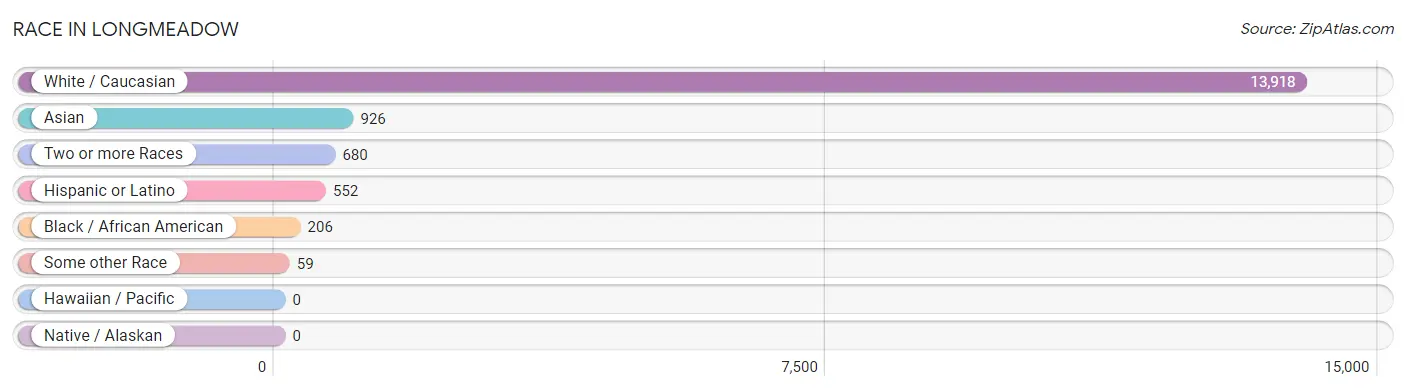
| Race | # Population | % Population |
| Asian | 926 | 5.9% |
| Black / African American | 206 | 1.3% |
| Hawaiian / Pacific | 0 | 0.0% |
| Hispanic or Latino | 552 | 3.5% |
| Native / Alaskan | 0 | 0.0% |
| White / Caucasian | 13,918 | 88.1% |
| Two or more Races | 680 | 4.3% |
| Some other Race | 59 | 0.4% |
| Total | 15,789 | 100.0% |
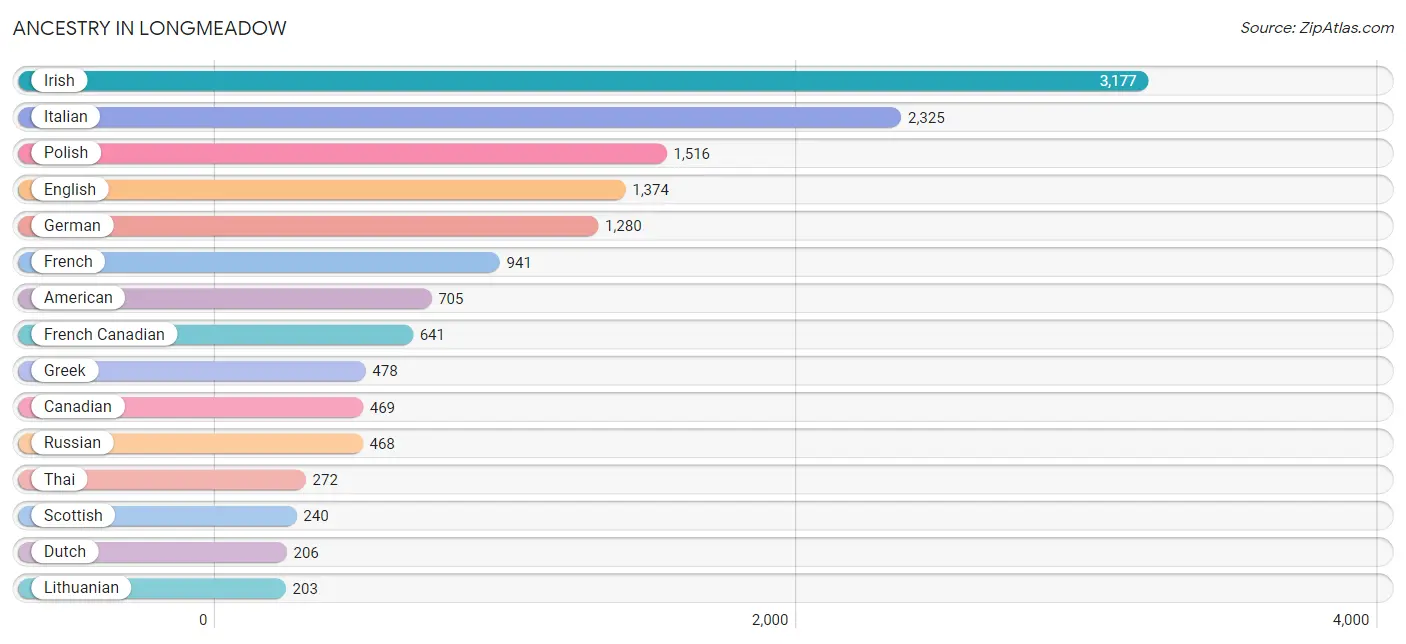
Ancestry in Longmeadow
The most populous ancestries reported in Longmeadow are Irish (3,177 | 20.1%), Italian (2,325 | 14.7%), Polish (1,516 | 9.6%), English (1,374 | 8.7%), and German (1,280 | 8.1%), together accounting for 61.3% of all Longmeadow residents.
| Ancestry | # Population | % Population |
| Albanian | 30 | 0.2% |
| American | 705 | 4.5% |
| Arab | 191 | 1.2% |
| Armenian | 66 | 0.4% |
| Australian | 10 | 0.1% |
| Austrian | 66 | 0.4% |
| Bhutanese | 6 | 0.0% |
| British | 34 | 0.2% |
| Burmese | 78 | 0.5% |
| Canadian | 469 | 3.0% |
| Central American | 196 | 1.2% |
| Cuban | 40 | 0.3% |
| Czech | 20 | 0.1% |
| Danish | 20 | 0.1% |
| Dominican | 9 | 0.1% |
| Dutch | 206 | 1.3% |
| Eastern European | 138 | 0.9% |
| English | 1,374 | 8.7% |
| European | 191 | 1.2% |
| Filipino | 35 | 0.2% |
| Finnish | 19 | 0.1% |
| French | 941 | 6.0% |
| French Canadian | 641 | 4.1% |
| German | 1,280 | 8.1% |
| Greek | 478 | 3.0% |
| Guatemalan | 196 | 1.2% |
| Haitian | 71 | 0.4% |
| Hungarian | 37 | 0.2% |
| Icelander | 23 | 0.2% |
| Indian (Asian) | 167 | 1.1% |
| Iranian | 99 | 0.6% |
| Iraqi | 13 | 0.1% |
| Irish | 3,177 | 20.1% |
| Israeli | 53 | 0.3% |
| Italian | 2,325 | 14.7% |
| Jamaican | 37 | 0.2% |
| Japanese | 47 | 0.3% |
| Jordanian | 14 | 0.1% |
| Korean | 78 | 0.5% |
| Latvian | 12 | 0.1% |
| Lebanese | 153 | 1.0% |
| Lithuanian | 203 | 1.3% |
| Malaysian | 4 | 0.0% |
| Mexican | 29 | 0.2% |
| Nigerian | 30 | 0.2% |
| Northern European | 5 | 0.0% |
| Norwegian | 33 | 0.2% |
| Peruvian | 4 | 0.0% |
| Polish | 1,516 | 9.6% |
| Portuguese | 194 | 1.2% |
| Puerto Rican | 136 | 0.9% |
| Russian | 468 | 3.0% |
| Scandinavian | 43 | 0.3% |
| Scotch-Irish | 115 | 0.7% |
| Scottish | 240 | 1.5% |
| Slavic | 4 | 0.0% |
| Slovak | 5 | 0.0% |
| South African | 15 | 0.1% |
| South American | 22 | 0.1% |
| Spanish | 16 | 0.1% |
| Sri Lankan | 26 | 0.2% |
| Subsaharan African | 49 | 0.3% |
| Swedish | 128 | 0.8% |
| Swiss | 12 | 0.1% |
| Thai | 272 | 1.7% |
| Ukrainian | 43 | 0.3% |
| Venezuelan | 18 | 0.1% |
| Welsh | 16 | 0.1% | View All 68 Rows |
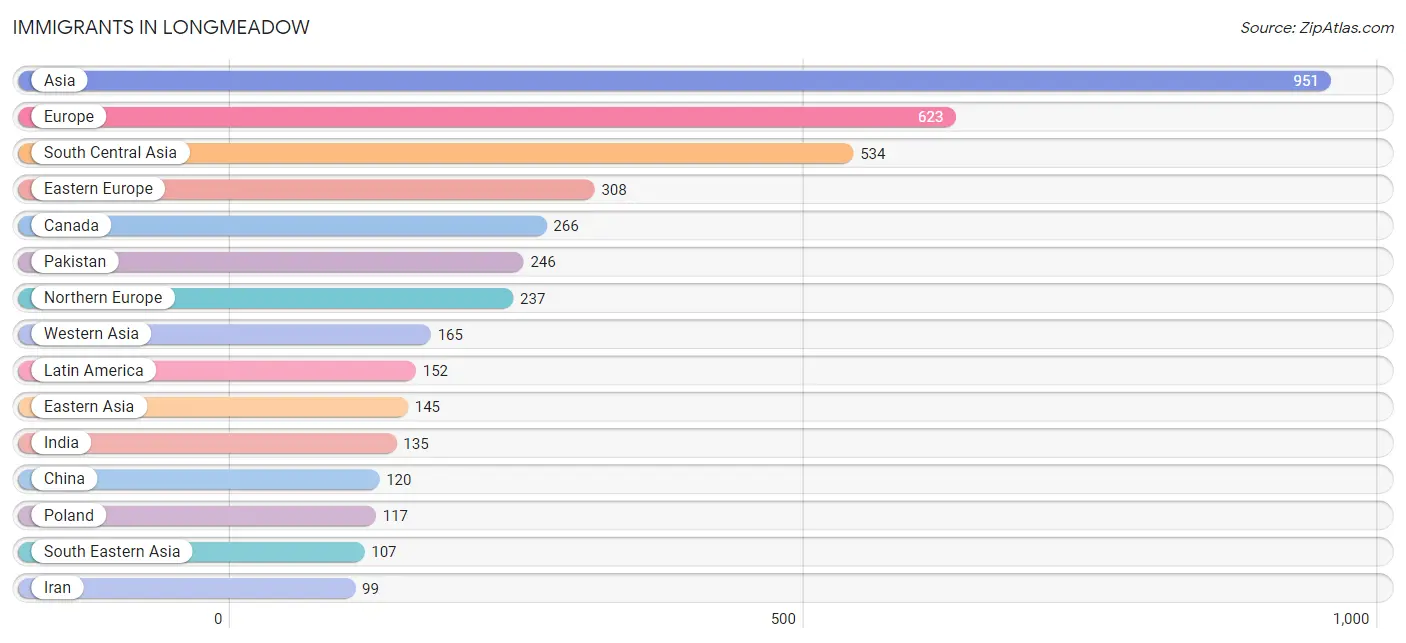
Immigrants in Longmeadow
The most numerous immigrant groups reported in Longmeadow came from Asia (951 | 6.0%), Europe (623 | 4.0%), South Central Asia (534 | 3.4%), Eastern Europe (308 | 1.9%), and Canada (266 | 1.7%), together accounting for 17.0% of all Longmeadow residents.
| Immigration Origin | # Population | % Population |
| Africa | 27 | 0.2% |
| Asia | 951 | 6.0% |
| Australia | 10 | 0.1% |
| Austria | 34 | 0.2% |
| Belarus | 93 | 0.6% |
| Canada | 266 | 1.7% |
| Caribbean | 69 | 0.4% |
| Central America | 83 | 0.5% |
| China | 120 | 0.8% |
| Cuba | 18 | 0.1% |
| Dominican Republic | 23 | 0.2% |
| Eastern Africa | 4 | 0.0% |
| Eastern Asia | 145 | 0.9% |
| Eastern Europe | 308 | 1.9% |
| England | 31 | 0.2% |
| Europe | 623 | 4.0% |
| Germany | 37 | 0.2% |
| Guatemala | 83 | 0.5% |
| Haiti | 12 | 0.1% |
| Hong Kong | 6 | 0.0% |
| Hungary | 10 | 0.1% |
| India | 135 | 0.9% |
| Iran | 99 | 0.6% |
| Iraq | 4 | 0.0% |
| Ireland | 25 | 0.2% |
| Israel | 35 | 0.2% |
| Italy | 7 | 0.0% |
| Jamaica | 16 | 0.1% |
| Jordan | 14 | 0.1% |
| Kazakhstan | 10 | 0.1% |
| Korea | 25 | 0.2% |
| Latin America | 152 | 1.0% |
| Lebanon | 25 | 0.2% |
| Malaysia | 43 | 0.3% |
| Nepal | 13 | 0.1% |
| Nigeria | 8 | 0.1% |
| Northern Europe | 237 | 1.5% |
| Oceania | 10 | 0.1% |
| Pakistan | 246 | 1.6% |
| Philippines | 53 | 0.3% |
| Poland | 117 | 0.7% |
| Russia | 53 | 0.3% |
| Scotland | 10 | 0.1% |
| South Africa | 15 | 0.1% |
| South Central Asia | 534 | 3.4% |
| South Eastern Asia | 107 | 0.7% |
| Southern Europe | 7 | 0.0% |
| Sri Lanka | 31 | 0.2% |
| Taiwan | 54 | 0.3% |
| Turkey | 19 | 0.1% |
| Ukraine | 17 | 0.1% |
| Vietnam | 11 | 0.1% |
| Western Africa | 8 | 0.1% |
| Western Asia | 165 | 1.1% |
| Western Europe | 71 | 0.4% | View All 55 Rows |
Sex and Age in Longmeadow
Sex and Age in Longmeadow
The most populous age groups in Longmeadow are 10 to 14 Years (610 | 8.4%) for men and 60 to 64 Years (680 | 8.0%) for women.
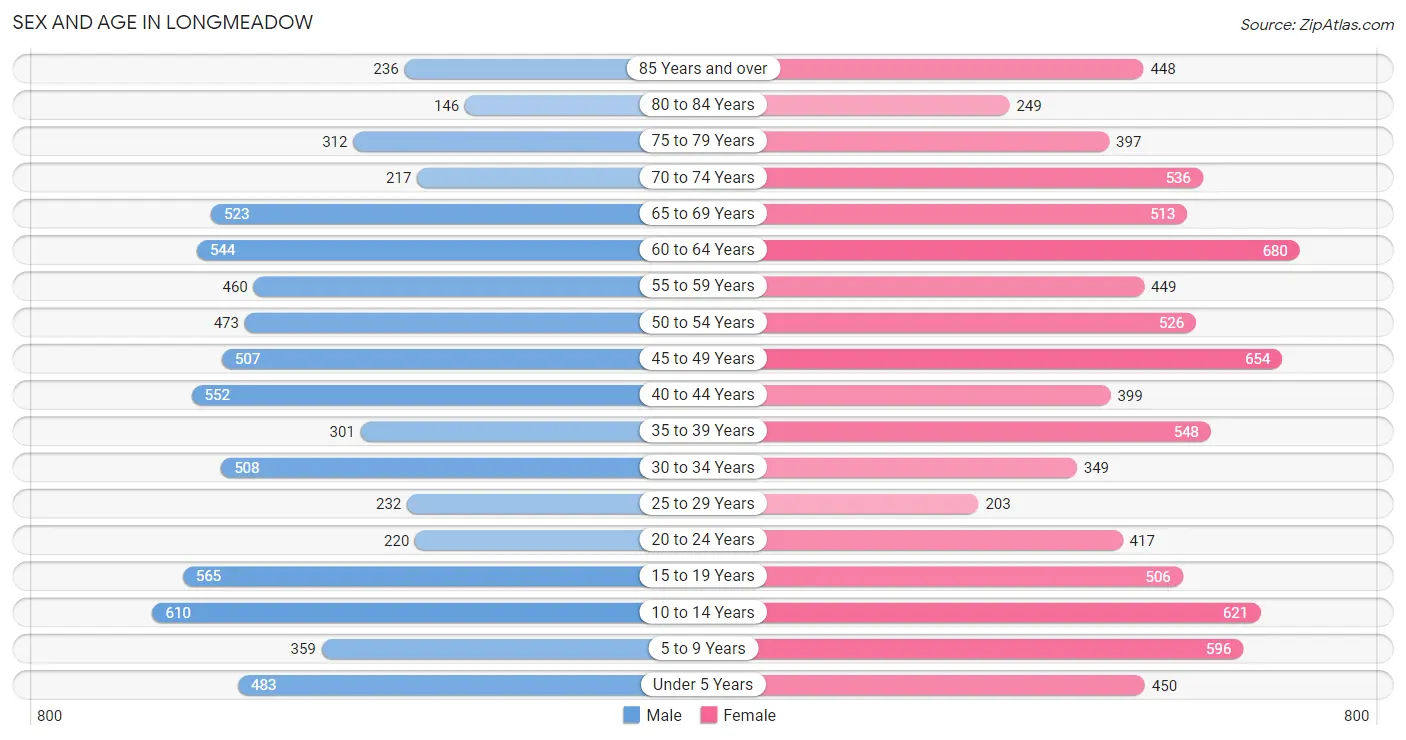
| Age Bracket | Male | Female |
| Under 5 Years | 483 (6.7%) | 450 (5.3%) |
| 5 to 9 Years | 359 (5.0%) | 596 (7.0%) |
| 10 to 14 Years | 610 (8.4%) | 621 (7.3%) |
| 15 to 19 Years | 565 (7.8%) | 506 (5.9%) |
| 20 to 24 Years | 220 (3.0%) | 417 (4.9%) |
| 25 to 29 Years | 232 (3.2%) | 203 (2.4%) |
| 30 to 34 Years | 508 (7.0%) | 349 (4.1%) |
| 35 to 39 Years | 301 (4.2%) | 548 (6.4%) |
| 40 to 44 Years | 552 (7.6%) | 399 (4.7%) |
| 45 to 49 Years | 507 (7.0%) | 654 (7.7%) |
| 50 to 54 Years | 473 (6.5%) | 526 (6.2%) |
| 55 to 59 Years | 460 (6.4%) | 449 (5.3%) |
| 60 to 64 Years | 544 (7.5%) | 680 (8.0%) |
| 65 to 69 Years | 523 (7.2%) | 513 (6.0%) |
| 70 to 74 Years | 217 (3.0%) | 536 (6.3%) |
| 75 to 79 Years | 312 (4.3%) | 397 (4.6%) |
| 80 to 84 Years | 146 (2.0%) | 249 (2.9%) |
| 85 Years and over | 236 (3.3%) | 448 (5.2%) |
| Total | 7,248 (100.0%) | 8,541 (100.0%) |
Families and Households in Longmeadow
Median Family Size in Longmeadow
The median family size in Longmeadow is 3.17 persons per family, with married-couple families (3,714 | 88.2%) accounting for the largest median family size of 3.22 persons per family. On the other hand, single male/father families (52 | 1.2%) represent the smallest median family size with 2.58 persons per family.
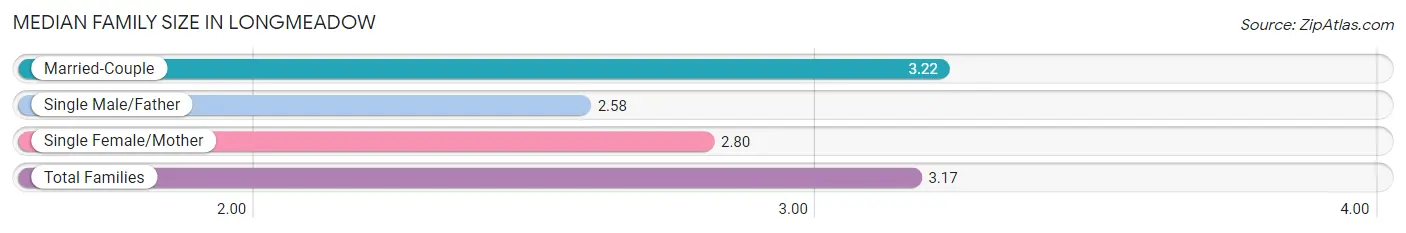
| Family Type | # Families | Family Size |
| Married-Couple | 3,714 (88.2%) | 3.22 |
| Single Male/Father | 52 (1.2%) | 2.58 |
| Single Female/Mother | 444 (10.5%) | 2.80 |
| Total Families | 4,210 (100.0%) | 3.17 |
Median Household Size in Longmeadow
The median household size in Longmeadow is 2.63 persons per household, with married-couple households (3,714 | 63.9%) accounting for the largest median household size of 3.23 persons per household. non-family households (1,601 | 27.6%) represent the smallest median household size with 1.14 persons per household.
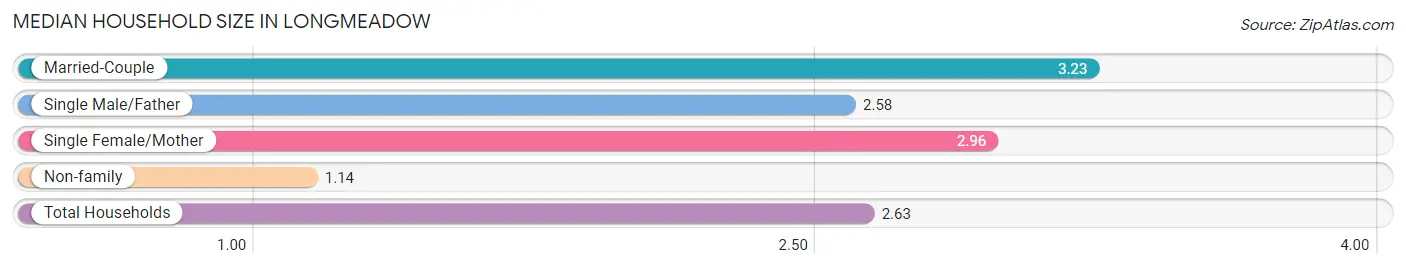
| Household Type | # Households | Household Size |
| Married-Couple | 3,714 (63.9%) | 3.23 |
| Single Male/Father | 52 (0.9%) | 2.58 |
| Single Female/Mother | 444 (7.6%) | 2.96 |
| Non-family | 1,601 (27.6%) | 1.14 |
| Total Households | 5,811 (100.0%) | 2.63 |
Household Size by Marriage Status in Longmeadow
Out of a total of 5,811 households in Longmeadow, 4,210 (72.5%) are family households, while 1,601 (27.6%) are nonfamily households. The most numerous type of family households are 2-person households, comprising 1,584, and the most common type of nonfamily households are 1-person households, comprising 1,410.
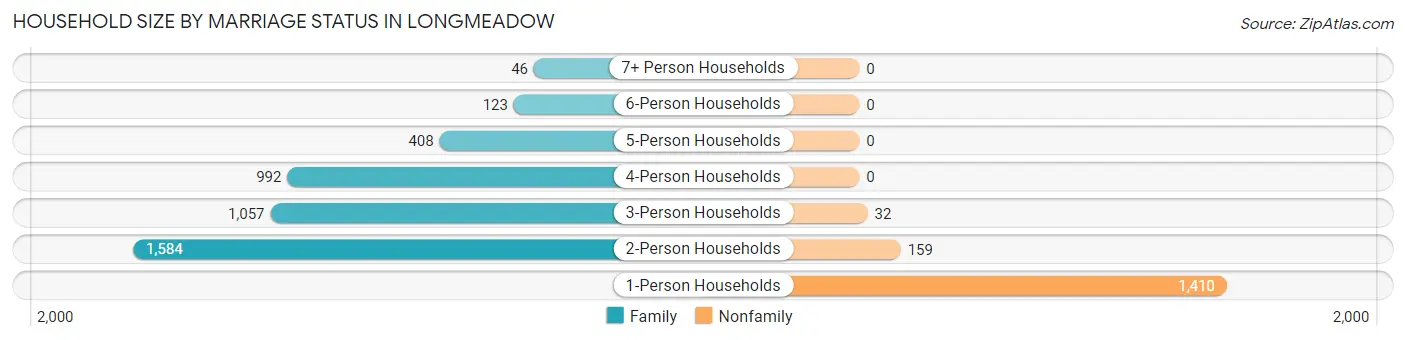
| Household Size | Family Households | Nonfamily Households |
| 1-Person Households | - | 1,410 (24.3%) |
| 2-Person Households | 1,584 (27.3%) | 159 (2.7%) |
| 3-Person Households | 1,057 (18.2%) | 32 (0.5%) |
| 4-Person Households | 992 (17.1%) | 0 (0.0%) |
| 5-Person Households | 408 (7.0%) | 0 (0.0%) |
| 6-Person Households | 123 (2.1%) | 0 (0.0%) |
| 7+ Person Households | 46 (0.8%) | 0 (0.0%) |
| Total | 4,210 (72.5%) | 1,601 (27.6%) |
Female Fertility in Longmeadow
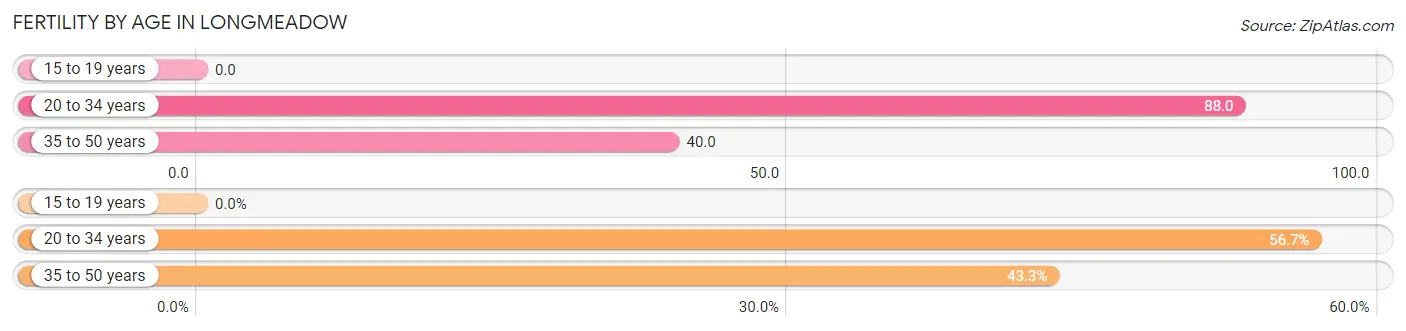
Fertility by Age in Longmeadow
Average fertility rate in Longmeadow is 49.0 births per 1,000 women. Women in the age bracket of 20 to 34 years have the highest fertility rate with 88.0 births per 1,000 women. Women in the age bracket of 20 to 34 years acount for 56.7% of all women with births.
| Age Bracket | Women with Births | Births / 1,000 Women |
| 15 to 19 years | 0 (0.0%) | 0.0 |
| 20 to 34 years | 85 (56.7%) | 88.0 |
| 35 to 50 years | 65 (43.3%) | 40.0 |
| Total | 150 (100.0%) | 49.0 |
Fertility by Age by Marriage Status in Longmeadow
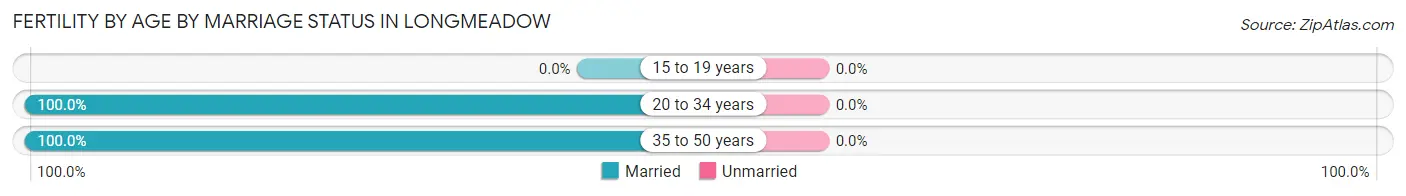
| Age Bracket | Married | Unmarried |
| 15 to 19 years | 0 (0.0%) | 0 (0.0%) |
| 20 to 34 years | 85 (100.0%) | 0 (0.0%) |
| 35 to 50 years | 65 (100.0%) | 0 (0.0%) |
| Total | 150 (100.0%) | 0 (0.0%) |
Fertility by Education in Longmeadow
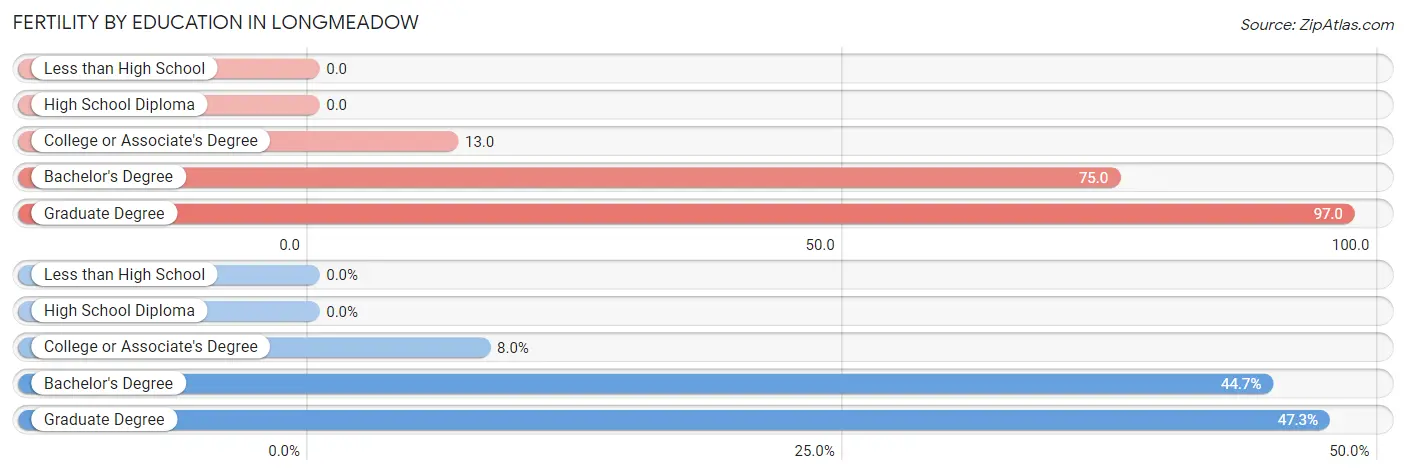
| Educational Attainment | Women with Births | Births / 1,000 Women |
| Less than High School | 0 (0.0%) | 0.0 |
| High School Diploma | 0 (0.0%) | 0.0 |
| College or Associate's Degree | 12 (8.0%) | 13.0 |
| Bachelor's Degree | 67 (44.7%) | 75.0 |
| Graduate Degree | 71 (47.3%) | 97.0 |
| Total | 150 (100.0%) | 49.0 |
Fertility by Education by Marriage Status in Longmeadow
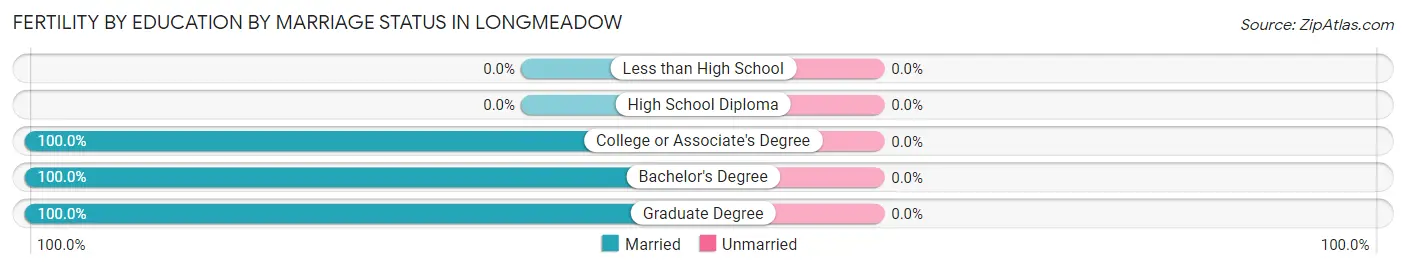
| Educational Attainment | Married | Unmarried |
| Less than High School | 0 (0.0%) | 0 (0.0%) |
| High School Diploma | 0 (0.0%) | 0 (0.0%) |
| College or Associate's Degree | 12 (100.0%) | 0 (0.0%) |
| Bachelor's Degree | 67 (100.0%) | 0 (0.0%) |
| Graduate Degree | 71 (100.0%) | 0 (0.0%) |
| Total | 150 (100.0%) | 0 (0.0%) |
Employment Characteristics in Longmeadow
Employment by Class of Employer in Longmeadow
Among the 6,794 employed individuals in Longmeadow, private company employees (3,951 | 58.2%), not-for-profit organizations (997 | 14.7%), and local government employees (587 | 8.6%) make up the most common classes of employment.
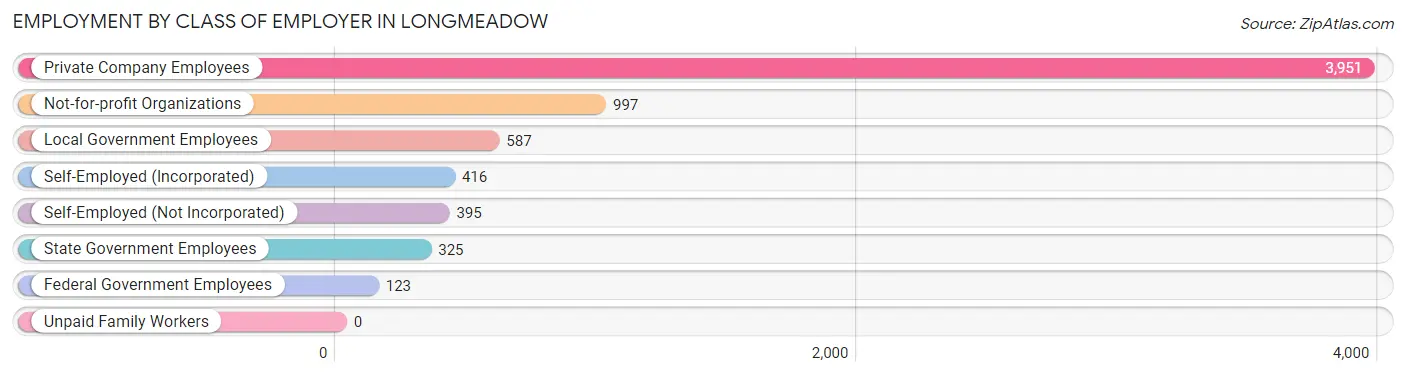
| Employer Class | # Employees | % Employees |
| Private Company Employees | 3,951 | 58.2% |
| Self-Employed (Incorporated) | 416 | 6.1% |
| Self-Employed (Not Incorporated) | 395 | 5.8% |
| Not-for-profit Organizations | 997 | 14.7% |
| Local Government Employees | 587 | 8.6% |
| State Government Employees | 325 | 4.8% |
| Federal Government Employees | 123 | 1.8% |
| Unpaid Family Workers | 0 | 0.0% |
| Total | 6,794 | 100.0% |
Employment Status by Age in Longmeadow
According to the labor force statistics for Longmeadow, out of the total population over 16 years of age (12,454), 58.8% or 7,323 individuals are in the labor force, with 6.5% or 476 of them unemployed. The age group with the highest labor force participation rate is 55 to 59 years, with 87.5% or 795 individuals in the labor force. Within the labor force, the 16 to 19 years age range has the highest percentage of unemployed individuals, with 21.8% or 49 of them being unemployed.
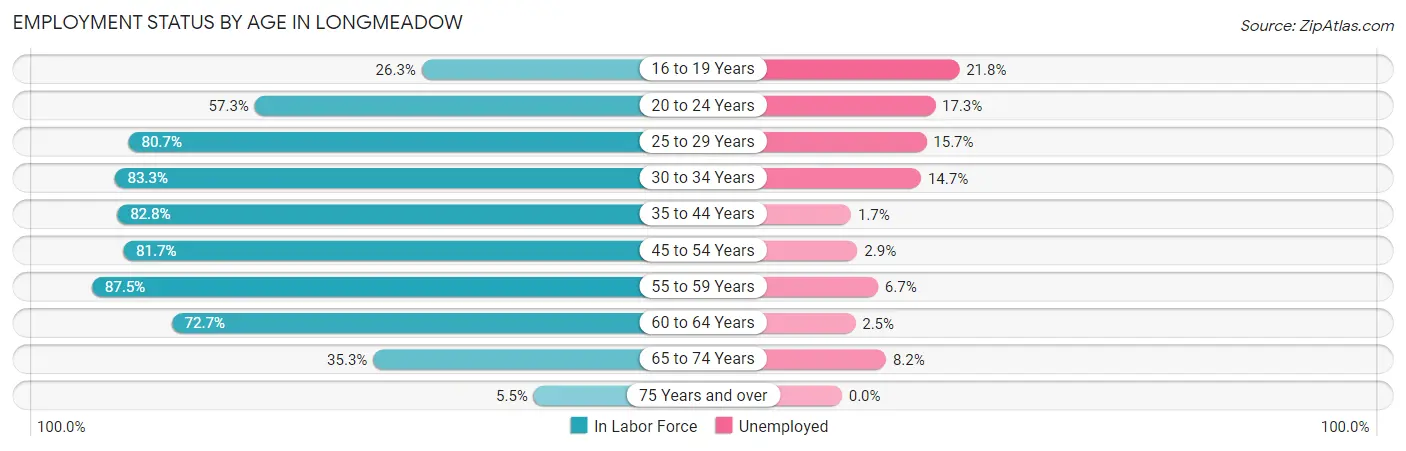
| Age Bracket | In Labor Force | Unemployed |
| 16 to 19 Years | 225 (26.3%) | 49 (21.8%) |
| 20 to 24 Years | 365 (57.3%) | 63 (17.3%) |
| 25 to 29 Years | 351 (80.7%) | 55 (15.7%) |
| 30 to 34 Years | 714 (83.3%) | 105 (14.7%) |
| 35 to 44 Years | 1,490 (82.8%) | 25 (1.7%) |
| 45 to 54 Years | 1,765 (81.7%) | 51 (2.9%) |
| 55 to 59 Years | 795 (87.5%) | 53 (6.7%) |
| 60 to 64 Years | 890 (72.7%) | 22 (2.5%) |
| 65 to 74 Years | 632 (35.3%) | 52 (8.2%) |
| 75 Years and over | 98 (5.5%) | 0 (0.0%) |
| Total | 7,323 (58.8%) | 476 (6.5%) |
Employment Status by Educational Attainment in Longmeadow
According to labor force statistics for Longmeadow, 81.3% of individuals (6,004) out of the total population between 25 and 64 years of age (7,385) are in the labor force, with 5.2% or 312 of them being unemployed. The group with the highest labor force participation rate are those with the educational attainment of bachelor's degree or higher, with 84.6% or 4,178 individuals in the labor force. Within the labor force, individuals with less than high school education have the highest percentage of unemployment, with 27.0% or 10 of them being unemployed.
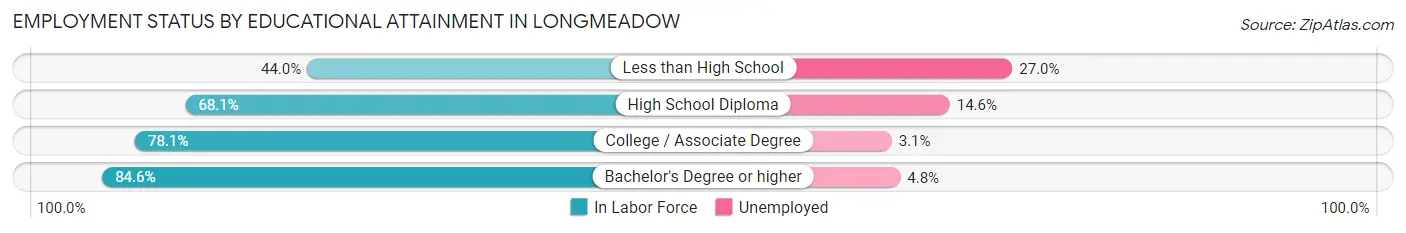
| Educational Attainment | In Labor Force | Unemployed |
| Less than High School | 37 (44.0%) | 23 (27.0%) |
| High School Diploma | 391 (68.1%) | 84 (14.6%) |
| College / Associate Degree | 1,397 (78.1%) | 55 (3.1%) |
| Bachelor's Degree or higher | 4,178 (84.6%) | 237 (4.8%) |
| Total | 6,004 (81.3%) | 384 (5.2%) |
Employment Occupations by Sex in Longmeadow
Management, Business, Science and Arts Occupations
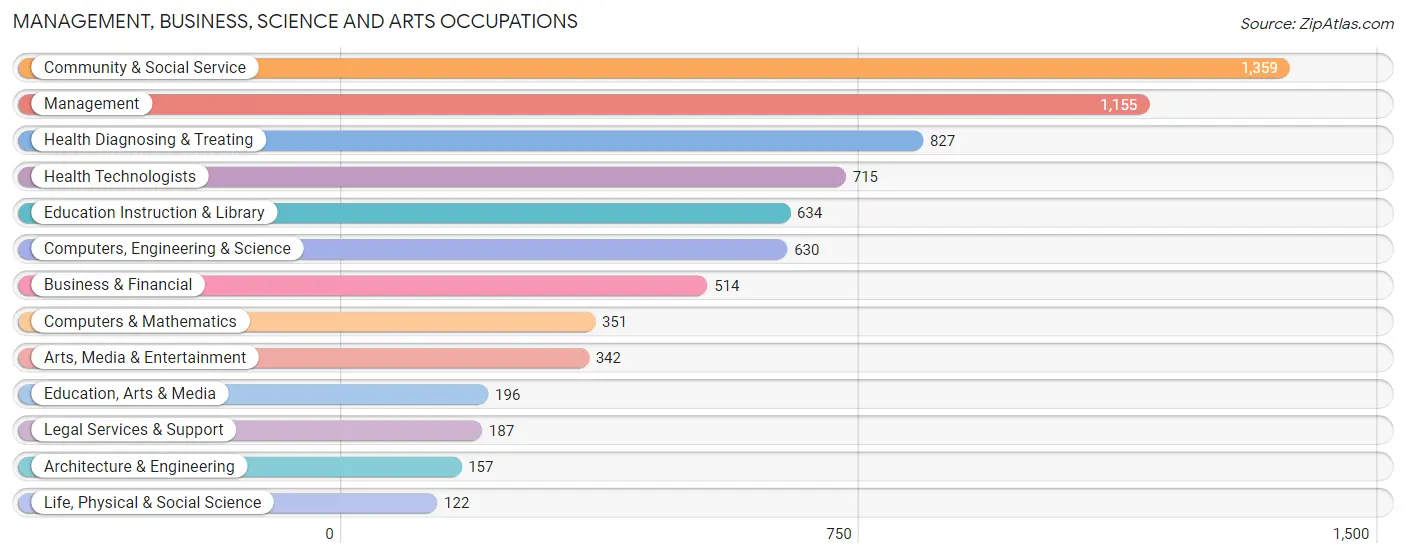
The most common Management, Business, Science and Arts occupations in Longmeadow are Community & Social Service (1,359 | 19.8%), Management (1,155 | 16.9%), Health Diagnosing & Treating (827 | 12.1%), Health Technologists (715 | 10.4%), and Education Instruction & Library (634 | 9.3%).
Management, Business, Science and Arts Occupations by Sex
Within the Management, Business, Science and Arts occupations in Longmeadow, the most male-oriented occupations are Architecture & Engineering (95.5%), Legal Services & Support (77.0%), and Arts, Media & Entertainment (76.9%), while the most female-oriented occupations are Education, Arts & Media (95.9%), Education Instruction & Library (77.8%), and Community & Social Service (59.1%).
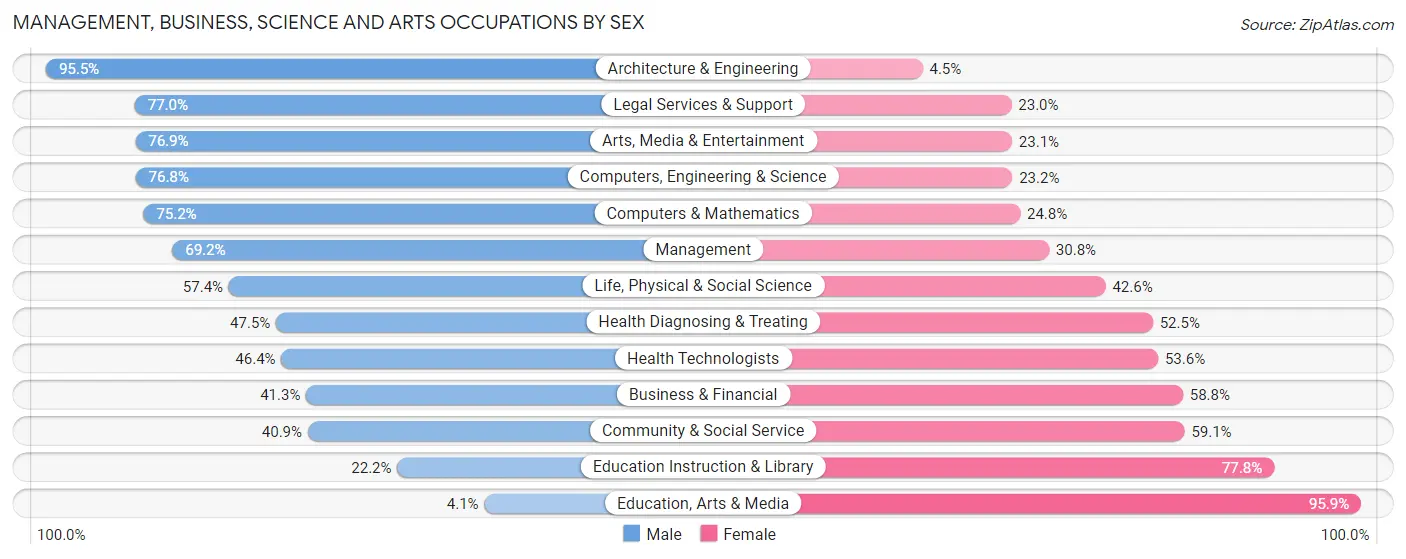
| Occupation | Male | Female |
| Management | 799 (69.2%) | 356 (30.8%) |
| Business & Financial | 212 (41.2%) | 302 (58.8%) |
| Computers, Engineering & Science | 484 (76.8%) | 146 (23.2%) |
| Computers & Mathematics | 264 (75.2%) | 87 (24.8%) |
| Architecture & Engineering | 150 (95.5%) | 7 (4.5%) |
| Life, Physical & Social Science | 70 (57.4%) | 52 (42.6%) |
| Community & Social Service | 556 (40.9%) | 803 (59.1%) |
| Education, Arts & Media | 8 (4.1%) | 188 (95.9%) |
| Legal Services & Support | 144 (77.0%) | 43 (23.0%) |
| Education Instruction & Library | 141 (22.2%) | 493 (77.8%) |
| Arts, Media & Entertainment | 263 (76.9%) | 79 (23.1%) |
| Health Diagnosing & Treating | 393 (47.5%) | 434 (52.5%) |
| Health Technologists | 332 (46.4%) | 383 (53.6%) |
| Total (Category) | 2,444 (54.5%) | 2,041 (45.5%) |
| Total (Overall) | 3,936 (57.5%) | 2,914 (42.5%) |
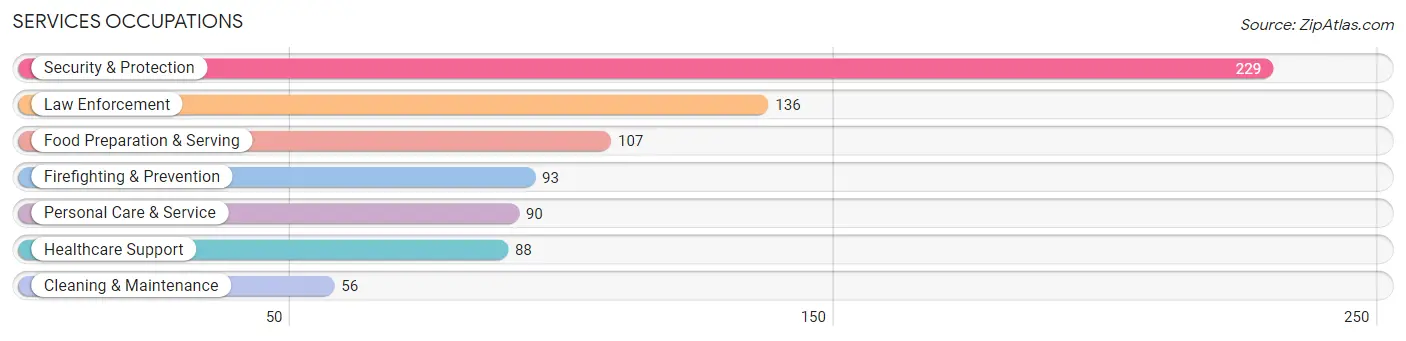
Services Occupations
The most common Services occupations in Longmeadow are Security & Protection (229 | 3.3%), Law Enforcement (136 | 2.0%), Food Preparation & Serving (107 | 1.6%), Firefighting & Prevention (93 | 1.4%), and Personal Care & Service (90 | 1.3%).
Services Occupations by Sex
Within the Services occupations in Longmeadow, the most male-oriented occupations are Law Enforcement (100.0%), Security & Protection (92.1%), and Firefighting & Prevention (80.6%), while the most female-oriented occupations are Personal Care & Service (85.6%), Healthcare Support (76.1%), and Food Preparation & Serving (69.2%).
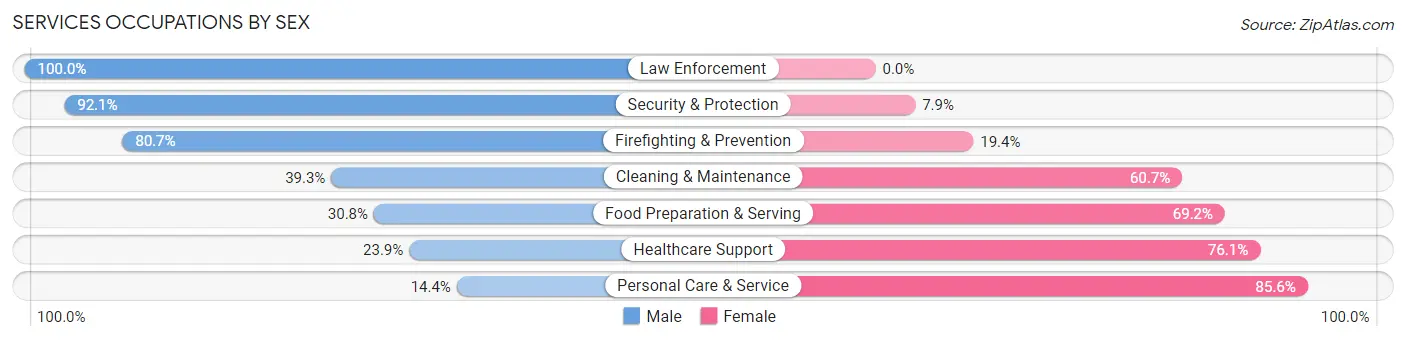
| Occupation | Male | Female |
| Healthcare Support | 21 (23.9%) | 67 (76.1%) |
| Security & Protection | 211 (92.1%) | 18 (7.9%) |
| Firefighting & Prevention | 75 (80.6%) | 18 (19.4%) |
| Law Enforcement | 136 (100.0%) | 0 (0.0%) |
| Food Preparation & Serving | 33 (30.8%) | 74 (69.2%) |
| Cleaning & Maintenance | 22 (39.3%) | 34 (60.7%) |
| Personal Care & Service | 13 (14.4%) | 77 (85.6%) |
| Total (Category) | 300 (52.6%) | 270 (47.4%) |
| Total (Overall) | 3,936 (57.5%) | 2,914 (42.5%) |
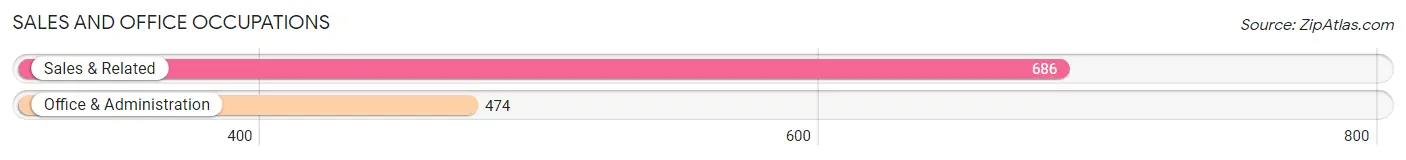
Sales and Office Occupations
The most common Sales and Office occupations in Longmeadow are Sales & Related (686 | 10.0%), and Office & Administration (474 | 6.9%).
Sales and Office Occupations by Sex
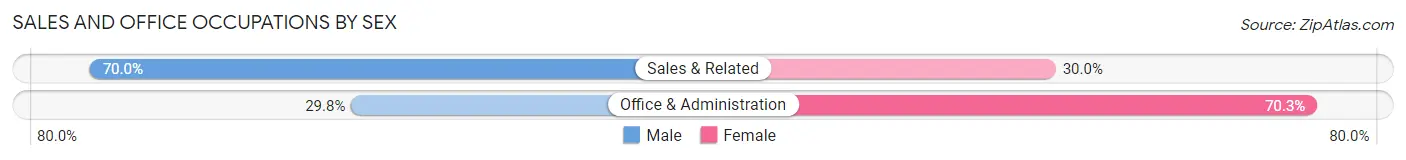
| Occupation | Male | Female |
| Sales & Related | 480 (70.0%) | 206 (30.0%) |
| Office & Administration | 141 (29.7%) | 333 (70.3%) |
| Total (Category) | 621 (53.5%) | 539 (46.5%) |
| Total (Overall) | 3,936 (57.5%) | 2,914 (42.5%) |
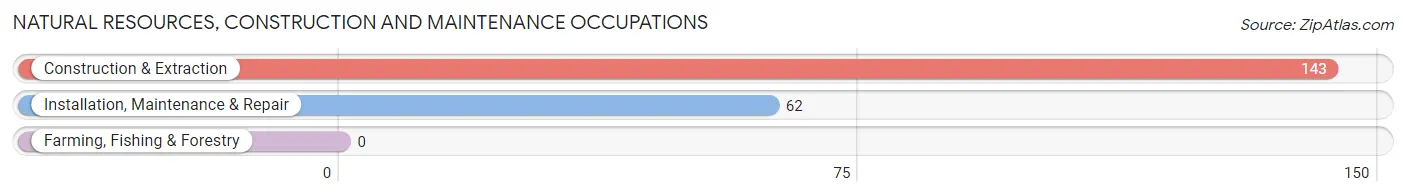
Natural Resources, Construction and Maintenance Occupations
The most common Natural Resources, Construction and Maintenance occupations in Longmeadow are Construction & Extraction (143 | 2.1%), and Installation, Maintenance & Repair (62 | 0.9%).
Natural Resources, Construction and Maintenance Occupations by Sex
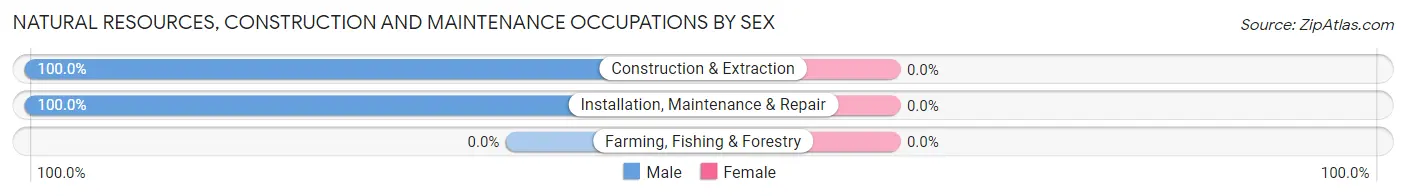
| Occupation | Male | Female |
| Farming, Fishing & Forestry | 0 (0.0%) | 0 (0.0%) |
| Construction & Extraction | 143 (100.0%) | 0 (0.0%) |
| Installation, Maintenance & Repair | 62 (100.0%) | 0 (0.0%) |
| Total (Category) | 205 (100.0%) | 0 (0.0%) |
| Total (Overall) | 3,936 (57.5%) | 2,914 (42.5%) |
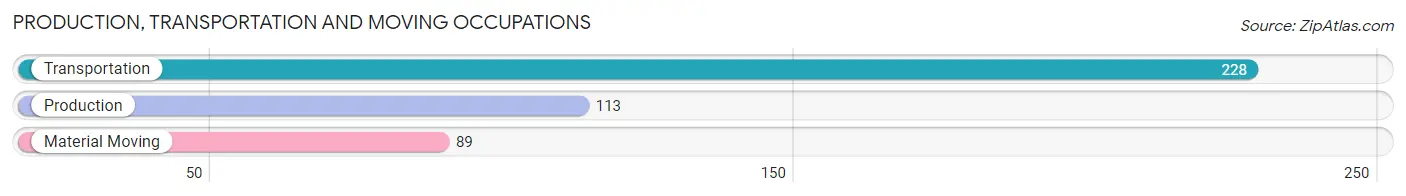
Production, Transportation and Moving Occupations
The most common Production, Transportation and Moving occupations in Longmeadow are Transportation (228 | 3.3%), Production (113 | 1.7%), and Material Moving (89 | 1.3%).
Production, Transportation and Moving Occupations by Sex
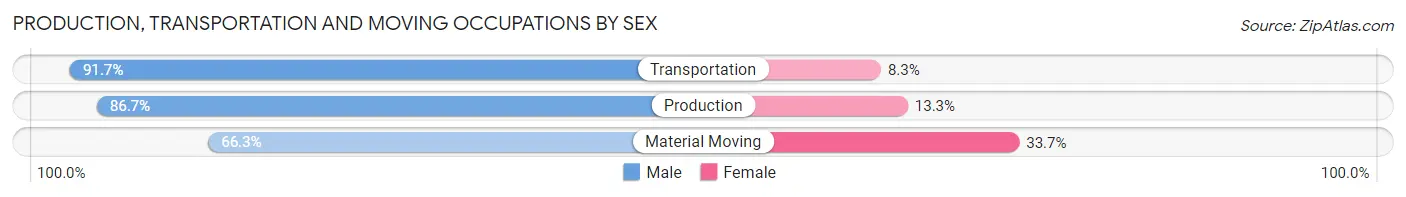
| Occupation | Male | Female |
| Production | 98 (86.7%) | 15 (13.3%) |
| Transportation | 209 (91.7%) | 19 (8.3%) |
| Material Moving | 59 (66.3%) | 30 (33.7%) |
| Total (Category) | 366 (85.1%) | 64 (14.9%) |
| Total (Overall) | 3,936 (57.5%) | 2,914 (42.5%) |
Employment Industries by Sex in Longmeadow
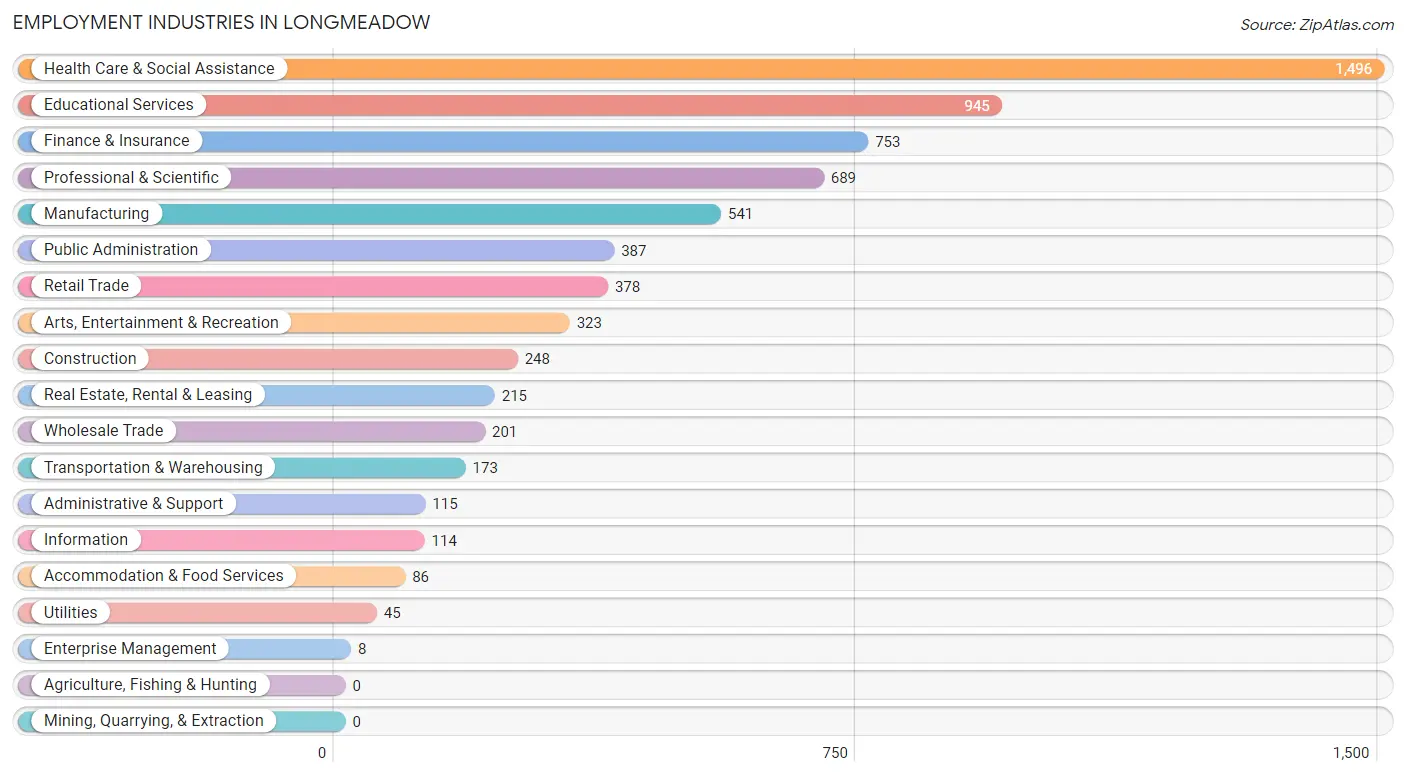
Employment Industries in Longmeadow
The major employment industries in Longmeadow include Health Care & Social Assistance (1,496 | 21.8%), Educational Services (945 | 13.8%), Finance & Insurance (753 | 11.0%), Professional & Scientific (689 | 10.1%), and Manufacturing (541 | 7.9%).
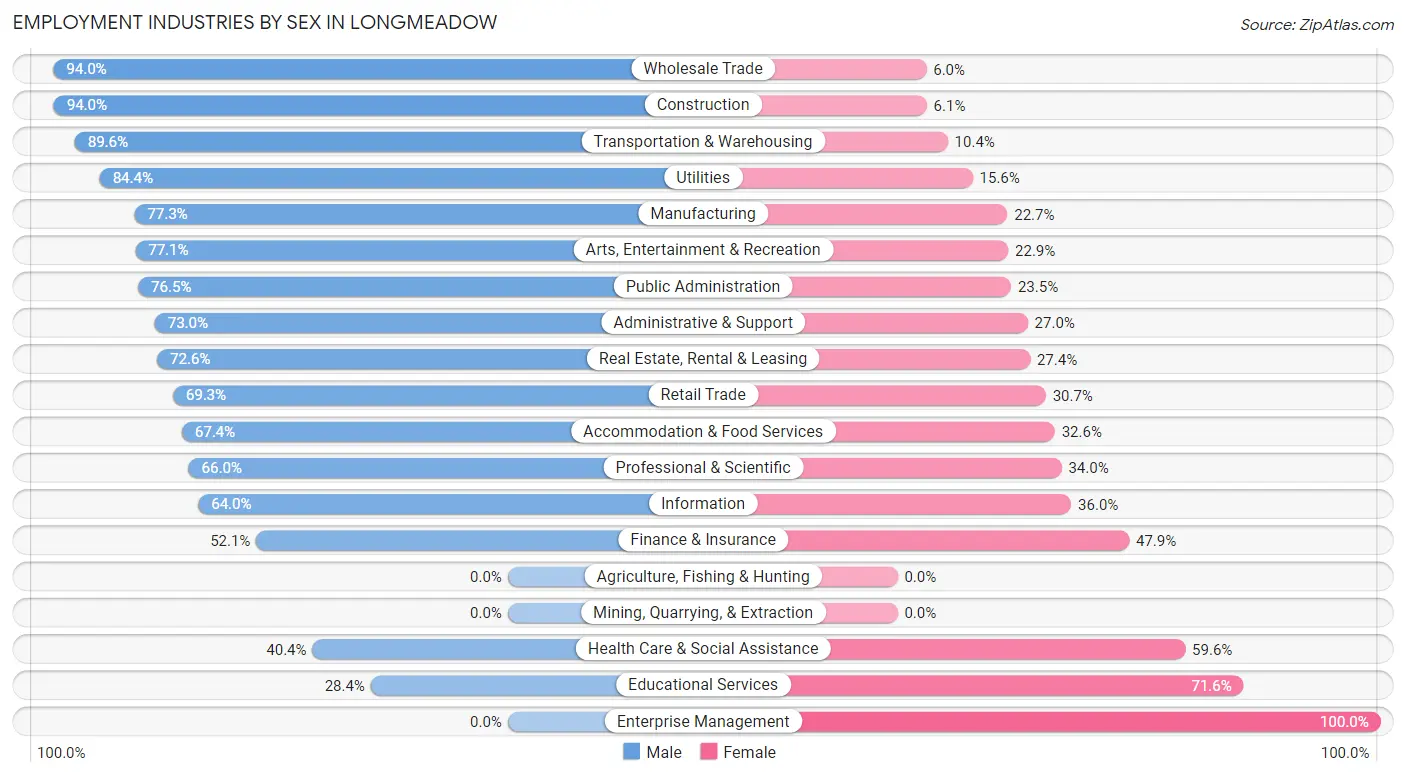
Employment Industries by Sex in Longmeadow
The Longmeadow industries that see more men than women are Wholesale Trade (94.0%), Construction (94.0%), and Transportation & Warehousing (89.6%), whereas the industries that tend to have a higher number of women are Enterprise Management (100.0%), Educational Services (71.6%), and Health Care & Social Assistance (59.6%).
| Industry | Male | Female |
| Agriculture, Fishing & Hunting | 0 (0.0%) | 0 (0.0%) |
| Mining, Quarrying, & Extraction | 0 (0.0%) | 0 (0.0%) |
| Construction | 233 (94.0%) | 15 (6.0%) |
| Manufacturing | 418 (77.3%) | 123 (22.7%) |
| Wholesale Trade | 189 (94.0%) | 12 (6.0%) |
| Retail Trade | 262 (69.3%) | 116 (30.7%) |
| Transportation & Warehousing | 155 (89.6%) | 18 (10.4%) |
| Utilities | 38 (84.4%) | 7 (15.6%) |
| Information | 73 (64.0%) | 41 (36.0%) |
| Finance & Insurance | 392 (52.1%) | 361 (47.9%) |
| Real Estate, Rental & Leasing | 156 (72.6%) | 59 (27.4%) |
| Professional & Scientific | 455 (66.0%) | 234 (34.0%) |
| Enterprise Management | 0 (0.0%) | 8 (100.0%) |
| Administrative & Support | 84 (73.0%) | 31 (27.0%) |
| Educational Services | 268 (28.4%) | 677 (71.6%) |
| Health Care & Social Assistance | 605 (40.4%) | 891 (59.6%) |
| Arts, Entertainment & Recreation | 249 (77.1%) | 74 (22.9%) |
| Accommodation & Food Services | 58 (67.4%) | 28 (32.6%) |
| Public Administration | 296 (76.5%) | 91 (23.5%) |
| Total | 3,936 (57.5%) | 2,914 (42.5%) |
Education in Longmeadow
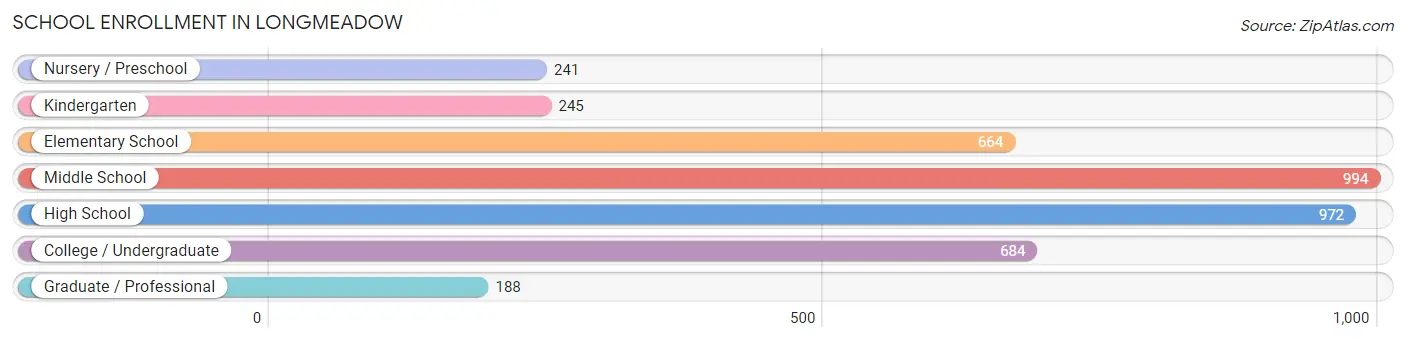
School Enrollment in Longmeadow
The most common levels of schooling among the 3,988 students in Longmeadow are middle school (994 | 24.9%), high school (972 | 24.4%), and college / undergraduate (684 | 17.2%).
| School Level | # Students | % Students |
| Nursery / Preschool | 241 | 6.0% |
| Kindergarten | 245 | 6.1% |
| Elementary School | 664 | 16.7% |
| Middle School | 994 | 24.9% |
| High School | 972 | 24.4% |
| College / Undergraduate | 684 | 17.2% |
| Graduate / Professional | 188 | 4.7% |
| Total | 3,988 | 100.0% |
School Enrollment by Age by Funding Source in Longmeadow
Out of a total of 3,988 students who are enrolled in schools in Longmeadow, 810 (20.3%) attend a private institution, while the remaining 3,178 (79.7%) are enrolled in public schools. The age group of 20 to 24 year olds has the highest likelihood of being enrolled in private schools, with 292 (76.2% in the age bracket) enrolled. Conversely, the age group of 15 to 17 year olds has the lowest likelihood of being enrolled in a private school, with 671 (98.2% in the age bracket) attending a public institution.
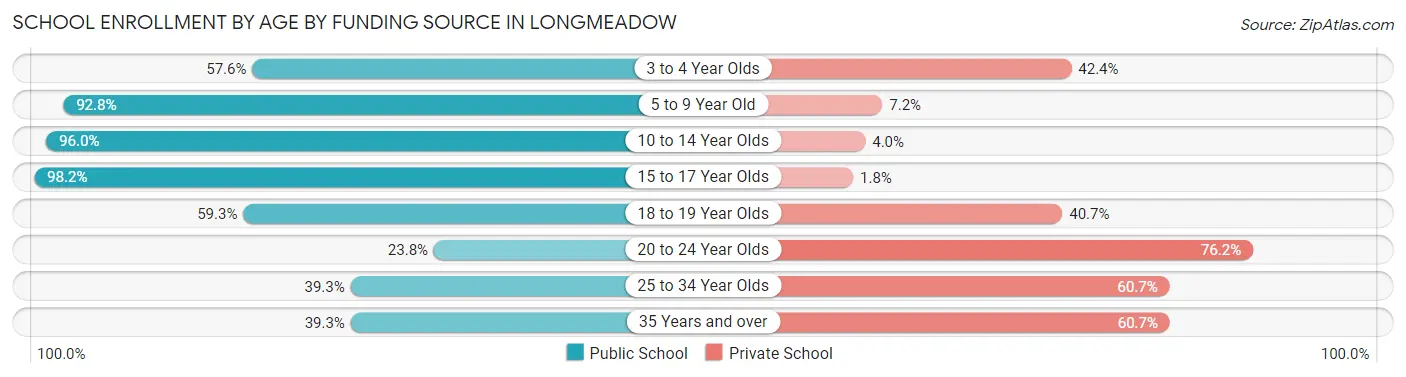
| Age Bracket | Public School | Private School |
| 3 to 4 Year Olds | 110 (57.6%) | 81 (42.4%) |
| 5 to 9 Year Old | 812 (92.8%) | 63 (7.2%) |
| 10 to 14 Year Olds | 1,171 (96.0%) | 49 (4.0%) |
| 15 to 17 Year Olds | 671 (98.2%) | 12 (1.8%) |
| 18 to 19 Year Olds | 214 (59.3%) | 147 (40.7%) |
| 20 to 24 Year Olds | 91 (23.8%) | 292 (76.2%) |
| 25 to 34 Year Olds | 44 (39.3%) | 68 (60.7%) |
| 35 Years and over | 64 (39.3%) | 99 (60.7%) |
| Total | 3,178 (79.7%) | 810 (20.3%) |
Educational Attainment by Field of Study in Longmeadow
Business (1,627 | 21.6%), education (775 | 10.3%), science & technology (711 | 9.4%), social sciences (708 | 9.4%), and bio, nature & agricultural (647 | 8.6%) are the most common fields of study among 7,530 individuals in Longmeadow who have obtained a bachelor's degree or higher.
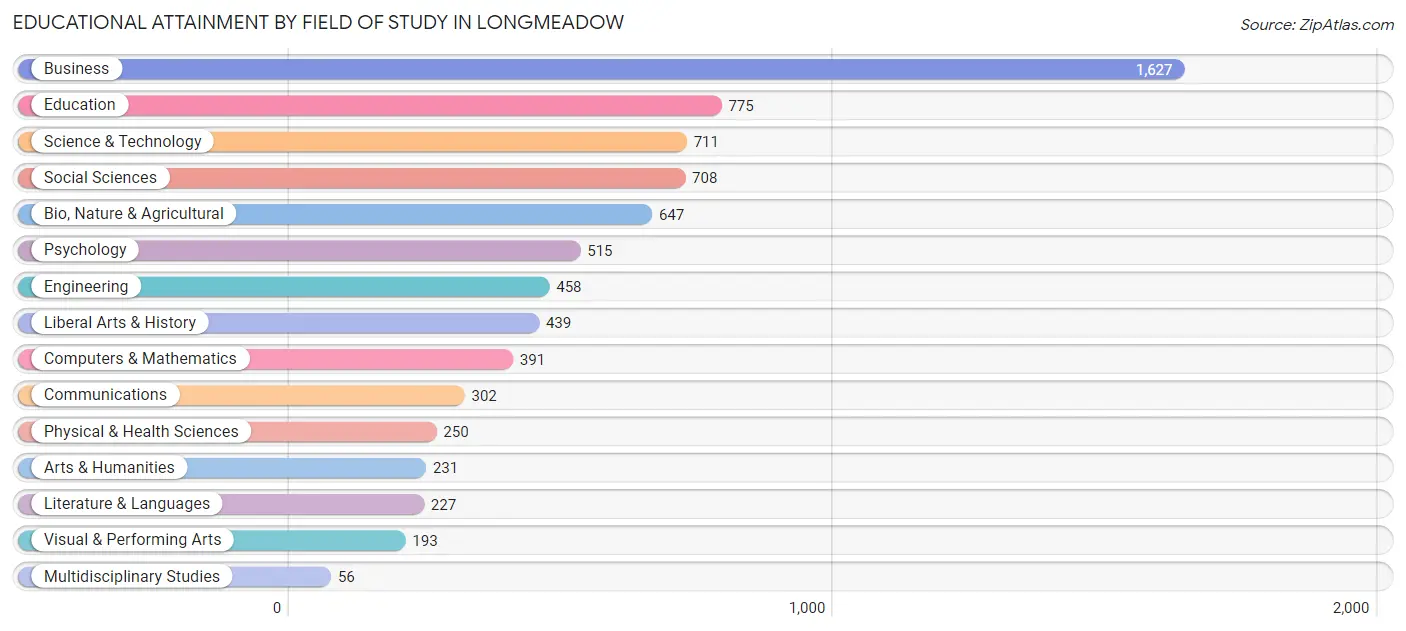
| Field of Study | # Graduates | % Graduates |
| Computers & Mathematics | 391 | 5.2% |
| Bio, Nature & Agricultural | 647 | 8.6% |
| Physical & Health Sciences | 250 | 3.3% |
| Psychology | 515 | 6.8% |
| Social Sciences | 708 | 9.4% |
| Engineering | 458 | 6.1% |
| Multidisciplinary Studies | 56 | 0.7% |
| Science & Technology | 711 | 9.4% |
| Business | 1,627 | 21.6% |
| Education | 775 | 10.3% |
| Literature & Languages | 227 | 3.0% |
| Liberal Arts & History | 439 | 5.8% |
| Visual & Performing Arts | 193 | 2.6% |
| Communications | 302 | 4.0% |
| Arts & Humanities | 231 | 3.1% |
| Total | 7,530 | 100.0% |
Transportation & Commute in Longmeadow
Vehicle Availability by Sex in Longmeadow
The most prevalent vehicle ownership categories in Longmeadow are males with 2 vehicles (2,199, accounting for 56.5%) and females with 2 vehicles (1,457, making up 78.6%).
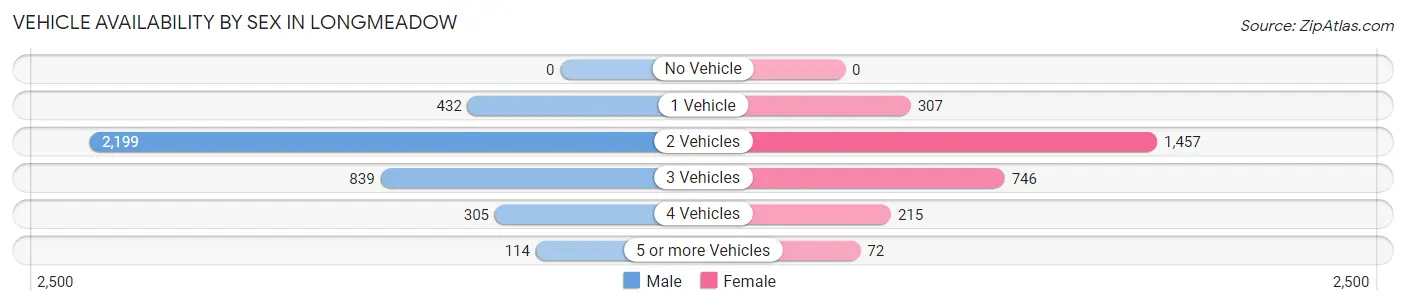
| Vehicles Available | Male | Female |
| No Vehicle | 0 (0.0%) | 0 (0.0%) |
| 1 Vehicle | 432 (11.1%) | 307 (11.0%) |
| 2 Vehicles | 2,199 (56.5%) | 1,457 (52.1%) |
| 3 Vehicles | 839 (21.6%) | 746 (26.7%) |
| 4 Vehicles | 305 (7.8%) | 215 (7.7%) |
| 5 or more Vehicles | 114 (2.9%) | 72 (2.6%) |
| Total | 3,889 (100.0%) | 2,797 (100.0%) |
Commute Time in Longmeadow
The most frequently occuring commute durations in Longmeadow are 15 to 19 minutes (1,335 commuters, 24.8%), 20 to 24 minutes (983 commuters, 18.3%), and 10 to 14 minutes (824 commuters, 15.3%).
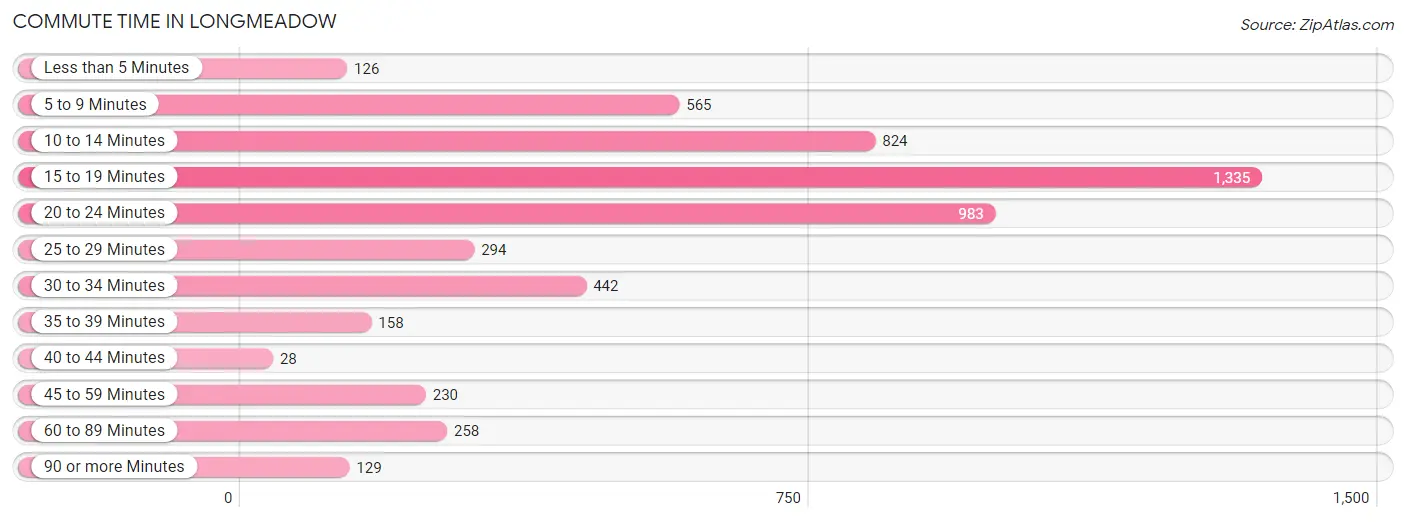
| Commute Time | # Commuters | % Commuters |
| Less than 5 Minutes | 126 | 2.4% |
| 5 to 9 Minutes | 565 | 10.5% |
| 10 to 14 Minutes | 824 | 15.3% |
| 15 to 19 Minutes | 1,335 | 24.8% |
| 20 to 24 Minutes | 983 | 18.3% |
| 25 to 29 Minutes | 294 | 5.5% |
| 30 to 34 Minutes | 442 | 8.2% |
| 35 to 39 Minutes | 158 | 2.9% |
| 40 to 44 Minutes | 28 | 0.5% |
| 45 to 59 Minutes | 230 | 4.3% |
| 60 to 89 Minutes | 258 | 4.8% |
| 90 or more Minutes | 129 | 2.4% |
Commute Time by Sex in Longmeadow
The most common commute times in Longmeadow are 15 to 19 minutes (828 commuters, 25.8%) for males and 15 to 19 minutes (507 commuters, 23.4%) for females.
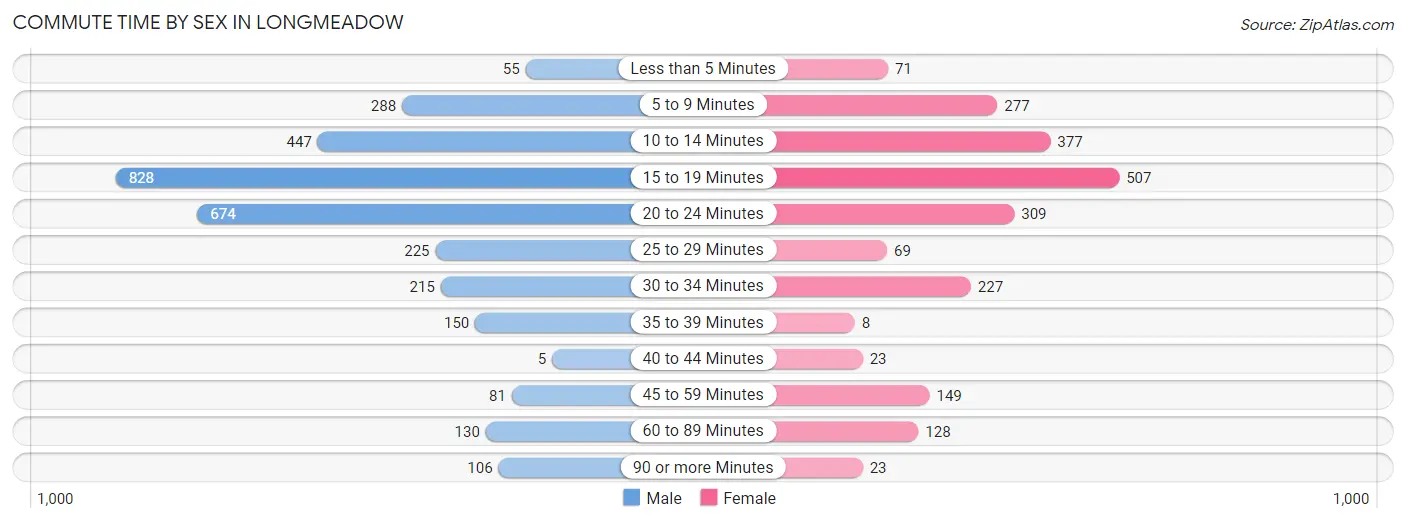
| Commute Time | Male | Female |
| Less than 5 Minutes | 55 (1.7%) | 71 (3.3%) |
| 5 to 9 Minutes | 288 (9.0%) | 277 (12.8%) |
| 10 to 14 Minutes | 447 (14.0%) | 377 (17.4%) |
| 15 to 19 Minutes | 828 (25.8%) | 507 (23.4%) |
| 20 to 24 Minutes | 674 (21.0%) | 309 (14.2%) |
| 25 to 29 Minutes | 225 (7.0%) | 69 (3.2%) |
| 30 to 34 Minutes | 215 (6.7%) | 227 (10.5%) |
| 35 to 39 Minutes | 150 (4.7%) | 8 (0.4%) |
| 40 to 44 Minutes | 5 (0.2%) | 23 (1.1%) |
| 45 to 59 Minutes | 81 (2.5%) | 149 (6.9%) |
| 60 to 89 Minutes | 130 (4.1%) | 128 (5.9%) |
| 90 or more Minutes | 106 (3.3%) | 23 (1.1%) |
Time of Departure to Work by Sex in Longmeadow
The most frequent times of departure to work in Longmeadow are 8:00 AM to 8:29 AM (656, 20.5%) for males and 8:00 AM to 8:29 AM (514, 23.7%) for females.
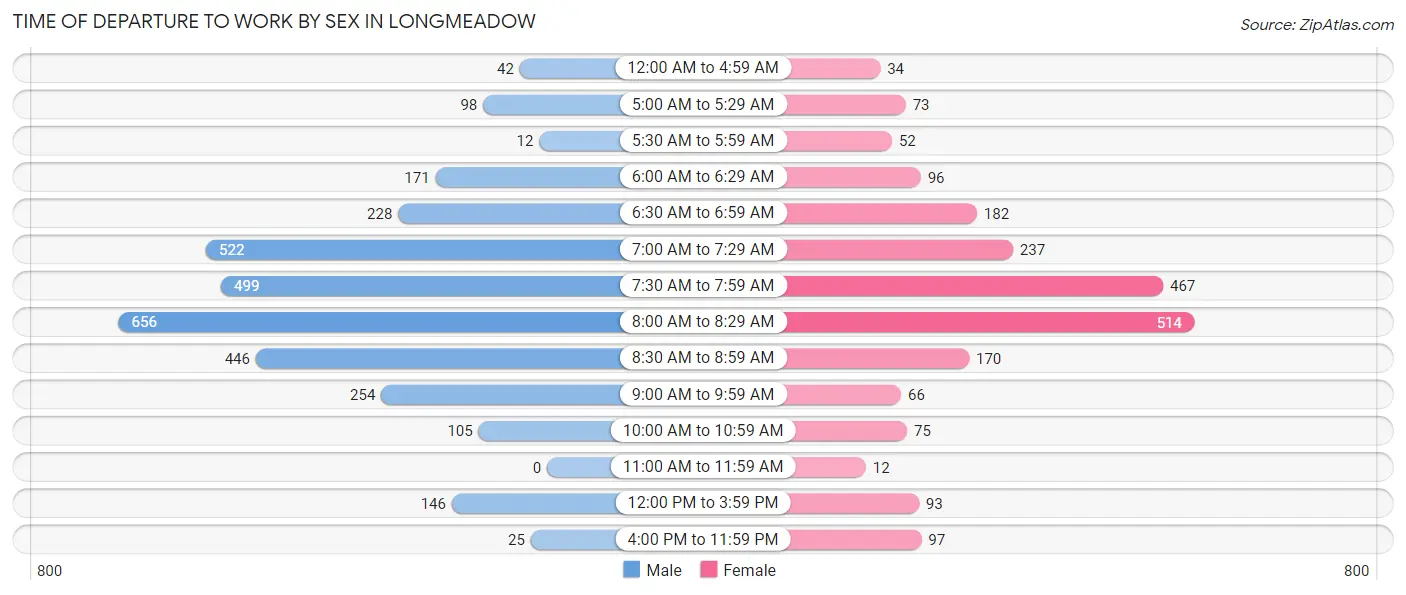
| Time of Departure | Male | Female |
| 12:00 AM to 4:59 AM | 42 (1.3%) | 34 (1.6%) |
| 5:00 AM to 5:29 AM | 98 (3.1%) | 73 (3.4%) |
| 5:30 AM to 5:59 AM | 12 (0.4%) | 52 (2.4%) |
| 6:00 AM to 6:29 AM | 171 (5.3%) | 96 (4.4%) |
| 6:30 AM to 6:59 AM | 228 (7.1%) | 182 (8.4%) |
| 7:00 AM to 7:29 AM | 522 (16.3%) | 237 (10.9%) |
| 7:30 AM to 7:59 AM | 499 (15.6%) | 467 (21.5%) |
| 8:00 AM to 8:29 AM | 656 (20.5%) | 514 (23.7%) |
| 8:30 AM to 8:59 AM | 446 (13.9%) | 170 (7.8%) |
| 9:00 AM to 9:59 AM | 254 (7.9%) | 66 (3.0%) |
| 10:00 AM to 10:59 AM | 105 (3.3%) | 75 (3.5%) |
| 11:00 AM to 11:59 AM | 0 (0.0%) | 12 (0.5%) |
| 12:00 PM to 3:59 PM | 146 (4.6%) | 93 (4.3%) |
| 4:00 PM to 11:59 PM | 25 (0.8%) | 97 (4.5%) |
| Total | 3,204 (100.0%) | 2,168 (100.0%) |
Housing Occupancy in Longmeadow
Occupancy by Ownership in Longmeadow
Of the total 5,811 dwellings in Longmeadow, owner-occupied units account for 5,363 (92.3%), while renter-occupied units make up 448 (7.7%).
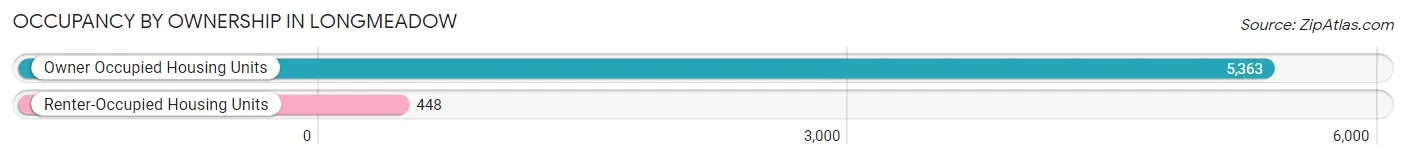
| Occupancy | # Housing Units | % Housing Units |
| Owner Occupied Housing Units | 5,363 | 92.3% |
| Renter-Occupied Housing Units | 448 | 7.7% |
| Total Occupied Housing Units | 5,811 | 100.0% |
Occupancy by Household Size in Longmeadow
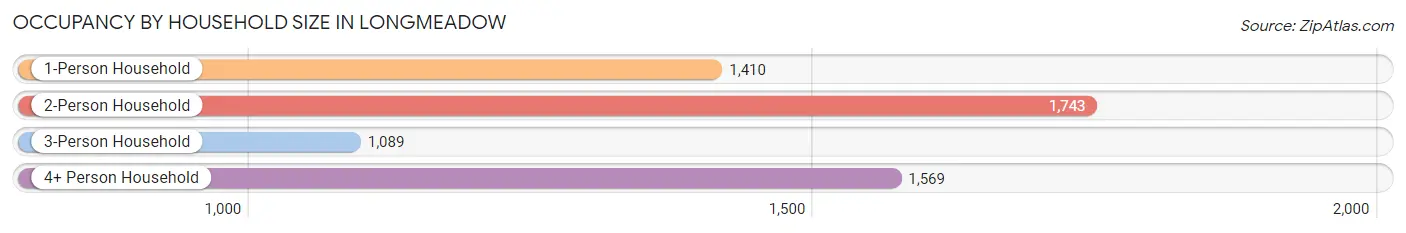
| Household Size | # Housing Units | % Housing Units |
| 1-Person Household | 1,410 | 24.3% |
| 2-Person Household | 1,743 | 30.0% |
| 3-Person Household | 1,089 | 18.7% |
| 4+ Person Household | 1,569 | 27.0% |
| Total Housing Units | 5,811 | 100.0% |
Occupancy by Ownership by Household Size in Longmeadow
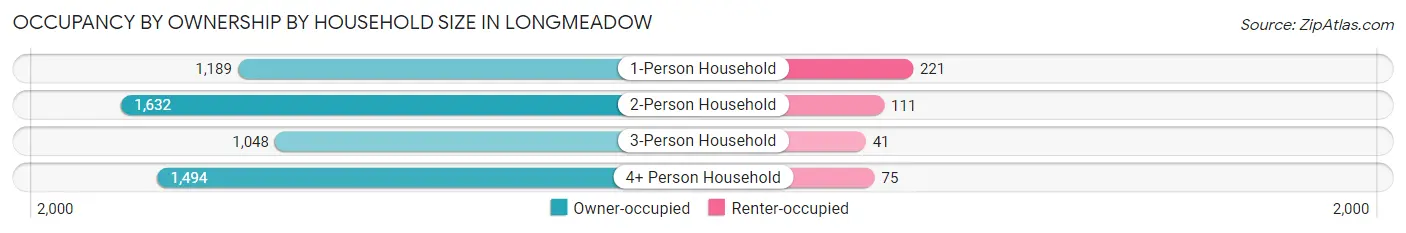
| Household Size | Owner-occupied | Renter-occupied |
| 1-Person Household | 1,189 (84.3%) | 221 (15.7%) |
| 2-Person Household | 1,632 (93.6%) | 111 (6.4%) |
| 3-Person Household | 1,048 (96.2%) | 41 (3.8%) |
| 4+ Person Household | 1,494 (95.2%) | 75 (4.8%) |
| Total Housing Units | 5,363 (92.3%) | 448 (7.7%) |
Occupancy by Educational Attainment in Longmeadow
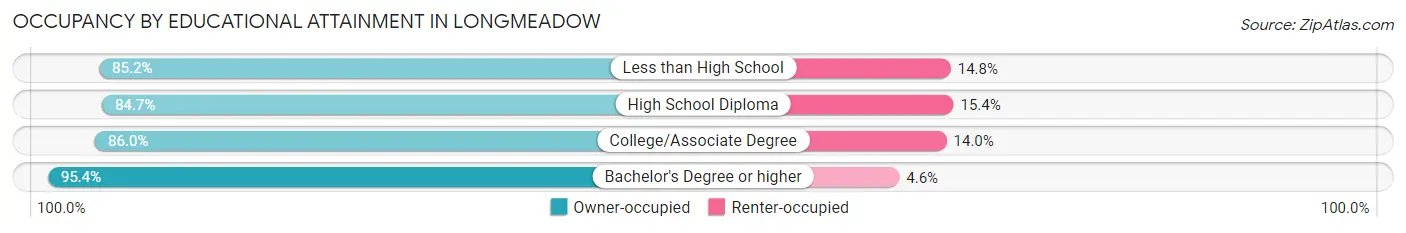
| Household Size | Owner-occupied | Renter-occupied |
| Less than High School | 121 (85.2%) | 21 (14.8%) |
| High School Diploma | 364 (84.7%) | 66 (15.3%) |
| College/Associate Degree | 1,102 (86.0%) | 179 (14.0%) |
| Bachelor's Degree or higher | 3,776 (95.4%) | 182 (4.6%) |
Occupancy by Age of Householder in Longmeadow
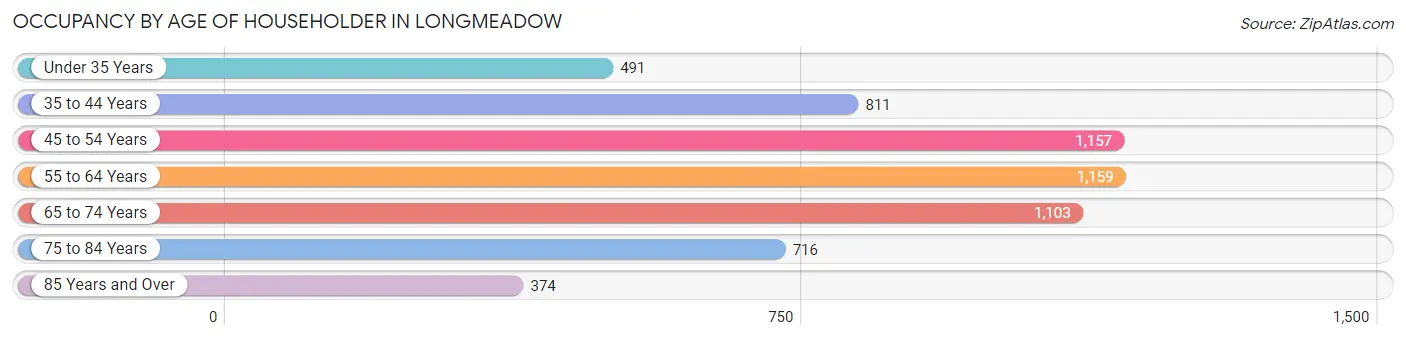
| Age Bracket | # Households | % Households |
| Under 35 Years | 491 | 8.5% |
| 35 to 44 Years | 811 | 14.0% |
| 45 to 54 Years | 1,157 | 19.9% |
| 55 to 64 Years | 1,159 | 19.9% |
| 65 to 74 Years | 1,103 | 19.0% |
| 75 to 84 Years | 716 | 12.3% |
| 85 Years and Over | 374 | 6.4% |
| Total | 5,811 | 100.0% |
Housing Finances in Longmeadow
Median Income by Occupancy in Longmeadow
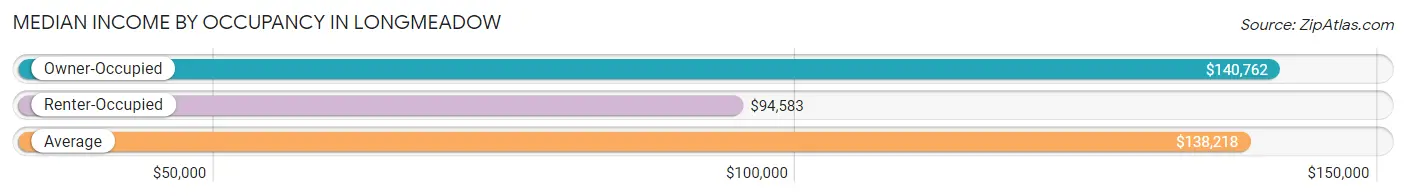
| Occupancy Type | # Households | Median Income |
| Owner-Occupied | 5,363 (92.3%) | $140,762 |
| Renter-Occupied | 448 (7.7%) | $94,583 |
| Average | 5,811 (100.0%) | $138,218 |
Occupancy by Householder Income Bracket in Longmeadow
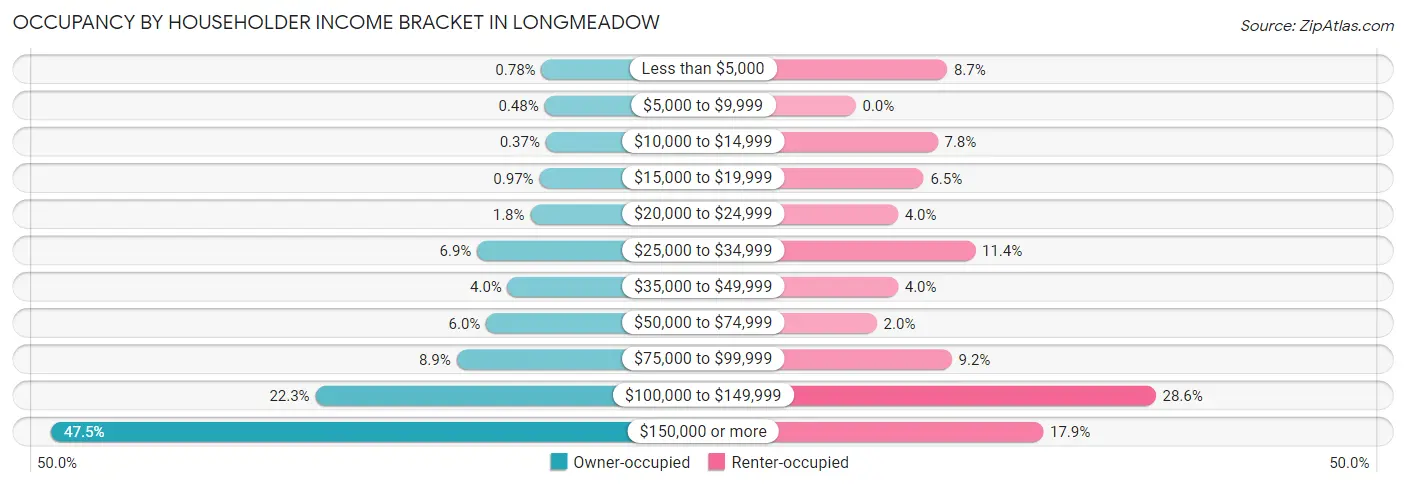
| Income Bracket | Owner-occupied | Renter-occupied |
| Less than $5,000 | 42 (0.8%) | 39 (8.7%) |
| $5,000 to $9,999 | 26 (0.5%) | 0 (0.0%) |
| $10,000 to $14,999 | 20 (0.4%) | 35 (7.8%) |
| $15,000 to $19,999 | 52 (1.0%) | 29 (6.5%) |
| $20,000 to $24,999 | 98 (1.8%) | 18 (4.0%) |
| $25,000 to $34,999 | 370 (6.9%) | 51 (11.4%) |
| $35,000 to $49,999 | 214 (4.0%) | 18 (4.0%) |
| $50,000 to $74,999 | 324 (6.0%) | 9 (2.0%) |
| $75,000 to $99,999 | 475 (8.9%) | 41 (9.1%) |
| $100,000 to $149,999 | 1,196 (22.3%) | 128 (28.6%) |
| $150,000 or more | 2,546 (47.5%) | 80 (17.9%) |
| Total | 5,363 (100.0%) | 448 (100.0%) |
Monthly Housing Cost Tiers in Longmeadow
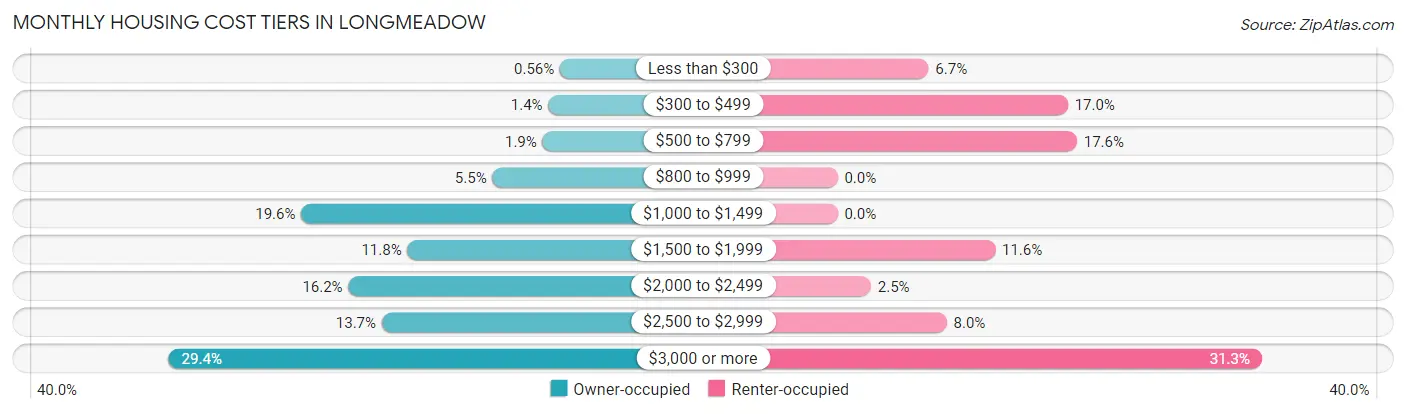
| Monthly Cost | Owner-occupied | Renter-occupied |
| Less than $300 | 30 (0.6%) | 30 (6.7%) |
| $300 to $499 | 76 (1.4%) | 76 (17.0%) |
| $500 to $799 | 99 (1.8%) | 79 (17.6%) |
| $800 to $999 | 297 (5.5%) | 0 (0.0%) |
| $1,000 to $1,499 | 1,052 (19.6%) | 0 (0.0%) |
| $1,500 to $1,999 | 633 (11.8%) | 52 (11.6%) |
| $2,000 to $2,499 | 866 (16.2%) | 11 (2.5%) |
| $2,500 to $2,999 | 734 (13.7%) | 36 (8.0%) |
| $3,000 or more | 1,576 (29.4%) | 140 (31.2%) |
| Total | 5,363 (100.0%) | 448 (100.0%) |
Physical Housing Characteristics in Longmeadow
Housing Structures in Longmeadow
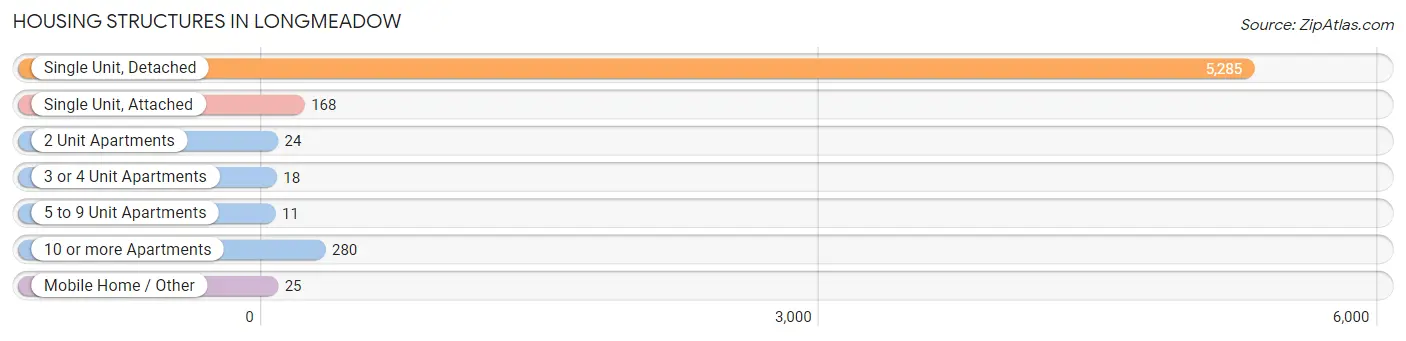
| Structure Type | # Housing Units | % Housing Units |
| Single Unit, Detached | 5,285 | 90.9% |
| Single Unit, Attached | 168 | 2.9% |
| 2 Unit Apartments | 24 | 0.4% |
| 3 or 4 Unit Apartments | 18 | 0.3% |
| 5 to 9 Unit Apartments | 11 | 0.2% |
| 10 or more Apartments | 280 | 4.8% |
| Mobile Home / Other | 25 | 0.4% |
| Total | 5,811 | 100.0% |
Housing Structures by Occupancy in Longmeadow
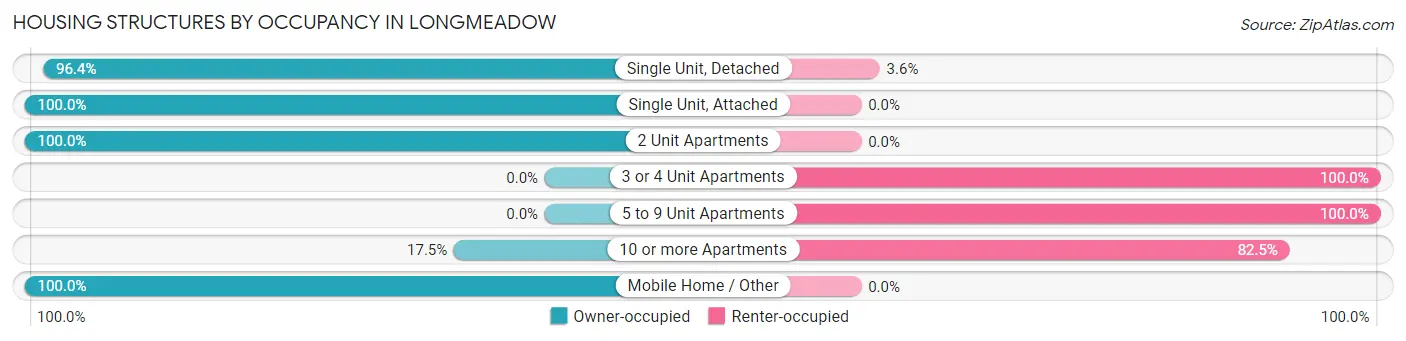
| Structure Type | Owner-occupied | Renter-occupied |
| Single Unit, Detached | 5,097 (96.4%) | 188 (3.6%) |
| Single Unit, Attached | 168 (100.0%) | 0 (0.0%) |
| 2 Unit Apartments | 24 (100.0%) | 0 (0.0%) |
| 3 or 4 Unit Apartments | 0 (0.0%) | 18 (100.0%) |
| 5 to 9 Unit Apartments | 0 (0.0%) | 11 (100.0%) |
| 10 or more Apartments | 49 (17.5%) | 231 (82.5%) |
| Mobile Home / Other | 25 (100.0%) | 0 (0.0%) |
| Total | 5,363 (92.3%) | 448 (7.7%) |
Housing Structures by Number of Rooms in Longmeadow
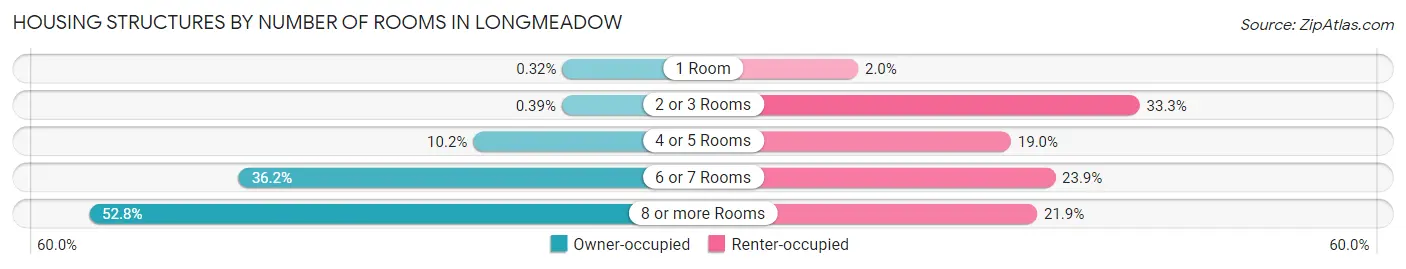
| Number of Rooms | Owner-occupied | Renter-occupied |
| 1 Room | 17 (0.3%) | 9 (2.0%) |
| 2 or 3 Rooms | 21 (0.4%) | 149 (33.3%) |
| 4 or 5 Rooms | 548 (10.2%) | 85 (19.0%) |
| 6 or 7 Rooms | 1,943 (36.2%) | 107 (23.9%) |
| 8 or more Rooms | 2,834 (52.8%) | 98 (21.9%) |
| Total | 5,363 (100.0%) | 448 (100.0%) |
Housing Structure by Heating Type in Longmeadow
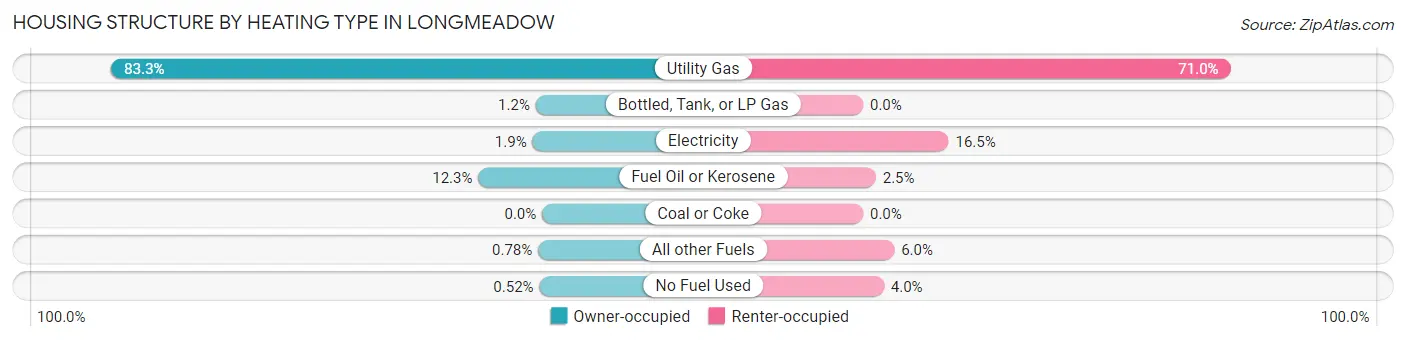
| Heating Type | Owner-occupied | Renter-occupied |
| Utility Gas | 4,466 (83.3%) | 318 (71.0%) |
| Bottled, Tank, or LP Gas | 66 (1.2%) | 0 (0.0%) |
| Electricity | 100 (1.9%) | 74 (16.5%) |
| Fuel Oil or Kerosene | 661 (12.3%) | 11 (2.5%) |
| Coal or Coke | 0 (0.0%) | 0 (0.0%) |
| All other Fuels | 42 (0.8%) | 27 (6.0%) |
| No Fuel Used | 28 (0.5%) | 18 (4.0%) |
| Total | 5,363 (100.0%) | 448 (100.0%) |
Household Vehicle Usage in Longmeadow
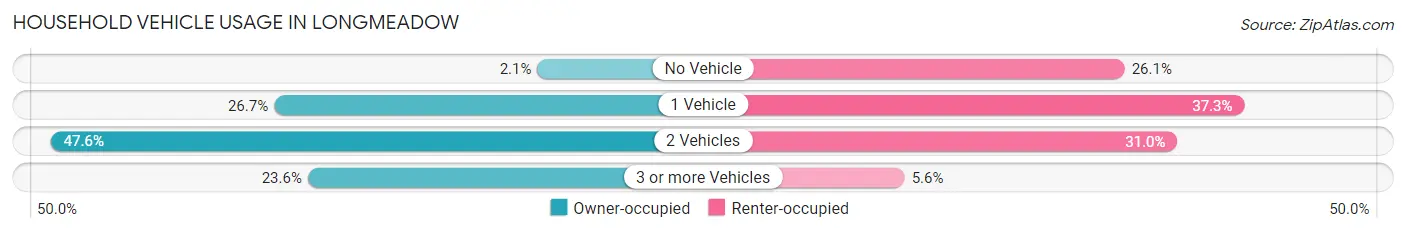
| Vehicles per Household | Owner-occupied | Renter-occupied |
| No Vehicle | 115 (2.1%) | 117 (26.1%) |
| 1 Vehicle | 1,433 (26.7%) | 167 (37.3%) |
| 2 Vehicles | 2,551 (47.6%) | 139 (31.0%) |
| 3 or more Vehicles | 1,264 (23.6%) | 25 (5.6%) |
| Total | 5,363 (100.0%) | 448 (100.0%) |
Real Estate & Mortgages in Longmeadow
Real Estate and Mortgage Overview in Longmeadow
| Characteristic | Without Mortgage | With Mortgage |
| Housing Units | 1,800 | 3,563 |
| Median Property Value | $382,000 | $427,500 |
| Median Household Income | $109,597 | $1,914 |
| Monthly Housing Costs | $1,239 | $1,576 |
| Real Estate Taxes | $8,333 | $16 |
Property Value by Mortgage Status in Longmeadow
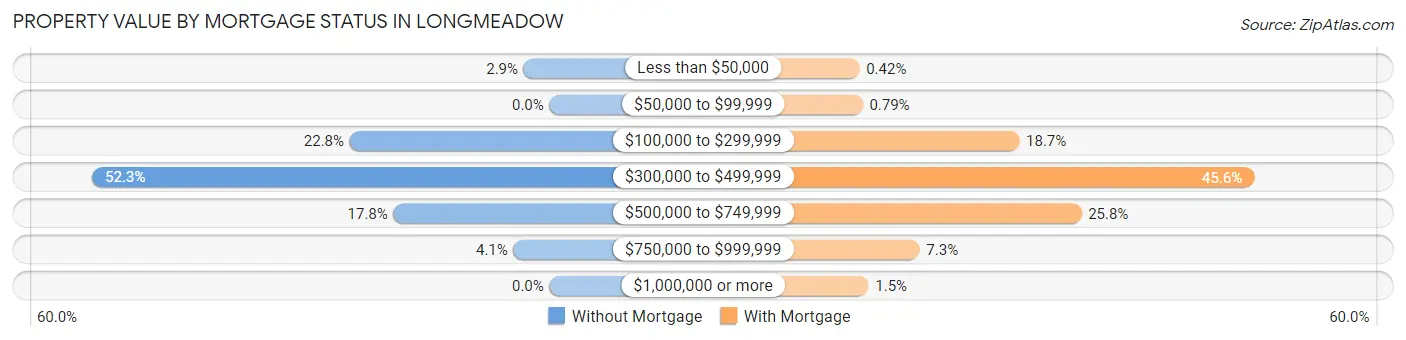
| Property Value | Without Mortgage | With Mortgage |
| Less than $50,000 | 53 (2.9%) | 15 (0.4%) |
| $50,000 to $99,999 | 0 (0.0%) | 28 (0.8%) |
| $100,000 to $299,999 | 411 (22.8%) | 666 (18.7%) |
| $300,000 to $499,999 | 941 (52.3%) | 1,623 (45.6%) |
| $500,000 to $749,999 | 321 (17.8%) | 919 (25.8%) |
| $750,000 to $999,999 | 74 (4.1%) | 260 (7.3%) |
| $1,000,000 or more | 0 (0.0%) | 52 (1.5%) |
| Total | 1,800 (100.0%) | 3,563 (100.0%) |
Household Income by Mortgage Status in Longmeadow
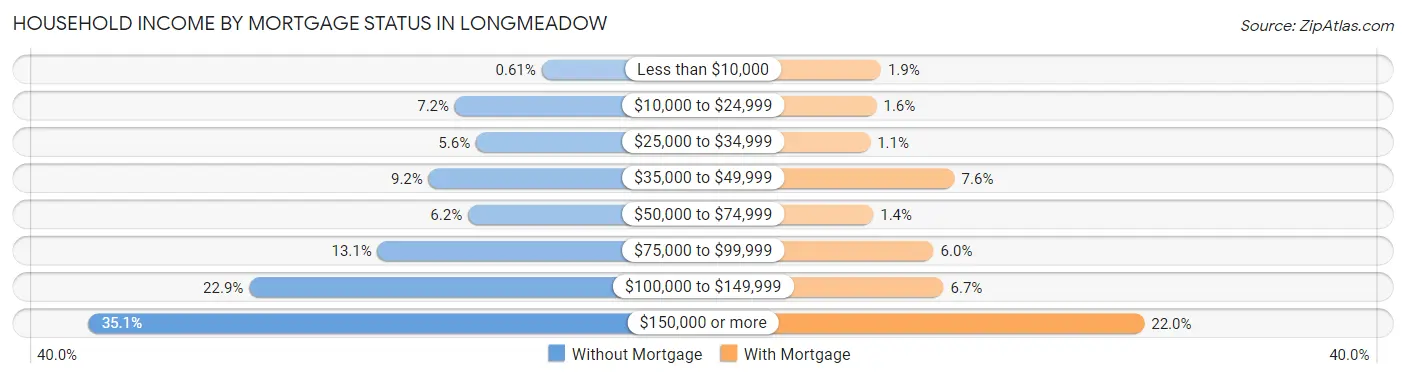
| Household Income | Without Mortgage | With Mortgage |
| Less than $10,000 | 11 (0.6%) | 69 (1.9%) |
| $10,000 to $24,999 | 130 (7.2%) | 57 (1.6%) |
| $25,000 to $34,999 | 101 (5.6%) | 40 (1.1%) |
| $35,000 to $49,999 | 166 (9.2%) | 269 (7.5%) |
| $50,000 to $74,999 | 112 (6.2%) | 48 (1.3%) |
| $75,000 to $99,999 | 236 (13.1%) | 212 (5.9%) |
| $100,000 to $149,999 | 412 (22.9%) | 239 (6.7%) |
| $150,000 or more | 632 (35.1%) | 784 (22.0%) |
| Total | 1,800 (100.0%) | 3,563 (100.0%) |
Property Value to Household Income Ratio in Longmeadow
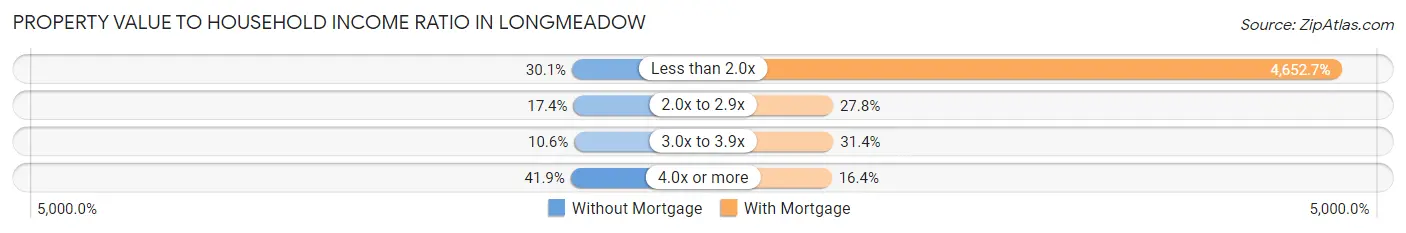
| Value-to-Income Ratio | Without Mortgage | With Mortgage |
| Less than 2.0x | 541 (30.1%) | 165,774 (4,652.6%) |
| 2.0x to 2.9x | 313 (17.4%) | 991 (27.8%) |
| 3.0x to 3.9x | 191 (10.6%) | 1,120 (31.4%) |
| 4.0x or more | 755 (41.9%) | 584 (16.4%) |
| Total | 1,800 (100.0%) | 3,563 (100.0%) |
Real Estate Taxes by Mortgage Status in Longmeadow
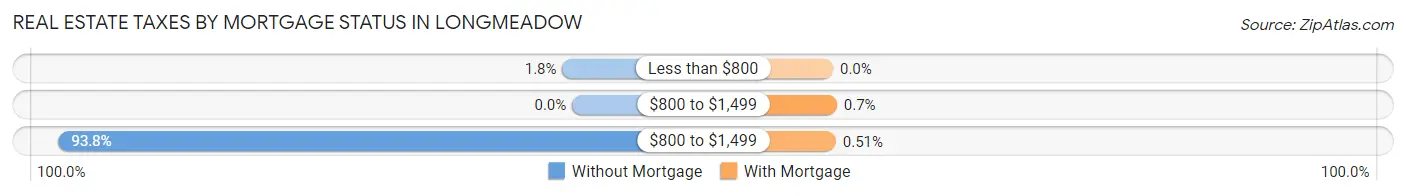
| Property Taxes | Without Mortgage | With Mortgage |
| Less than $800 | 32 (1.8%) | 0 (0.0%) |
| $800 to $1,499 | 0 (0.0%) | 25 (0.7%) |
| $800 to $1,499 | 1,689 (93.8%) | 18 (0.5%) |
| Total | 1,800 (100.0%) | 3,563 (100.0%) |
Health & Disability in Longmeadow
Health Insurance Coverage by Age in Longmeadow
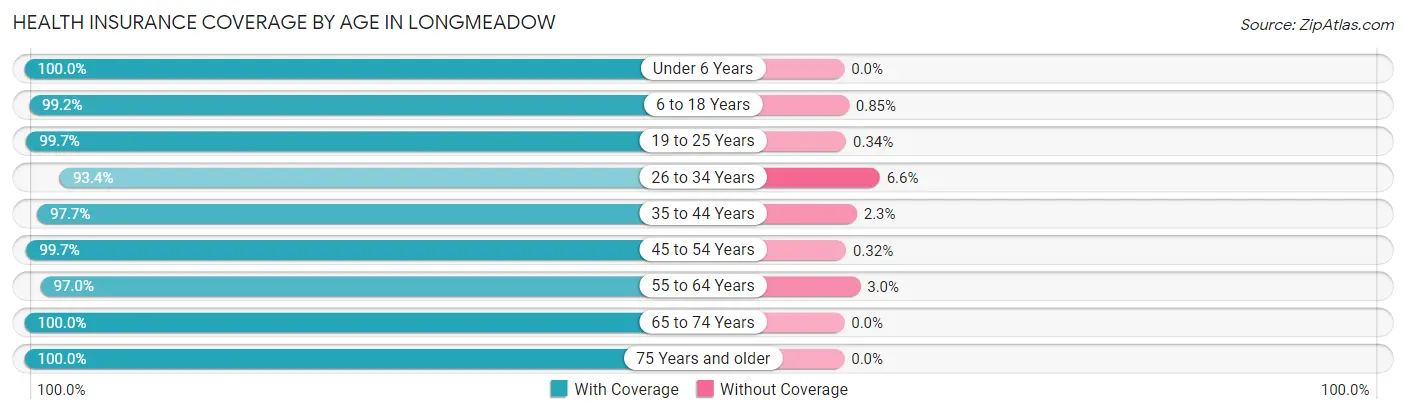
| Age Bracket | With Coverage | Without Coverage |
| Under 6 Years | 1,102 (100.0%) | 0 (0.0%) |
| 6 to 18 Years | 2,905 (99.2%) | 25 (0.9%) |
| 19 to 25 Years | 888 (99.7%) | 3 (0.3%) |
| 26 to 34 Years | 1,117 (93.4%) | 79 (6.6%) |
| 35 to 44 Years | 1,758 (97.7%) | 42 (2.3%) |
| 45 to 54 Years | 2,149 (99.7%) | 7 (0.3%) |
| 55 to 64 Years | 2,049 (97.0%) | 63 (3.0%) |
| 65 to 74 Years | 1,777 (100.0%) | 0 (0.0%) |
| 75 Years and older | 1,611 (100.0%) | 0 (0.0%) |
| Total | 15,356 (98.6%) | 219 (1.4%) |
Health Insurance Coverage by Citizenship Status in Longmeadow
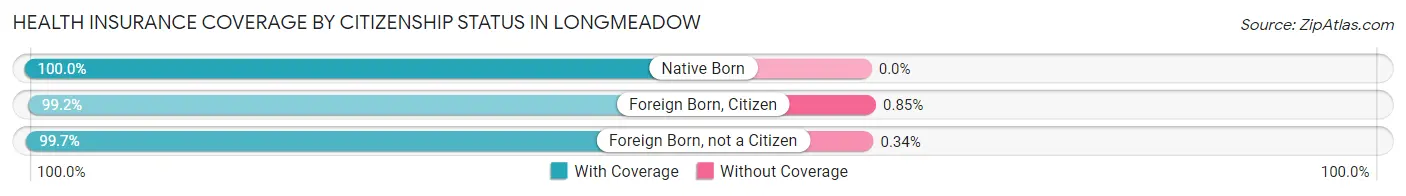
| Citizenship Status | With Coverage | Without Coverage |
| Native Born | 1,102 (100.0%) | 0 (0.0%) |
| Foreign Born, Citizen | 2,905 (99.2%) | 25 (0.9%) |
| Foreign Born, not a Citizen | 888 (99.7%) | 3 (0.3%) |
Health Insurance Coverage by Household Income in Longmeadow
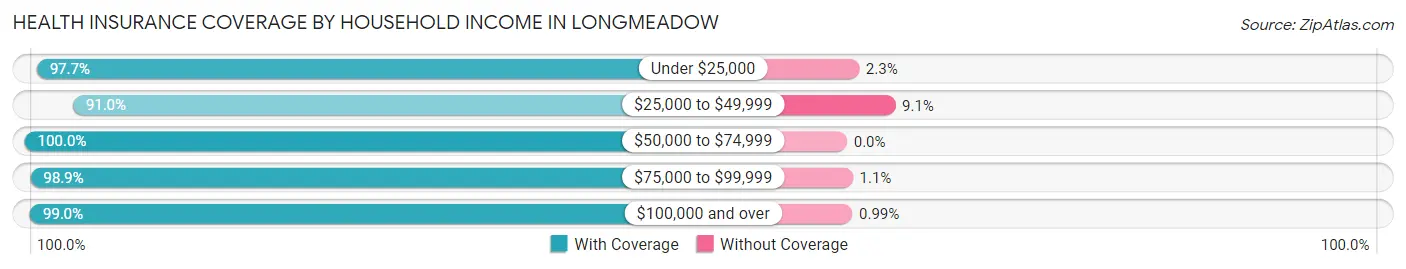
| Household Income | With Coverage | Without Coverage |
| Under $25,000 | 604 (97.7%) | 14 (2.3%) |
| $25,000 to $49,999 | 734 (90.9%) | 73 (9.0%) |
| $50,000 to $74,999 | 581 (100.0%) | 0 (0.0%) |
| $75,000 to $99,999 | 1,371 (98.9%) | 15 (1.1%) |
| $100,000 and over | 11,758 (99.0%) | 117 (1.0%) |
Public vs Private Health Insurance Coverage by Age in Longmeadow
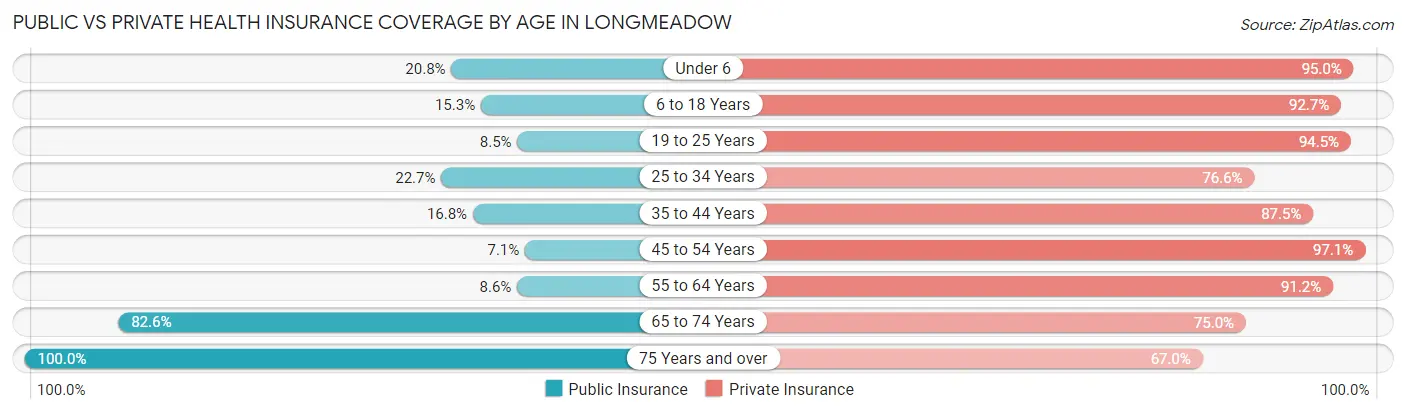
| Age Bracket | Public Insurance | Private Insurance |
| Under 6 | 229 (20.8%) | 1,047 (95.0%) |
| 6 to 18 Years | 448 (15.3%) | 2,715 (92.7%) |
| 19 to 25 Years | 76 (8.5%) | 842 (94.5%) |
| 25 to 34 Years | 271 (22.7%) | 916 (76.6%) |
| 35 to 44 Years | 302 (16.8%) | 1,575 (87.5%) |
| 45 to 54 Years | 153 (7.1%) | 2,094 (97.1%) |
| 55 to 64 Years | 181 (8.6%) | 1,926 (91.2%) |
| 65 to 74 Years | 1,468 (82.6%) | 1,333 (75.0%) |
| 75 Years and over | 1,611 (100.0%) | 1,079 (67.0%) |
| Total | 4,739 (30.4%) | 13,527 (86.9%) |
Disability Status by Sex by Age in Longmeadow
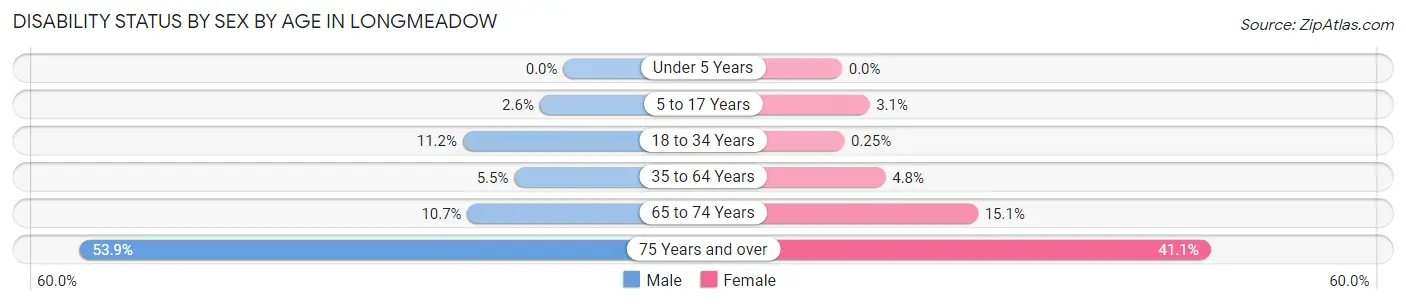
| Age Bracket | Male | Female |
| Under 5 Years | 0 (0.0%) | 0 (0.0%) |
| 5 to 17 Years | 37 (2.6%) | 45 (3.0%) |
| 18 to 34 Years | 122 (11.2%) | 3 (0.3%) |
| 35 to 64 Years | 154 (5.5%) | 157 (4.8%) |
| 65 to 74 Years | 79 (10.7%) | 157 (15.1%) |
| 75 Years and over | 355 (53.9%) | 391 (41.1%) |
Disability Class by Sex by Age in Longmeadow
Disability Class: Hearing Difficulty
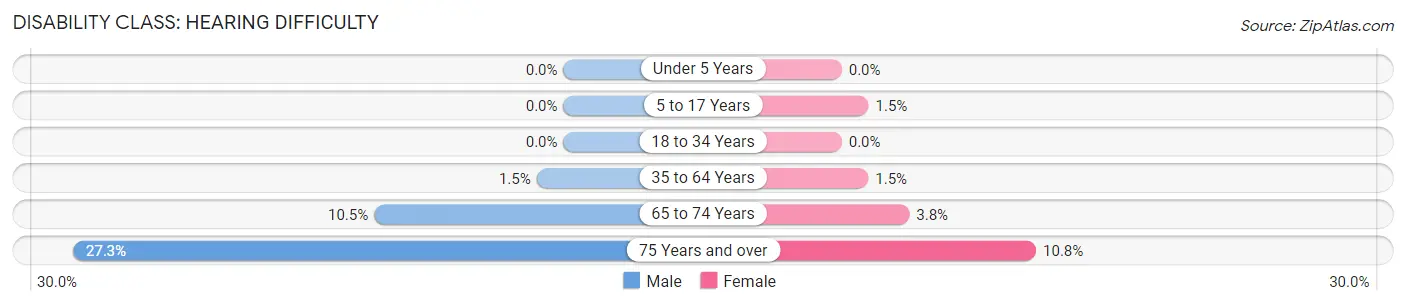
| Age Bracket | Male | Female |
| Under 5 Years | 0 (0.0%) | 0 (0.0%) |
| 5 to 17 Years | 0 (0.0%) | 22 (1.5%) |
| 18 to 34 Years | 0 (0.0%) | 0 (0.0%) |
| 35 to 64 Years | 42 (1.5%) | 48 (1.5%) |
| 65 to 74 Years | 78 (10.5%) | 39 (3.8%) |
| 75 Years and over | 180 (27.3%) | 103 (10.8%) |
Disability Class: Vision Difficulty
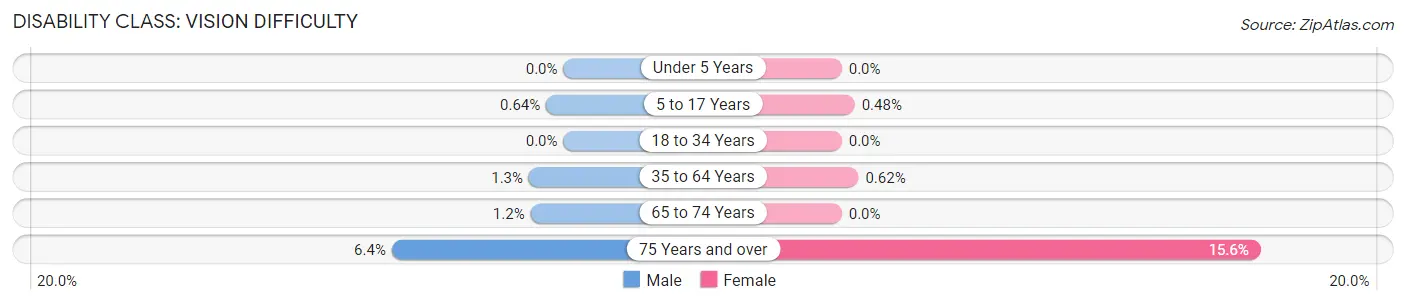
| Age Bracket | Male | Female |
| Under 5 Years | 0 (0.0%) | 0 (0.0%) |
| 5 to 17 Years | 9 (0.6%) | 7 (0.5%) |
| 18 to 34 Years | 0 (0.0%) | 0 (0.0%) |
| 35 to 64 Years | 36 (1.3%) | 20 (0.6%) |
| 65 to 74 Years | 9 (1.2%) | 0 (0.0%) |
| 75 Years and over | 42 (6.4%) | 148 (15.5%) |
Disability Class: Cognitive Difficulty
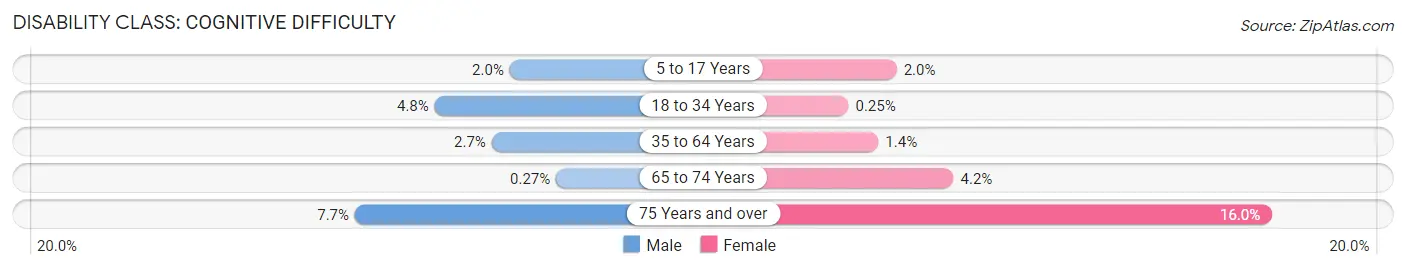
| Age Bracket | Male | Female |
| 5 to 17 Years | 28 (2.0%) | 30 (2.0%) |
| 18 to 34 Years | 52 (4.8%) | 3 (0.3%) |
| 35 to 64 Years | 75 (2.7%) | 44 (1.4%) |
| 65 to 74 Years | 2 (0.3%) | 43 (4.2%) |
| 75 Years and over | 51 (7.7%) | 152 (16.0%) |
Disability Class: Ambulatory Difficulty
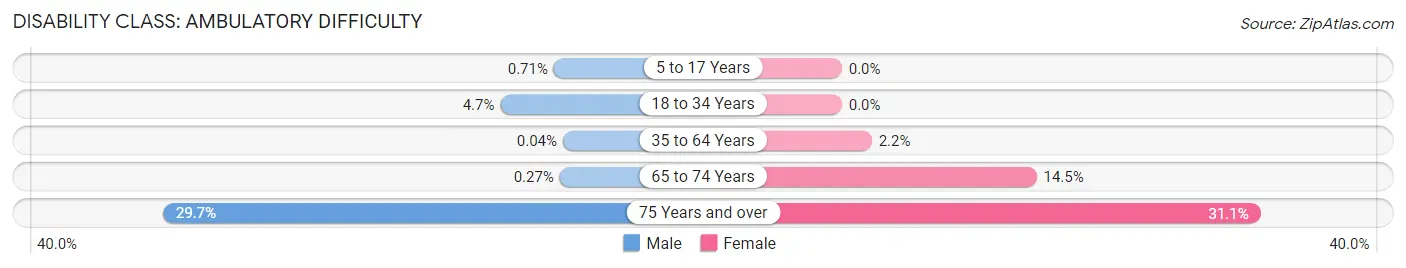
| Age Bracket | Male | Female |
| 5 to 17 Years | 10 (0.7%) | 0 (0.0%) |
| 18 to 34 Years | 51 (4.7%) | 0 (0.0%) |
| 35 to 64 Years | 1 (0.0%) | 72 (2.2%) |
| 65 to 74 Years | 2 (0.3%) | 150 (14.5%) |
| 75 Years and over | 196 (29.7%) | 296 (31.1%) |
Disability Class: Self-Care Difficulty
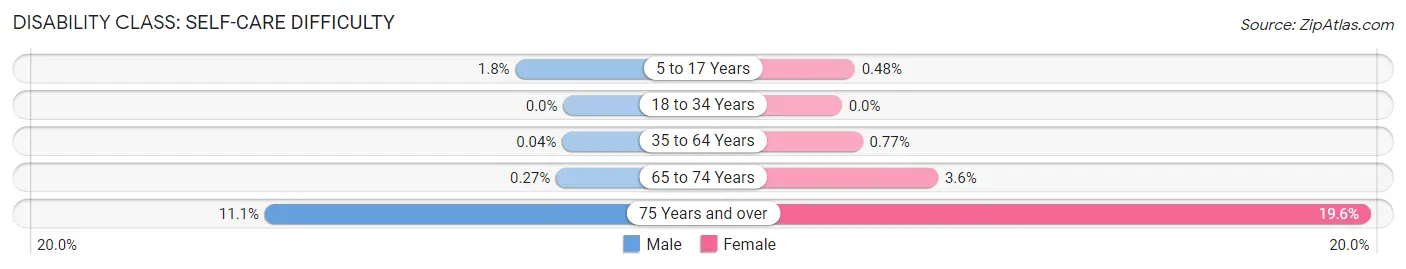
| Age Bracket | Male | Female |
| 5 to 17 Years | 25 (1.8%) | 7 (0.5%) |
| 18 to 34 Years | 0 (0.0%) | 0 (0.0%) |
| 35 to 64 Years | 1 (0.0%) | 25 (0.8%) |
| 65 to 74 Years | 2 (0.3%) | 37 (3.6%) |
| 75 Years and over | 73 (11.1%) | 187 (19.6%) |
Technology Access in Longmeadow
Computing Device Access in Longmeadow
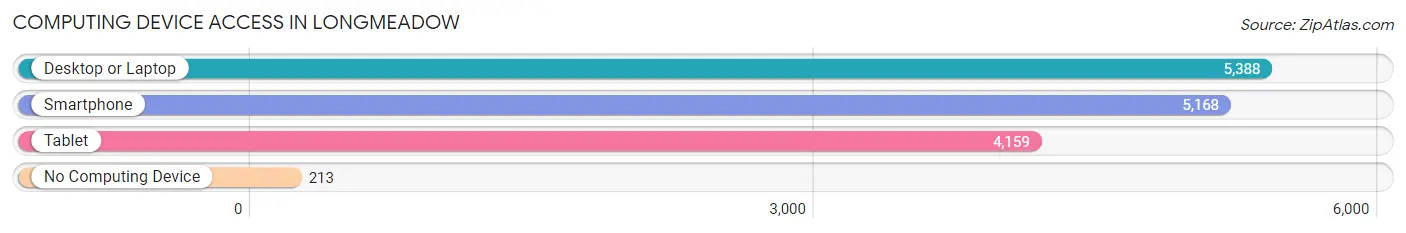
| Device Type | # Households | % Households |
| Desktop or Laptop | 5,388 | 92.7% |
| Smartphone | 5,168 | 88.9% |
| Tablet | 4,159 | 71.6% |
| No Computing Device | 213 | 3.7% |
| Total | 5,811 | 100.0% |
Internet Access in Longmeadow
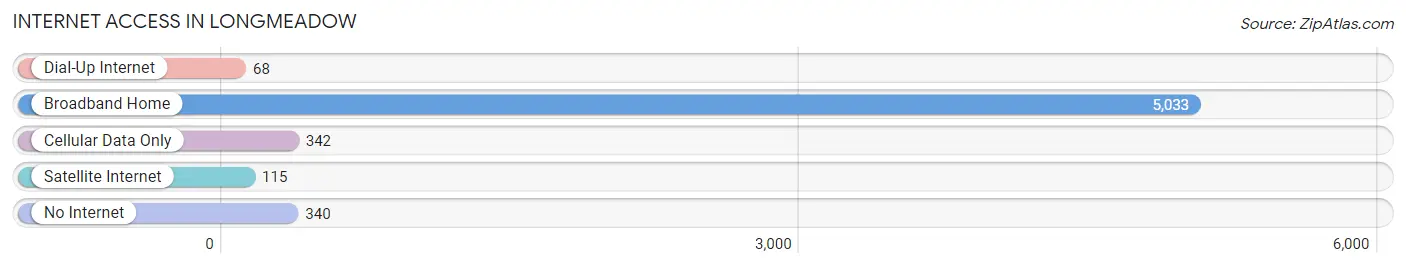
| Internet Type | # Households | % Households |
| Dial-Up Internet | 68 | 1.2% |
| Broadband Home | 5,033 | 86.6% |
| Cellular Data Only | 342 | 5.9% |
| Satellite Internet | 115 | 2.0% |
| No Internet | 340 | 5.9% |
| Total | 5,811 | 100.0% |
Longmeadow Summary
Longmeadow, MA is a town located in Hampden County, Massachusetts. It is situated in the Pioneer Valley region of the state, and is bordered by the towns of East Longmeadow, Wilbraham, Hampden, and Springfield. The town has a population of 15,784, according to the 2010 census.
History
Longmeadow was first settled in 1644 by settlers from Springfield, MA. The town was originally part of Springfield, but was incorporated as its own town in 1783. The town was named after the long meadows that were found in the area.
In the 19th century, Longmeadow was a popular summer resort for wealthy families from Boston and New York. The town was home to several large estates, including the estate of William B. Greene, Jr., which is now the site of the Longmeadow Country Club.
Geography
Longmeadow is located in the Pioneer Valley region of Massachusetts. The town is situated on the Connecticut River, and is bordered by the towns of East Longmeadow, Wilbraham, Hampden, and Springfield. The town has a total area of 8.7 square miles, of which 8.6 square miles is land and 0.1 square miles is water.
The town is located in the Connecticut River Valley, and is surrounded by hills and mountains. The highest point in the town is the summit of Pine Hill, which has an elevation of 845 feet.
Economy
Longmeadow is a primarily residential community, and the town’s economy is largely based on the service industry. The town is home to several large employers, including Baystate Health, Big Y, and the Longmeadow Country Club.
Demographics
According to the 2010 census, Longmeadow has a population of 15,784. The town has a median household income of $90,945, and a median family income of $106,945. The town’s population is primarily white (93.3%), with small percentages of African American (2.2%), Asian (2.1%), and Hispanic (1.7%) residents.
The town has a high rate of educational attainment, with 92.2% of residents over the age of 25 having a high school diploma or higher, and 63.2% having a bachelor’s degree or higher.
Conclusion
Longmeadow, MA is a town located in Hampden County, Massachusetts. It is situated in the Pioneer Valley region of the state, and is bordered by the towns of East Longmeadow, Wilbraham, Hampden, and Springfield. The town has a population of 15,784, according to the 2010 census. Longmeadow was first settled in 1644 by settlers from Springfield, MA, and was incorporated as its own town in 1783. The town’s economy is largely based on the service industry, and the town has a high rate of educational attainment.
Common Questions
What is Per Capita Income in Longmeadow?
Per Capita income in Longmeadow is $64,358.
What is the Median Family Income in Longmeadow?
Median Family Income in Longmeadow is $171,929.
What is the Median Household income in Longmeadow?
Median Household Income in Longmeadow is $138,218.
What is Income or Wage Gap in Longmeadow?
Income or Wage Gap in Longmeadow is 42.0%.
Women in Longmeadow earn 58.0 cents for every dollar earned by a man.
What is Family Income Deficit in Longmeadow?
Family Income Deficit in Longmeadow is $13,492.
Families that are below poverty line in Longmeadow earn $13,492 less on average than the poverty threshold level.
What is Inequality or Gini Index in Longmeadow?
Inequality or Gini Index in Longmeadow is 0.42.
What is the Total Population of Longmeadow?
Total Population of Longmeadow is 15,789.
What is the Total Male Population of Longmeadow?
Total Male Population of Longmeadow is 7,248.
What is the Total Female Population of Longmeadow?
Total Female Population of Longmeadow is 8,541.
What is the Ratio of Males per 100 Females in Longmeadow?
There are 84.86 Males per 100 Females in Longmeadow.
What is the Ratio of Females per 100 Males in Longmeadow?
There are 117.84 Females per 100 Males in Longmeadow.
What is the Median Population Age in Longmeadow?
Median Population Age in Longmeadow is 44.8 Years.
What is the Average Family Size in Longmeadow
Average Family Size in Longmeadow is 3.2 People.
What is the Average Household Size in Longmeadow
Average Household Size in Longmeadow is 2.6 People.
How Large is the Labor Force in Longmeadow?
There are 7,323 People in the Labor Forcein in Longmeadow.
What is the Percentage of People in the Labor Force in Longmeadow?
58.8% of People are in the Labor Force in Longmeadow.
What is the Unemployment Rate in Longmeadow?
Unemployment Rate in Longmeadow is 6.5%.