East Harwich, MA Map & Demographics
East Harwich Map
East Harwich Overview
$53,263
PER CAPITA INCOME
$128,133
AVG FAMILY INCOME
$96,188
AVG HOUSEHOLD INCOME
0.6%
WAGE / INCOME GAP [ % ]
99.4¢/ $1
WAGE / INCOME GAP [ $ ]
0.38
INEQUALITY / GINI INDEX
5,693
TOTAL POPULATION
2,625
MALE POPULATION
3,068
FEMALE POPULATION
85.56
MALES / 100 FEMALES
116.88
FEMALES / 100 MALES
58.4
MEDIAN AGE
2.9
AVG FAMILY SIZE
2.3
AVG HOUSEHOLD SIZE
3,187
LABOR FORCE [ PEOPLE ]
62.5%
PERCENT IN LABOR FORCE
2.4%
UNEMPLOYMENT RATE
Income in East Harwich
Income Overview in East Harwich
Per Capita Income in East Harwich is $53,263, while median incomes of families and households are $128,133 and $96,188 respectively.
| Characteristic | Number | Measure |
| Per Capita Income | 5,693 | $53,263 |
| Median Family Income | 1,483 | $128,133 |
| Mean Family Income | 1,483 | $150,988 |
| Median Household Income | 2,463 | $96,188 |
| Mean Household Income | 2,463 | $119,792 |
| Income Deficit | 1,483 | $0 |
| Wage / Income Gap (%) | 5,693 | 0.60% |
| Wage / Income Gap ($) | 5,693 | 99.40¢ per $1 |
| Gini / Inequality Index | 5,693 | 0.38 |
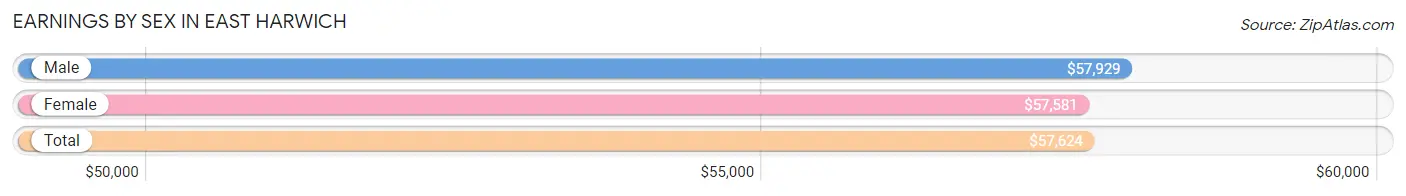
Earnings by Sex in East Harwich
Average Earnings in East Harwich are $57,624, $57,929 for men and $57,581 for women, a difference of 0.6%.
| Sex | Number | Average Earnings |
| Male | 1,818 (51.1%) | $57,929 |
| Female | 1,738 (48.9%) | $57,581 |
| Total | 3,556 (100.0%) | $57,624 |
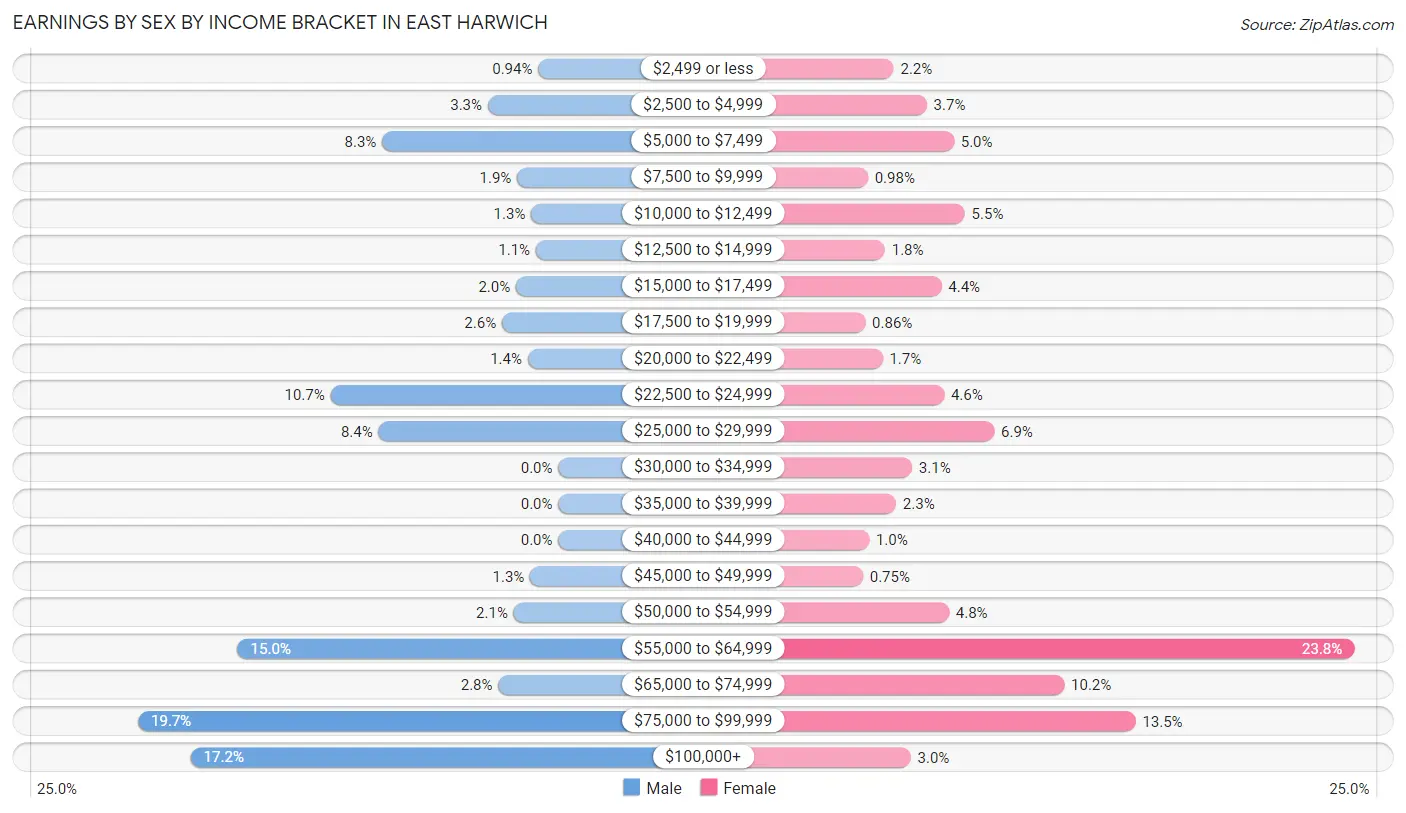
Earnings by Sex by Income Bracket in East Harwich
The most common earnings brackets in East Harwich are $75,000 to $99,999 for men (358 | 19.7%) and $55,000 to $64,999 for women (413 | 23.8%).
| Income | Male | Female |
| $2,499 or less | 17 (0.9%) | 38 (2.2%) |
| $2,500 to $4,999 | 60 (3.3%) | 65 (3.7%) |
| $5,000 to $7,499 | 150 (8.3%) | 87 (5.0%) |
| $7,500 to $9,999 | 35 (1.9%) | 17 (1.0%) |
| $10,000 to $12,499 | 23 (1.3%) | 96 (5.5%) |
| $12,500 to $14,999 | 19 (1.1%) | 31 (1.8%) |
| $15,000 to $17,499 | 36 (2.0%) | 77 (4.4%) |
| $17,500 to $19,999 | 48 (2.6%) | 15 (0.9%) |
| $20,000 to $22,499 | 26 (1.4%) | 29 (1.7%) |
| $22,500 to $24,999 | 194 (10.7%) | 79 (4.5%) |
| $25,000 to $29,999 | 153 (8.4%) | 120 (6.9%) |
| $30,000 to $34,999 | 0 (0.0%) | 53 (3.0%) |
| $35,000 to $39,999 | 0 (0.0%) | 40 (2.3%) |
| $40,000 to $44,999 | 0 (0.0%) | 18 (1.0%) |
| $45,000 to $49,999 | 24 (1.3%) | 13 (0.7%) |
| $50,000 to $54,999 | 38 (2.1%) | 83 (4.8%) |
| $55,000 to $64,999 | 273 (15.0%) | 413 (23.8%) |
| $65,000 to $74,999 | 51 (2.8%) | 177 (10.2%) |
| $75,000 to $99,999 | 358 (19.7%) | 235 (13.5%) |
| $100,000+ | 313 (17.2%) | 52 (3.0%) |
| Total | 1,818 (100.0%) | 1,738 (100.0%) |
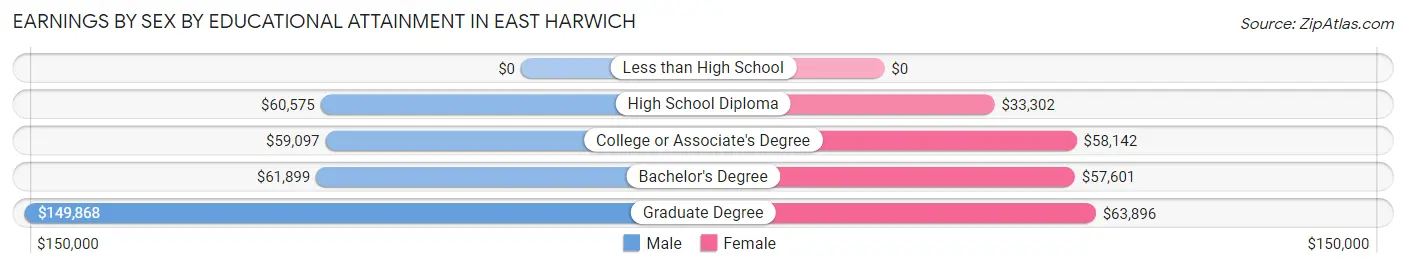
Earnings by Sex by Educational Attainment in East Harwich
Average earnings in East Harwich are $61,606 for men and $57,859 for women, a difference of 6.1%. Men with an educational attainment of graduate degree enjoy the highest average annual earnings of $149,868, while those with college or associate's degree education earn the least with $59,097. Women with an educational attainment of graduate degree earn the most with the average annual earnings of $63,896, while those with high school diploma education have the smallest earnings of $33,302.
| Educational Attainment | Male Income | Female Income |
| Less than High School | - | - |
| High School Diploma | $60,575 | $33,302 |
| College or Associate's Degree | $59,097 | $58,142 |
| Bachelor's Degree | $61,899 | $57,601 |
| Graduate Degree | $149,868 | $63,896 |
| Total | $61,606 | $57,859 |
Family Income in East Harwich
Family Income Brackets in East Harwich
According to the East Harwich family income data, there are 362 families falling into the $100,000 to $149,999 income range, which is the most common income bracket and makes up 24.4% of all families.
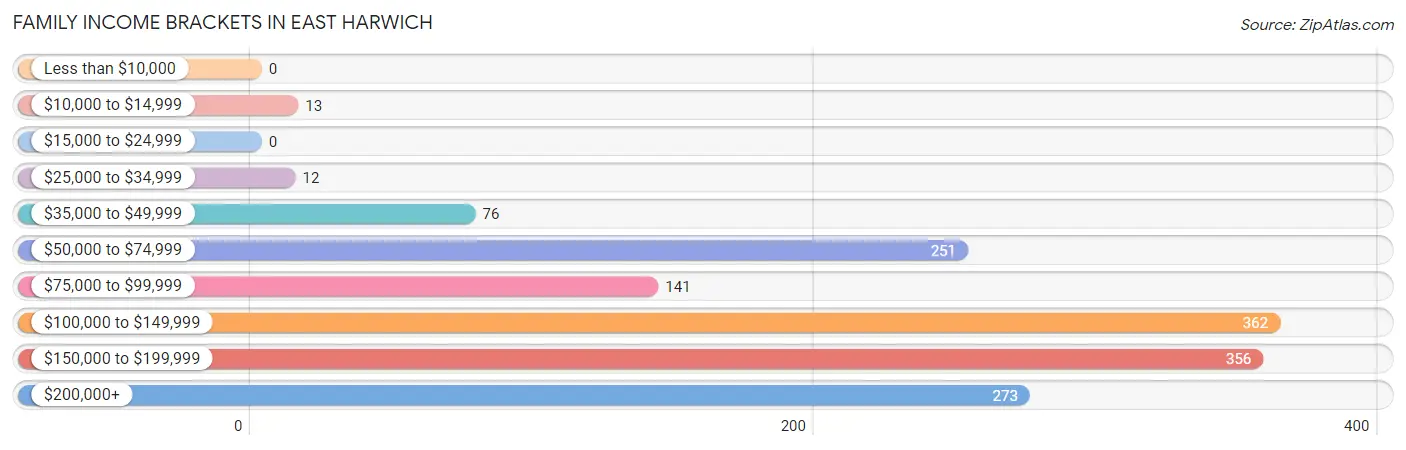
| Income Bracket | # Families | % Families |
| Less than $10,000 | 0 | 0.0% |
| $10,000 to $14,999 | 13 | 0.9% |
| $15,000 to $24,999 | 0 | 0.0% |
| $25,000 to $34,999 | 12 | 0.8% |
| $35,000 to $49,999 | 76 | 5.1% |
| $50,000 to $74,999 | 251 | 16.9% |
| $75,000 to $99,999 | 141 | 9.5% |
| $100,000 to $149,999 | 362 | 24.4% |
| $150,000 to $199,999 | 356 | 24.0% |
| $200,000+ | 273 | 18.4% |
Family Income by Famaliy Size in East Harwich
3-person families (383 | 25.8%) account for the highest median family income in East Harwich with $159,047 per family, while 3-person families (383 | 25.8%) have the highest median income of $53,016 per family member.
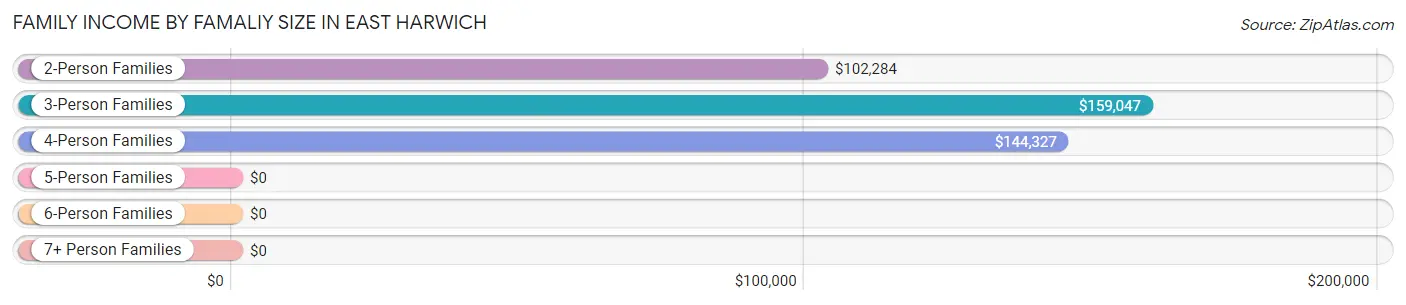
| Income Bracket | # Families | Median Income |
| 2-Person Families | 763 (51.4%) | $102,284 |
| 3-Person Families | 383 (25.8%) | $159,047 |
| 4-Person Families | 279 (18.8%) | $144,327 |
| 5-Person Families | 58 (3.9%) | $0 |
| 6-Person Families | 0 (0.0%) | $0 |
| 7+ Person Families | 0 (0.0%) | $0 |
| Total | 1,483 (100.0%) | $128,133 |
Family Income by Number of Earners in East Harwich
The median family income in East Harwich is $128,133, with families comprising 2 earners (636) having the highest median family income of $158,892, while families with no earners (279) have the lowest median family income of $75,515, accounting for 42.9% and 18.8% of families, respectively.
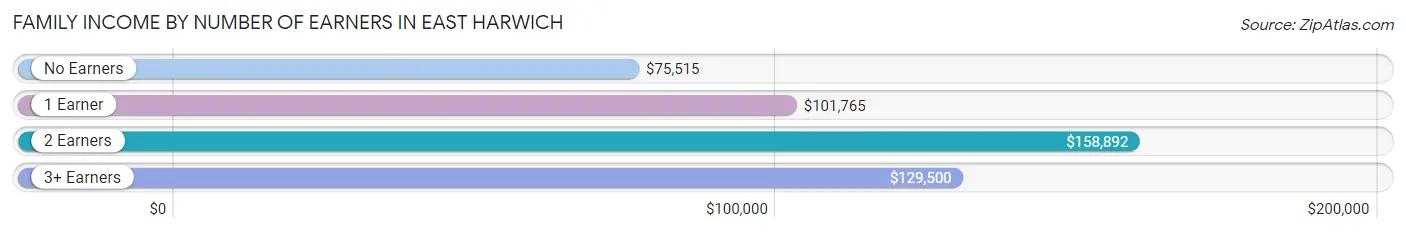
| Number of Earners | # Families | Median Income |
| No Earners | 279 (18.8%) | $75,515 |
| 1 Earner | 288 (19.4%) | $101,765 |
| 2 Earners | 636 (42.9%) | $158,892 |
| 3+ Earners | 280 (18.9%) | $129,500 |
| Total | 1,483 (100.0%) | $128,133 |
Household Income in East Harwich
Household Income Brackets in East Harwich
With 517 households falling in the category, the $100,000 to $149,999 income range is the most frequent in East Harwich, accounting for 21.0% of all households. In contrast, only 20 households (0.8%) fall into the less than $10,000 income bracket, making it the least populous group.
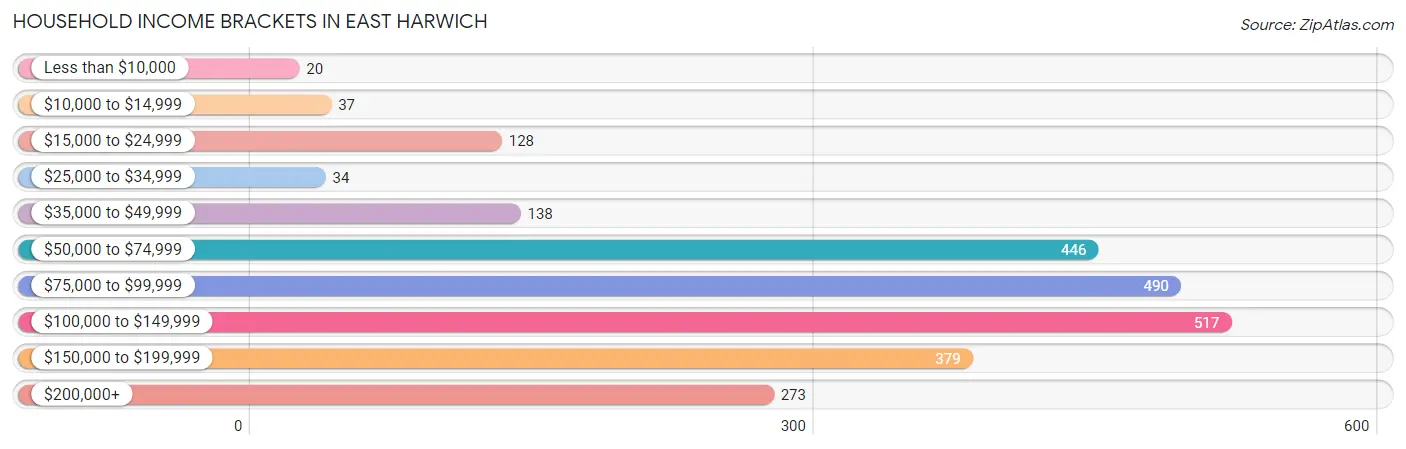
| Income Bracket | # Households | % Households |
| Less than $10,000 | 20 | 0.8% |
| $10,000 to $14,999 | 37 | 1.5% |
| $15,000 to $24,999 | 128 | 5.2% |
| $25,000 to $34,999 | 34 | 1.4% |
| $35,000 to $49,999 | 138 | 5.6% |
| $50,000 to $74,999 | 446 | 18.1% |
| $75,000 to $99,999 | 490 | 19.9% |
| $100,000 to $149,999 | 517 | 21.0% |
| $150,000 to $199,999 | 379 | 15.4% |
| $200,000+ | 273 | 11.1% |
Household Income by Householder Age in East Harwich
The median household income in East Harwich is $96,188, with the highest median household income of $132,917 found in the 45 to 64 years age bracket for the primary householder. A total of 795 households (32.3%) fall into this category. Meanwhile, the 15 to 24 years age bracket for the primary householder has the lowest median household income of $0, with 39 households (1.6%) in this group.
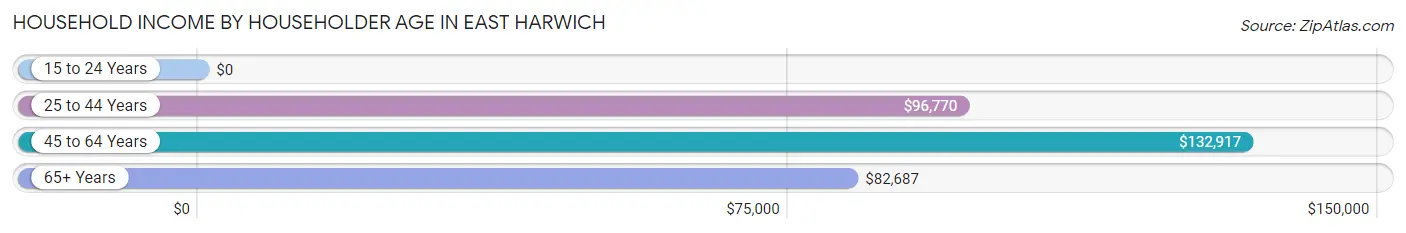
| Income Bracket | # Households | Median Income |
| 15 to 24 Years | 39 (1.6%) | $0 |
| 25 to 44 Years | 458 (18.6%) | $96,770 |
| 45 to 64 Years | 795 (32.3%) | $132,917 |
| 65+ Years | 1,171 (47.5%) | $82,687 |
| Total | 2,463 (100.0%) | $96,188 |
Poverty in East Harwich
Income Below Poverty by Sex and Age in East Harwich
With 0.2% poverty level for males and 2.4% for females among the residents of East Harwich, 45 to 54 year old males and 45 to 54 year old females are the most vulnerable to poverty, with 3 males (1.9%) and 13 females (11.5%) in their respective age groups living below the poverty level.
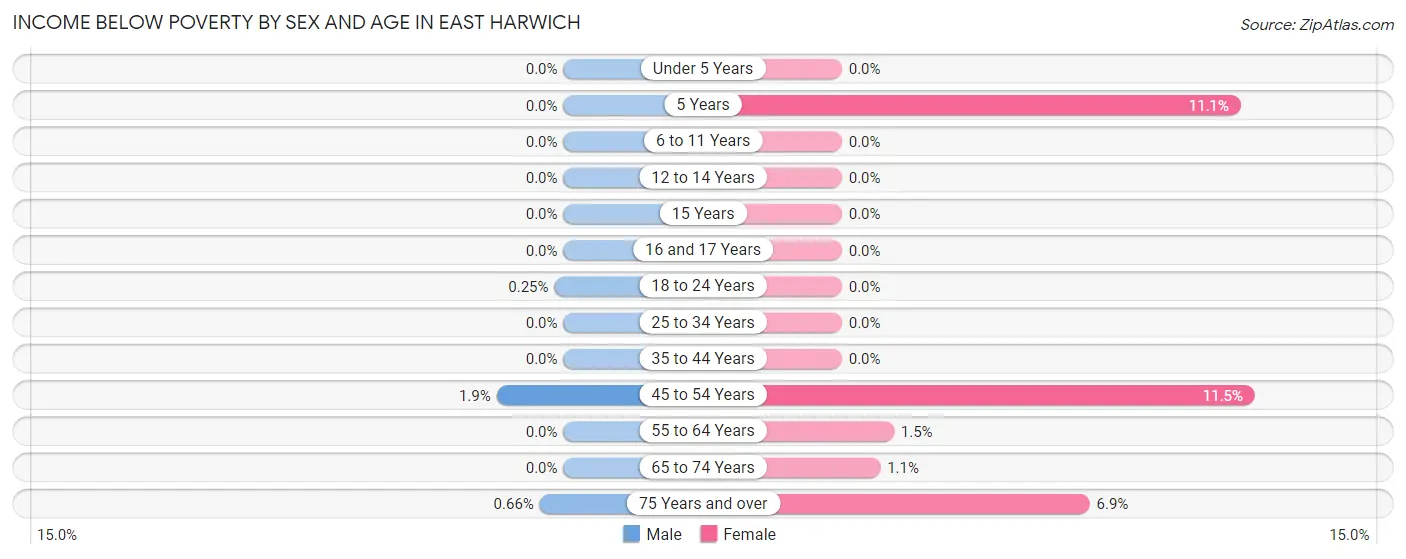
| Age Bracket | Male | Female |
| Under 5 Years | 0 (0.0%) | 0 (0.0%) |
| 5 Years | 0 (0.0%) | 14 (11.1%) |
| 6 to 11 Years | 0 (0.0%) | 0 (0.0%) |
| 12 to 14 Years | 0 (0.0%) | 0 (0.0%) |
| 15 Years | 0 (0.0%) | 0 (0.0%) |
| 16 and 17 Years | 0 (0.0%) | 0 (0.0%) |
| 18 to 24 Years | 1 (0.3%) | 0 (0.0%) |
| 25 to 34 Years | 0 (0.0%) | 0 (0.0%) |
| 35 to 44 Years | 0 (0.0%) | 0 (0.0%) |
| 45 to 54 Years | 3 (1.9%) | 13 (11.5%) |
| 55 to 64 Years | 0 (0.0%) | 10 (1.5%) |
| 65 to 74 Years | 0 (0.0%) | 9 (1.1%) |
| 75 Years and over | 1 (0.7%) | 29 (6.9%) |
| Total | 5 (0.2%) | 75 (2.4%) |
Income Above Poverty by Sex and Age in East Harwich
According to the poverty statistics in East Harwich, males aged under 5 years and females aged under 5 years are the age groups that are most secure financially, with 100.0% of males and 100.0% of females in these age groups living above the poverty line.
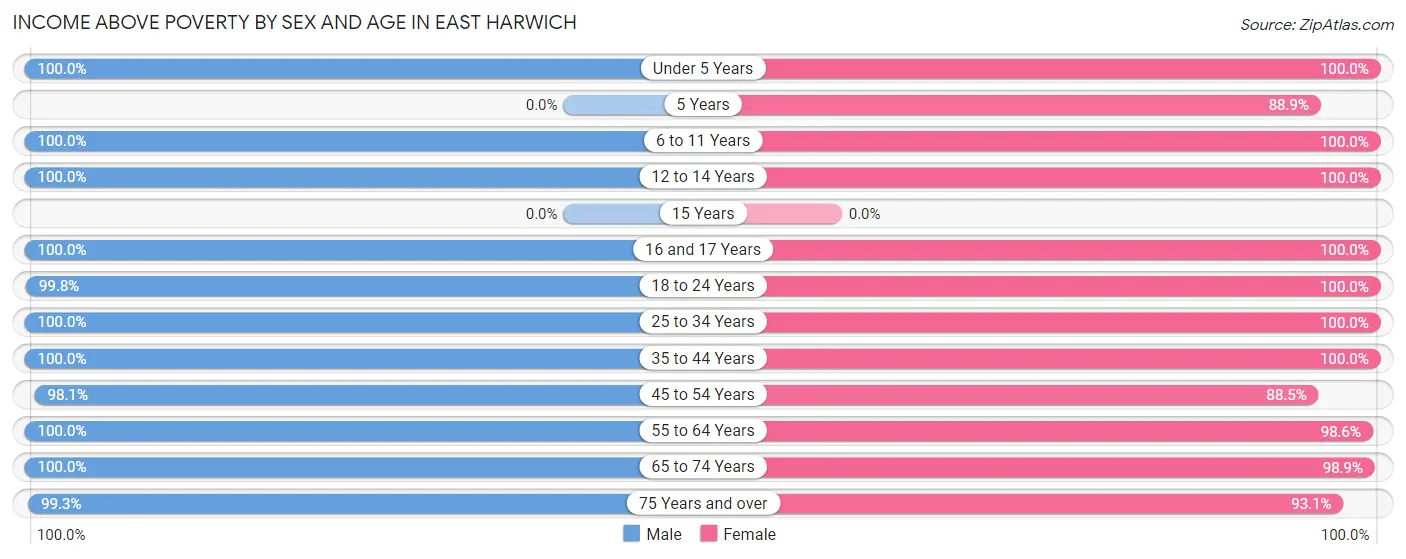
| Age Bracket | Male | Female |
| Under 5 Years | 212 (100.0%) | 62 (100.0%) |
| 5 Years | 0 (0.0%) | 112 (88.9%) |
| 6 to 11 Years | 32 (100.0%) | 72 (100.0%) |
| 12 to 14 Years | 54 (100.0%) | 17 (100.0%) |
| 15 Years | 0 (0.0%) | 0 (0.0%) |
| 16 and 17 Years | 23 (100.0%) | 12 (100.0%) |
| 18 to 24 Years | 402 (99.8%) | 43 (100.0%) |
| 25 to 34 Years | 152 (100.0%) | 169 (100.0%) |
| 35 to 44 Years | 269 (100.0%) | 499 (100.0%) |
| 45 to 54 Years | 158 (98.1%) | 100 (88.5%) |
| 55 to 64 Years | 660 (100.0%) | 682 (98.6%) |
| 65 to 74 Years | 489 (100.0%) | 834 (98.9%) |
| 75 Years and over | 150 (99.3%) | 391 (93.1%) |
| Total | 2,601 (99.8%) | 2,993 (97.6%) |
Income Below Poverty Among Married-Couple Families in East Harwich
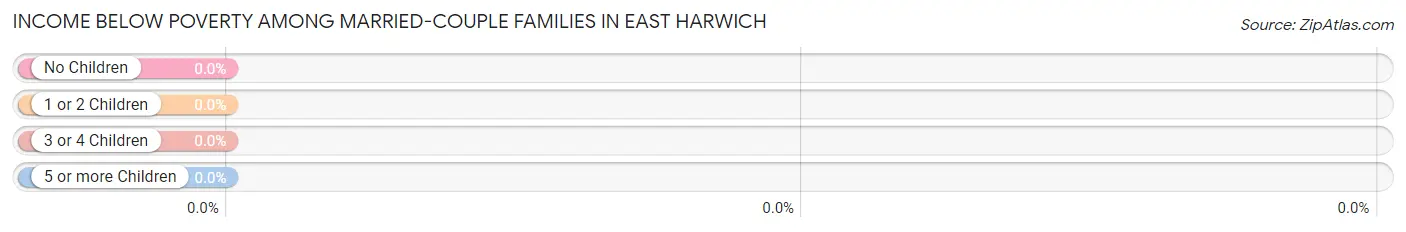
| Children | Above Poverty | Below Poverty |
| No Children | 971 (100.0%) | 0 (0.0%) |
| 1 or 2 Children | 191 (100.0%) | 0 (0.0%) |
| 3 or 4 Children | 52 (100.0%) | 0 (0.0%) |
| 5 or more Children | 0 (0.0%) | 0 (0.0%) |
| Total | 1,214 (100.0%) | 0 (0.0%) |
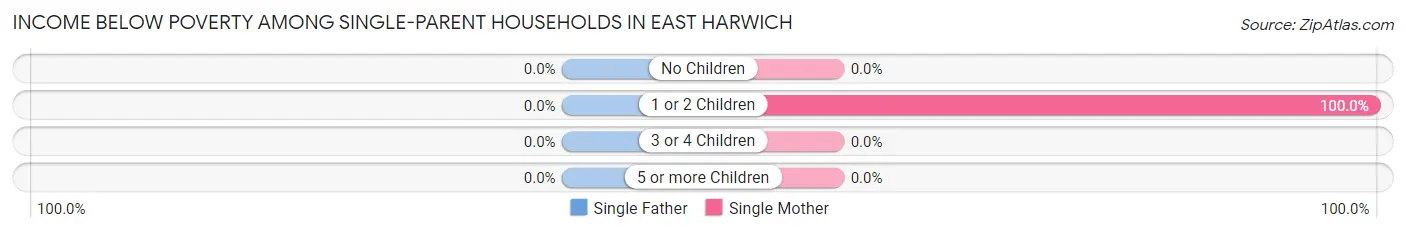
Income Below Poverty Among Single-Parent Households in East Harwich
| Children | Single Father | Single Mother |
| No Children | 0 (0.0%) | 0 (0.0%) |
| 1 or 2 Children | 0 (0.0%) | 13 (100.0%) |
| 3 or 4 Children | 0 (0.0%) | 0 (0.0%) |
| 5 or more Children | 0 (0.0%) | 0 (0.0%) |
| Total | 0 (0.0%) | 13 (7.2%) |
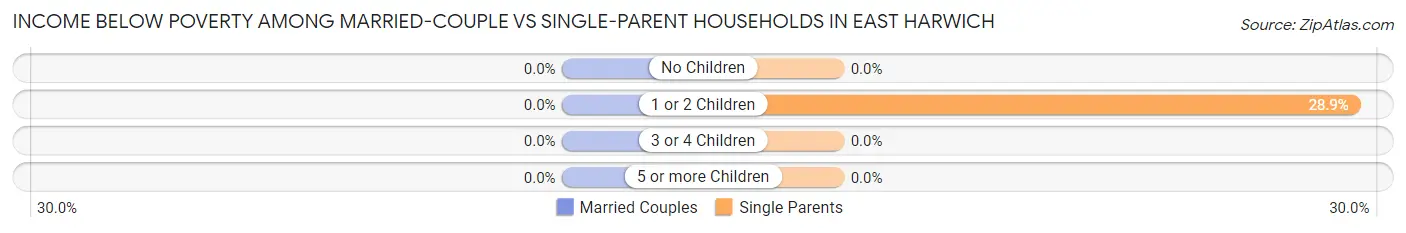
Income Below Poverty Among Married-Couple vs Single-Parent Households in East Harwich
| Children | Married-Couple Families | Single-Parent Households |
| No Children | 0 (0.0%) | 0 (0.0%) |
| 1 or 2 Children | 0 (0.0%) | 13 (28.9%) |
| 3 or 4 Children | 0 (0.0%) | 0 (0.0%) |
| 5 or more Children | 0 (0.0%) | 0 (0.0%) |
| Total | 0 (0.0%) | 13 (4.8%) |
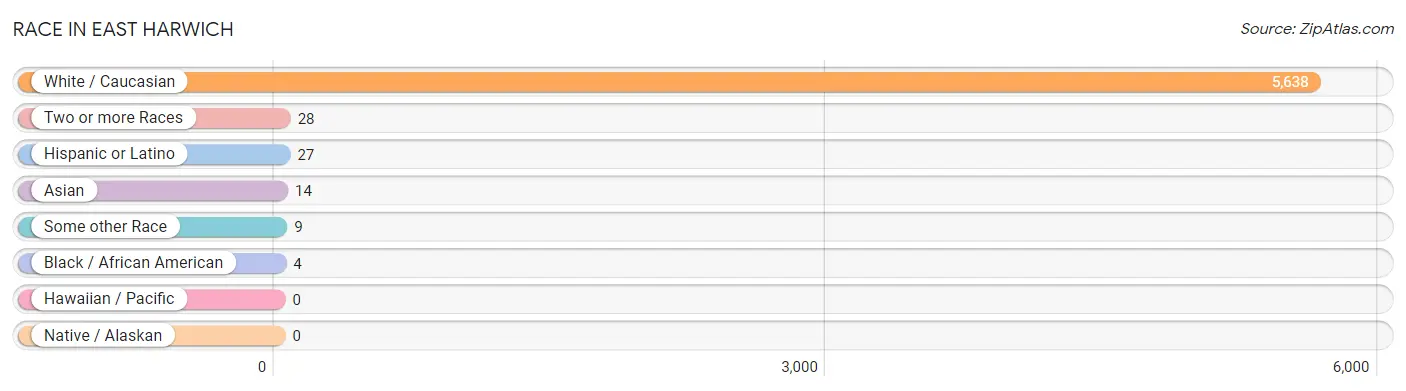
Race in East Harwich
The most populous races in East Harwich are White / Caucasian (5,638 | 99.0%), Two or more Races (28 | 0.5%), and Hispanic or Latino (27 | 0.5%).
| Race | # Population | % Population |
| Asian | 14 | 0.3% |
| Black / African American | 4 | 0.1% |
| Hawaiian / Pacific | 0 | 0.0% |
| Hispanic or Latino | 27 | 0.5% |
| Native / Alaskan | 0 | 0.0% |
| White / Caucasian | 5,638 | 99.0% |
| Two or more Races | 28 | 0.5% |
| Some other Race | 9 | 0.2% |
| Total | 5,693 | 100.0% |
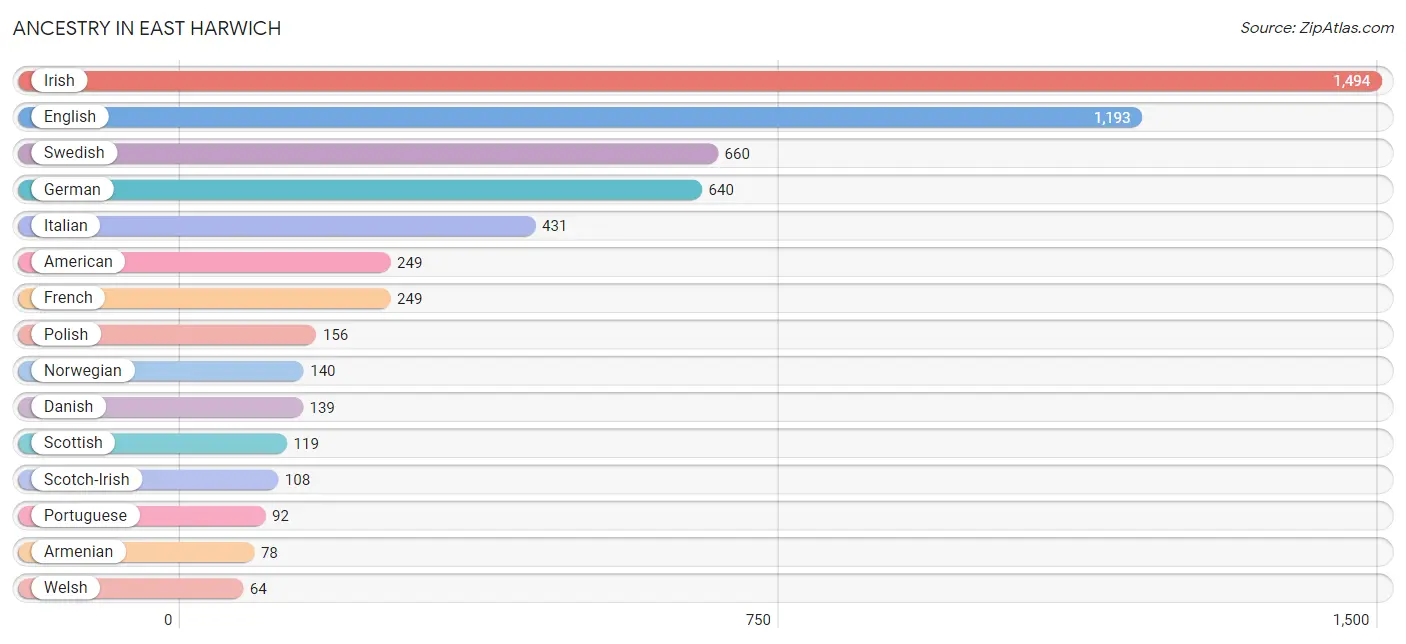
Ancestry in East Harwich
The most populous ancestries reported in East Harwich are Irish (1,494 | 26.2%), English (1,193 | 21.0%), Swedish (660 | 11.6%), German (640 | 11.2%), and Italian (431 | 7.6%), together accounting for 77.6% of all East Harwich residents.
| Ancestry | # Population | % Population |
| Albanian | 15 | 0.3% |
| American | 249 | 4.4% |
| Armenian | 78 | 1.4% |
| Austrian | 26 | 0.5% |
| British | 36 | 0.6% |
| Canadian | 39 | 0.7% |
| Cuban | 3 | 0.1% |
| Danish | 139 | 2.4% |
| Eastern European | 17 | 0.3% |
| English | 1,193 | 21.0% |
| European | 48 | 0.8% |
| French | 249 | 4.4% |
| French Canadian | 55 | 1.0% |
| German | 640 | 11.2% |
| Hungarian | 38 | 0.7% |
| Indian (Asian) | 14 | 0.3% |
| Irish | 1,494 | 26.2% |
| Italian | 431 | 7.6% |
| Lithuanian | 22 | 0.4% |
| Macedonian | 52 | 0.9% |
| Mexican | 9 | 0.2% |
| Norwegian | 140 | 2.5% |
| Polish | 156 | 2.7% |
| Portuguese | 92 | 1.6% |
| Puerto Rican | 15 | 0.3% |
| Scotch-Irish | 108 | 1.9% |
| Scottish | 119 | 2.1% |
| Swedish | 660 | 11.6% |
| Swiss | 33 | 0.6% |
| Ukrainian | 10 | 0.2% |
| Welsh | 64 | 1.1% | View All 31 Rows |
Immigrants in East Harwich
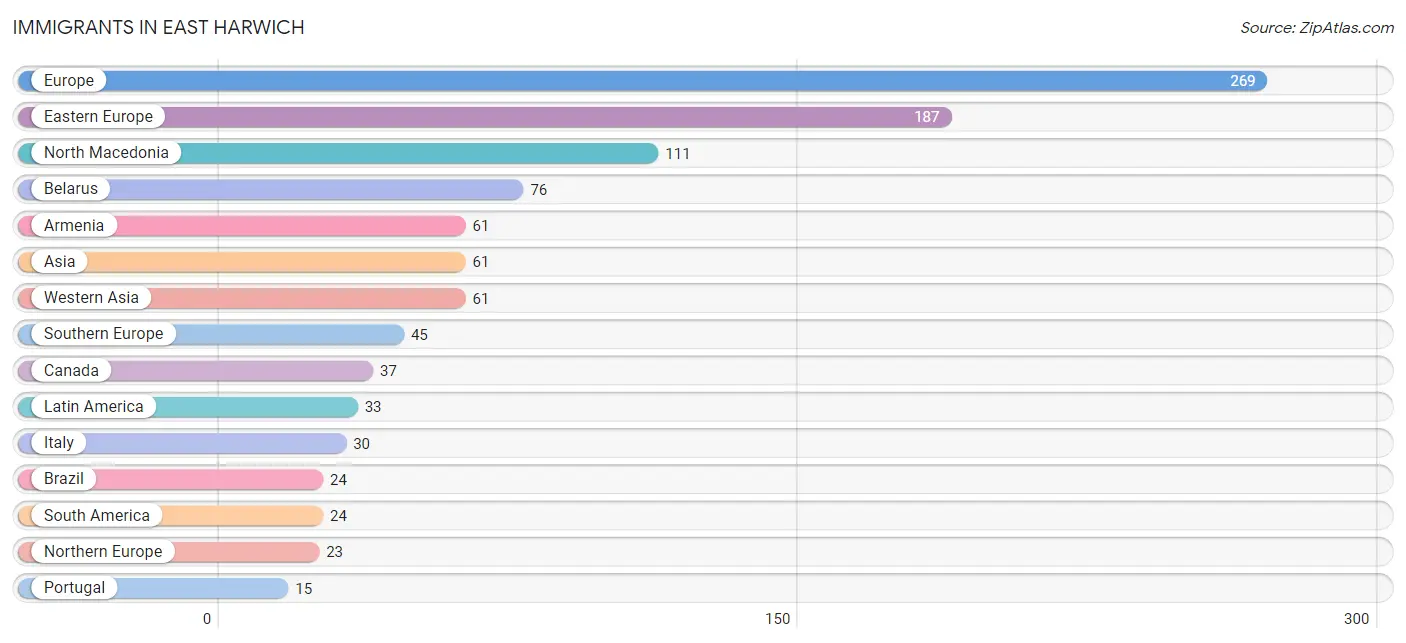
The most numerous immigrant groups reported in East Harwich came from Europe (269 | 4.7%), Eastern Europe (187 | 3.3%), North Macedonia (111 | 1.9%), Belarus (76 | 1.3%), and Armenia (61 | 1.1%), together accounting for 12.4% of all East Harwich residents.
| Immigration Origin | # Population | % Population |
| Armenia | 61 | 1.1% |
| Asia | 61 | 1.1% |
| Belarus | 76 | 1.3% |
| Brazil | 24 | 0.4% |
| Canada | 37 | 0.6% |
| Central America | 9 | 0.2% |
| Eastern Europe | 187 | 3.3% |
| Europe | 269 | 4.7% |
| Germany | 14 | 0.3% |
| Ireland | 13 | 0.2% |
| Italy | 30 | 0.5% |
| Latin America | 33 | 0.6% |
| Mexico | 9 | 0.2% |
| North Macedonia | 111 | 1.9% |
| Northern Europe | 23 | 0.4% |
| Portugal | 15 | 0.3% |
| South America | 24 | 0.4% |
| Southern Europe | 45 | 0.8% |
| Western Asia | 61 | 1.1% |
| Western Europe | 14 | 0.3% | View All 20 Rows |
Sex and Age in East Harwich
Sex and Age in East Harwich
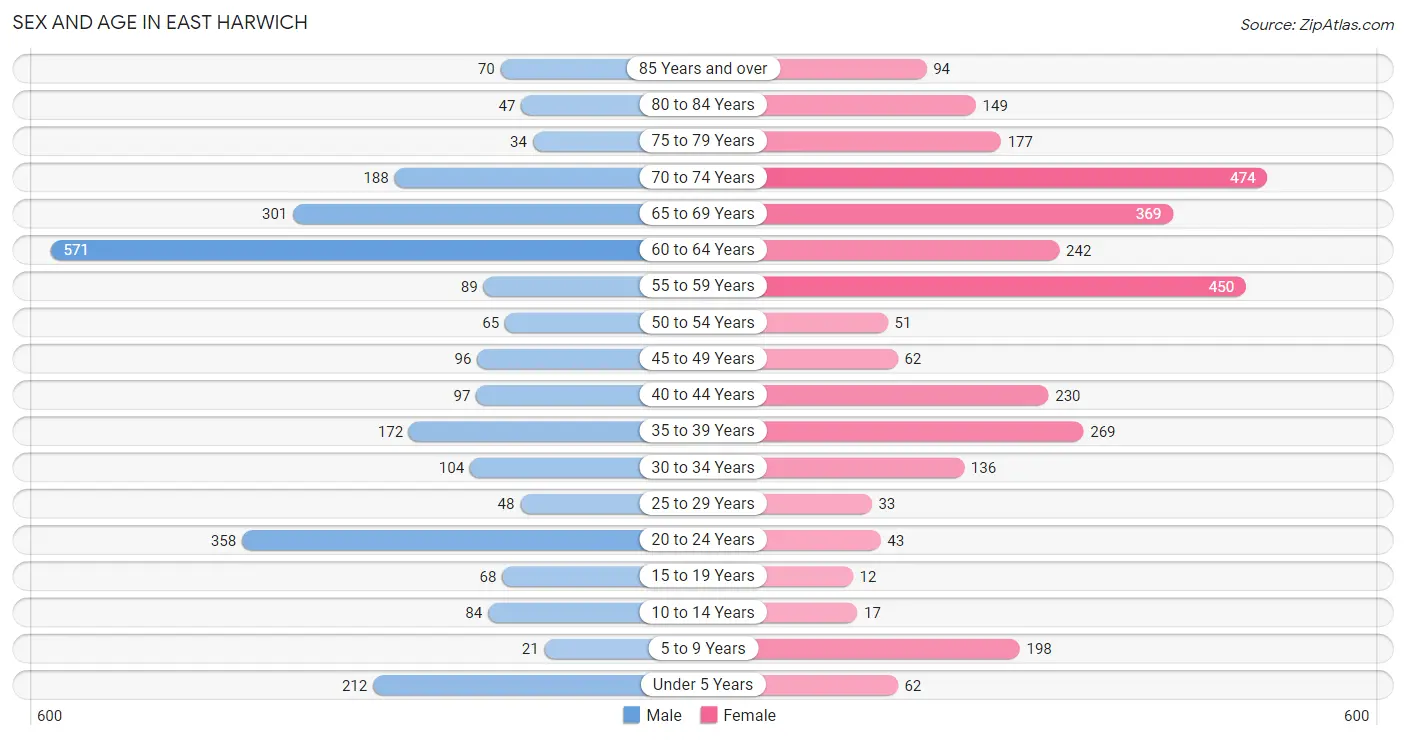
The most populous age groups in East Harwich are 60 to 64 Years (571 | 21.7%) for men and 70 to 74 Years (474 | 15.4%) for women.
| Age Bracket | Male | Female |
| Under 5 Years | 212 (8.1%) | 62 (2.0%) |
| 5 to 9 Years | 21 (0.8%) | 198 (6.5%) |
| 10 to 14 Years | 84 (3.2%) | 17 (0.5%) |
| 15 to 19 Years | 68 (2.6%) | 12 (0.4%) |
| 20 to 24 Years | 358 (13.6%) | 43 (1.4%) |
| 25 to 29 Years | 48 (1.8%) | 33 (1.1%) |
| 30 to 34 Years | 104 (4.0%) | 136 (4.4%) |
| 35 to 39 Years | 172 (6.6%) | 269 (8.8%) |
| 40 to 44 Years | 97 (3.7%) | 230 (7.5%) |
| 45 to 49 Years | 96 (3.7%) | 62 (2.0%) |
| 50 to 54 Years | 65 (2.5%) | 51 (1.7%) |
| 55 to 59 Years | 89 (3.4%) | 450 (14.7%) |
| 60 to 64 Years | 571 (21.7%) | 242 (7.9%) |
| 65 to 69 Years | 301 (11.5%) | 369 (12.0%) |
| 70 to 74 Years | 188 (7.2%) | 474 (15.4%) |
| 75 to 79 Years | 34 (1.3%) | 177 (5.8%) |
| 80 to 84 Years | 47 (1.8%) | 149 (4.9%) |
| 85 Years and over | 70 (2.7%) | 94 (3.1%) |
| Total | 2,625 (100.0%) | 3,068 (100.0%) |
Families and Households in East Harwich
Median Family Size in East Harwich
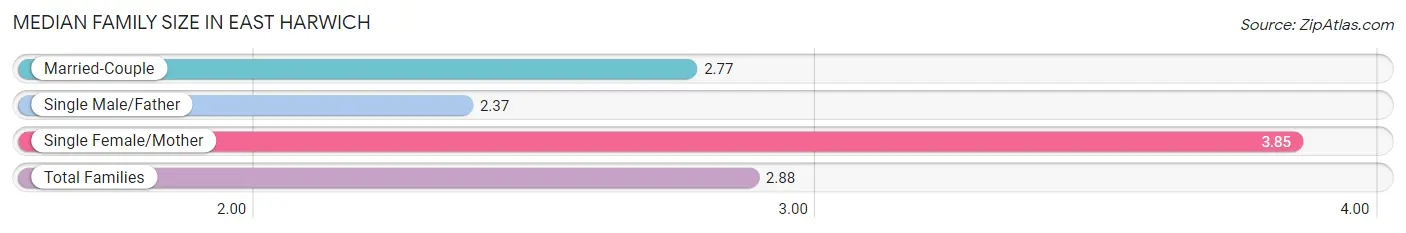
The median family size in East Harwich is 2.88 persons per family, with single female/mother families (180 | 12.1%) accounting for the largest median family size of 3.85 persons per family. On the other hand, single male/father families (89 | 6.0%) represent the smallest median family size with 2.37 persons per family.
| Family Type | # Families | Family Size |
| Married-Couple | 1,214 (81.9%) | 2.77 |
| Single Male/Father | 89 (6.0%) | 2.37 |
| Single Female/Mother | 180 (12.1%) | 3.85 |
| Total Families | 1,483 (100.0%) | 2.88 |
Median Household Size in East Harwich
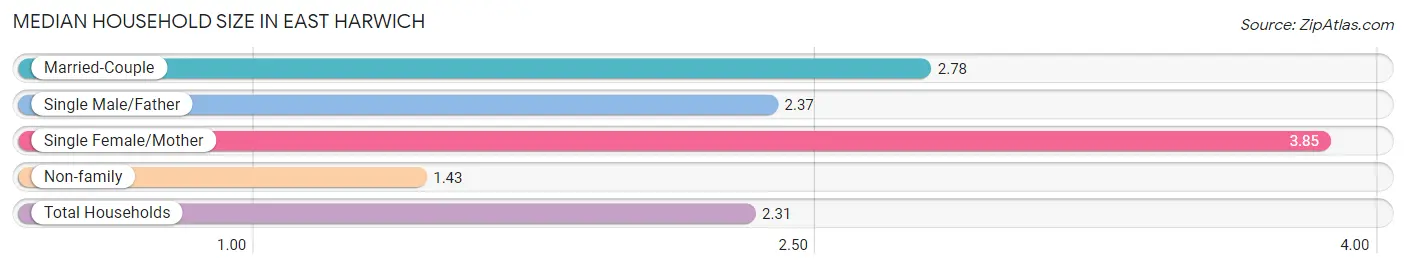
The median household size in East Harwich is 2.31 persons per household, with single female/mother households (180 | 7.3%) accounting for the largest median household size of 3.85 persons per household. non-family households (980 | 39.8%) represent the smallest median household size with 1.43 persons per household.
| Household Type | # Households | Household Size |
| Married-Couple | 1,214 (49.3%) | 2.78 |
| Single Male/Father | 89 (3.6%) | 2.37 |
| Single Female/Mother | 180 (7.3%) | 3.85 |
| Non-family | 980 (39.8%) | 1.43 |
| Total Households | 2,463 (100.0%) | 2.31 |
Household Size by Marriage Status in East Harwich
Out of a total of 2,463 households in East Harwich, 1,483 (60.2%) are family households, while 980 (39.8%) are nonfamily households. The most numerous type of family households are 2-person households, comprising 748, and the most common type of nonfamily households are 1-person households, comprising 593.
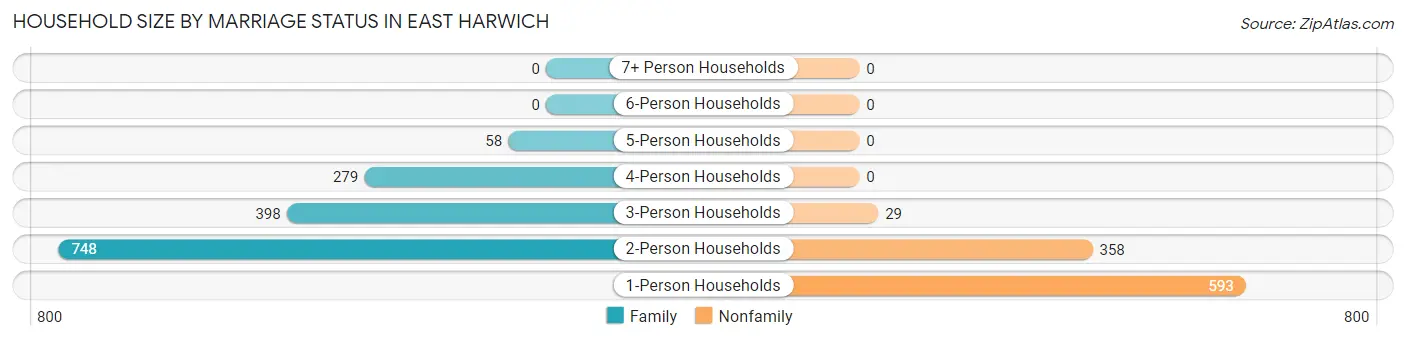
| Household Size | Family Households | Nonfamily Households |
| 1-Person Households | - | 593 (24.1%) |
| 2-Person Households | 748 (30.4%) | 358 (14.5%) |
| 3-Person Households | 398 (16.2%) | 29 (1.2%) |
| 4-Person Households | 279 (11.3%) | 0 (0.0%) |
| 5-Person Households | 58 (2.4%) | 0 (0.0%) |
| 6-Person Households | 0 (0.0%) | 0 (0.0%) |
| 7+ Person Households | 0 (0.0%) | 0 (0.0%) |
| Total | 1,483 (60.2%) | 980 (39.8%) |
Female Fertility in East Harwich
Fertility by Age in East Harwich
Average fertility rate in East Harwich is 73.0 births per 1,000 women. Women in the age bracket of 20 to 34 years have the highest fertility rate with 278.0 births per 1,000 women. Women in the age bracket of 20 to 34 years acount for 100.0% of all women with births.
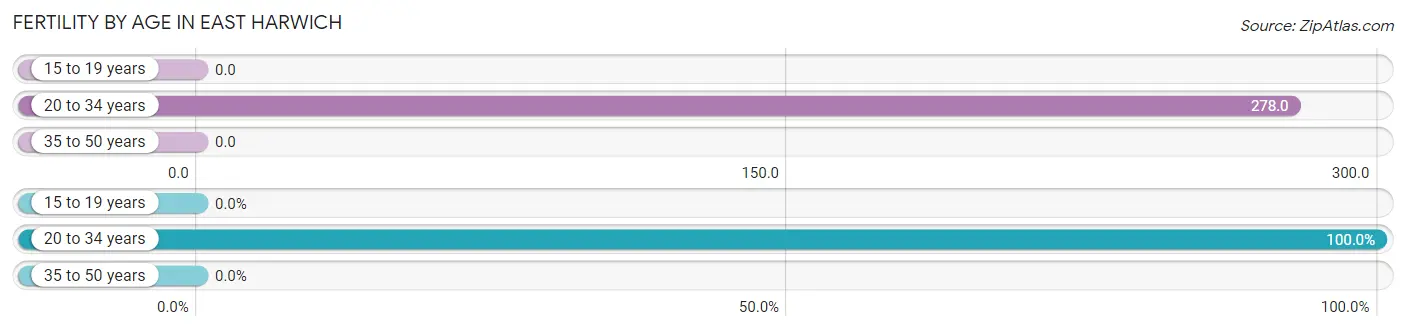
| Age Bracket | Women with Births | Births / 1,000 Women |
| 15 to 19 years | 0 (0.0%) | 0.0 |
| 20 to 34 years | 59 (100.0%) | 278.0 |
| 35 to 50 years | 0 (0.0%) | 0.0 |
| Total | 59 (100.0%) | 73.0 |
Fertility by Age by Marriage Status in East Harwich
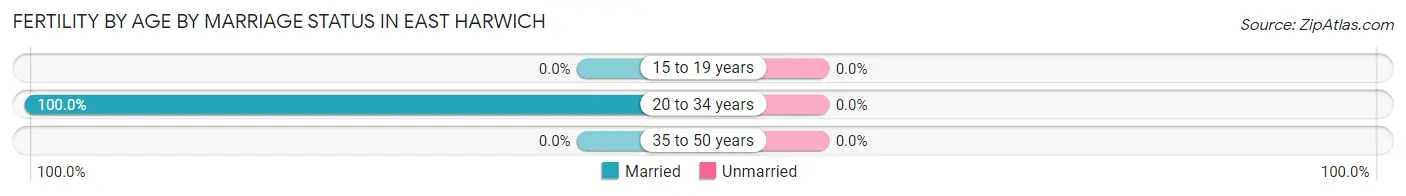
| Age Bracket | Married | Unmarried |
| 15 to 19 years | 0 (0.0%) | 0 (0.0%) |
| 20 to 34 years | 59 (100.0%) | 0 (0.0%) |
| 35 to 50 years | 0 (0.0%) | 0 (0.0%) |
| Total | 59 (100.0%) | 0 (0.0%) |
Fertility by Education in East Harwich
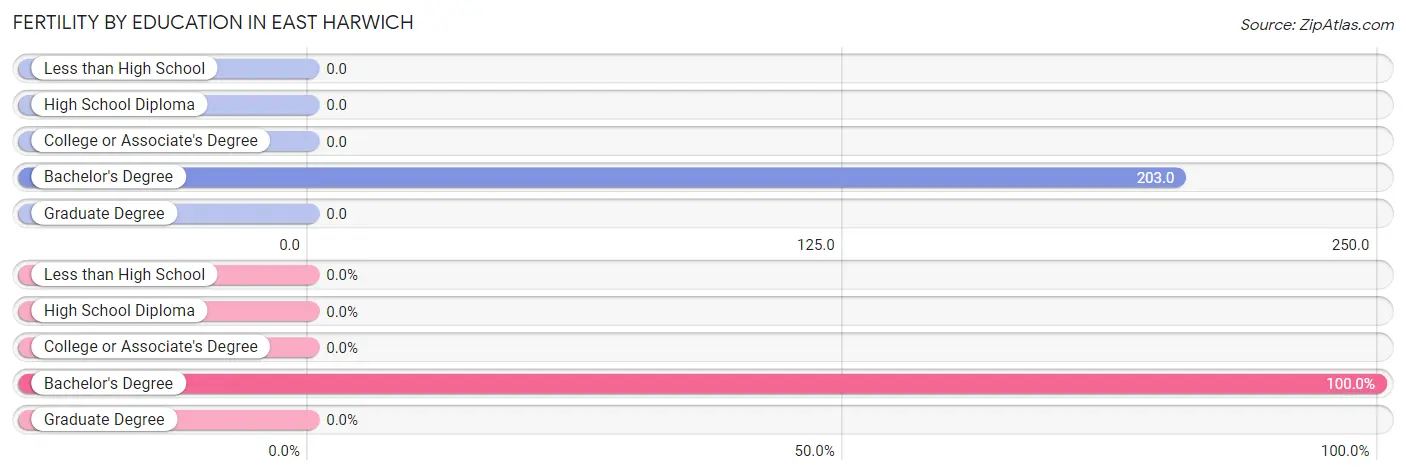
| Educational Attainment | Women with Births | Births / 1,000 Women |
| Less than High School | 0 (0.0%) | 0.0 |
| High School Diploma | 0 (0.0%) | 0.0 |
| College or Associate's Degree | 0 (0.0%) | 0.0 |
| Bachelor's Degree | 59 (100.0%) | 203.0 |
| Graduate Degree | 0 (0.0%) | 0.0 |
| Total | 59 (100.0%) | 73.0 |
Fertility by Education by Marriage Status in East Harwich
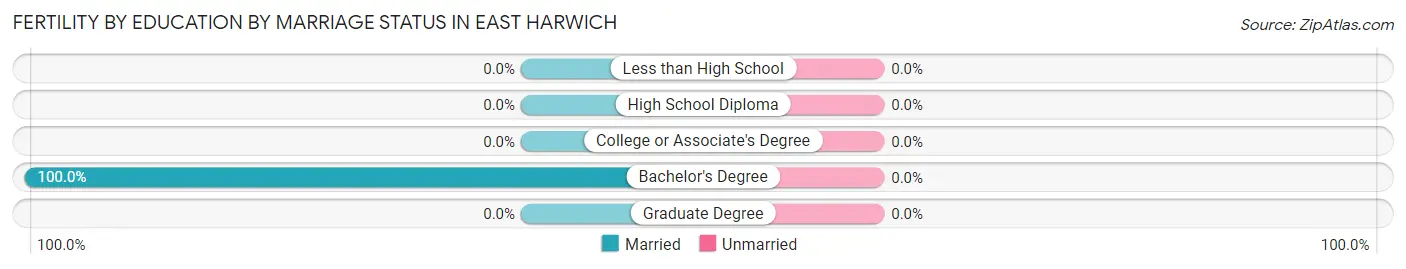
| Educational Attainment | Married | Unmarried |
| Less than High School | 0 (0.0%) | 0 (0.0%) |
| High School Diploma | 0 (0.0%) | 0 (0.0%) |
| College or Associate's Degree | 0 (0.0%) | 0 (0.0%) |
| Bachelor's Degree | 59 (100.0%) | 0 (0.0%) |
| Graduate Degree | 0 (0.0%) | 0 (0.0%) |
| Total | 59 (100.0%) | 0 (0.0%) |
Employment Characteristics in East Harwich
Employment by Class of Employer in East Harwich
Among the 3,088 employed individuals in East Harwich, private company employees (1,753 | 56.8%), local government employees (468 | 15.2%), and not-for-profit organizations (326 | 10.6%) make up the most common classes of employment.
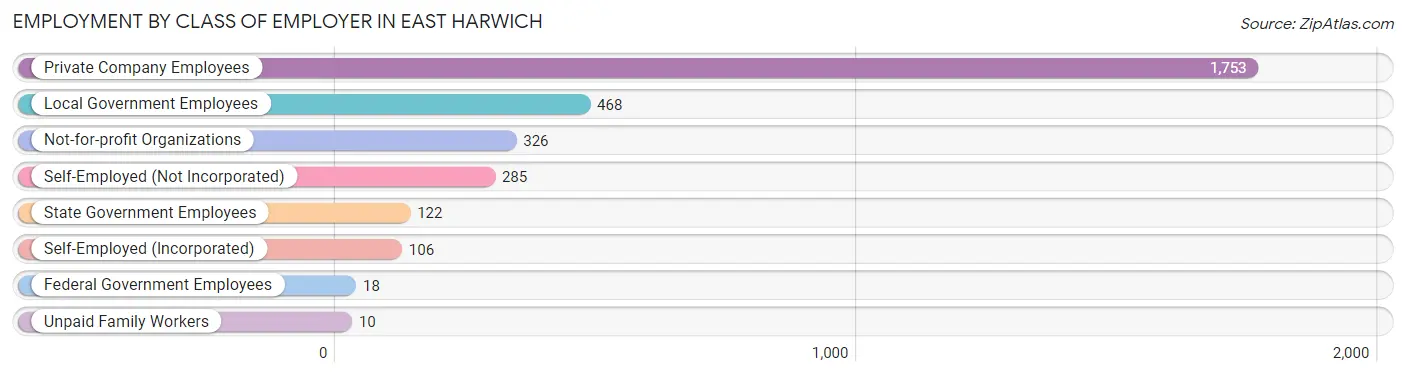
| Employer Class | # Employees | % Employees |
| Private Company Employees | 1,753 | 56.8% |
| Self-Employed (Incorporated) | 106 | 3.4% |
| Self-Employed (Not Incorporated) | 285 | 9.2% |
| Not-for-profit Organizations | 326 | 10.6% |
| Local Government Employees | 468 | 15.2% |
| State Government Employees | 122 | 4.0% |
| Federal Government Employees | 18 | 0.6% |
| Unpaid Family Workers | 10 | 0.3% |
| Total | 3,088 | 100.0% |
Employment Status by Age in East Harwich
According to the labor force statistics for East Harwich, out of the total population over 16 years of age (5,099), 62.5% or 3,187 individuals are in the labor force, with 2.4% or 76 of them unemployed. The age group with the highest labor force participation rate is 25 to 29 years, with 100.0% or 81 individuals in the labor force. Within the labor force, the 20 to 24 years age range has the highest percentage of unemployed individuals, with 13.8% or 35 of them being unemployed.
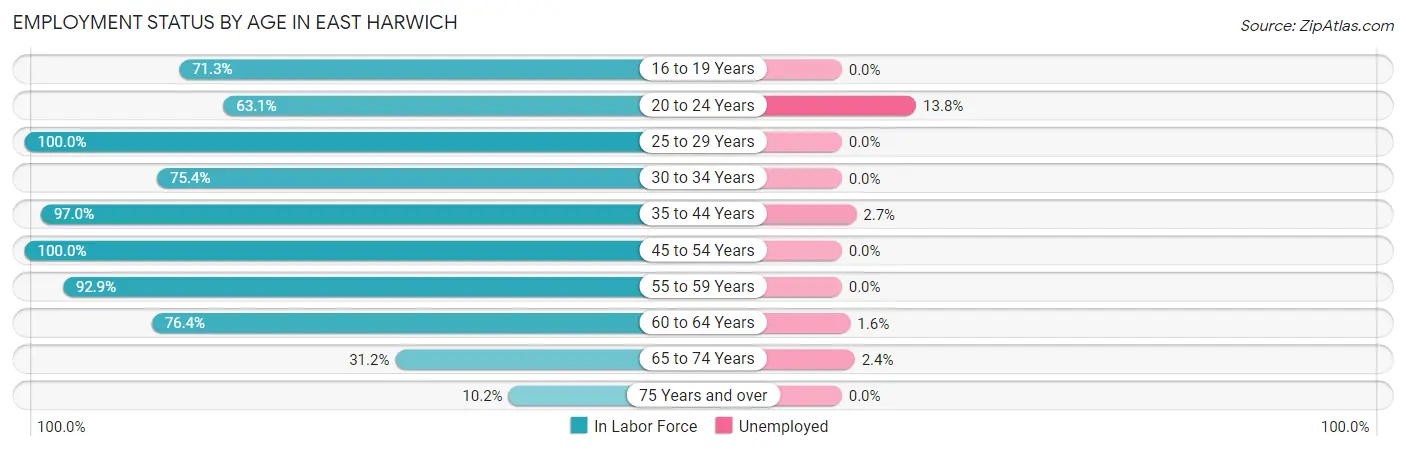
| Age Bracket | In Labor Force | Unemployed |
| 16 to 19 Years | 57 (71.3%) | 0 (0.0%) |
| 20 to 24 Years | 253 (63.1%) | 35 (13.8%) |
| 25 to 29 Years | 81 (100.0%) | 0 (0.0%) |
| 30 to 34 Years | 181 (75.4%) | 0 (0.0%) |
| 35 to 44 Years | 745 (97.0%) | 20 (2.7%) |
| 45 to 54 Years | 274 (100.0%) | 0 (0.0%) |
| 55 to 59 Years | 501 (92.9%) | 0 (0.0%) |
| 60 to 64 Years | 621 (76.4%) | 10 (1.6%) |
| 65 to 74 Years | 416 (31.2%) | 10 (2.4%) |
| 75 Years and over | 58 (10.2%) | 0 (0.0%) |
| Total | 3,187 (62.5%) | 76 (2.4%) |
Employment Status by Educational Attainment in East Harwich
According to labor force statistics for East Harwich, 88.5% of individuals (2,403) out of the total population between 25 and 64 years of age (2,715) are in the labor force, with 1.2% or 29 of them being unemployed. The group with the highest labor force participation rate are those with the educational attainment of college / associate degree, with 90.2% or 849 individuals in the labor force. Within the labor force, individuals with bachelor's degree or higher education have the highest percentage of unemployment, with 2.2% or 20 of them being unemployed.
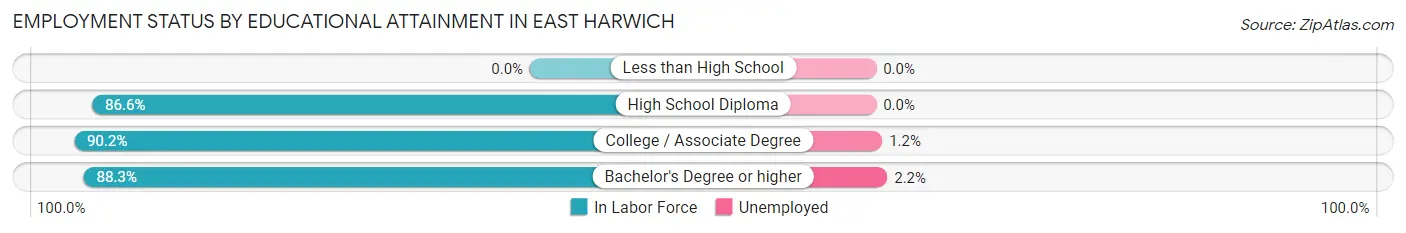
| Educational Attainment | In Labor Force | Unemployed |
| Less than High School | 0 (0.0%) | 0 (0.0%) |
| High School Diploma | 660 (86.6%) | 0 (0.0%) |
| College / Associate Degree | 849 (90.2%) | 11 (1.2%) |
| Bachelor's Degree or higher | 894 (88.3%) | 22 (2.2%) |
| Total | 2,403 (88.5%) | 33 (1.2%) |
Employment Occupations by Sex in East Harwich
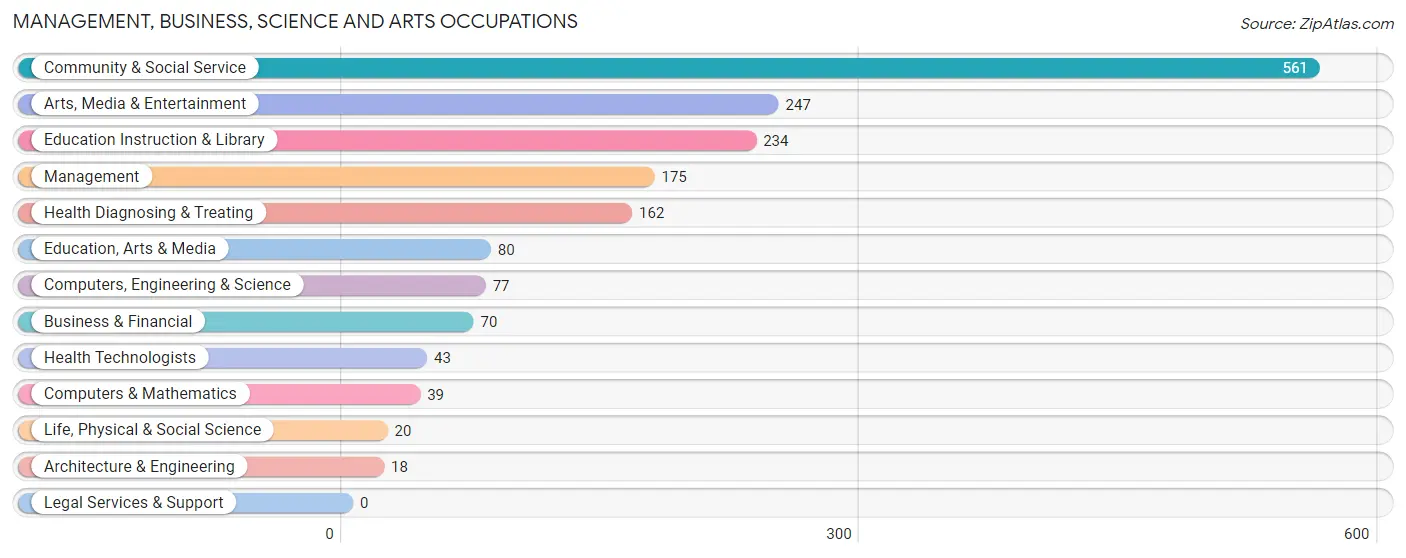
Management, Business, Science and Arts Occupations
The most common Management, Business, Science and Arts occupations in East Harwich are Community & Social Service (561 | 18.0%), Arts, Media & Entertainment (247 | 7.9%), Education Instruction & Library (234 | 7.5%), Management (175 | 5.6%), and Health Diagnosing & Treating (162 | 5.2%).
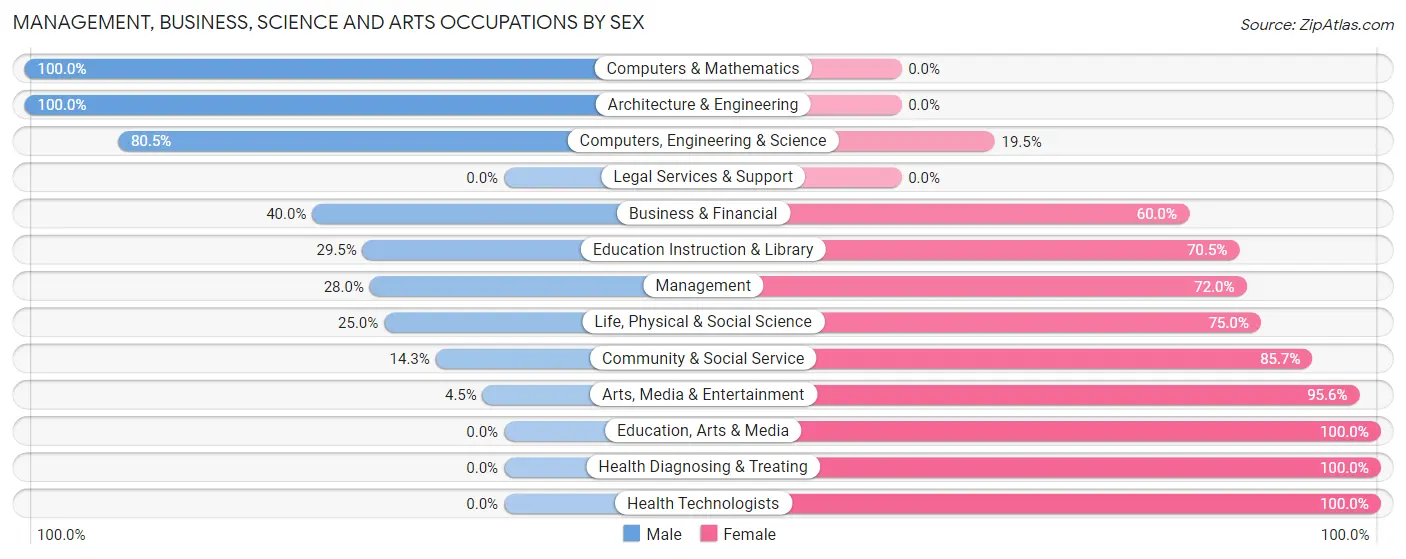
Management, Business, Science and Arts Occupations by Sex
Within the Management, Business, Science and Arts occupations in East Harwich, the most male-oriented occupations are Computers & Mathematics (100.0%), Architecture & Engineering (100.0%), and Computers, Engineering & Science (80.5%), while the most female-oriented occupations are Education, Arts & Media (100.0%), Health Diagnosing & Treating (100.0%), and Health Technologists (100.0%).
| Occupation | Male | Female |
| Management | 49 (28.0%) | 126 (72.0%) |
| Business & Financial | 28 (40.0%) | 42 (60.0%) |
| Computers, Engineering & Science | 62 (80.5%) | 15 (19.5%) |
| Computers & Mathematics | 39 (100.0%) | 0 (0.0%) |
| Architecture & Engineering | 18 (100.0%) | 0 (0.0%) |
| Life, Physical & Social Science | 5 (25.0%) | 15 (75.0%) |
| Community & Social Service | 80 (14.3%) | 481 (85.7%) |
| Education, Arts & Media | 0 (0.0%) | 80 (100.0%) |
| Legal Services & Support | 0 (0.0%) | 0 (0.0%) |
| Education Instruction & Library | 69 (29.5%) | 165 (70.5%) |
| Arts, Media & Entertainment | 11 (4.4%) | 236 (95.6%) |
| Health Diagnosing & Treating | 0 (0.0%) | 162 (100.0%) |
| Health Technologists | 0 (0.0%) | 43 (100.0%) |
| Total (Category) | 219 (21.0%) | 826 (79.0%) |
| Total (Overall) | 1,524 (49.0%) | 1,588 (51.0%) |
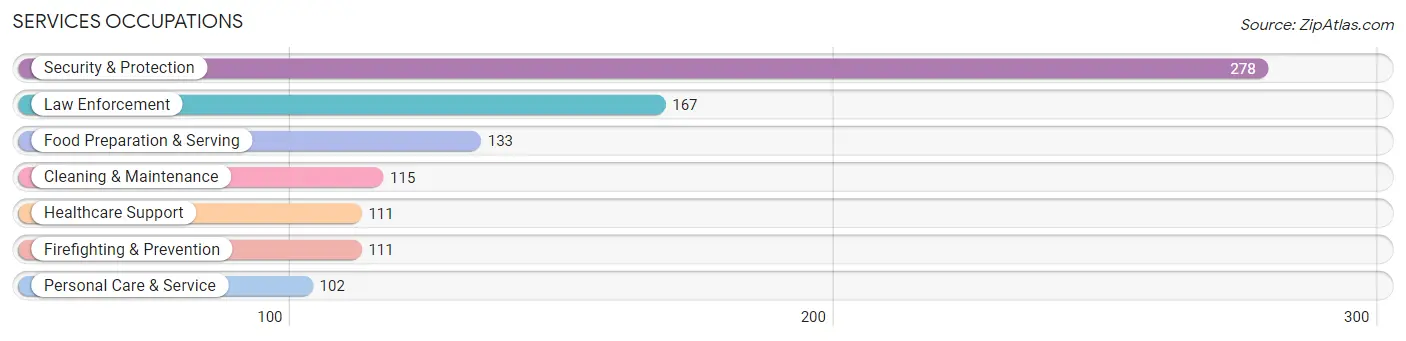
Services Occupations
The most common Services occupations in East Harwich are Security & Protection (278 | 8.9%), Law Enforcement (167 | 5.4%), Food Preparation & Serving (133 | 4.3%), Cleaning & Maintenance (115 | 3.7%), and Healthcare Support (111 | 3.6%).
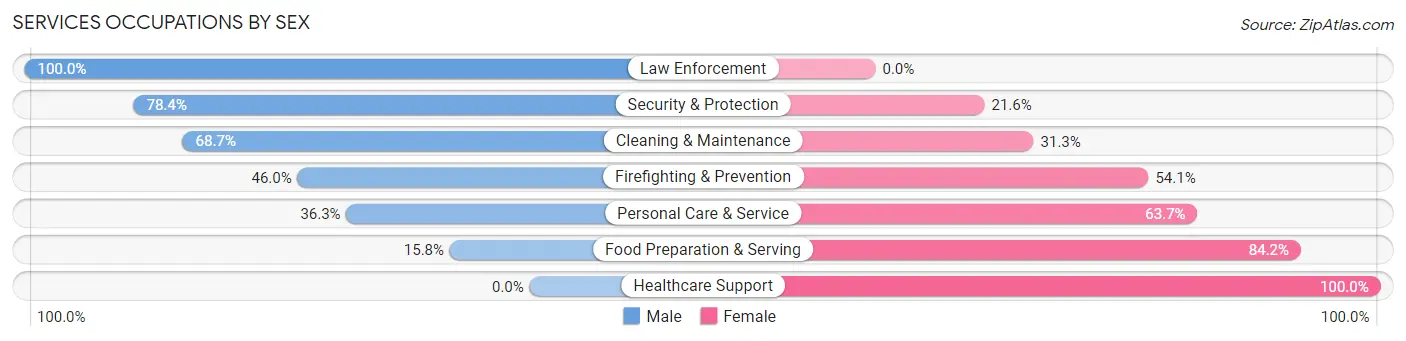
Services Occupations by Sex
Within the Services occupations in East Harwich, the most male-oriented occupations are Law Enforcement (100.0%), Security & Protection (78.4%), and Cleaning & Maintenance (68.7%), while the most female-oriented occupations are Healthcare Support (100.0%), Food Preparation & Serving (84.2%), and Personal Care & Service (63.7%).
| Occupation | Male | Female |
| Healthcare Support | 0 (0.0%) | 111 (100.0%) |
| Security & Protection | 218 (78.4%) | 60 (21.6%) |
| Firefighting & Prevention | 51 (46.0%) | 60 (54.0%) |
| Law Enforcement | 167 (100.0%) | 0 (0.0%) |
| Food Preparation & Serving | 21 (15.8%) | 112 (84.2%) |
| Cleaning & Maintenance | 79 (68.7%) | 36 (31.3%) |
| Personal Care & Service | 37 (36.3%) | 65 (63.7%) |
| Total (Category) | 355 (48.0%) | 384 (52.0%) |
| Total (Overall) | 1,524 (49.0%) | 1,588 (51.0%) |
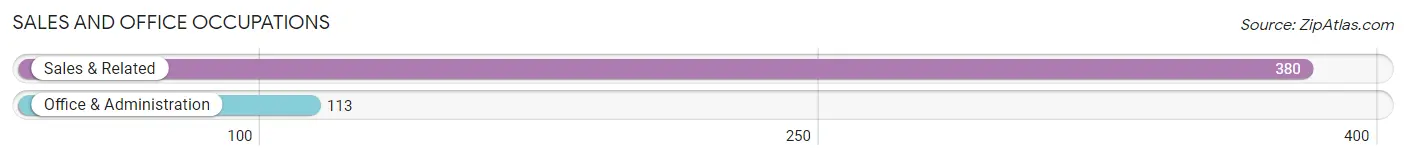
Sales and Office Occupations
The most common Sales and Office occupations in East Harwich are Sales & Related (380 | 12.2%), and Office & Administration (113 | 3.6%).
Sales and Office Occupations by Sex
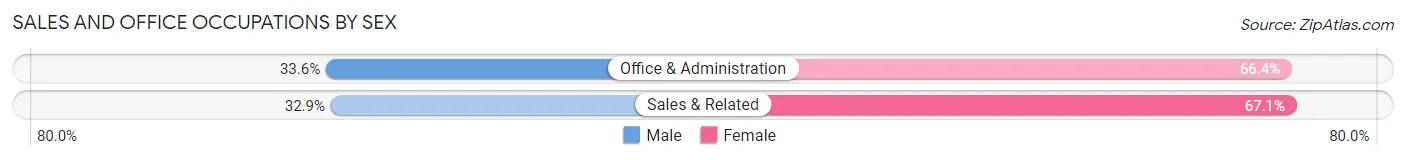
| Occupation | Male | Female |
| Sales & Related | 125 (32.9%) | 255 (67.1%) |
| Office & Administration | 38 (33.6%) | 75 (66.4%) |
| Total (Category) | 163 (33.1%) | 330 (66.9%) |
| Total (Overall) | 1,524 (49.0%) | 1,588 (51.0%) |
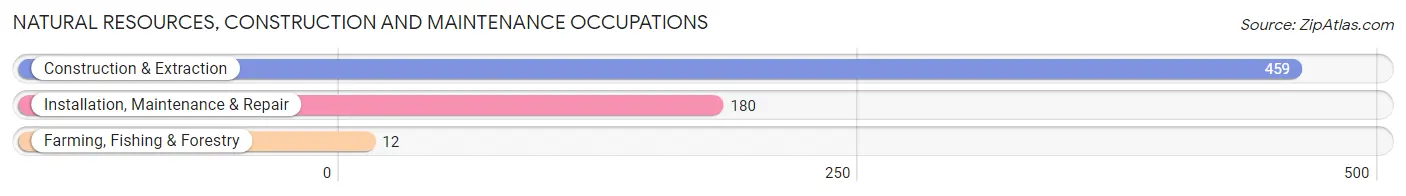
Natural Resources, Construction and Maintenance Occupations
The most common Natural Resources, Construction and Maintenance occupations in East Harwich are Construction & Extraction (459 | 14.7%), Installation, Maintenance & Repair (180 | 5.8%), and Farming, Fishing & Forestry (12 | 0.4%).
Natural Resources, Construction and Maintenance Occupations by Sex
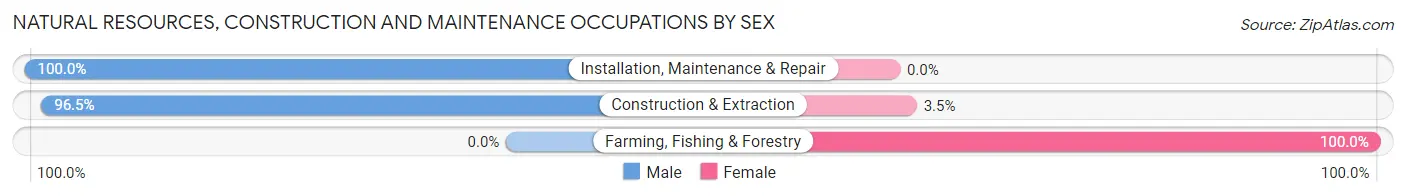
| Occupation | Male | Female |
| Farming, Fishing & Forestry | 0 (0.0%) | 12 (100.0%) |
| Construction & Extraction | 443 (96.5%) | 16 (3.5%) |
| Installation, Maintenance & Repair | 180 (100.0%) | 0 (0.0%) |
| Total (Category) | 623 (95.7%) | 28 (4.3%) |
| Total (Overall) | 1,524 (49.0%) | 1,588 (51.0%) |
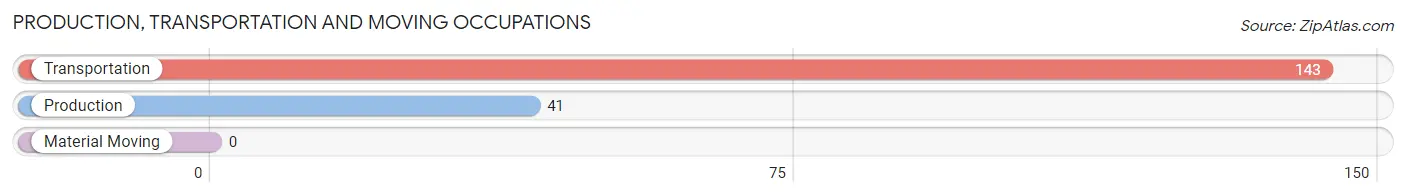
Production, Transportation and Moving Occupations
The most common Production, Transportation and Moving occupations in East Harwich are Transportation (143 | 4.6%), and Production (41 | 1.3%).
Production, Transportation and Moving Occupations by Sex
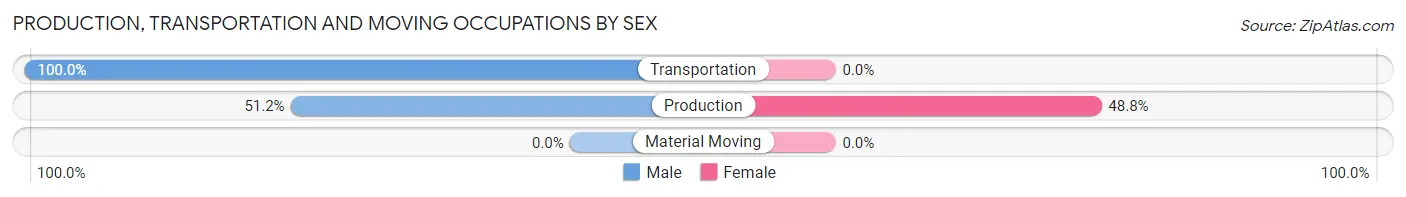
| Occupation | Male | Female |
| Production | 21 (51.2%) | 20 (48.8%) |
| Transportation | 143 (100.0%) | 0 (0.0%) |
| Material Moving | 0 (0.0%) | 0 (0.0%) |
| Total (Category) | 164 (89.1%) | 20 (10.9%) |
| Total (Overall) | 1,524 (49.0%) | 1,588 (51.0%) |
Employment Industries by Sex in East Harwich
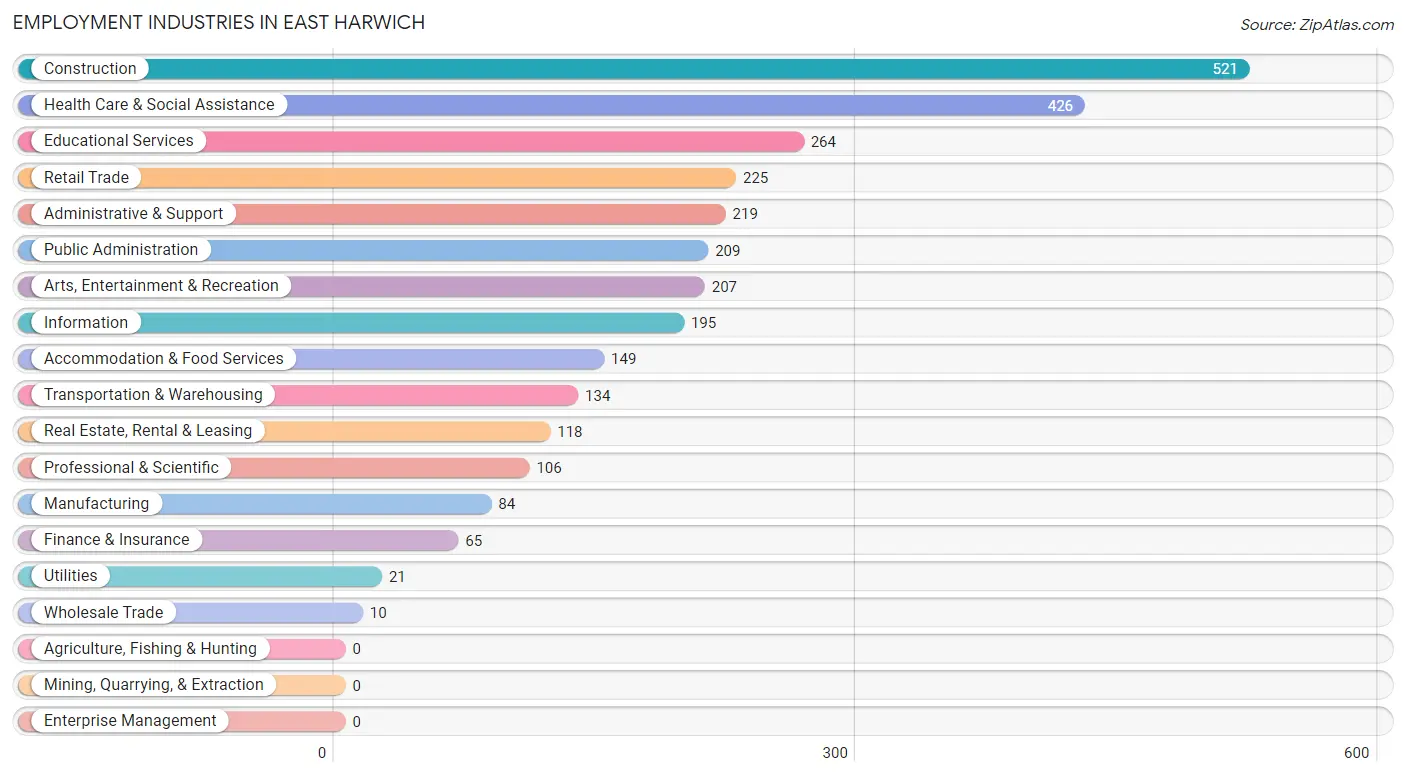
Employment Industries in East Harwich
The major employment industries in East Harwich include Construction (521 | 16.7%), Health Care & Social Assistance (426 | 13.7%), Educational Services (264 | 8.5%), Retail Trade (225 | 7.2%), and Administrative & Support (219 | 7.0%).
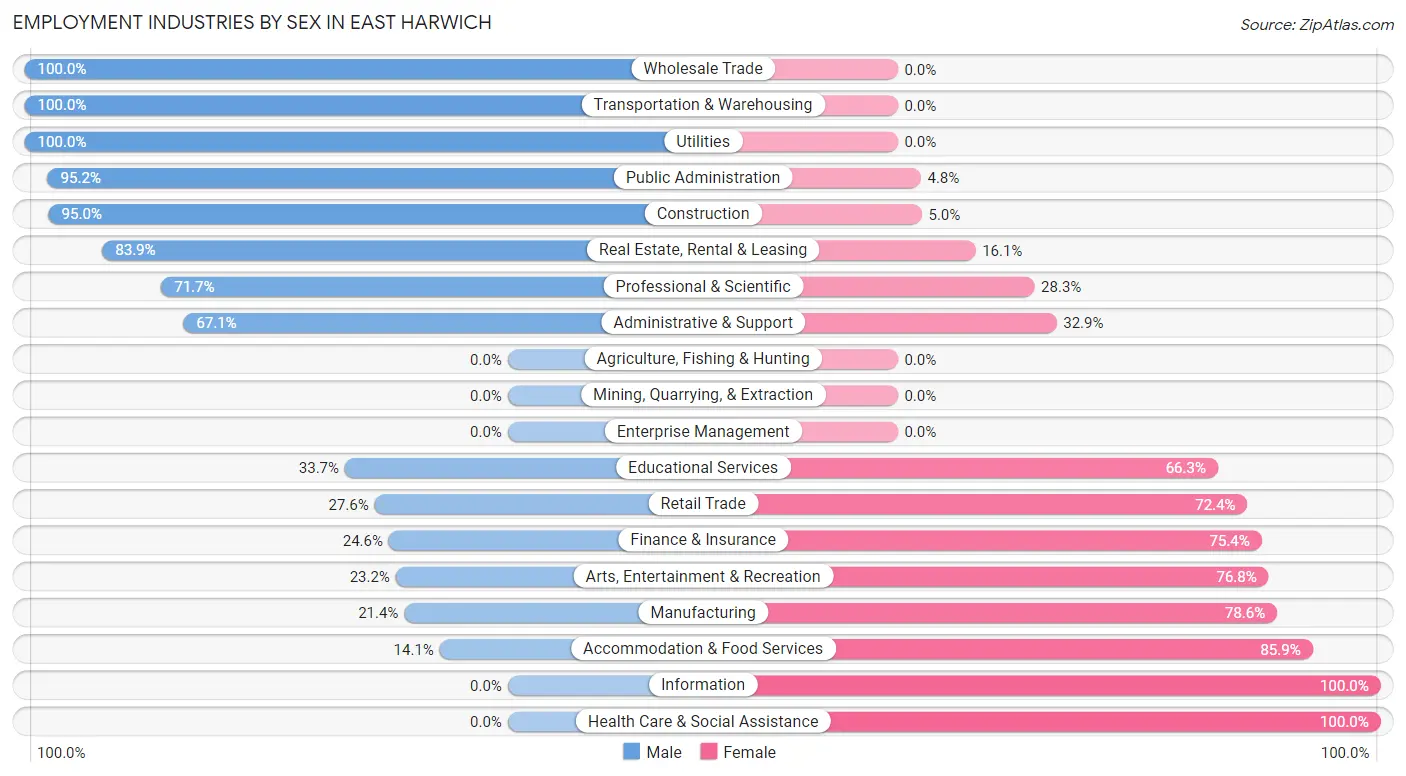
Employment Industries by Sex in East Harwich
The East Harwich industries that see more men than women are Wholesale Trade (100.0%), Transportation & Warehousing (100.0%), and Utilities (100.0%), whereas the industries that tend to have a higher number of women are Information (100.0%), Health Care & Social Assistance (100.0%), and Accommodation & Food Services (85.9%).
| Industry | Male | Female |
| Agriculture, Fishing & Hunting | 0 (0.0%) | 0 (0.0%) |
| Mining, Quarrying, & Extraction | 0 (0.0%) | 0 (0.0%) |
| Construction | 495 (95.0%) | 26 (5.0%) |
| Manufacturing | 18 (21.4%) | 66 (78.6%) |
| Wholesale Trade | 10 (100.0%) | 0 (0.0%) |
| Retail Trade | 62 (27.6%) | 163 (72.4%) |
| Transportation & Warehousing | 134 (100.0%) | 0 (0.0%) |
| Utilities | 21 (100.0%) | 0 (0.0%) |
| Information | 0 (0.0%) | 195 (100.0%) |
| Finance & Insurance | 16 (24.6%) | 49 (75.4%) |
| Real Estate, Rental & Leasing | 99 (83.9%) | 19 (16.1%) |
| Professional & Scientific | 76 (71.7%) | 30 (28.3%) |
| Enterprise Management | 0 (0.0%) | 0 (0.0%) |
| Administrative & Support | 147 (67.1%) | 72 (32.9%) |
| Educational Services | 89 (33.7%) | 175 (66.3%) |
| Health Care & Social Assistance | 0 (0.0%) | 426 (100.0%) |
| Arts, Entertainment & Recreation | 48 (23.2%) | 159 (76.8%) |
| Accommodation & Food Services | 21 (14.1%) | 128 (85.9%) |
| Public Administration | 199 (95.2%) | 10 (4.8%) |
| Total | 1,524 (49.0%) | 1,588 (51.0%) |
Education in East Harwich
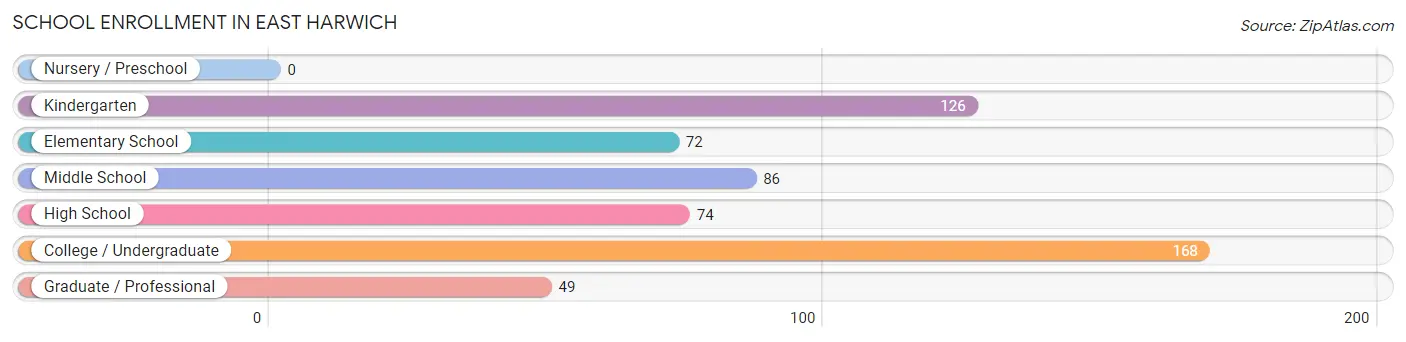
School Enrollment in East Harwich
The most common levels of schooling among the 575 students in East Harwich are college / undergraduate (168 | 29.2%), kindergarten (126 | 21.9%), and middle school (86 | 15.0%).
| School Level | # Students | % Students |
| Nursery / Preschool | 0 | 0.0% |
| Kindergarten | 126 | 21.9% |
| Elementary School | 72 | 12.5% |
| Middle School | 86 | 15.0% |
| High School | 74 | 12.9% |
| College / Undergraduate | 168 | 29.2% |
| Graduate / Professional | 49 | 8.5% |
| Total | 575 | 100.0% |
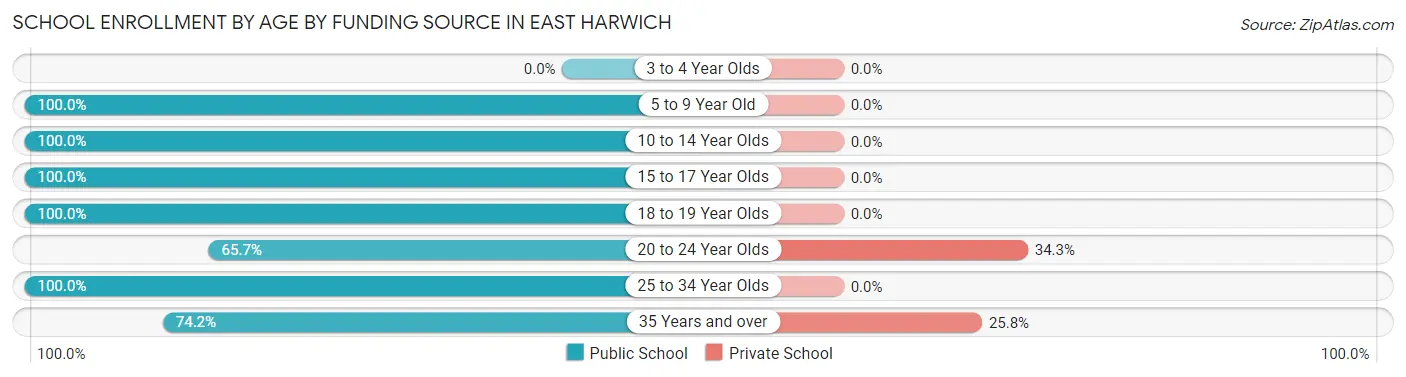
School Enrollment by Age by Funding Source in East Harwich
Out of a total of 575 students who are enrolled in schools in East Harwich, 53 (9.2%) attend a private institution, while the remaining 522 (90.8%) are enrolled in public schools. The age group of 20 to 24 year olds has the highest likelihood of being enrolled in private schools, with 36 (34.3% in the age bracket) enrolled. Conversely, the age group of 5 to 9 year old has the lowest likelihood of being enrolled in a private school, with 198 (100.0% in the age bracket) attending a public institution.
| Age Bracket | Public School | Private School |
| 3 to 4 Year Olds | 0 (0.0%) | 0 (0.0%) |
| 5 to 9 Year Old | 198 (100.0%) | 0 (0.0%) |
| 10 to 14 Year Olds | 101 (100.0%) | 0 (0.0%) |
| 15 to 17 Year Olds | 35 (100.0%) | 0 (0.0%) |
| 18 to 19 Year Olds | 45 (100.0%) | 0 (0.0%) |
| 20 to 24 Year Olds | 69 (65.7%) | 36 (34.3%) |
| 25 to 34 Year Olds | 25 (100.0%) | 0 (0.0%) |
| 35 Years and over | 49 (74.2%) | 17 (25.8%) |
| Total | 522 (90.8%) | 53 (9.2%) |
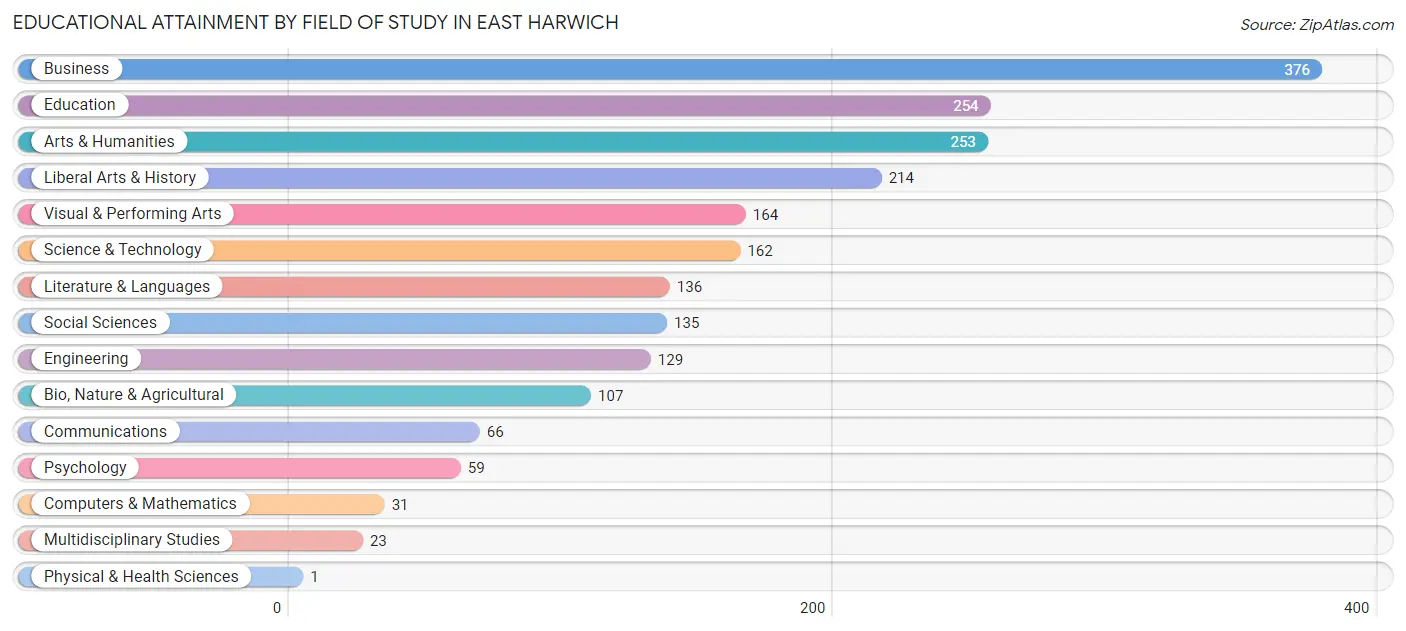
Educational Attainment by Field of Study in East Harwich
Business (376 | 17.8%), education (254 | 12.0%), arts & humanities (253 | 12.0%), liberal arts & history (214 | 10.1%), and visual & performing arts (164 | 7.8%) are the most common fields of study among 2,110 individuals in East Harwich who have obtained a bachelor's degree or higher.
| Field of Study | # Graduates | % Graduates |
| Computers & Mathematics | 31 | 1.5% |
| Bio, Nature & Agricultural | 107 | 5.1% |
| Physical & Health Sciences | 1 | 0.1% |
| Psychology | 59 | 2.8% |
| Social Sciences | 135 | 6.4% |
| Engineering | 129 | 6.1% |
| Multidisciplinary Studies | 23 | 1.1% |
| Science & Technology | 162 | 7.7% |
| Business | 376 | 17.8% |
| Education | 254 | 12.0% |
| Literature & Languages | 136 | 6.5% |
| Liberal Arts & History | 214 | 10.1% |
| Visual & Performing Arts | 164 | 7.8% |
| Communications | 66 | 3.1% |
| Arts & Humanities | 253 | 12.0% |
| Total | 2,110 | 100.0% |
Transportation & Commute in East Harwich
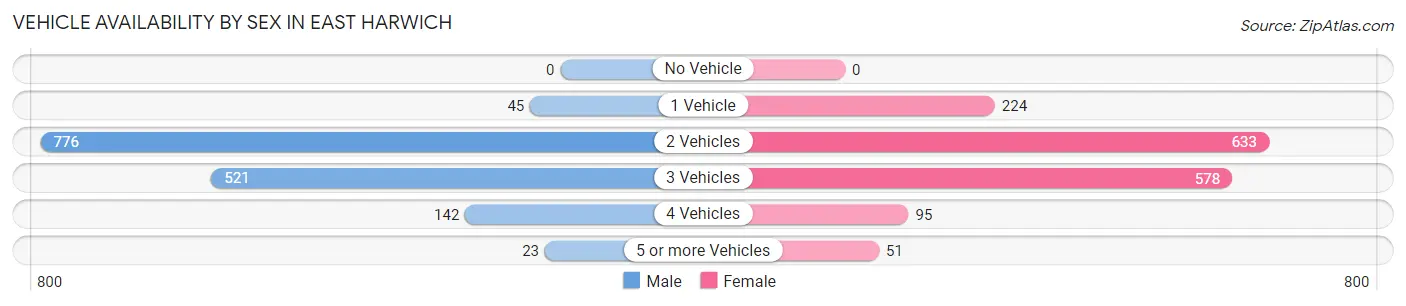
Vehicle Availability by Sex in East Harwich
The most prevalent vehicle ownership categories in East Harwich are males with 2 vehicles (776, accounting for 51.5%) and females with 2 vehicles (633, making up 49.1%).
| Vehicles Available | Male | Female |
| No Vehicle | 0 (0.0%) | 0 (0.0%) |
| 1 Vehicle | 45 (3.0%) | 224 (14.2%) |
| 2 Vehicles | 776 (51.5%) | 633 (40.0%) |
| 3 Vehicles | 521 (34.6%) | 578 (36.6%) |
| 4 Vehicles | 142 (9.4%) | 95 (6.0%) |
| 5 or more Vehicles | 23 (1.5%) | 51 (3.2%) |
| Total | 1,507 (100.0%) | 1,581 (100.0%) |
Commute Time in East Harwich
The most frequently occuring commute durations in East Harwich are 10 to 14 minutes (718 commuters, 25.6%), 15 to 19 minutes (532 commuters, 19.0%), and 20 to 24 minutes (510 commuters, 18.2%).
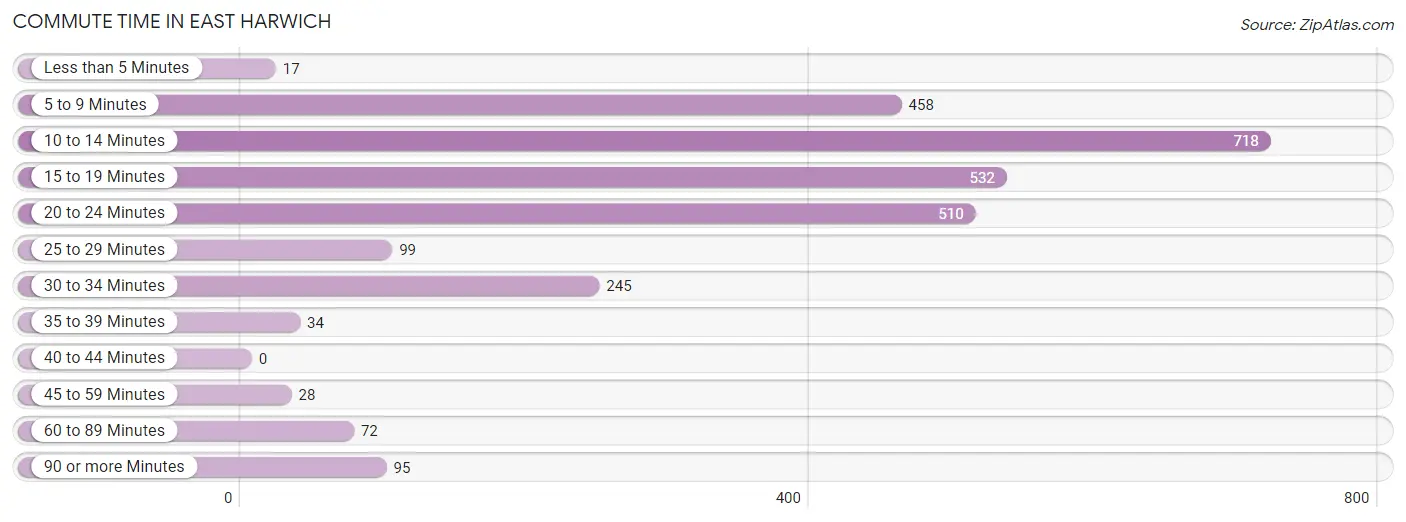
| Commute Time | # Commuters | % Commuters |
| Less than 5 Minutes | 17 | 0.6% |
| 5 to 9 Minutes | 458 | 16.3% |
| 10 to 14 Minutes | 718 | 25.6% |
| 15 to 19 Minutes | 532 | 19.0% |
| 20 to 24 Minutes | 510 | 18.2% |
| 25 to 29 Minutes | 99 | 3.5% |
| 30 to 34 Minutes | 245 | 8.7% |
| 35 to 39 Minutes | 34 | 1.2% |
| 40 to 44 Minutes | 0 | 0.0% |
| 45 to 59 Minutes | 28 | 1.0% |
| 60 to 89 Minutes | 72 | 2.6% |
| 90 or more Minutes | 95 | 3.4% |
Commute Time by Sex in East Harwich
The most common commute times in East Harwich are 20 to 24 minutes (419 commuters, 29.0%) for males and 10 to 14 minutes (406 commuters, 29.7%) for females.
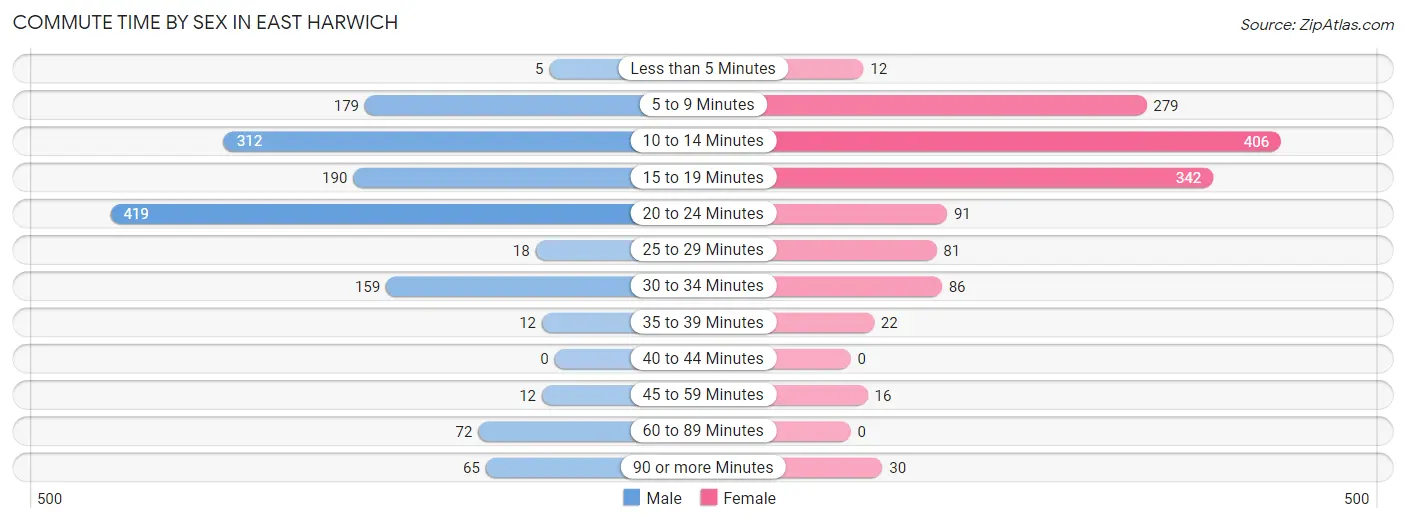
| Commute Time | Male | Female |
| Less than 5 Minutes | 5 (0.4%) | 12 (0.9%) |
| 5 to 9 Minutes | 179 (12.4%) | 279 (20.4%) |
| 10 to 14 Minutes | 312 (21.6%) | 406 (29.7%) |
| 15 to 19 Minutes | 190 (13.2%) | 342 (25.1%) |
| 20 to 24 Minutes | 419 (29.0%) | 91 (6.7%) |
| 25 to 29 Minutes | 18 (1.3%) | 81 (5.9%) |
| 30 to 34 Minutes | 159 (11.0%) | 86 (6.3%) |
| 35 to 39 Minutes | 12 (0.8%) | 22 (1.6%) |
| 40 to 44 Minutes | 0 (0.0%) | 0 (0.0%) |
| 45 to 59 Minutes | 12 (0.8%) | 16 (1.2%) |
| 60 to 89 Minutes | 72 (5.0%) | 0 (0.0%) |
| 90 or more Minutes | 65 (4.5%) | 30 (2.2%) |
Time of Departure to Work by Sex in East Harwich
The most frequent times of departure to work in East Harwich are 7:00 AM to 7:29 AM (475, 32.9%) for males and 6:30 AM to 6:59 AM (283, 20.7%) for females.
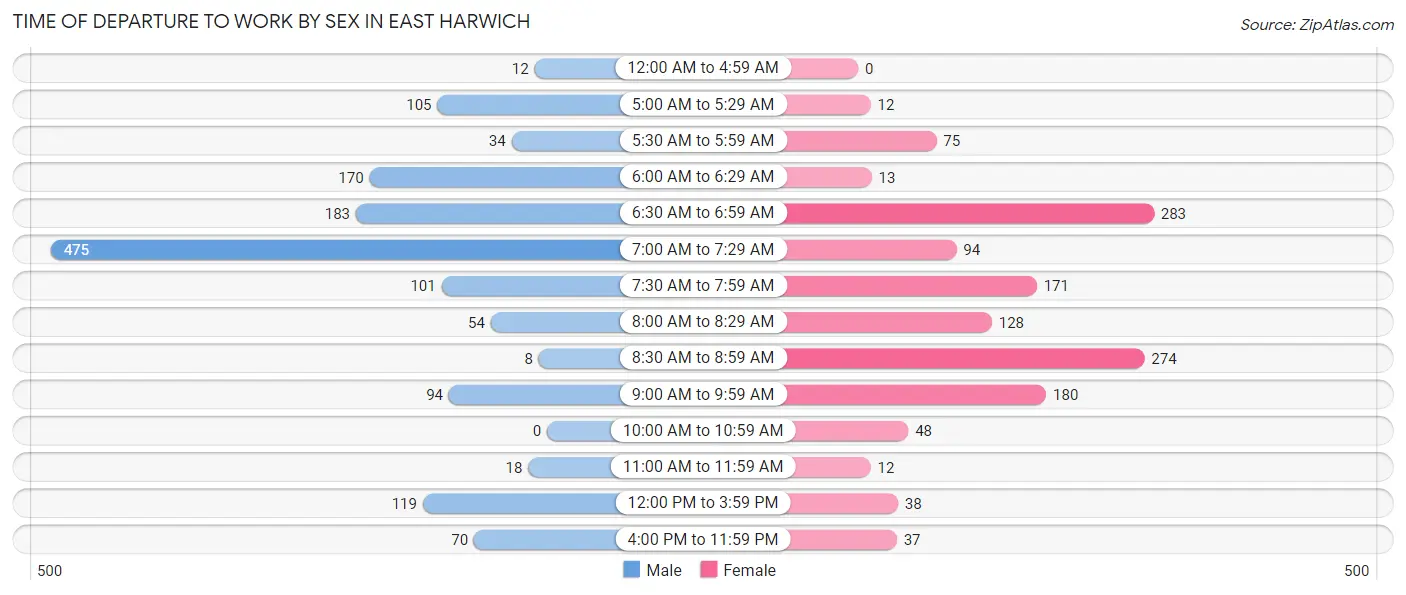
| Time of Departure | Male | Female |
| 12:00 AM to 4:59 AM | 12 (0.8%) | 0 (0.0%) |
| 5:00 AM to 5:29 AM | 105 (7.3%) | 12 (0.9%) |
| 5:30 AM to 5:59 AM | 34 (2.4%) | 75 (5.5%) |
| 6:00 AM to 6:29 AM | 170 (11.8%) | 13 (0.9%) |
| 6:30 AM to 6:59 AM | 183 (12.7%) | 283 (20.7%) |
| 7:00 AM to 7:29 AM | 475 (32.9%) | 94 (6.9%) |
| 7:30 AM to 7:59 AM | 101 (7.0%) | 171 (12.5%) |
| 8:00 AM to 8:29 AM | 54 (3.7%) | 128 (9.4%) |
| 8:30 AM to 8:59 AM | 8 (0.5%) | 274 (20.1%) |
| 9:00 AM to 9:59 AM | 94 (6.5%) | 180 (13.2%) |
| 10:00 AM to 10:59 AM | 0 (0.0%) | 48 (3.5%) |
| 11:00 AM to 11:59 AM | 18 (1.3%) | 12 (0.9%) |
| 12:00 PM to 3:59 PM | 119 (8.3%) | 38 (2.8%) |
| 4:00 PM to 11:59 PM | 70 (4.9%) | 37 (2.7%) |
| Total | 1,443 (100.0%) | 1,365 (100.0%) |
Housing Occupancy in East Harwich
Occupancy by Ownership in East Harwich
Of the total 2,463 dwellings in East Harwich, owner-occupied units account for 2,225 (90.3%), while renter-occupied units make up 238 (9.7%).
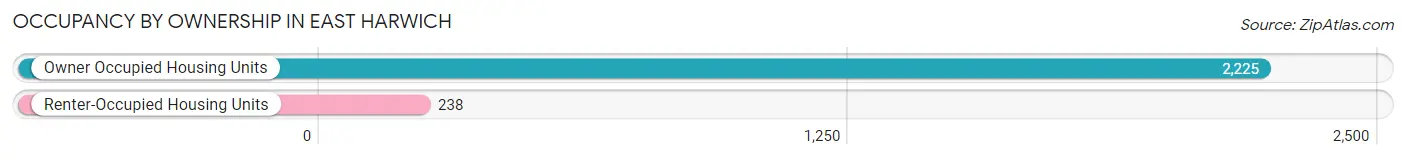
| Occupancy | # Housing Units | % Housing Units |
| Owner Occupied Housing Units | 2,225 | 90.3% |
| Renter-Occupied Housing Units | 238 | 9.7% |
| Total Occupied Housing Units | 2,463 | 100.0% |
Occupancy by Household Size in East Harwich
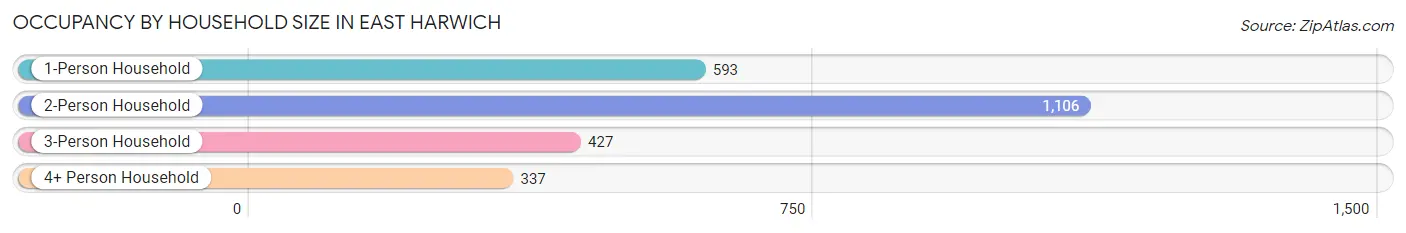
| Household Size | # Housing Units | % Housing Units |
| 1-Person Household | 593 | 24.1% |
| 2-Person Household | 1,106 | 44.9% |
| 3-Person Household | 427 | 17.3% |
| 4+ Person Household | 337 | 13.7% |
| Total Housing Units | 2,463 | 100.0% |
Occupancy by Ownership by Household Size in East Harwich
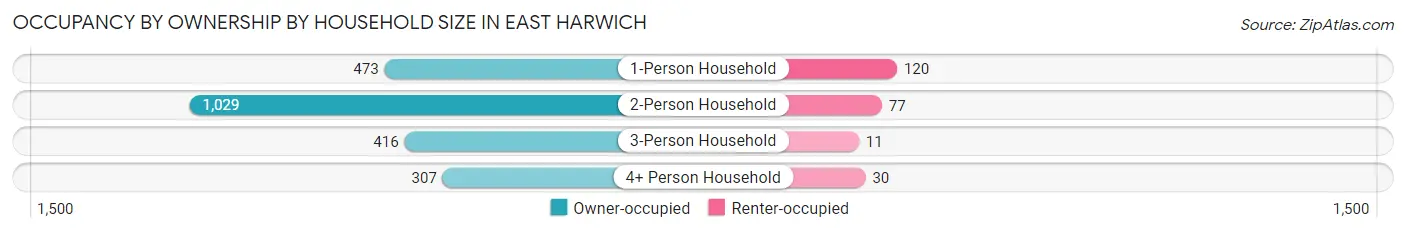
| Household Size | Owner-occupied | Renter-occupied |
| 1-Person Household | 473 (79.8%) | 120 (20.2%) |
| 2-Person Household | 1,029 (93.0%) | 77 (7.0%) |
| 3-Person Household | 416 (97.4%) | 11 (2.6%) |
| 4+ Person Household | 307 (91.1%) | 30 (8.9%) |
| Total Housing Units | 2,225 (90.3%) | 238 (9.7%) |
Occupancy by Educational Attainment in East Harwich
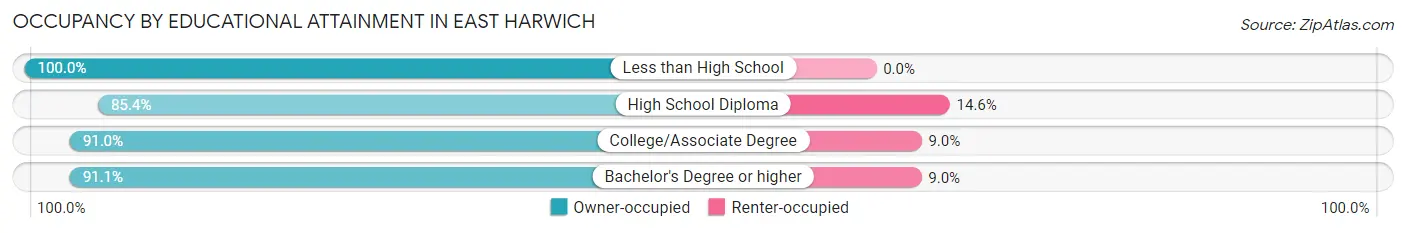
| Household Size | Owner-occupied | Renter-occupied |
| Less than High School | 39 (100.0%) | 0 (0.0%) |
| High School Diploma | 317 (85.4%) | 54 (14.6%) |
| College/Associate Degree | 770 (91.0%) | 76 (9.0%) |
| Bachelor's Degree or higher | 1,099 (91.0%) | 108 (8.9%) |
Occupancy by Age of Householder in East Harwich
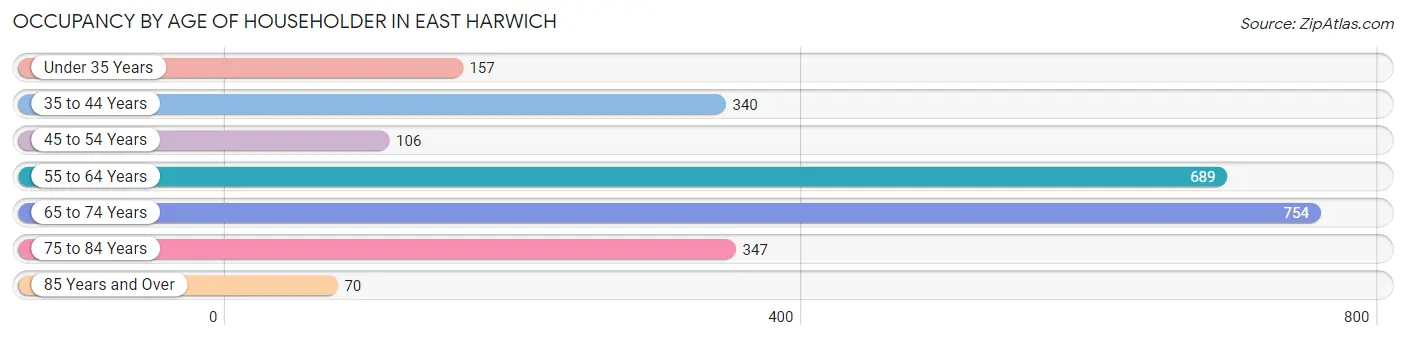
| Age Bracket | # Households | % Households |
| Under 35 Years | 157 | 6.4% |
| 35 to 44 Years | 340 | 13.8% |
| 45 to 54 Years | 106 | 4.3% |
| 55 to 64 Years | 689 | 28.0% |
| 65 to 74 Years | 754 | 30.6% |
| 75 to 84 Years | 347 | 14.1% |
| 85 Years and Over | 70 | 2.8% |
| Total | 2,463 | 100.0% |
Housing Finances in East Harwich
Median Income by Occupancy in East Harwich
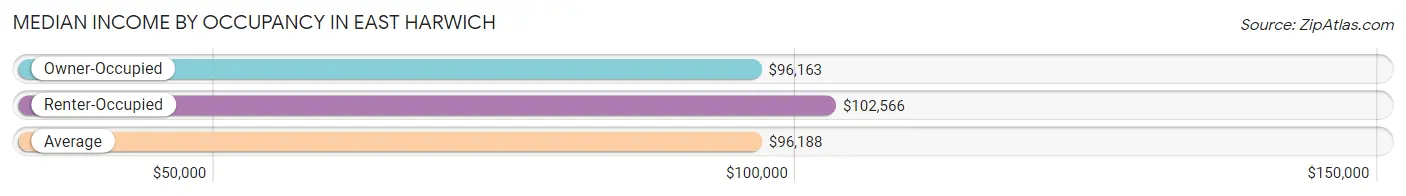
| Occupancy Type | # Households | Median Income |
| Owner-Occupied | 2,225 (90.3%) | $96,163 |
| Renter-Occupied | 238 (9.7%) | $102,566 |
| Average | 2,463 (100.0%) | $96,188 |
Occupancy by Householder Income Bracket in East Harwich
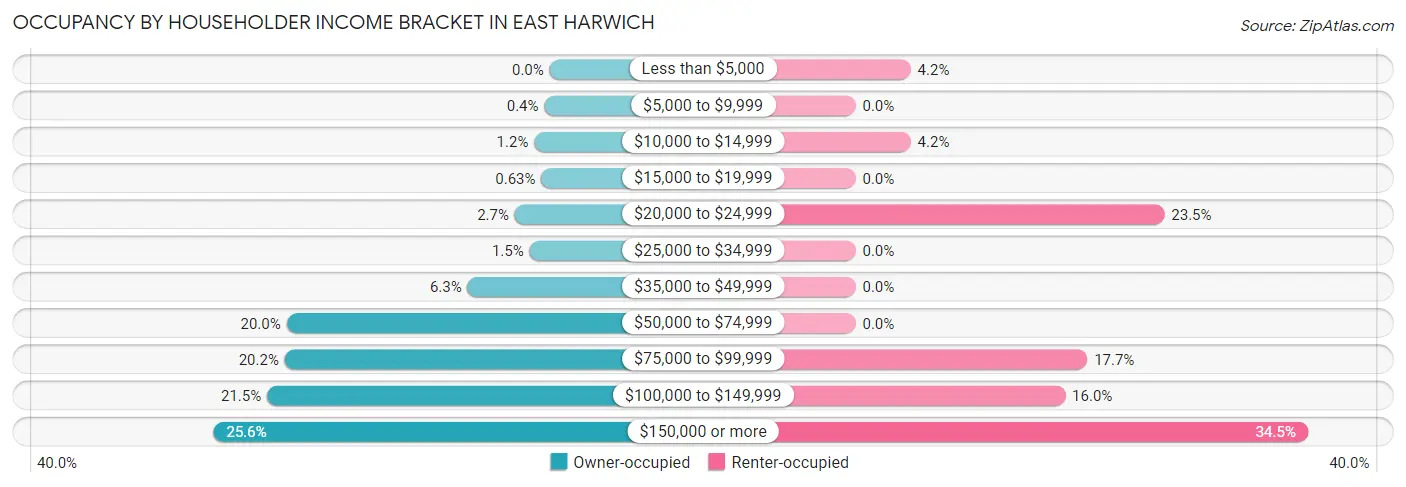
| Income Bracket | Owner-occupied | Renter-occupied |
| Less than $5,000 | 0 (0.0%) | 10 (4.2%) |
| $5,000 to $9,999 | 9 (0.4%) | 0 (0.0%) |
| $10,000 to $14,999 | 26 (1.2%) | 10 (4.2%) |
| $15,000 to $19,999 | 14 (0.6%) | 0 (0.0%) |
| $20,000 to $24,999 | 59 (2.6%) | 56 (23.5%) |
| $25,000 to $34,999 | 34 (1.5%) | 0 (0.0%) |
| $35,000 to $49,999 | 139 (6.2%) | 0 (0.0%) |
| $50,000 to $74,999 | 446 (20.0%) | 0 (0.0%) |
| $75,000 to $99,999 | 449 (20.2%) | 42 (17.6%) |
| $100,000 to $149,999 | 479 (21.5%) | 38 (16.0%) |
| $150,000 or more | 570 (25.6%) | 82 (34.4%) |
| Total | 2,225 (100.0%) | 238 (100.0%) |
Monthly Housing Cost Tiers in East Harwich
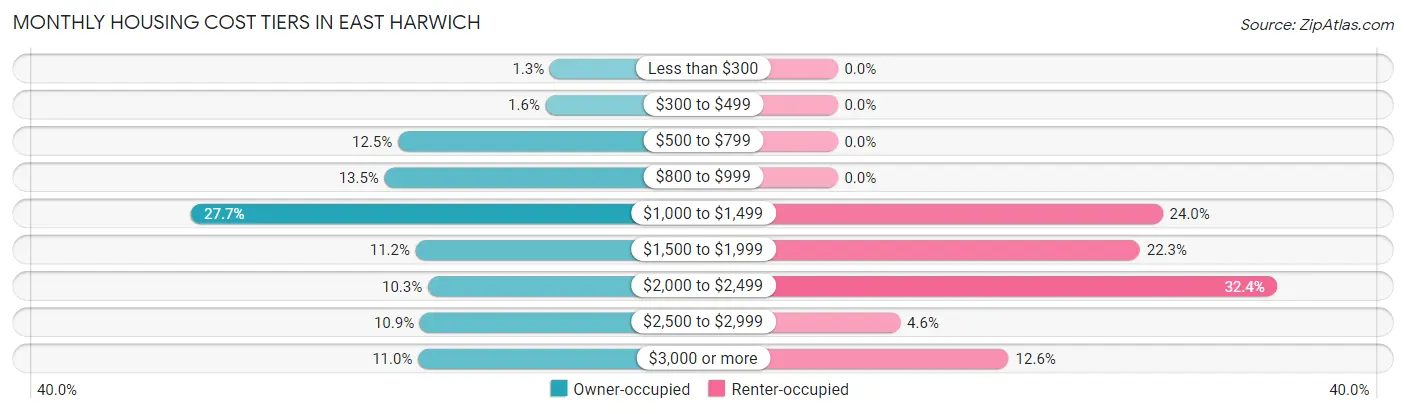
| Monthly Cost | Owner-occupied | Renter-occupied |
| Less than $300 | 29 (1.3%) | 0 (0.0%) |
| $300 to $499 | 36 (1.6%) | 0 (0.0%) |
| $500 to $799 | 278 (12.5%) | 0 (0.0%) |
| $800 to $999 | 300 (13.5%) | 0 (0.0%) |
| $1,000 to $1,499 | 617 (27.7%) | 57 (23.9%) |
| $1,500 to $1,999 | 249 (11.2%) | 53 (22.3%) |
| $2,000 to $2,499 | 229 (10.3%) | 77 (32.4%) |
| $2,500 to $2,999 | 242 (10.9%) | 11 (4.6%) |
| $3,000 or more | 245 (11.0%) | 30 (12.6%) |
| Total | 2,225 (100.0%) | 238 (100.0%) |
Physical Housing Characteristics in East Harwich
Housing Structures in East Harwich
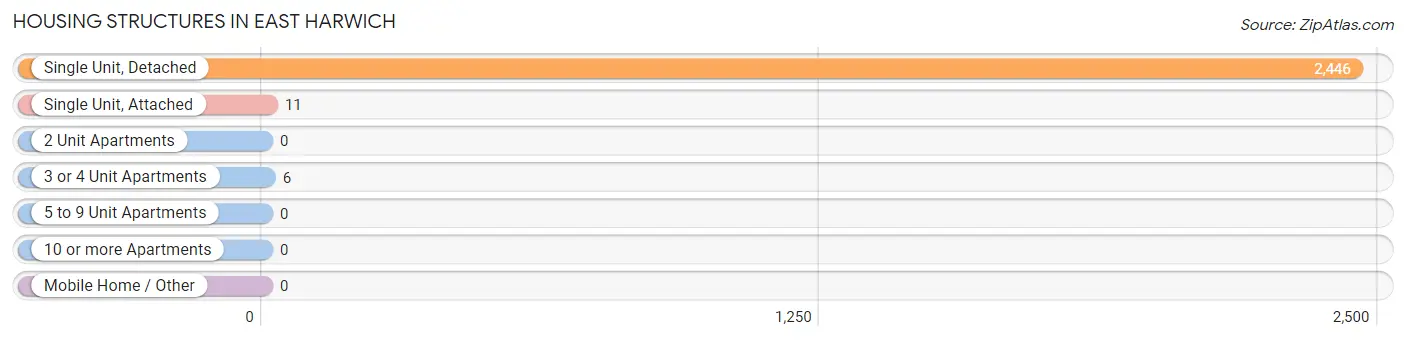
| Structure Type | # Housing Units | % Housing Units |
| Single Unit, Detached | 2,446 | 99.3% |
| Single Unit, Attached | 11 | 0.4% |
| 2 Unit Apartments | 0 | 0.0% |
| 3 or 4 Unit Apartments | 6 | 0.2% |
| 5 to 9 Unit Apartments | 0 | 0.0% |
| 10 or more Apartments | 0 | 0.0% |
| Mobile Home / Other | 0 | 0.0% |
| Total | 2,463 | 100.0% |
Housing Structures by Occupancy in East Harwich
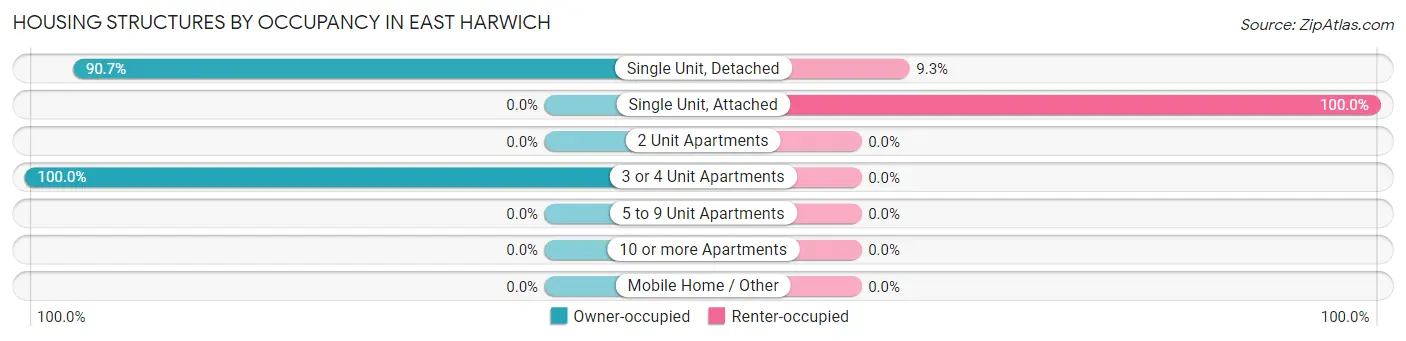
| Structure Type | Owner-occupied | Renter-occupied |
| Single Unit, Detached | 2,219 (90.7%) | 227 (9.3%) |
| Single Unit, Attached | 0 (0.0%) | 11 (100.0%) |
| 2 Unit Apartments | 0 (0.0%) | 0 (0.0%) |
| 3 or 4 Unit Apartments | 6 (100.0%) | 0 (0.0%) |
| 5 to 9 Unit Apartments | 0 (0.0%) | 0 (0.0%) |
| 10 or more Apartments | 0 (0.0%) | 0 (0.0%) |
| Mobile Home / Other | 0 (0.0%) | 0 (0.0%) |
| Total | 2,225 (90.3%) | 238 (9.7%) |
Housing Structures by Number of Rooms in East Harwich
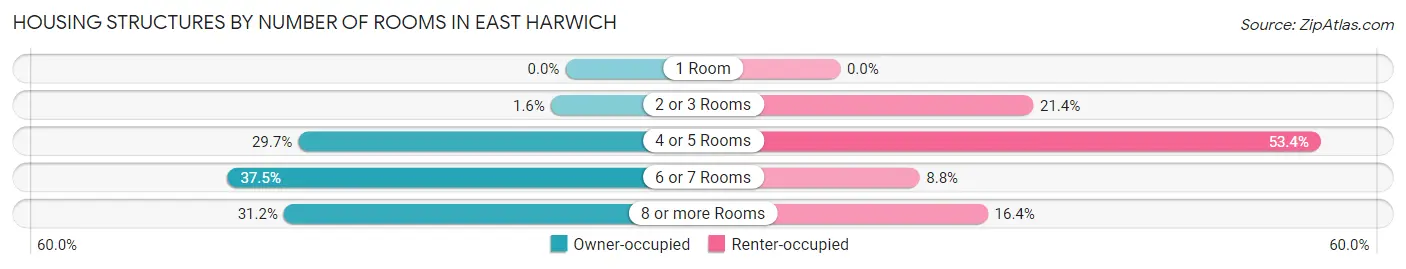
| Number of Rooms | Owner-occupied | Renter-occupied |
| 1 Room | 0 (0.0%) | 0 (0.0%) |
| 2 or 3 Rooms | 36 (1.6%) | 51 (21.4%) |
| 4 or 5 Rooms | 660 (29.7%) | 127 (53.4%) |
| 6 or 7 Rooms | 834 (37.5%) | 21 (8.8%) |
| 8 or more Rooms | 695 (31.2%) | 39 (16.4%) |
| Total | 2,225 (100.0%) | 238 (100.0%) |
Housing Structure by Heating Type in East Harwich
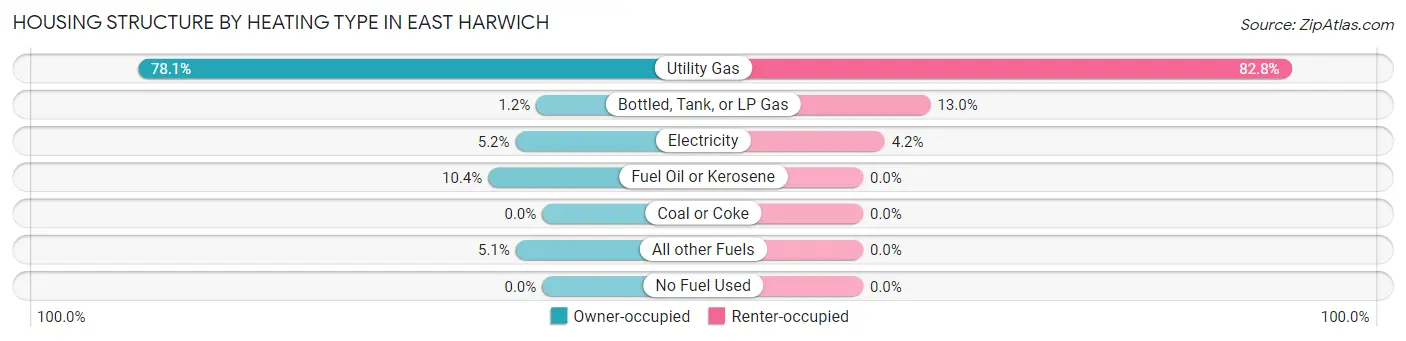
| Heating Type | Owner-occupied | Renter-occupied |
| Utility Gas | 1,738 (78.1%) | 197 (82.8%) |
| Bottled, Tank, or LP Gas | 26 (1.2%) | 31 (13.0%) |
| Electricity | 115 (5.2%) | 10 (4.2%) |
| Fuel Oil or Kerosene | 232 (10.4%) | 0 (0.0%) |
| Coal or Coke | 0 (0.0%) | 0 (0.0%) |
| All other Fuels | 114 (5.1%) | 0 (0.0%) |
| No Fuel Used | 0 (0.0%) | 0 (0.0%) |
| Total | 2,225 (100.0%) | 238 (100.0%) |
Household Vehicle Usage in East Harwich
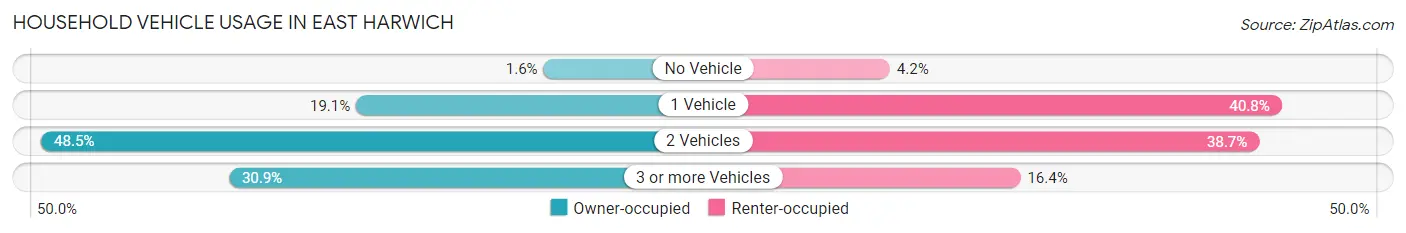
| Vehicles per Household | Owner-occupied | Renter-occupied |
| No Vehicle | 35 (1.6%) | 10 (4.2%) |
| 1 Vehicle | 424 (19.1%) | 97 (40.8%) |
| 2 Vehicles | 1,078 (48.4%) | 92 (38.7%) |
| 3 or more Vehicles | 688 (30.9%) | 39 (16.4%) |
| Total | 2,225 (100.0%) | 238 (100.0%) |
Real Estate & Mortgages in East Harwich
Real Estate and Mortgage Overview in East Harwich
| Characteristic | Without Mortgage | With Mortgage |
| Housing Units | 765 | 1,460 |
| Median Property Value | $588,100 | $568,400 |
| Median Household Income | $71,696 | $548 |
| Monthly Housing Costs | $871 | $245 |
| Real Estate Taxes | $4,307 | $14 |
Property Value by Mortgage Status in East Harwich
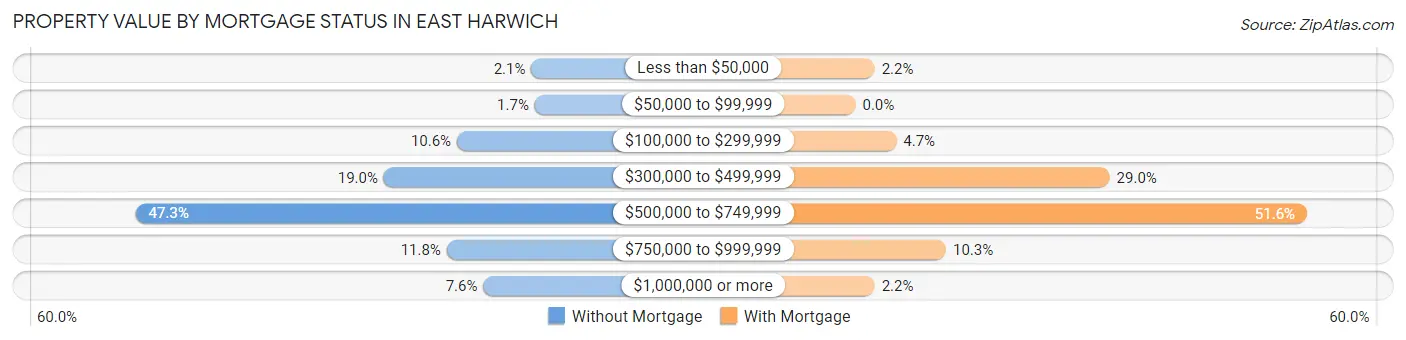
| Property Value | Without Mortgage | With Mortgage |
| Less than $50,000 | 16 (2.1%) | 32 (2.2%) |
| $50,000 to $99,999 | 13 (1.7%) | 0 (0.0%) |
| $100,000 to $299,999 | 81 (10.6%) | 68 (4.7%) |
| $300,000 to $499,999 | 145 (19.0%) | 424 (29.0%) |
| $500,000 to $749,999 | 362 (47.3%) | 753 (51.6%) |
| $750,000 to $999,999 | 90 (11.8%) | 151 (10.3%) |
| $1,000,000 or more | 58 (7.6%) | 32 (2.2%) |
| Total | 765 (100.0%) | 1,460 (100.0%) |
Household Income by Mortgage Status in East Harwich
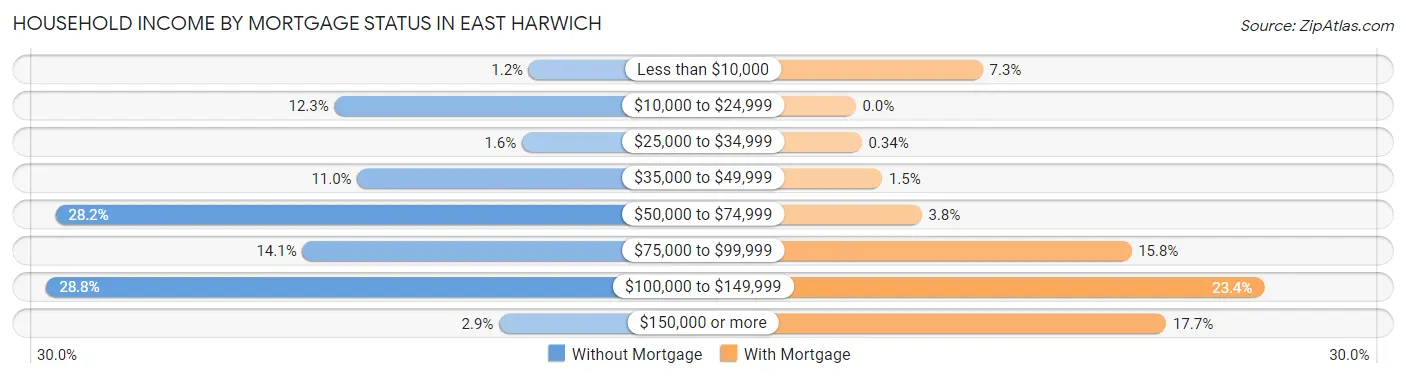
| Household Income | Without Mortgage | With Mortgage |
| Less than $10,000 | 9 (1.2%) | 106 (7.3%) |
| $10,000 to $24,999 | 94 (12.3%) | 0 (0.0%) |
| $25,000 to $34,999 | 12 (1.6%) | 5 (0.3%) |
| $35,000 to $49,999 | 84 (11.0%) | 22 (1.5%) |
| $50,000 to $74,999 | 216 (28.2%) | 55 (3.8%) |
| $75,000 to $99,999 | 108 (14.1%) | 230 (15.8%) |
| $100,000 to $149,999 | 220 (28.8%) | 341 (23.4%) |
| $150,000 or more | 22 (2.9%) | 259 (17.7%) |
| Total | 765 (100.0%) | 1,460 (100.0%) |
Property Value to Household Income Ratio in East Harwich
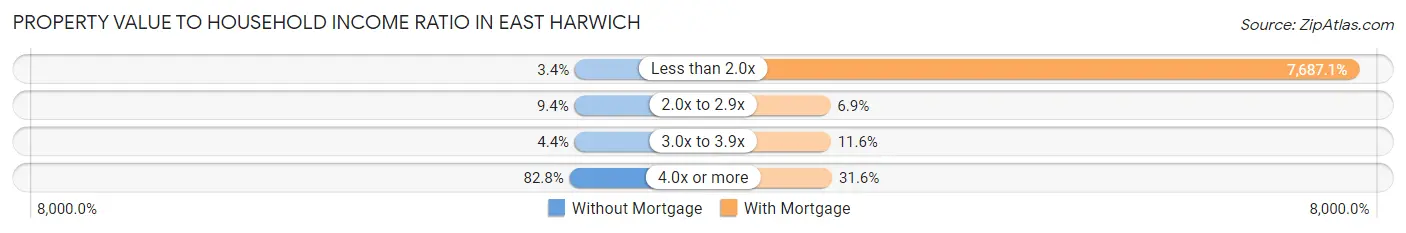
| Value-to-Income Ratio | Without Mortgage | With Mortgage |
| Less than 2.0x | 26 (3.4%) | 112,232 (7,687.1%) |
| 2.0x to 2.9x | 72 (9.4%) | 101 (6.9%) |
| 3.0x to 3.9x | 34 (4.4%) | 169 (11.6%) |
| 4.0x or more | 633 (82.8%) | 462 (31.6%) |
| Total | 765 (100.0%) | 1,460 (100.0%) |
Real Estate Taxes by Mortgage Status in East Harwich
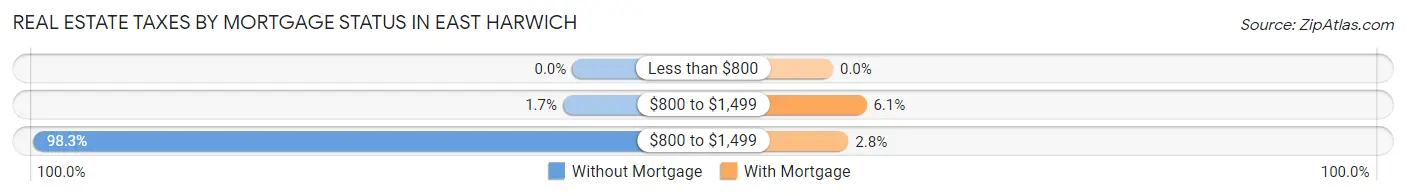
| Property Taxes | Without Mortgage | With Mortgage |
| Less than $800 | 0 (0.0%) | 0 (0.0%) |
| $800 to $1,499 | 13 (1.7%) | 89 (6.1%) |
| $800 to $1,499 | 752 (98.3%) | 41 (2.8%) |
| Total | 765 (100.0%) | 1,460 (100.0%) |
Health & Disability in East Harwich
Health Insurance Coverage by Age in East Harwich
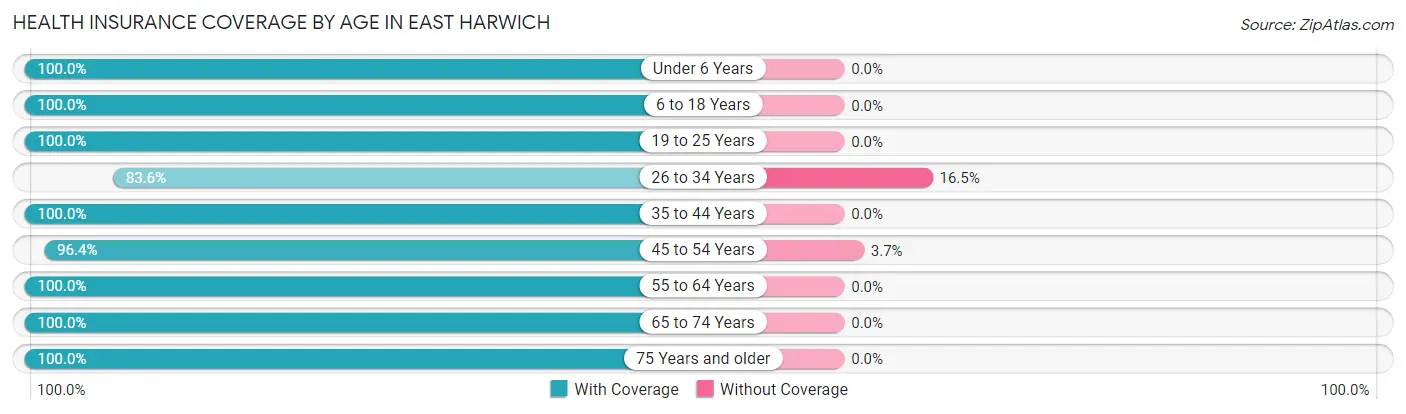
| Age Bracket | With Coverage | Without Coverage |
| Under 6 Years | 400 (100.0%) | 0 (0.0%) |
| 6 to 18 Years | 274 (100.0%) | 0 (0.0%) |
| 19 to 25 Years | 418 (100.0%) | 0 (0.0%) |
| 26 to 34 Years | 254 (83.6%) | 50 (16.5%) |
| 35 to 44 Years | 768 (100.0%) | 0 (0.0%) |
| 45 to 54 Years | 264 (96.4%) | 10 (3.6%) |
| 55 to 64 Years | 1,352 (100.0%) | 0 (0.0%) |
| 65 to 74 Years | 1,332 (100.0%) | 0 (0.0%) |
| 75 Years and older | 571 (100.0%) | 0 (0.0%) |
| Total | 5,633 (99.0%) | 60 (1.1%) |
Health Insurance Coverage by Citizenship Status in East Harwich
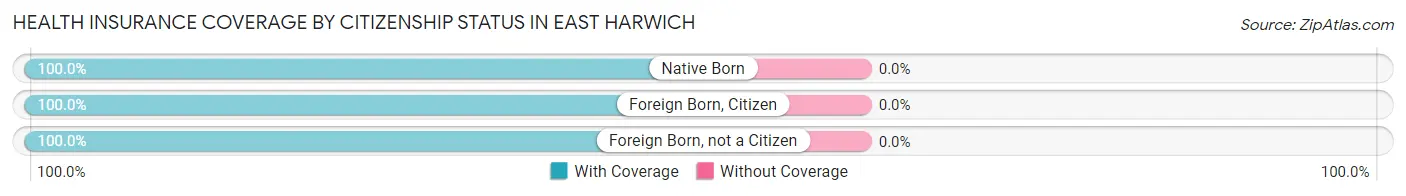
| Citizenship Status | With Coverage | Without Coverage |
| Native Born | 400 (100.0%) | 0 (0.0%) |
| Foreign Born, Citizen | 274 (100.0%) | 0 (0.0%) |
| Foreign Born, not a Citizen | 418 (100.0%) | 0 (0.0%) |
Health Insurance Coverage by Household Income in East Harwich
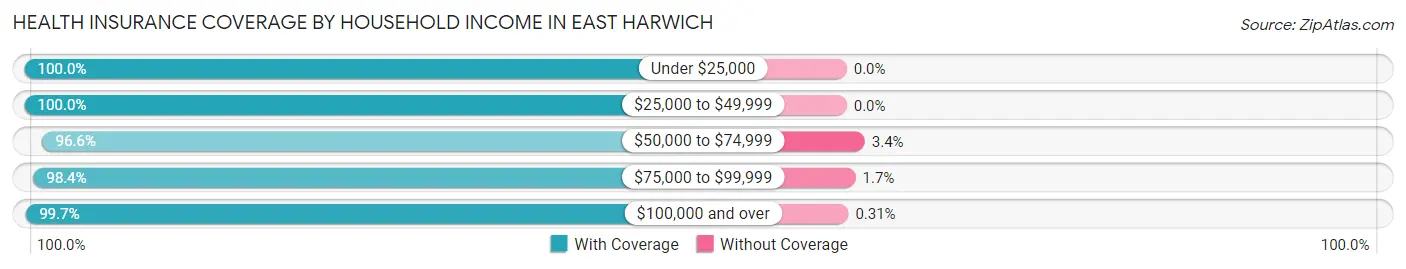
| Household Income | With Coverage | Without Coverage |
| Under $25,000 | 198 (100.0%) | 0 (0.0%) |
| $25,000 to $49,999 | 278 (100.0%) | 0 (0.0%) |
| $50,000 to $74,999 | 972 (96.6%) | 34 (3.4%) |
| $75,000 to $99,999 | 951 (98.4%) | 16 (1.7%) |
| $100,000 and over | 3,224 (99.7%) | 10 (0.3%) |
Public vs Private Health Insurance Coverage by Age in East Harwich
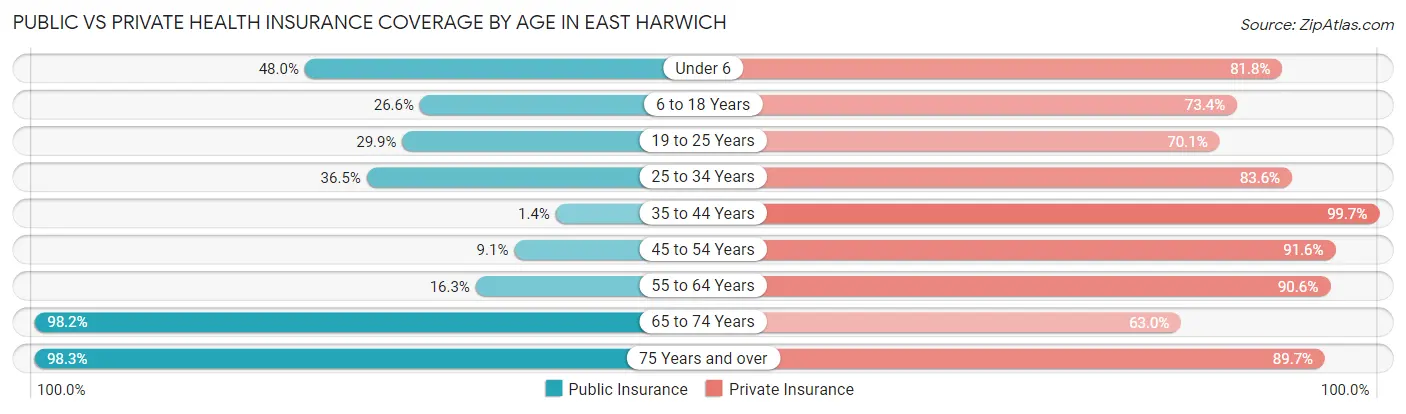
| Age Bracket | Public Insurance | Private Insurance |
| Under 6 | 192 (48.0%) | 327 (81.8%) |
| 6 to 18 Years | 73 (26.6%) | 201 (73.4%) |
| 19 to 25 Years | 125 (29.9%) | 293 (70.1%) |
| 25 to 34 Years | 111 (36.5%) | 254 (83.6%) |
| 35 to 44 Years | 11 (1.4%) | 766 (99.7%) |
| 45 to 54 Years | 25 (9.1%) | 251 (91.6%) |
| 55 to 64 Years | 220 (16.3%) | 1,225 (90.6%) |
| 65 to 74 Years | 1,308 (98.2%) | 839 (63.0%) |
| 75 Years and over | 561 (98.3%) | 512 (89.7%) |
| Total | 2,626 (46.1%) | 4,668 (82.0%) |
Disability Status by Sex by Age in East Harwich
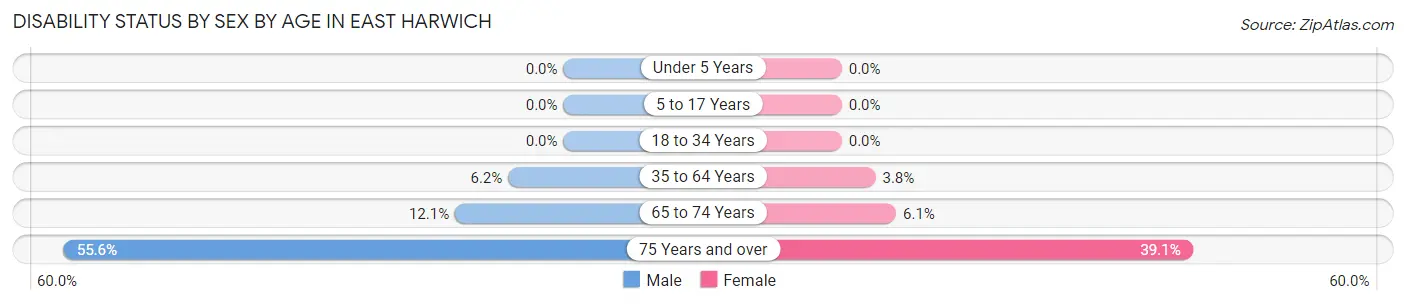
| Age Bracket | Male | Female |
| Under 5 Years | 0 (0.0%) | 0 (0.0%) |
| 5 to 17 Years | 0 (0.0%) | 0 (0.0%) |
| 18 to 34 Years | 0 (0.0%) | 0 (0.0%) |
| 35 to 64 Years | 67 (6.1%) | 49 (3.8%) |
| 65 to 74 Years | 59 (12.1%) | 51 (6.0%) |
| 75 Years and over | 84 (55.6%) | 164 (39.1%) |
Disability Class by Sex by Age in East Harwich
Disability Class: Hearing Difficulty
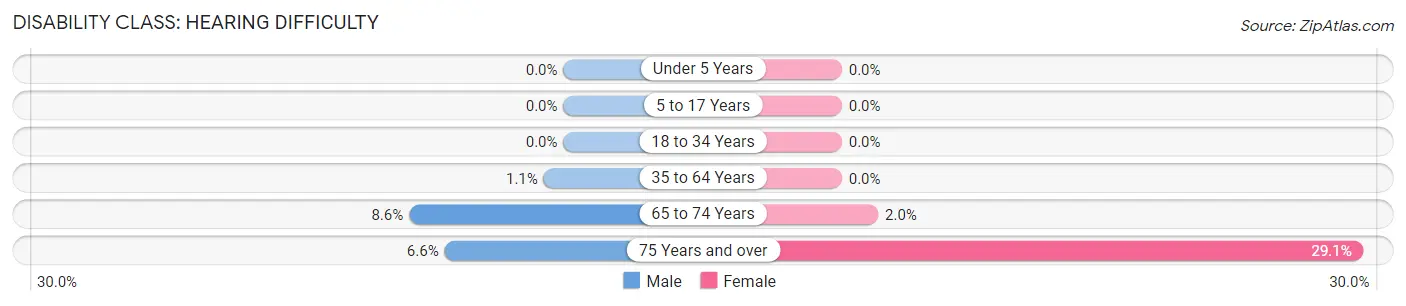
| Age Bracket | Male | Female |
| Under 5 Years | 0 (0.0%) | 0 (0.0%) |
| 5 to 17 Years | 0 (0.0%) | 0 (0.0%) |
| 18 to 34 Years | 0 (0.0%) | 0 (0.0%) |
| 35 to 64 Years | 12 (1.1%) | 0 (0.0%) |
| 65 to 74 Years | 42 (8.6%) | 17 (2.0%) |
| 75 Years and over | 10 (6.6%) | 122 (29.0%) |
Disability Class: Vision Difficulty
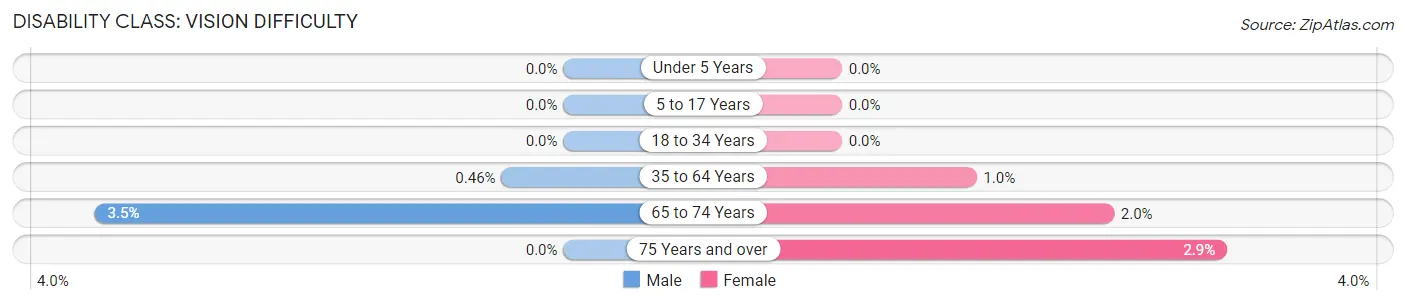
| Age Bracket | Male | Female |
| Under 5 Years | 0 (0.0%) | 0 (0.0%) |
| 5 to 17 Years | 0 (0.0%) | 0 (0.0%) |
| 18 to 34 Years | 0 (0.0%) | 0 (0.0%) |
| 35 to 64 Years | 5 (0.5%) | 13 (1.0%) |
| 65 to 74 Years | 17 (3.5%) | 17 (2.0%) |
| 75 Years and over | 0 (0.0%) | 12 (2.9%) |
Disability Class: Cognitive Difficulty
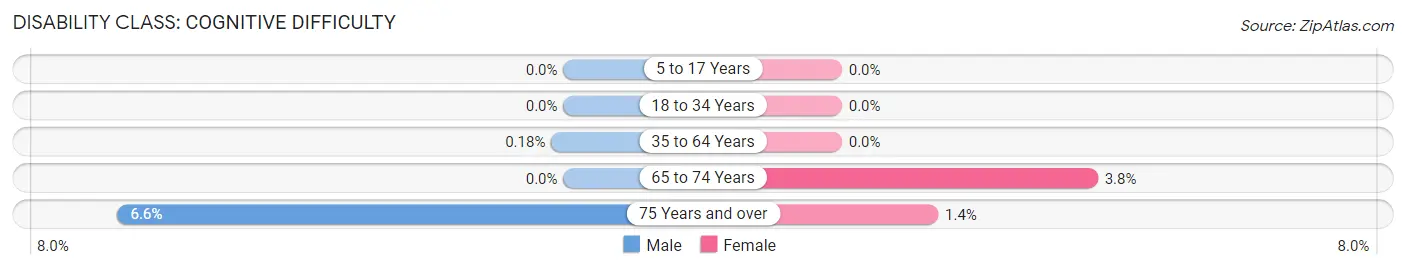
| Age Bracket | Male | Female |
| 5 to 17 Years | 0 (0.0%) | 0 (0.0%) |
| 18 to 34 Years | 0 (0.0%) | 0 (0.0%) |
| 35 to 64 Years | 2 (0.2%) | 0 (0.0%) |
| 65 to 74 Years | 0 (0.0%) | 32 (3.8%) |
| 75 Years and over | 10 (6.6%) | 6 (1.4%) |
Disability Class: Ambulatory Difficulty
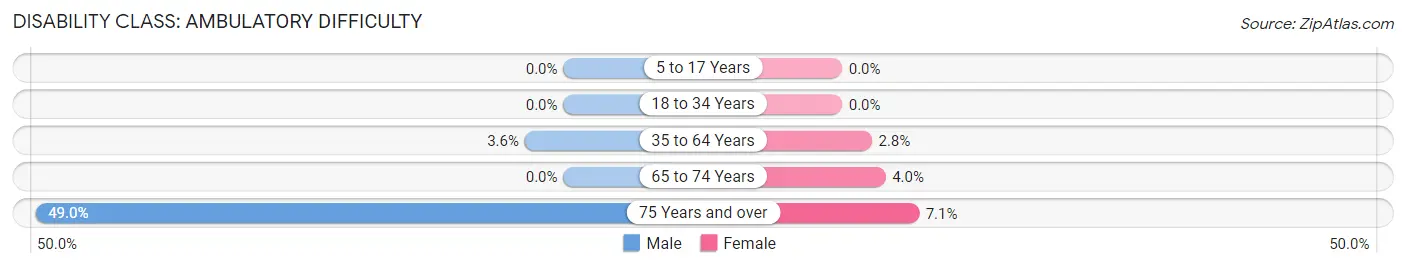
| Age Bracket | Male | Female |
| 5 to 17 Years | 0 (0.0%) | 0 (0.0%) |
| 18 to 34 Years | 0 (0.0%) | 0 (0.0%) |
| 35 to 64 Years | 39 (3.6%) | 36 (2.8%) |
| 65 to 74 Years | 0 (0.0%) | 34 (4.0%) |
| 75 Years and over | 74 (49.0%) | 30 (7.1%) |
Disability Class: Self-Care Difficulty
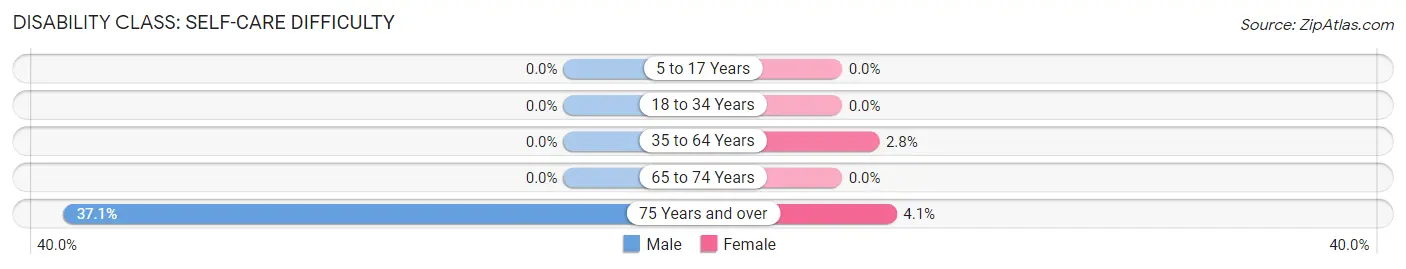
| Age Bracket | Male | Female |
| 5 to 17 Years | 0 (0.0%) | 0 (0.0%) |
| 18 to 34 Years | 0 (0.0%) | 0 (0.0%) |
| 35 to 64 Years | 0 (0.0%) | 36 (2.8%) |
| 65 to 74 Years | 0 (0.0%) | 0 (0.0%) |
| 75 Years and over | 56 (37.1%) | 17 (4.1%) |
Technology Access in East Harwich
Computing Device Access in East Harwich
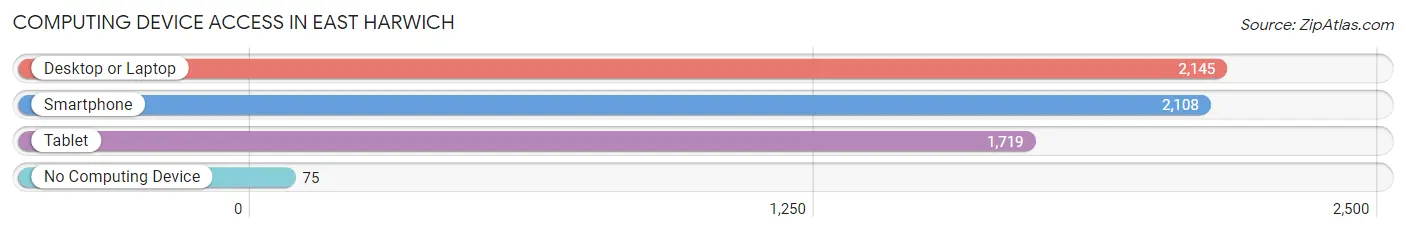
| Device Type | # Households | % Households |
| Desktop or Laptop | 2,145 | 87.1% |
| Smartphone | 2,108 | 85.6% |
| Tablet | 1,719 | 69.8% |
| No Computing Device | 75 | 3.0% |
| Total | 2,463 | 100.0% |
Internet Access in East Harwich
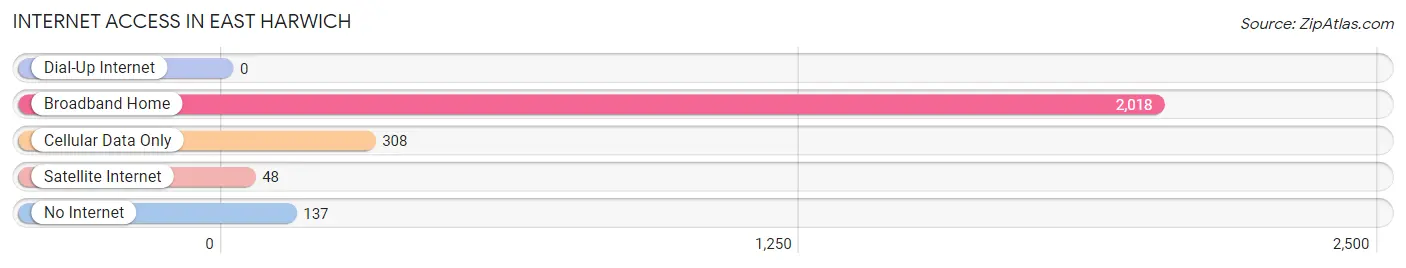
| Internet Type | # Households | % Households |
| Dial-Up Internet | 0 | 0.0% |
| Broadband Home | 2,018 | 81.9% |
| Cellular Data Only | 308 | 12.5% |
| Satellite Internet | 48 | 1.9% |
| No Internet | 137 | 5.6% |
| Total | 2,463 | 100.0% |
East Harwich Summary
History
East Harwich is a small village located in the town of Harwich, Massachusetts, on the south side of Cape Cod. The area was first settled in 1699 by a group of settlers from Eastham, Massachusetts. The settlers were led by Captain John Sears, who was granted a large tract of land by the Plymouth Colony. The area was originally known as "Sears' Purchase" and was later renamed East Harwich.
The village of East Harwich was officially incorporated in 1727. During the 18th and 19th centuries, the village was a thriving agricultural and fishing community. The village was also home to several shipbuilding yards, which produced vessels for the whaling and fishing industries.
In the late 19th century, East Harwich began to experience a period of growth and development. The village was connected to the mainland by a bridge in 1891, and the railroad arrived in 1895. This allowed for increased access to the village and helped to spur economic growth.
In the early 20th century, East Harwich began to experience a decline in its economy. The fishing and whaling industries had declined, and the shipbuilding yards had closed. The village was also hit hard by the Great Depression.
In the late 20th century, East Harwich began to experience a resurgence. The village was designated as a National Historic District in 1975, and the village has since become a popular tourist destination.
Geography
East Harwich is located in the town of Harwich, Massachusetts, on the south side of Cape Cod. The village is situated on the east side of the Cape Cod Canal, which separates the mainland from the Cape. The village is bordered by the towns of Chatham to the north, Brewster to the east, and Dennis to the south.
The village of East Harwich covers an area of approximately 1.5 square miles. The terrain is mostly flat, with some rolling hills. The village is located on the banks of the Herring River, which flows into the Cape Cod Bay.
Economy
The economy of East Harwich is largely based on tourism. The village is a popular destination for visitors to Cape Cod, and the village is home to several restaurants, shops, and lodging establishments.
The village is also home to several marinas, which provide services to boaters and fishermen. The village is also home to several boatyards, which provide repairs and maintenance services to vessels.
The village is also home to several small businesses, including a grocery store, a hardware store, and a pharmacy.
Demographics
As of the 2010 census, the population of East Harwich was 2,845. The population is predominantly white (94.3%), with a small percentage of African Americans (2.2%) and Hispanics (2.2%).
The median household income in East Harwich is $63,917, and the median home value is $400,000. The village has a high rate of homeownership (83.3%), and the unemployment rate is 4.2%.
Common Questions
What is Per Capita Income in East Harwich?
Per Capita income in East Harwich is $53,263.
What is the Median Family Income in East Harwich?
Median Family Income in East Harwich is $128,133.
What is the Median Household income in East Harwich?
Median Household Income in East Harwich is $96,188.
What is Income or Wage Gap in East Harwich?
Income or Wage Gap in East Harwich is 0.6%.
Women in East Harwich earn 99.4 cents for every dollar earned by a man.
What is Inequality or Gini Index in East Harwich?
Inequality or Gini Index in East Harwich is 0.38.
What is the Total Population of East Harwich?
Total Population of East Harwich is 5,693.
What is the Total Male Population of East Harwich?
Total Male Population of East Harwich is 2,625.
What is the Total Female Population of East Harwich?
Total Female Population of East Harwich is 3,068.
What is the Ratio of Males per 100 Females in East Harwich?
There are 85.56 Males per 100 Females in East Harwich.
What is the Ratio of Females per 100 Males in East Harwich?
There are 116.88 Females per 100 Males in East Harwich.
What is the Median Population Age in East Harwich?
Median Population Age in East Harwich is 58.4 Years.
What is the Average Family Size in East Harwich
Average Family Size in East Harwich is 2.9 People.
What is the Average Household Size in East Harwich
Average Household Size in East Harwich is 2.3 People.
How Large is the Labor Force in East Harwich?
There are 3,187 People in the Labor Forcein in East Harwich.
What is the Percentage of People in the Labor Force in East Harwich?
62.5% of People are in the Labor Force in East Harwich.
What is the Unemployment Rate in East Harwich?
Unemployment Rate in East Harwich is 2.4%.