Cities with the Highest Percentage of Population Employed in Enterprise Management in Massachusetts
RELATED REPORTS & OPTIONS
Enterprise Management
Massachusetts
Compare Cities
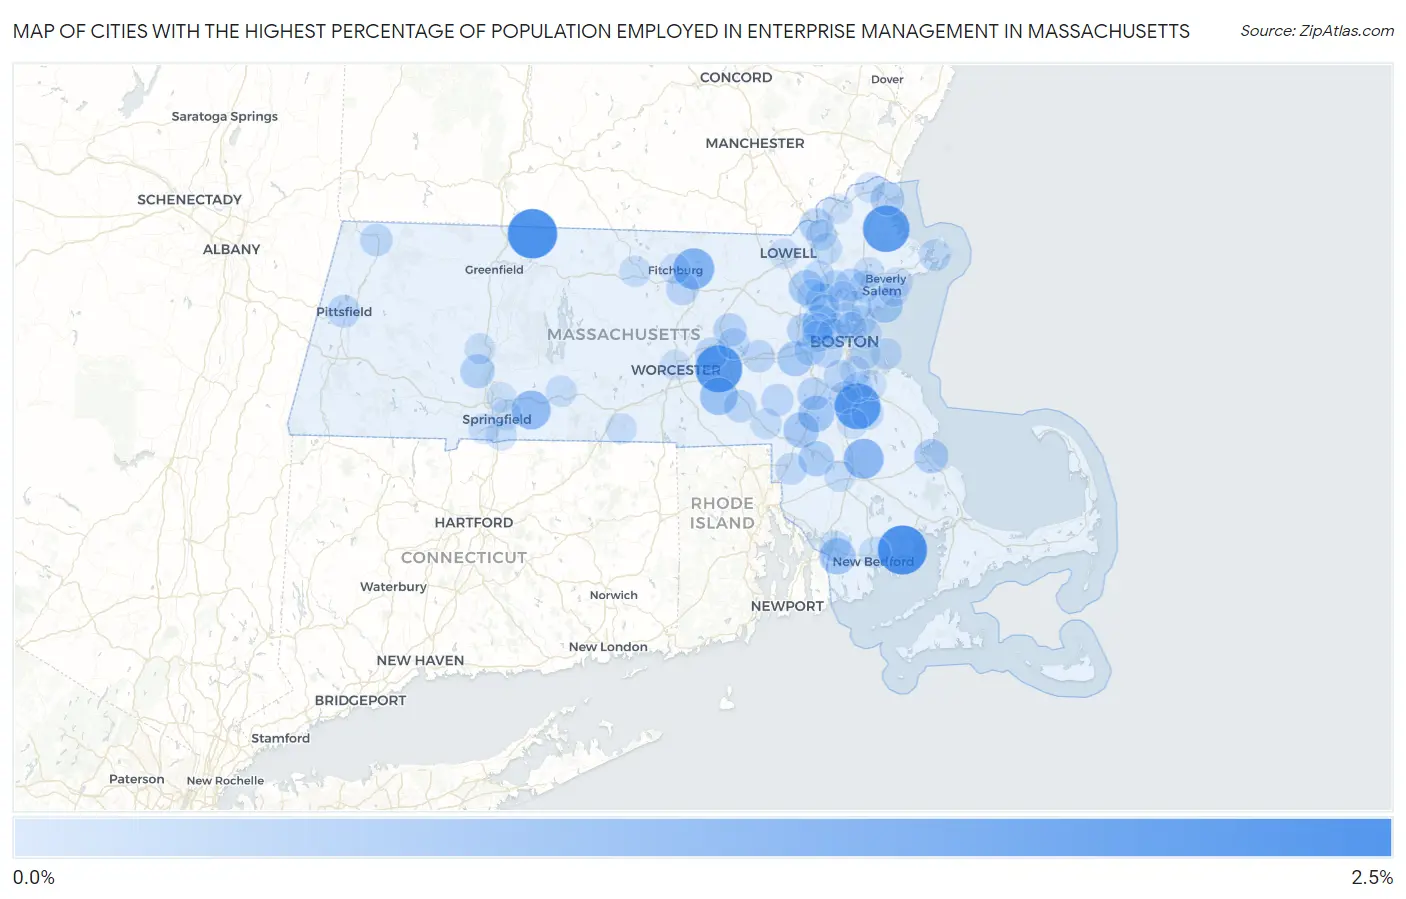
Map of Cities with the Highest Percentage of Population Employed in Enterprise Management in Massachusetts
0.0%
2.5%
Cities with the Highest Percentage of Population Employed in Enterprise Management in Massachusetts
| City | % Employed | vs State | vs National | |
| 1. | Northfield | 2.2% | 0.14%(+2.07)#1 | 0.14%(+2.08)#214 |
| 2. | Mattapoisett Center | 2.2% | 0.14%(+2.03)#2 | 0.14%(+2.04)#220 |
| 3. | Westborough | 1.9% | 0.14%(+1.78)#3 | 0.14%(+1.78)#258 |
| 4. | Rowley | 1.9% | 0.14%(+1.72)#4 | 0.14%(+1.73)#270 |
| 5. | Holbrook | 1.8% | 0.14%(+1.65)#5 | 0.14%(+1.65)#286 |
| 6. | Lunenburg | 1.2% | 0.14%(+1.08)#6 | 0.14%(+1.09)#463 |
| 7. | Bridgewater Town | 1.1% | 0.14%(+0.953)#7 | 0.14%(+0.957)#531 |
| 8. | Wilbraham | 0.98% | 0.14%(+0.840)#8 | 0.14%(+0.844)#613 |
| 9. | Upton | 0.83% | 0.14%(+0.691)#9 | 0.14%(+0.695)#748 |
| 10. | North Westport | 0.70% | 0.14%(+0.553)#10 | 0.14%(+0.557)#936 |
| 11. | Sharon | 0.67% | 0.14%(+0.526)#11 | 0.14%(+0.530)#968 |
| 12. | Foxborough | 0.62% | 0.14%(+0.481)#12 | 0.14%(+0.484)#1,048 |
| 13. | Swampscott | 0.59% | 0.14%(+0.449)#13 | 0.14%(+0.453)#1,105 |
| 14. | Arlington | 0.57% | 0.14%(+0.423)#14 | 0.14%(+0.426)#1,161 |
| 15. | Wellesley | 0.56% | 0.14%(+0.419)#15 | 0.14%(+0.423)#1,173 |
| 16. | Norton Center | 0.56% | 0.14%(+0.414)#16 | 0.14%(+0.417)#1,189 |
| 17. | Pinehurst | 0.55% | 0.14%(+0.409)#17 | 0.14%(+0.412)#1,201 |
| 18. | North Plymouth | 0.47% | 0.14%(+0.331)#18 | 0.14%(+0.335)#1,400 |
| 19. | Easthampton Town | 0.45% | 0.14%(+0.303)#19 | 0.14%(+0.306)#1,470 |
| 20. | Newburyport | 0.41% | 0.14%(+0.270)#20 | 0.14%(+0.274)#1,568 |
| 21. | Methuen Town | 0.40% | 0.14%(+0.258)#21 | 0.14%(+0.262)#1,617 |
| 22. | Woburn | 0.38% | 0.14%(+0.239)#22 | 0.14%(+0.243)#1,685 |
| 23. | Hudson | 0.37% | 0.14%(+0.224)#23 | 0.14%(+0.228)#1,758 |
| 24. | Waltham | 0.35% | 0.14%(+0.203)#24 | 0.14%(+0.207)#1,835 |
| 25. | Norwood | 0.32% | 0.14%(+0.176)#25 | 0.14%(+0.179)#1,949 |
| 26. | Leominster | 0.31% | 0.14%(+0.164)#26 | 0.14%(+0.168)#2,001 |
| 27. | Lynnfield | 0.31% | 0.14%(+0.164)#27 | 0.14%(+0.168)#2,003 |
| 28. | Milton | 0.30% | 0.14%(+0.161)#28 | 0.14%(+0.165)#2,024 |
| 29. | Randolph Town | 0.30% | 0.14%(+0.158)#29 | 0.14%(+0.161)#2,050 |
| 30. | Brookline | 0.30% | 0.14%(+0.155)#30 | 0.14%(+0.159)#2,063 |
| 31. | Pittsfield | 0.30% | 0.14%(+0.153)#31 | 0.14%(+0.157)#2,073 |
| 32. | Northborough | 0.29% | 0.14%(+0.149)#32 | 0.14%(+0.153)#2,086 |
| 33. | Milford | 0.29% | 0.14%(+0.149)#33 | 0.14%(+0.153)#2,091 |
| 34. | North Adams | 0.28% | 0.14%(+0.136)#34 | 0.14%(+0.139)#2,161 |
| 35. | Millis Clicquot | 0.26% | 0.14%(+0.114)#35 | 0.14%(+0.118)#2,283 |
| 36. | Framingham | 0.25% | 0.14%(+0.111)#36 | 0.14%(+0.115)#2,301 |
| 37. | Reading | 0.23% | 0.14%(+0.083)#37 | 0.14%(+0.087)#2,467 |
| 38. | Abington | 0.22% | 0.14%(+0.079)#38 | 0.14%(+0.083)#2,491 |
| 39. | Gloucester | 0.21% | 0.14%(+0.070)#39 | 0.14%(+0.074)#2,541 |
| 40. | Attleboro | 0.21% | 0.14%(+0.064)#40 | 0.14%(+0.068)#2,582 |
| 41. | Greenfield | 0.20% | 0.14%(+0.059)#41 | 0.14%(+0.063)#2,612 |
| 42. | Malden | 0.19% | 0.14%(+0.050)#42 | 0.14%(+0.054)#2,674 |
| 43. | New Bedford | 0.19% | 0.14%(+0.048)#43 | 0.14%(+0.051)#2,700 |
| 44. | Somerville | 0.19% | 0.14%(+0.047)#44 | 0.14%(+0.051)#2,705 |
| 45. | Marlborough | 0.19% | 0.14%(+0.045)#45 | 0.14%(+0.049)#2,720 |
| 46. | Peabody | 0.18% | 0.14%(+0.042)#46 | 0.14%(+0.046)#2,742 |
| 47. | Andover | 0.18% | 0.14%(+0.039)#47 | 0.14%(+0.043)#2,765 |
| 48. | Revere | 0.18% | 0.14%(+0.035)#48 | 0.14%(+0.039)#2,783 |
| 49. | Burlington | 0.16% | 0.14%(+0.017)#49 | 0.14%(+0.020)#2,929 |
| 50. | Winchester | 0.16% | 0.14%(+0.016)#50 | 0.14%(+0.020)#2,931 |
| 51. | Newton | 0.16% | 0.14%(+0.014)#51 | 0.14%(+0.018)#2,943 |
| 52. | Wilmington | 0.16% | 0.14%(+0.013)#52 | 0.14%(+0.017)#2,954 |
| 53. | Fall River | 0.15% | 0.14%(+0.007)#53 | 0.14%(+0.011)#2,994 |
| 54. | Gardner | 0.15% | 0.14%(+0.005)#54 | 0.14%(+0.009)#3,007 |
| 55. | Hull | 0.15% | 0.14%(+0.003)#55 | 0.14%(+0.007)#3,025 |
| 56. | Taunton | 0.15% | 0.14%(+0.003)#56 | 0.14%(+0.007)#3,028 |
| 57. | Palmer Town | 0.15% | 0.14%(+0.003)#57 | 0.14%(+0.007)#3,031 |
| 58. | Belmont | 0.14% | 0.14%(-0.001)#58 | 0.14%(+0.003)#3,052 |
| 59. | Franklin Town | 0.14% | 0.14%(-0.002)#59 | 0.14%(+0.002)#3,059 |
| 60. | Lawrence | 0.14% | 0.14%(-0.004)#60 | 0.14%(-0.000)#3,076 |
| 61. | Boston | 0.14% | 0.14%(-0.006)#61 | 0.14%(-0.003)#3,096 |
| 62. | Watertown Town | 0.13% | 0.14%(-0.015)#62 | 0.14%(-0.012)#3,171 |
| 63. | Saugus | 0.12% | 0.14%(-0.018)#63 | 0.14%(-0.015)#3,196 |
| 64. | Southbridge Town | 0.12% | 0.14%(-0.022)#64 | 0.14%(-0.018)#3,221 |
| 65. | Longmeadow | 0.12% | 0.14%(-0.026)#65 | 0.14%(-0.022)#3,270 |
| 66. | Danvers | 0.100% | 0.14%(-0.043)#66 | 0.14%(-0.039)#3,422 |
| 67. | Springfield | 0.096% | 0.14%(-0.046)#67 | 0.14%(-0.042)#3,458 |
| 68. | Agawam Town | 0.095% | 0.14%(-0.047)#68 | 0.14%(-0.043)#3,469 |
| 69. | Winthrop Town | 0.094% | 0.14%(-0.049)#69 | 0.14%(-0.045)#3,479 |
| 70. | Northampton | 0.091% | 0.14%(-0.051)#70 | 0.14%(-0.048)#3,516 |
| 71. | Cambridge | 0.080% | 0.14%(-0.062)#71 | 0.14%(-0.058)#3,617 |
| 72. | Quincy | 0.078% | 0.14%(-0.064)#72 | 0.14%(-0.060)#3,633 |
| 73. | Salem | 0.078% | 0.14%(-0.064)#73 | 0.14%(-0.060)#3,634 |
| 74. | Beverly | 0.078% | 0.14%(-0.065)#74 | 0.14%(-0.061)#3,640 |
| 75. | Chelsea | 0.076% | 0.14%(-0.067)#75 | 0.14%(-0.063)#3,656 |
| 76. | Worcester | 0.072% | 0.14%(-0.070)#76 | 0.14%(-0.066)#3,682 |
| 77. | Fitchburg | 0.072% | 0.14%(-0.070)#77 | 0.14%(-0.066)#3,683 |
| 78. | Amesbury Town | 0.071% | 0.14%(-0.071)#78 | 0.14%(-0.068)#3,697 |
| 79. | Haverhill | 0.067% | 0.14%(-0.075)#79 | 0.14%(-0.071)#3,735 |
| 80. | Weymouth Town | 0.049% | 0.14%(-0.093)#80 | 0.14%(-0.089)#3,861 |
| 81. | Wakefield | 0.047% | 0.14%(-0.095)#81 | 0.14%(-0.091)#3,880 |
| 82. | Lowell | 0.039% | 0.14%(-0.103)#82 | 0.14%(-0.100)#3,943 |
| 83. | Braintree Town | 0.037% | 0.14%(-0.105)#83 | 0.14%(-0.101)#3,955 |
| 84. | Brockton | 0.037% | 0.14%(-0.106)#84 | 0.14%(-0.102)#3,960 |
| 85. | Chicopee | 0.034% | 0.14%(-0.109)#85 | 0.14%(-0.105)#3,979 |
Common Questions
What are the Top 10 Cities with the Highest Percentage of Population Employed in Enterprise Management in Massachusetts?
Top 10 Cities with the Highest Percentage of Population Employed in Enterprise Management in Massachusetts are:
#1
2.2%
#2
2.2%
#3
1.9%
#4
1.9%
#5
1.8%
#6
1.2%
#7
1.1%
#8
0.98%
#9
0.83%
#10
0.70%
What city has the Highest Percentage of Population Employed in Enterprise Management in Massachusetts?
Northfield has the Highest Percentage of Population Employed in Enterprise Management in Massachusetts with 2.2%.
What is the Percentage of Population Employed in Enterprise Management in the State of Massachusetts?
Percentage of Population Employed in Enterprise Management in Massachusetts is 0.14%.
What is the Percentage of Population Employed in Enterprise Management in the United States?
Percentage of Population Employed in Enterprise Management in the United States is 0.14%.