Teaticket, MA Map & Demographics
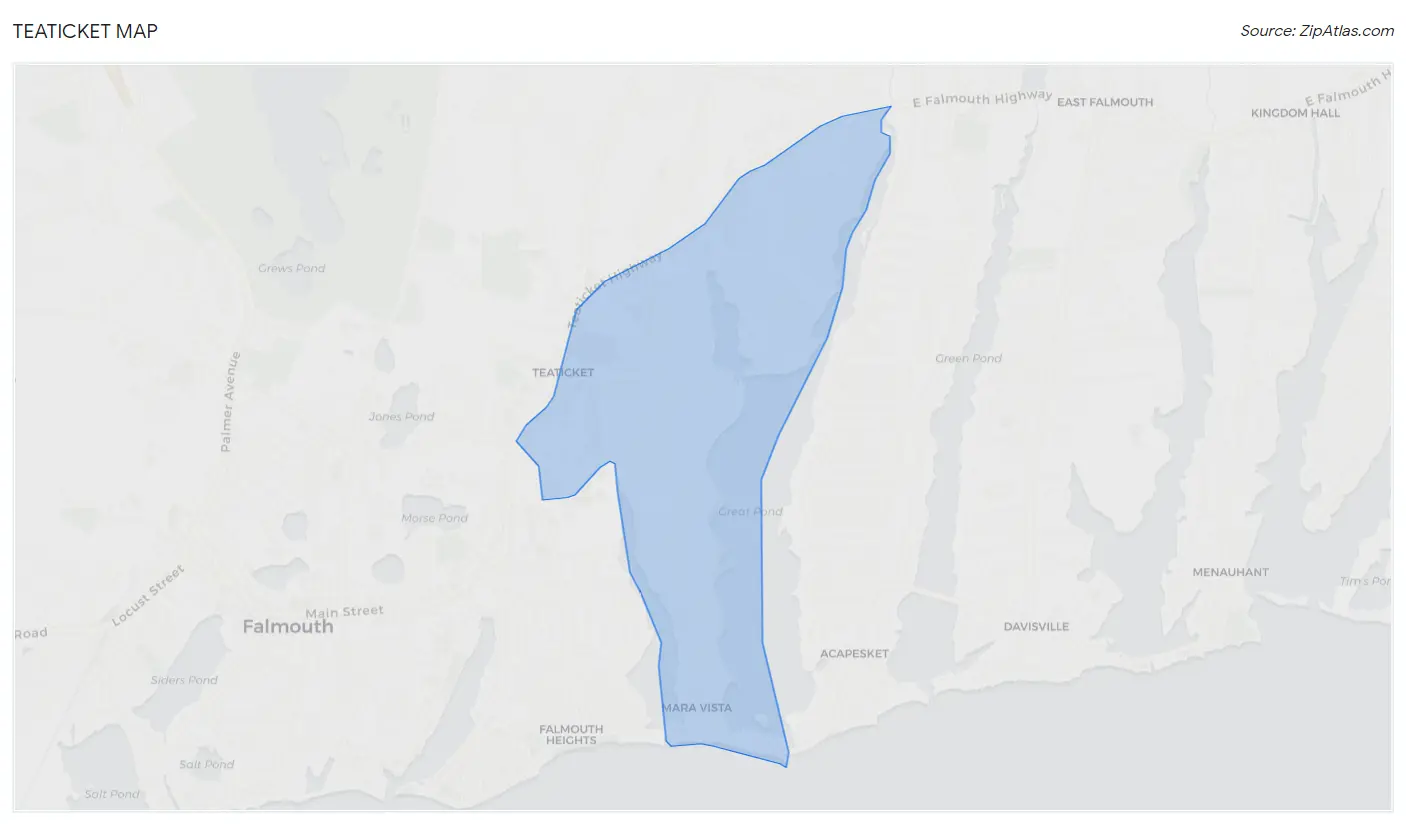
Teaticket Map
Teaticket Overview
$65,345
PER CAPITA INCOME
$94,722
AVG FAMILY INCOME
$86,250
AVG HOUSEHOLD INCOME
20.7%
WAGE / INCOME GAP [ % ]
79.3¢/ $1
WAGE / INCOME GAP [ $ ]
0.53
INEQUALITY / GINI INDEX
1,561
TOTAL POPULATION
744
MALE POPULATION
817
FEMALE POPULATION
91.06
MALES / 100 FEMALES
109.81
FEMALES / 100 MALES
63.2
MEDIAN AGE
2.7
AVG FAMILY SIZE
2.0
AVG HOUSEHOLD SIZE
737
LABOR FORCE [ PEOPLE ]
50.6%
PERCENT IN LABOR FORCE
1.4%
UNEMPLOYMENT RATE
Teaticket Area Codes
Income in Teaticket
Income Overview in Teaticket
Per Capita Income in Teaticket is $65,345, while median incomes of families and households are $94,722 and $86,250 respectively.
| Characteristic | Number | Measure |
| Per Capita Income | 1,561 | $65,345 |
| Median Family Income | 426 | $94,722 |
| Mean Family Income | 426 | $160,418 |
| Median Household Income | 768 | $86,250 |
| Mean Household Income | 768 | $132,017 |
| Income Deficit | 426 | $0 |
| Wage / Income Gap (%) | 1,561 | 20.71% |
| Wage / Income Gap ($) | 1,561 | 79.29¢ per $1 |
| Gini / Inequality Index | 1,561 | 0.53 |
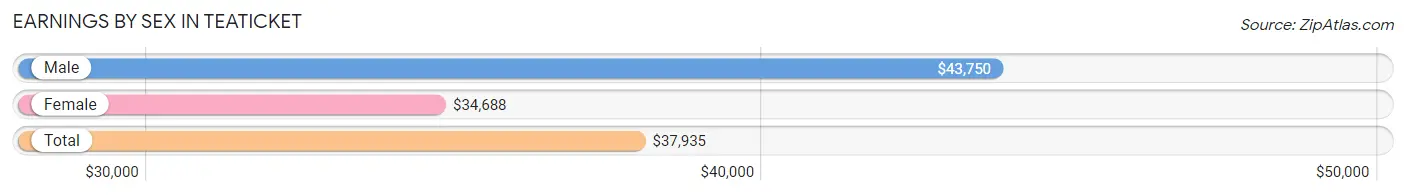
Earnings by Sex in Teaticket
Average Earnings in Teaticket are $37,935, $43,750 for men and $34,688 for women, a difference of 20.7%.
| Sex | Number | Average Earnings |
| Male | 395 (51.7%) | $43,750 |
| Female | 369 (48.3%) | $34,688 |
| Total | 764 (100.0%) | $37,935 |
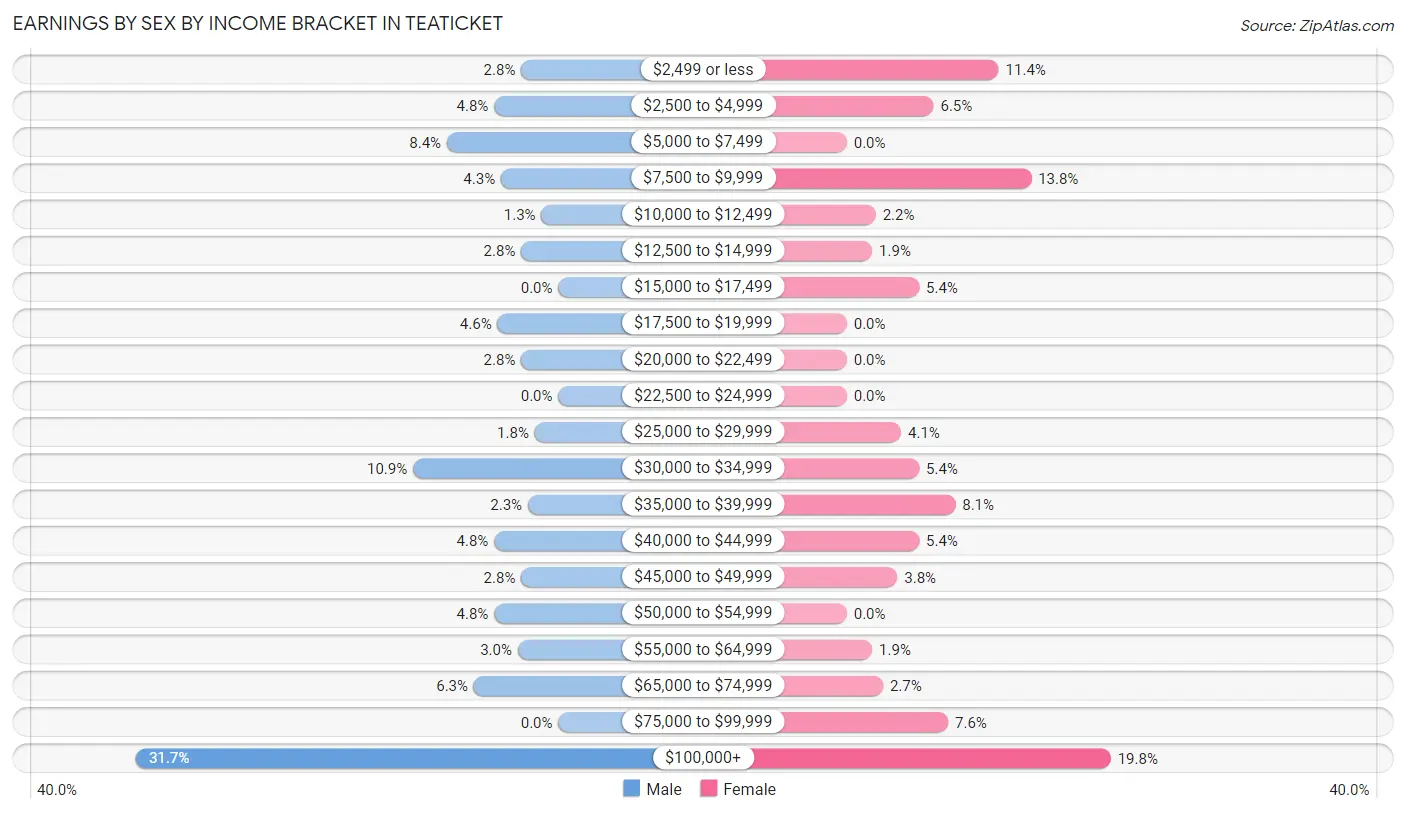
Earnings by Sex by Income Bracket in Teaticket
The most common earnings brackets in Teaticket are $100,000+ for men (125 | 31.7%) and $100,000+ for women (73 | 19.8%).
| Income | Male | Female |
| $2,499 or less | 11 (2.8%) | 42 (11.4%) |
| $2,500 to $4,999 | 19 (4.8%) | 24 (6.5%) |
| $5,000 to $7,499 | 33 (8.4%) | 0 (0.0%) |
| $7,500 to $9,999 | 17 (4.3%) | 51 (13.8%) |
| $10,000 to $12,499 | 5 (1.3%) | 8 (2.2%) |
| $12,500 to $14,999 | 11 (2.8%) | 7 (1.9%) |
| $15,000 to $17,499 | 0 (0.0%) | 20 (5.4%) |
| $17,500 to $19,999 | 18 (4.6%) | 0 (0.0%) |
| $20,000 to $22,499 | 11 (2.8%) | 0 (0.0%) |
| $22,500 to $24,999 | 0 (0.0%) | 0 (0.0%) |
| $25,000 to $29,999 | 7 (1.8%) | 15 (4.1%) |
| $30,000 to $34,999 | 43 (10.9%) | 20 (5.4%) |
| $35,000 to $39,999 | 9 (2.3%) | 30 (8.1%) |
| $40,000 to $44,999 | 19 (4.8%) | 20 (5.4%) |
| $45,000 to $49,999 | 11 (2.8%) | 14 (3.8%) |
| $50,000 to $54,999 | 19 (4.8%) | 0 (0.0%) |
| $55,000 to $64,999 | 12 (3.0%) | 7 (1.9%) |
| $65,000 to $74,999 | 25 (6.3%) | 10 (2.7%) |
| $75,000 to $99,999 | 0 (0.0%) | 28 (7.6%) |
| $100,000+ | 125 (31.7%) | 73 (19.8%) |
| Total | 395 (100.0%) | 369 (100.0%) |
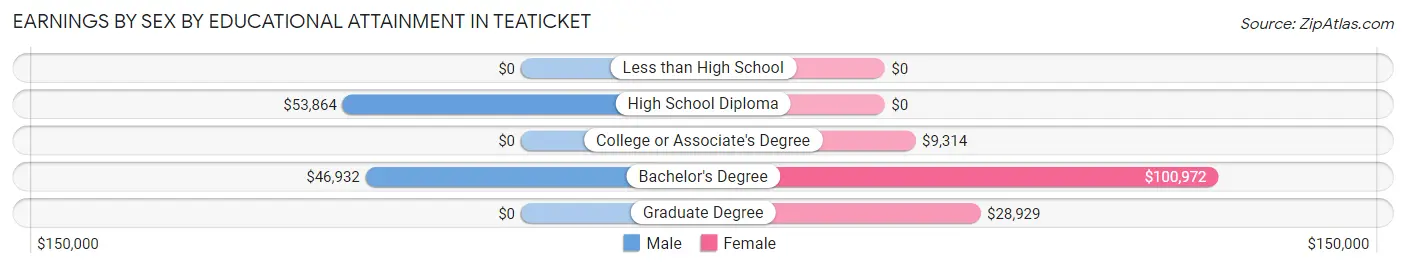
Earnings by Sex by Educational Attainment in Teaticket
Average earnings in Teaticket are $69,375 for men and $35,391 for women, a difference of 49.0%. Men with an educational attainment of high school diploma enjoy the highest average annual earnings of $53,864, while those with bachelor's degree education earn the least with $46,932. Women with an educational attainment of bachelor's degree earn the most with the average annual earnings of $100,972, while those with college or associate's degree education have the smallest earnings of $9,314.
| Educational Attainment | Male Income | Female Income |
| Less than High School | - | - |
| High School Diploma | $53,864 | $0 |
| College or Associate's Degree | - | - |
| Bachelor's Degree | $46,932 | $100,972 |
| Graduate Degree | - | - |
| Total | $69,375 | $35,391 |
Family Income in Teaticket
Family Income Brackets in Teaticket
According to the Teaticket family income data, there are 103 families falling into the $100,000 to $149,999 income range, which is the most common income bracket and makes up 24.2% of all families.
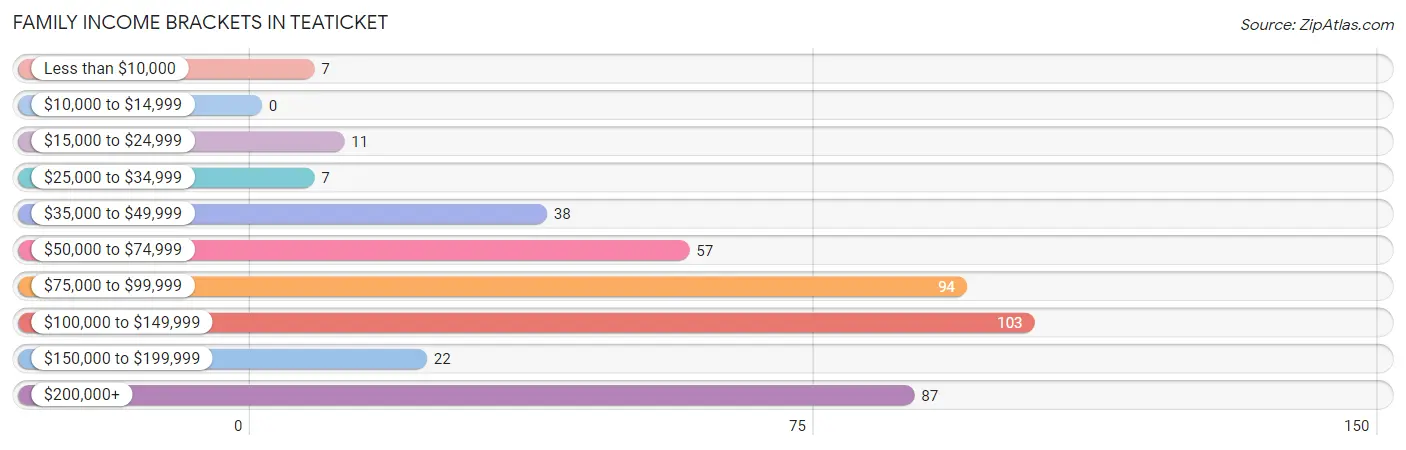
| Income Bracket | # Families | % Families |
| Less than $10,000 | 7 | 1.6% |
| $10,000 to $14,999 | 0 | 0.0% |
| $15,000 to $24,999 | 11 | 2.6% |
| $25,000 to $34,999 | 7 | 1.6% |
| $35,000 to $49,999 | 38 | 8.9% |
| $50,000 to $74,999 | 57 | 13.4% |
| $75,000 to $99,999 | 94 | 22.1% |
| $100,000 to $149,999 | 103 | 24.2% |
| $150,000 to $199,999 | 22 | 5.2% |
| $200,000+ | 87 | 20.4% |
Family Income by Famaliy Size in Teaticket
2-person families (308 | 72.3%) account for the highest median family income in Teaticket with $105,272 per family, while 2-person families (308 | 72.3%) have the highest median income of $52,636 per family member.
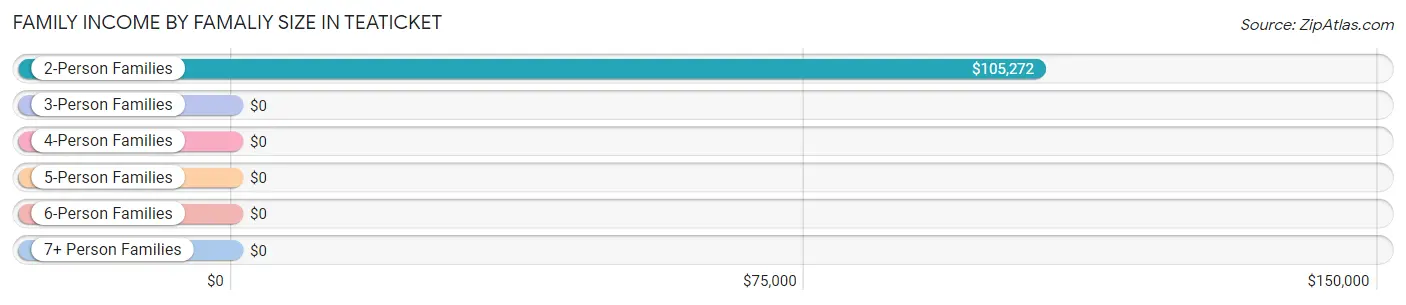
| Income Bracket | # Families | Median Income |
| 2-Person Families | 308 (72.3%) | $105,272 |
| 3-Person Families | 55 (12.9%) | $0 |
| 4-Person Families | 33 (7.7%) | $0 |
| 5-Person Families | 16 (3.8%) | $0 |
| 6-Person Families | 14 (3.3%) | $0 |
| 7+ Person Families | 0 (0.0%) | $0 |
| Total | 426 (100.0%) | $94,722 |
Family Income by Number of Earners in Teaticket
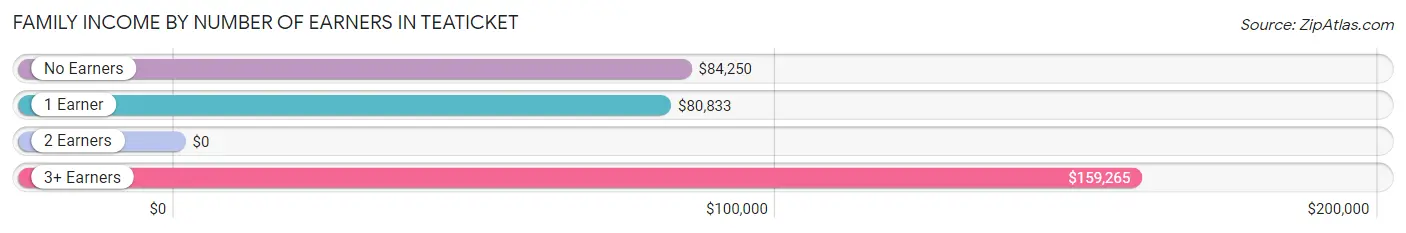
| Number of Earners | # Families | Median Income |
| No Earners | 168 (39.4%) | $84,250 |
| 1 Earner | 102 (23.9%) | $80,833 |
| 2 Earners | 118 (27.7%) | $0 |
| 3+ Earners | 38 (8.9%) | $159,265 |
| Total | 426 (100.0%) | $94,722 |
Household Income in Teaticket
Household Income Brackets in Teaticket
With 153 households falling in the category, the $100,000 to $149,999 income range is the most frequent in Teaticket, accounting for 19.9% of all households. In contrast, only 18 households (2.3%) fall into the $10,000 to $14,999 income bracket, making it the least populous group.
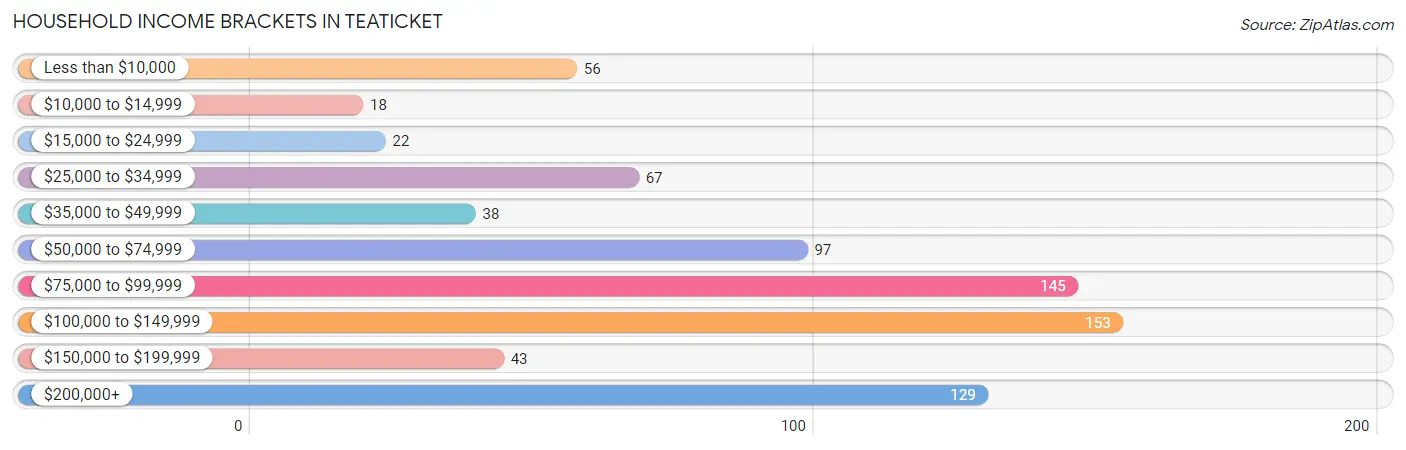
| Income Bracket | # Households | % Households |
| Less than $10,000 | 56 | 7.3% |
| $10,000 to $14,999 | 18 | 2.3% |
| $15,000 to $24,999 | 22 | 2.9% |
| $25,000 to $34,999 | 67 | 8.7% |
| $35,000 to $49,999 | 38 | 4.9% |
| $50,000 to $74,999 | 97 | 12.6% |
| $75,000 to $99,999 | 145 | 18.9% |
| $100,000 to $149,999 | 153 | 19.9% |
| $150,000 to $199,999 | 43 | 5.6% |
| $200,000+ | 129 | 16.8% |
Household Income by Householder Age in Teaticket
The median household income in Teaticket is $86,250, with the highest median household income of $96,250 found in the 45 to 64 years age bracket for the primary householder. A total of 278 households (36.2%) fall into this category. Meanwhile, the 15 to 24 years age bracket for the primary householder has the lowest median household income of $0, with 12 households (1.6%) in this group.
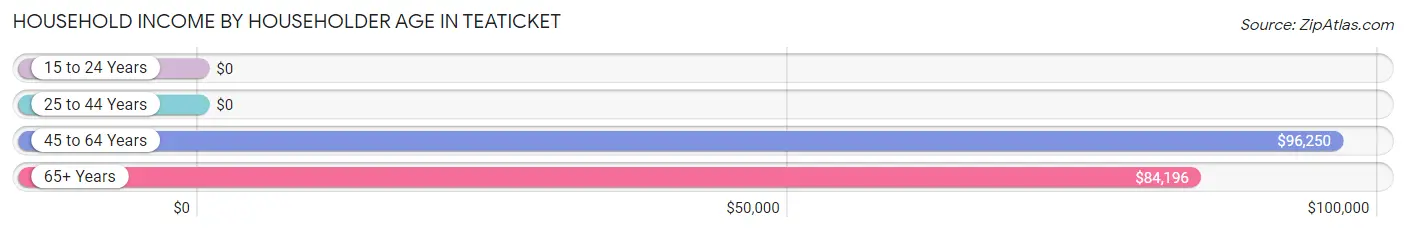
| Income Bracket | # Households | Median Income |
| 15 to 24 Years | 12 (1.6%) | $0 |
| 25 to 44 Years | 44 (5.7%) | $0 |
| 45 to 64 Years | 278 (36.2%) | $96,250 |
| 65+ Years | 434 (56.5%) | $84,196 |
| Total | 768 (100.0%) | $86,250 |
Poverty in Teaticket
Income Below Poverty by Sex and Age in Teaticket
With 7.3% poverty level for males and 10.0% for females among the residents of Teaticket, 12 to 14 year old males and 35 to 44 year old females are the most vulnerable to poverty, with 8 males (42.1%) and 11 females (57.9%) in their respective age groups living below the poverty level.
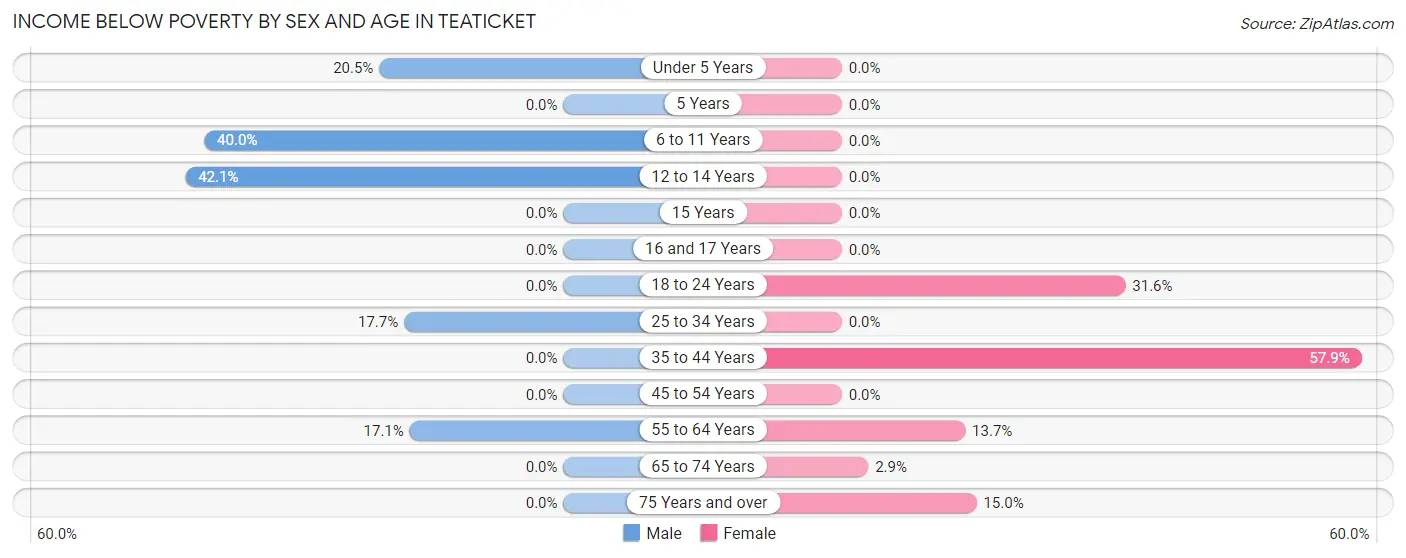
| Age Bracket | Male | Female |
| Under 5 Years | 8 (20.5%) | 0 (0.0%) |
| 5 Years | 0 (0.0%) | 0 (0.0%) |
| 6 to 11 Years | 8 (40.0%) | 0 (0.0%) |
| 12 to 14 Years | 8 (42.1%) | 0 (0.0%) |
| 15 Years | 0 (0.0%) | 0 (0.0%) |
| 16 and 17 Years | 0 (0.0%) | 0 (0.0%) |
| 18 to 24 Years | 0 (0.0%) | 12 (31.6%) |
| 25 to 34 Years | 11 (17.7%) | 0 (0.0%) |
| 35 to 44 Years | 0 (0.0%) | 11 (57.9%) |
| 45 to 54 Years | 0 (0.0%) | 0 (0.0%) |
| 55 to 64 Years | 19 (17.1%) | 25 (13.7%) |
| 65 to 74 Years | 0 (0.0%) | 7 (2.9%) |
| 75 Years and over | 0 (0.0%) | 27 (15.0%) |
| Total | 54 (7.3%) | 82 (10.0%) |
Income Above Poverty by Sex and Age in Teaticket
According to the poverty statistics in Teaticket, males aged 15 years and females aged under 5 years are the age groups that are most secure financially, with 100.0% of males and 100.0% of females in these age groups living above the poverty line.
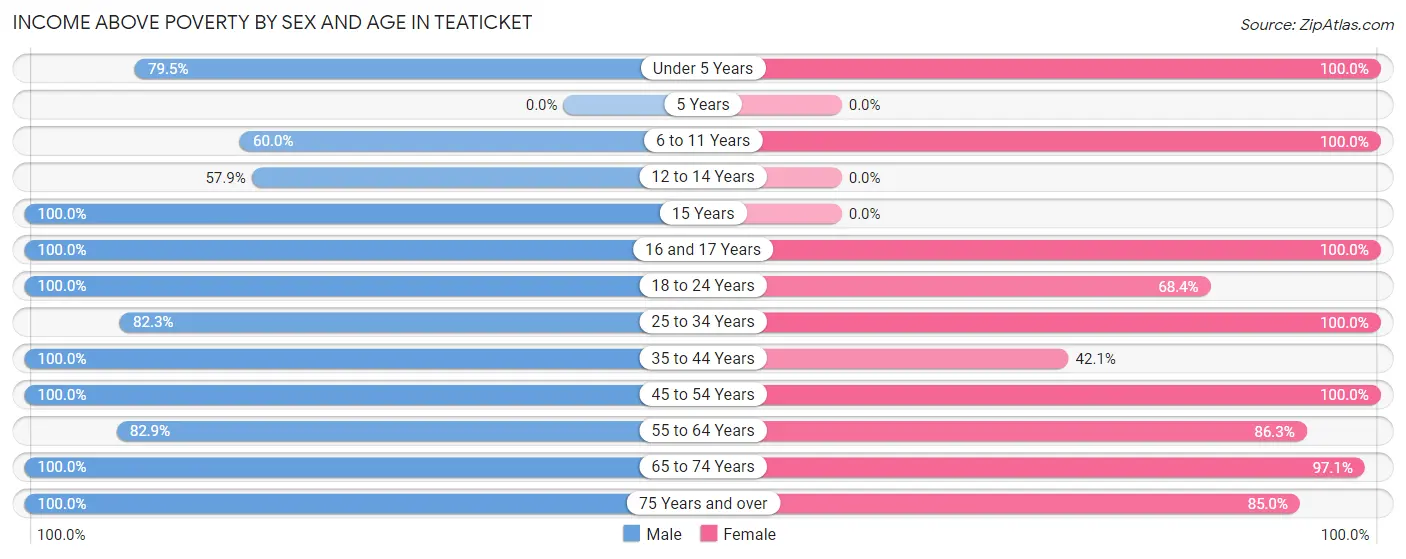
| Age Bracket | Male | Female |
| Under 5 Years | 31 (79.5%) | 11 (100.0%) |
| 5 Years | 0 (0.0%) | 0 (0.0%) |
| 6 to 11 Years | 12 (60.0%) | 11 (100.0%) |
| 12 to 14 Years | 11 (57.9%) | 0 (0.0%) |
| 15 Years | 5 (100.0%) | 0 (0.0%) |
| 16 and 17 Years | 29 (100.0%) | 24 (100.0%) |
| 18 to 24 Years | 83 (100.0%) | 26 (68.4%) |
| 25 to 34 Years | 51 (82.3%) | 43 (100.0%) |
| 35 to 44 Years | 34 (100.0%) | 8 (42.1%) |
| 45 to 54 Years | 68 (100.0%) | 71 (100.0%) |
| 55 to 64 Years | 92 (82.9%) | 157 (86.3%) |
| 65 to 74 Years | 183 (100.0%) | 231 (97.1%) |
| 75 Years and over | 91 (100.0%) | 153 (85.0%) |
| Total | 690 (92.7%) | 735 (90.0%) |
Income Below Poverty Among Married-Couple Families in Teaticket
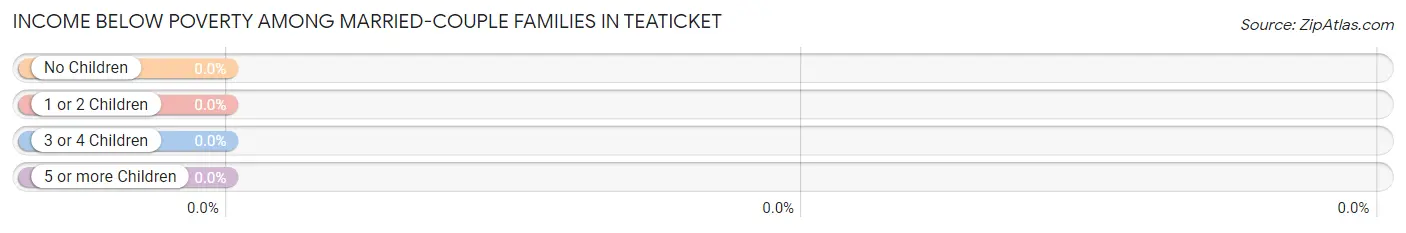
| Children | Above Poverty | Below Poverty |
| No Children | 262 (100.0%) | 0 (0.0%) |
| 1 or 2 Children | 41 (100.0%) | 0 (0.0%) |
| 3 or 4 Children | 0 (0.0%) | 0 (0.0%) |
| 5 or more Children | 0 (0.0%) | 0 (0.0%) |
| Total | 303 (100.0%) | 0 (0.0%) |
Income Below Poverty Among Single-Parent Households in Teaticket
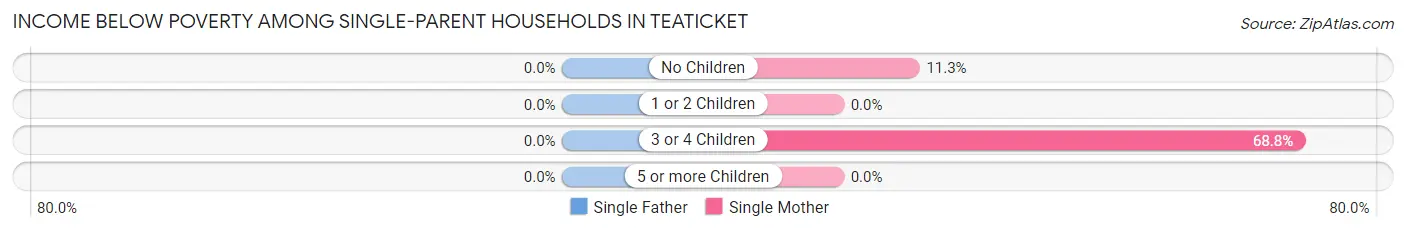
| Children | Single Father | Single Mother |
| No Children | 0 (0.0%) | 7 (11.3%) |
| 1 or 2 Children | 0 (0.0%) | 0 (0.0%) |
| 3 or 4 Children | 0 (0.0%) | 11 (68.8%) |
| 5 or more Children | 0 (0.0%) | 0 (0.0%) |
| Total | 0 (0.0%) | 18 (15.5%) |
Income Below Poverty Among Married-Couple vs Single-Parent Households in Teaticket
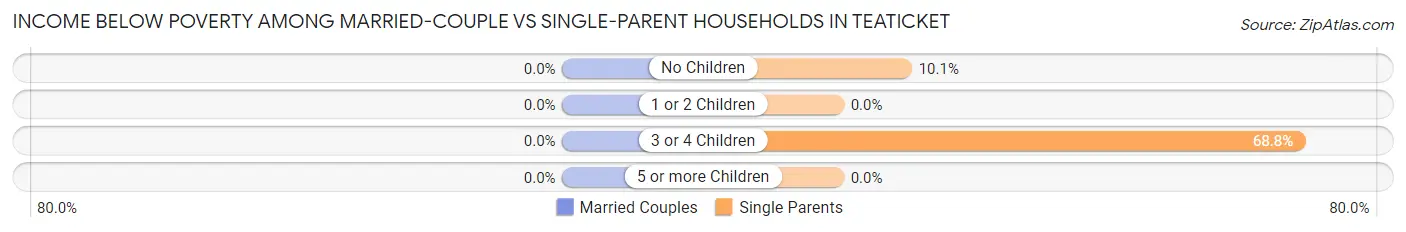
| Children | Married-Couple Families | Single-Parent Households |
| No Children | 0 (0.0%) | 7 (10.1%) |
| 1 or 2 Children | 0 (0.0%) | 0 (0.0%) |
| 3 or 4 Children | 0 (0.0%) | 11 (68.8%) |
| 5 or more Children | 0 (0.0%) | 0 (0.0%) |
| Total | 0 (0.0%) | 18 (14.6%) |
Race in Teaticket
The most populous races in Teaticket are White / Caucasian (1,339 | 85.8%), Black / African American (102 | 6.5%), and Two or more Races (84 | 5.4%).
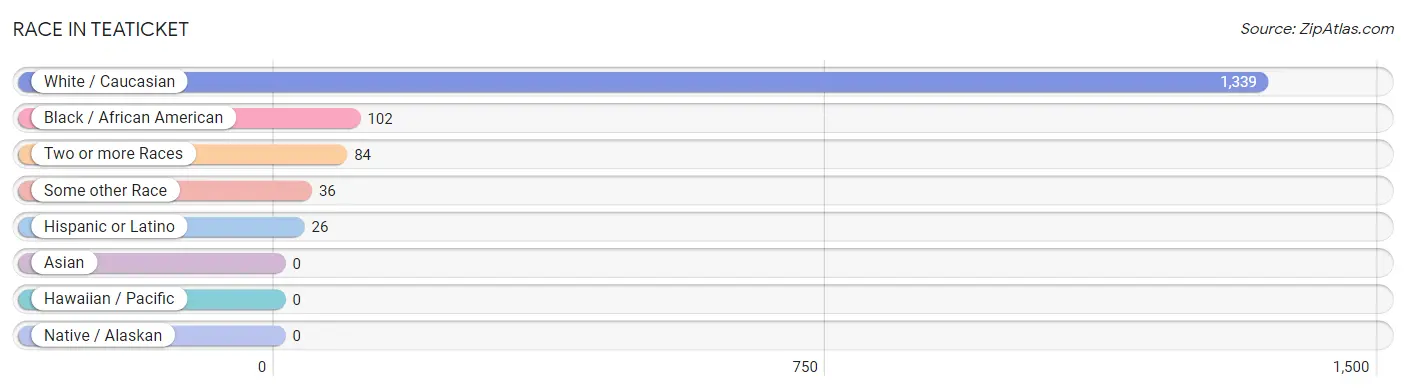
| Race | # Population | % Population |
| Asian | 0 | 0.0% |
| Black / African American | 102 | 6.5% |
| Hawaiian / Pacific | 0 | 0.0% |
| Hispanic or Latino | 26 | 1.7% |
| Native / Alaskan | 0 | 0.0% |
| White / Caucasian | 1,339 | 85.8% |
| Two or more Races | 84 | 5.4% |
| Some other Race | 36 | 2.3% |
| Total | 1,561 | 100.0% |
Ancestry in Teaticket
The most populous ancestries reported in Teaticket are Irish (594 | 38.1%), Italian (189 | 12.1%), English (127 | 8.1%), American (120 | 7.7%), and Jamaican (102 | 6.5%), together accounting for 72.5% of all Teaticket residents.
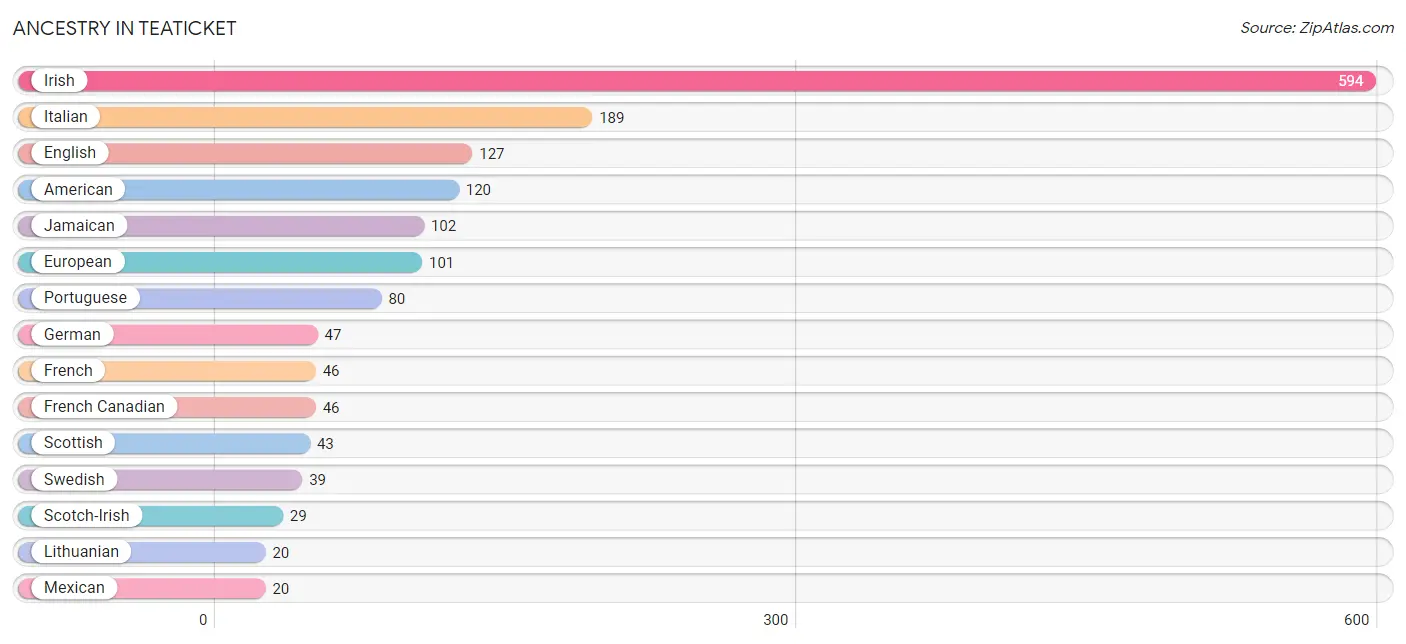
| Ancestry | # Population | % Population |
| American | 120 | 7.7% |
| Arab | 7 | 0.4% |
| Burmese | 13 | 0.8% |
| Colombian | 6 | 0.4% |
| Danish | 7 | 0.4% |
| Eastern European | 19 | 1.2% |
| English | 127 | 8.1% |
| European | 101 | 6.5% |
| French | 46 | 2.9% |
| French Canadian | 46 | 2.9% |
| German | 47 | 3.0% |
| Indian (Asian) | 18 | 1.1% |
| Irish | 594 | 38.1% |
| Italian | 189 | 12.1% |
| Jamaican | 102 | 6.5% |
| Lithuanian | 20 | 1.3% |
| Mexican | 20 | 1.3% |
| Norwegian | 16 | 1.0% |
| Polish | 14 | 0.9% |
| Portuguese | 80 | 5.1% |
| Russian | 14 | 0.9% |
| Scotch-Irish | 29 | 1.9% |
| Scottish | 43 | 2.8% |
| South American | 6 | 0.4% |
| Swedish | 39 | 2.5% |
| Syrian | 7 | 0.4% |
| Ukrainian | 18 | 1.1% | View All 27 Rows |
Immigrants in Teaticket
The most numerous immigrant groups reported in Teaticket came from Latin America (70 | 4.5%), Caribbean (64 | 4.1%), Jamaica (64 | 4.1%), Europe (39 | 2.5%), and Southern Europe (31 | 2.0%), together accounting for 17.2% of all Teaticket residents.
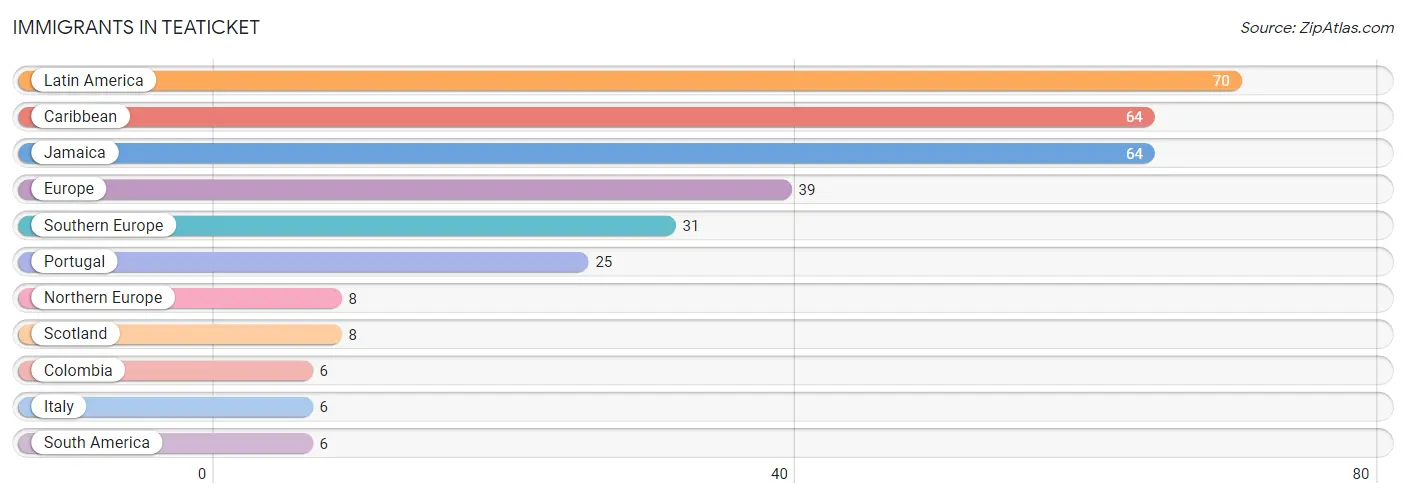
| Immigration Origin | # Population | % Population |
| Caribbean | 64 | 4.1% |
| Colombia | 6 | 0.4% |
| Europe | 39 | 2.5% |
| Italy | 6 | 0.4% |
| Jamaica | 64 | 4.1% |
| Latin America | 70 | 4.5% |
| Northern Europe | 8 | 0.5% |
| Portugal | 25 | 1.6% |
| Scotland | 8 | 0.5% |
| South America | 6 | 0.4% |
| Southern Europe | 31 | 2.0% | View All 11 Rows |
Sex and Age in Teaticket
Sex and Age in Teaticket
The most populous age groups in Teaticket are 70 to 74 Years (123 | 16.5%) for men and 70 to 74 Years (133 | 16.3%) for women.
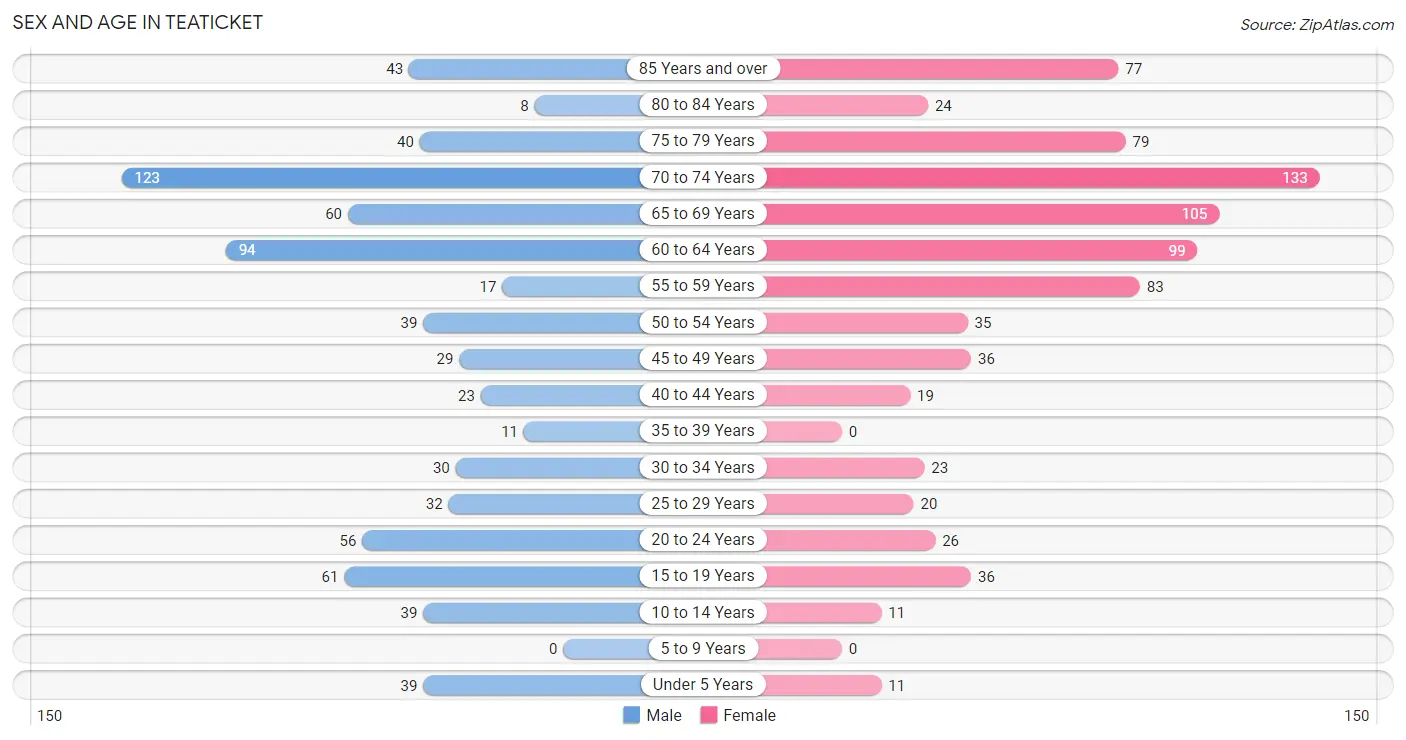
| Age Bracket | Male | Female |
| Under 5 Years | 39 (5.2%) | 11 (1.3%) |
| 5 to 9 Years | 0 (0.0%) | 0 (0.0%) |
| 10 to 14 Years | 39 (5.2%) | 11 (1.3%) |
| 15 to 19 Years | 61 (8.2%) | 36 (4.4%) |
| 20 to 24 Years | 56 (7.5%) | 26 (3.2%) |
| 25 to 29 Years | 32 (4.3%) | 20 (2.5%) |
| 30 to 34 Years | 30 (4.0%) | 23 (2.8%) |
| 35 to 39 Years | 11 (1.5%) | 0 (0.0%) |
| 40 to 44 Years | 23 (3.1%) | 19 (2.3%) |
| 45 to 49 Years | 29 (3.9%) | 36 (4.4%) |
| 50 to 54 Years | 39 (5.2%) | 35 (4.3%) |
| 55 to 59 Years | 17 (2.3%) | 83 (10.2%) |
| 60 to 64 Years | 94 (12.6%) | 99 (12.1%) |
| 65 to 69 Years | 60 (8.1%) | 105 (12.9%) |
| 70 to 74 Years | 123 (16.5%) | 133 (16.3%) |
| 75 to 79 Years | 40 (5.4%) | 79 (9.7%) |
| 80 to 84 Years | 8 (1.1%) | 24 (2.9%) |
| 85 Years and over | 43 (5.8%) | 77 (9.4%) |
| Total | 744 (100.0%) | 817 (100.0%) |
Families and Households in Teaticket
Median Family Size in Teaticket
The median family size in Teaticket is 2.71 persons per family, with single male/father families (7 | 1.6%) accounting for the largest median family size of 3.57 persons per family. On the other hand, married-couple families (303 | 71.1%) represent the smallest median family size with 2.39 persons per family.
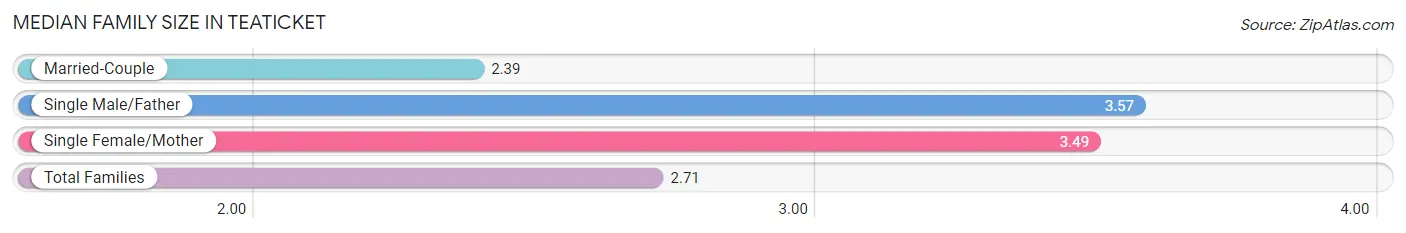
| Family Type | # Families | Family Size |
| Married-Couple | 303 (71.1%) | 2.39 |
| Single Male/Father | 7 (1.6%) | 3.57 |
| Single Female/Mother | 116 (27.2%) | 3.49 |
| Total Families | 426 (100.0%) | 2.71 |
Median Household Size in Teaticket
The median household size in Teaticket is 2.03 persons per household, with single male/father households (7 | 0.9%) accounting for the largest median household size of 3.57 persons per household. non-family households (342 | 44.5%) represent the smallest median household size with 1.19 persons per household.
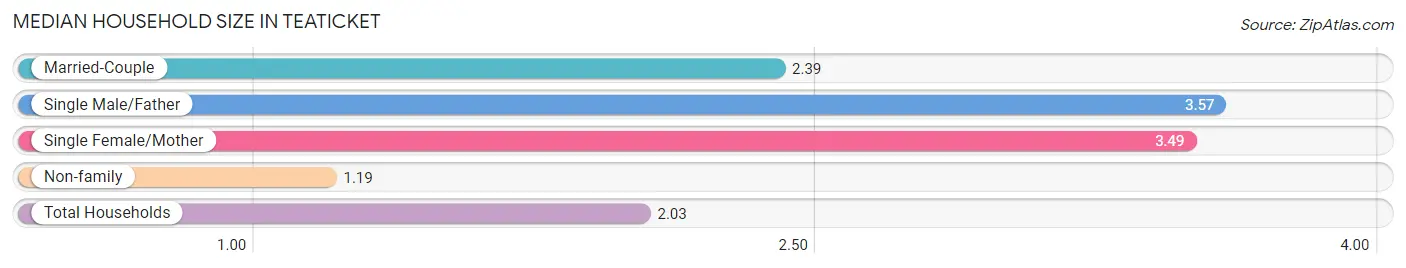
| Household Type | # Households | Household Size |
| Married-Couple | 303 (39.5%) | 2.39 |
| Single Male/Father | 7 (0.9%) | 3.57 |
| Single Female/Mother | 116 (15.1%) | 3.49 |
| Non-family | 342 (44.5%) | 1.19 |
| Total Households | 768 (100.0%) | 2.03 |
Household Size by Marriage Status in Teaticket
Out of a total of 768 households in Teaticket, 426 (55.5%) are family households, while 342 (44.5%) are nonfamily households. The most numerous type of family households are 2-person households, comprising 308, and the most common type of nonfamily households are 1-person households, comprising 292.
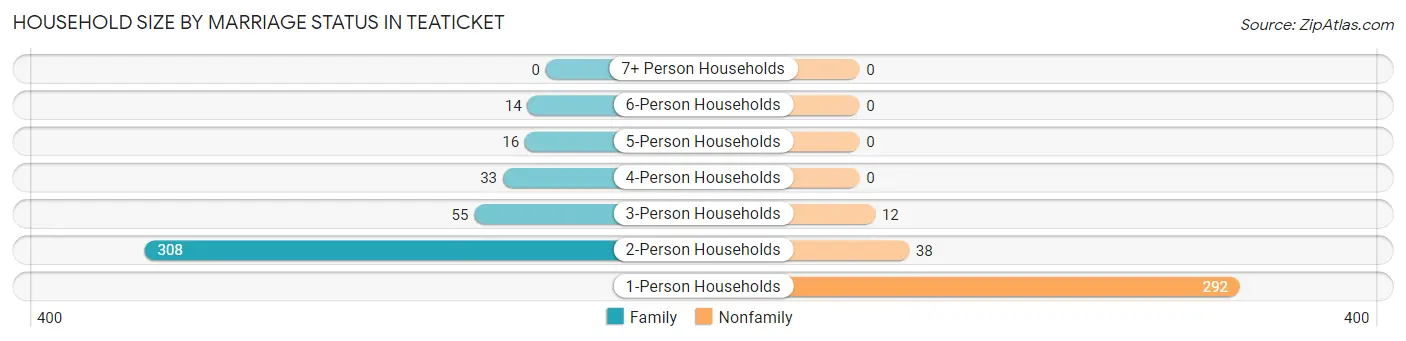
| Household Size | Family Households | Nonfamily Households |
| 1-Person Households | - | 292 (38.0%) |
| 2-Person Households | 308 (40.1%) | 38 (5.0%) |
| 3-Person Households | 55 (7.2%) | 12 (1.6%) |
| 4-Person Households | 33 (4.3%) | 0 (0.0%) |
| 5-Person Households | 16 (2.1%) | 0 (0.0%) |
| 6-Person Households | 14 (1.8%) | 0 (0.0%) |
| 7+ Person Households | 0 (0.0%) | 0 (0.0%) |
| Total | 426 (55.5%) | 342 (44.5%) |
Female Fertility in Teaticket
Fertility by Age in Teaticket
| Age Bracket | Women with Births | Births / 1,000 Women |
| 15 to 19 years | 0 (0.0%) | 0.0 |
| 20 to 34 years | 0 (0.0%) | 0.0 |
| 35 to 50 years | 0 (0.0%) | 0.0 |
| Total | 0 (0.0%) | 0.0 |
Fertility by Age by Marriage Status in Teaticket
| Age Bracket | Married | Unmarried |
| 15 to 19 years | 0 (0.0%) | 0 (0.0%) |
| 20 to 34 years | 0 (0.0%) | 0 (0.0%) |
| 35 to 50 years | 0 (0.0%) | 0 (0.0%) |
| Total | 0 (0.0%) | 0 (0.0%) |
Fertility by Education in Teaticket
| Educational Attainment | Women with Births | Births / 1,000 Women |
| Less than High School | 0 (0.0%) | 0.0 |
| High School Diploma | 0 (0.0%) | 0.0 |
| College or Associate's Degree | 0 (0.0%) | 0.0 |
| Bachelor's Degree | 0 (0.0%) | 0.0 |
| Graduate Degree | 0 (0.0%) | 0.0 |
| Total | 0 (0.0%) | 0.0 |
Fertility by Education by Marriage Status in Teaticket
| Educational Attainment | Married | Unmarried |
| Less than High School | 0 (0.0%) | 0 (0.0%) |
| High School Diploma | 0 (0.0%) | 0 (0.0%) |
| College or Associate's Degree | 0 (0.0%) | 0 (0.0%) |
| Bachelor's Degree | 0 (0.0%) | 0 (0.0%) |
| Graduate Degree | 0 (0.0%) | 0 (0.0%) |
| Total | 0 (0.0%) | 0 (0.0%) |
Employment Characteristics in Teaticket
Employment by Class of Employer in Teaticket
Among the 727 employed individuals in Teaticket, private company employees (395 | 54.3%), not-for-profit organizations (136 | 18.7%), and self-employed (incorporated) (54 | 7.4%) make up the most common classes of employment.
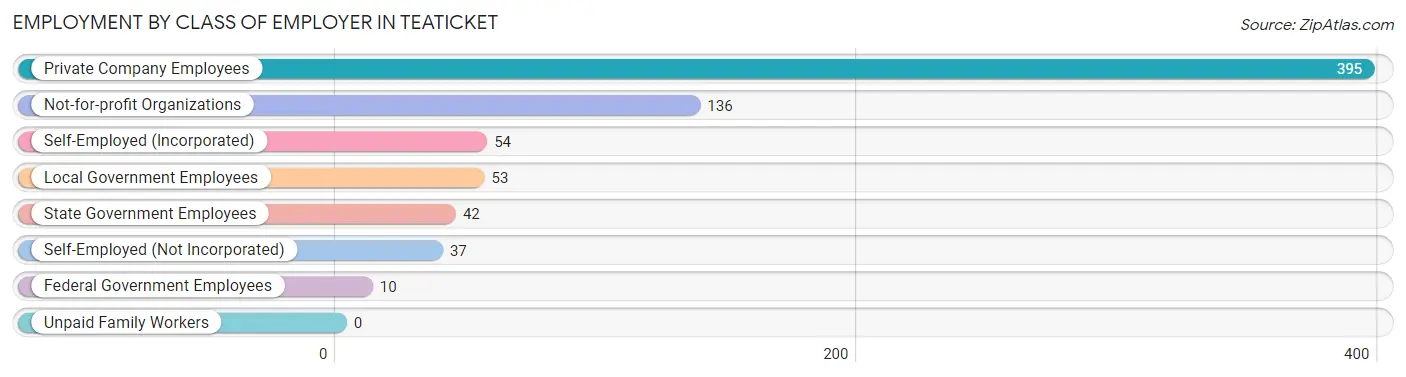
| Employer Class | # Employees | % Employees |
| Private Company Employees | 395 | 54.3% |
| Self-Employed (Incorporated) | 54 | 7.4% |
| Self-Employed (Not Incorporated) | 37 | 5.1% |
| Not-for-profit Organizations | 136 | 18.7% |
| Local Government Employees | 53 | 7.3% |
| State Government Employees | 42 | 5.8% |
| Federal Government Employees | 10 | 1.4% |
| Unpaid Family Workers | 0 | 0.0% |
| Total | 727 | 100.0% |
Employment Status by Age in Teaticket
According to the labor force statistics for Teaticket, out of the total population over 16 years of age (1,456), 50.6% or 737 individuals are in the labor force, with 1.4% or 10 of them unemployed. The age group with the highest labor force participation rate is 20 to 24 years, with 100.0% or 82 individuals in the labor force. Within the labor force, the 25 to 29 years age range has the highest percentage of unemployed individuals, with 23.8% or 12 of them being unemployed.
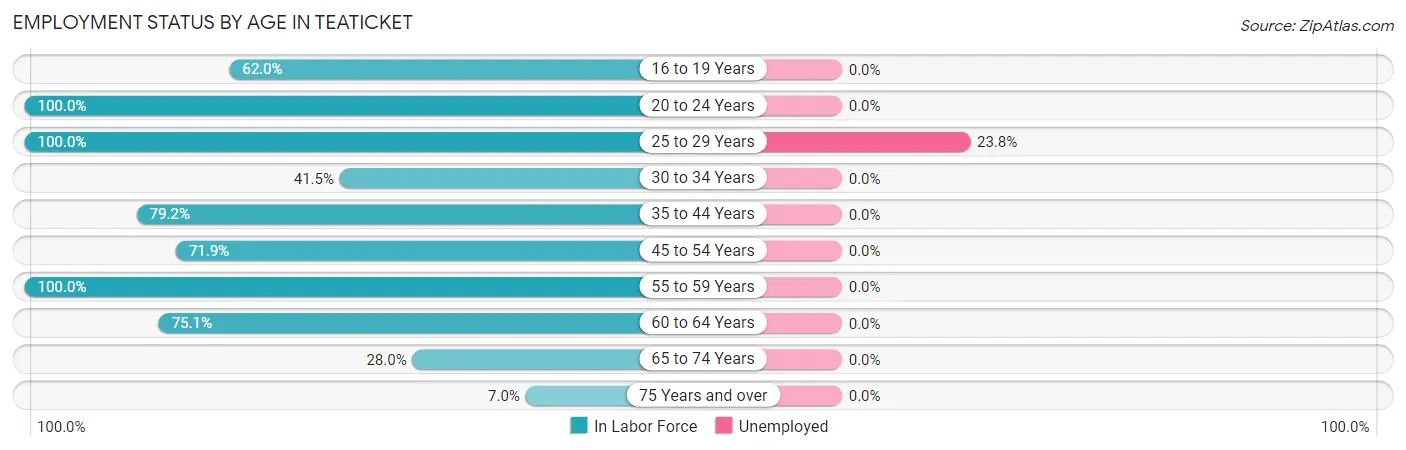
| Age Bracket | In Labor Force | Unemployed |
| 16 to 19 Years | 57 (62.0%) | 0 (0.0%) |
| 20 to 24 Years | 82 (100.0%) | 0 (0.0%) |
| 25 to 29 Years | 52 (100.0%) | 12 (23.8%) |
| 30 to 34 Years | 22 (41.5%) | 0 (0.0%) |
| 35 to 44 Years | 42 (79.2%) | 0 (0.0%) |
| 45 to 54 Years | 100 (71.9%) | 0 (0.0%) |
| 55 to 59 Years | 100 (100.0%) | 0 (0.0%) |
| 60 to 64 Years | 145 (75.1%) | 0 (0.0%) |
| 65 to 74 Years | 118 (28.0%) | 0 (0.0%) |
| 75 Years and over | 19 (7.0%) | 0 (0.0%) |
| Total | 737 (50.6%) | 10 (1.4%) |
Employment Status by Educational Attainment in Teaticket
According to labor force statistics for Teaticket, 78.1% of individuals (461) out of the total population between 25 and 64 years of age (590) are in the labor force, with 2.2% or 10 of them being unemployed. The group with the highest labor force participation rate are those with the educational attainment of less than high school, with 100.0% or 10 individuals in the labor force. Within the labor force, individuals with bachelor's degree or higher education have the highest percentage of unemployment, with 4.5% or 10 of them being unemployed.
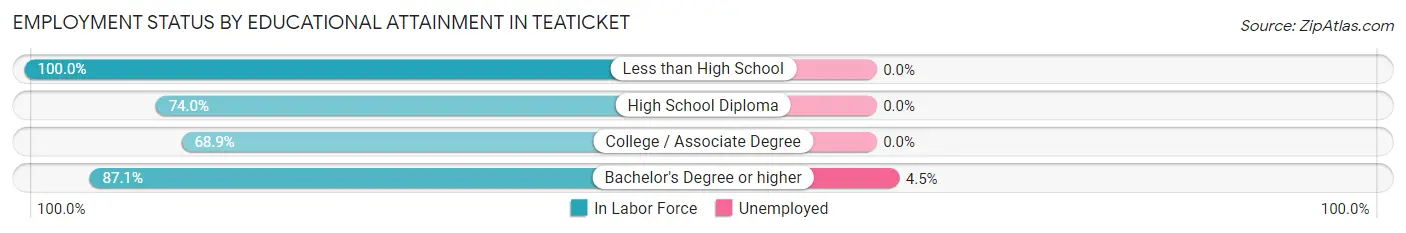
| Educational Attainment | In Labor Force | Unemployed |
| Less than High School | 10 (100.0%) | 0 (0.0%) |
| High School Diploma | 74 (74.0%) | 0 (0.0%) |
| College / Associate Degree | 155 (68.9%) | 0 (0.0%) |
| Bachelor's Degree or higher | 222 (87.1%) | 11 (4.5%) |
| Total | 461 (78.1%) | 13 (2.2%) |
Employment Occupations by Sex in Teaticket
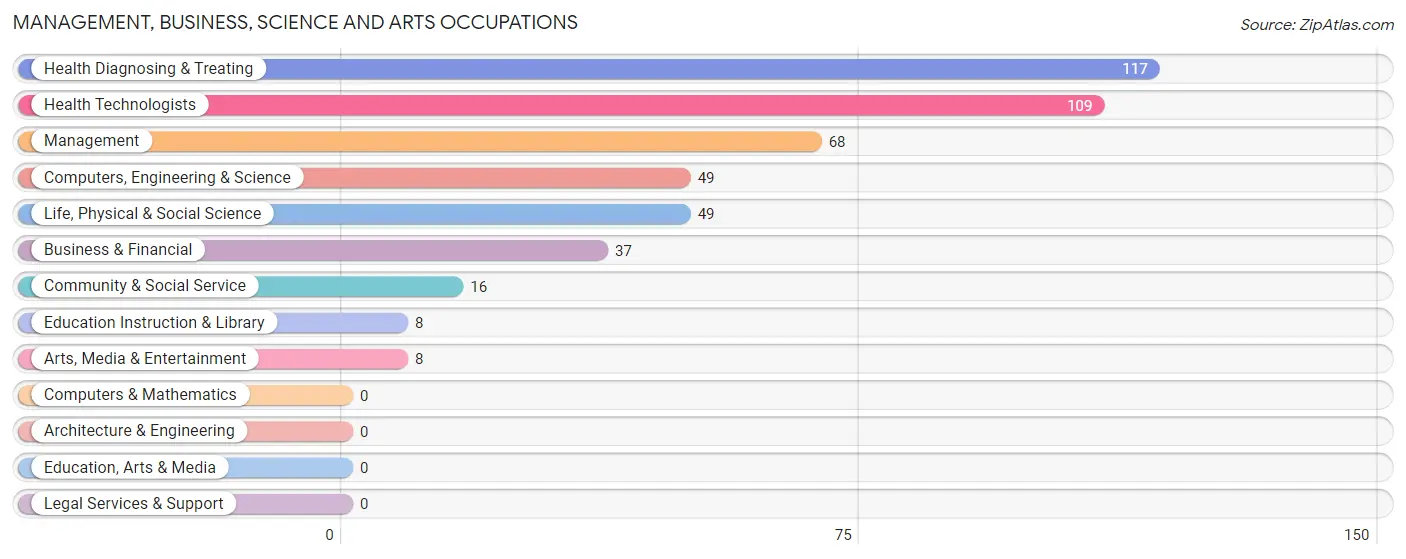
Management, Business, Science and Arts Occupations
The most common Management, Business, Science and Arts occupations in Teaticket are Health Diagnosing & Treating (117 | 16.3%), Health Technologists (109 | 15.2%), Management (68 | 9.5%), Computers, Engineering & Science (49 | 6.8%), and Life, Physical & Social Science (49 | 6.8%).
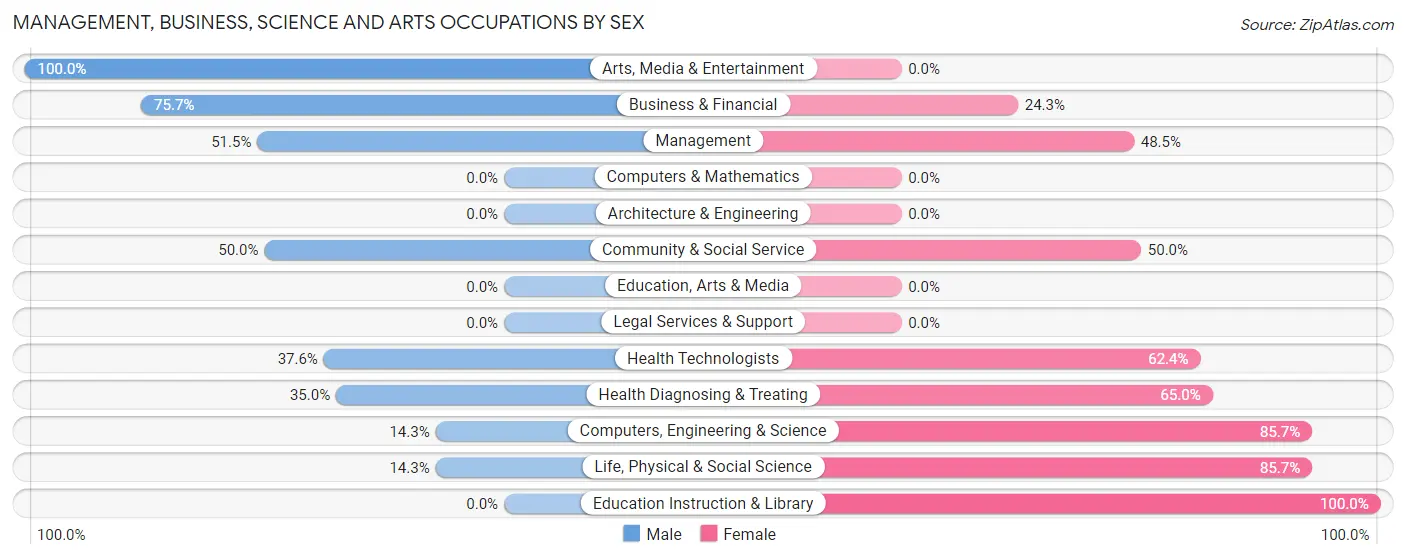
Management, Business, Science and Arts Occupations by Sex
Within the Management, Business, Science and Arts occupations in Teaticket, the most male-oriented occupations are Arts, Media & Entertainment (100.0%), Business & Financial (75.7%), and Management (51.5%), while the most female-oriented occupations are Education Instruction & Library (100.0%), Computers, Engineering & Science (85.7%), and Life, Physical & Social Science (85.7%).
| Occupation | Male | Female |
| Management | 35 (51.5%) | 33 (48.5%) |
| Business & Financial | 28 (75.7%) | 9 (24.3%) |
| Computers, Engineering & Science | 7 (14.3%) | 42 (85.7%) |
| Computers & Mathematics | 0 (0.0%) | 0 (0.0%) |
| Architecture & Engineering | 0 (0.0%) | 0 (0.0%) |
| Life, Physical & Social Science | 7 (14.3%) | 42 (85.7%) |
| Community & Social Service | 8 (50.0%) | 8 (50.0%) |
| Education, Arts & Media | 0 (0.0%) | 0 (0.0%) |
| Legal Services & Support | 0 (0.0%) | 0 (0.0%) |
| Education Instruction & Library | 0 (0.0%) | 8 (100.0%) |
| Arts, Media & Entertainment | 8 (100.0%) | 0 (0.0%) |
| Health Diagnosing & Treating | 41 (35.0%) | 76 (65.0%) |
| Health Technologists | 41 (37.6%) | 68 (62.4%) |
| Total (Category) | 119 (41.5%) | 168 (58.5%) |
| Total (Overall) | 379 (52.9%) | 338 (47.1%) |
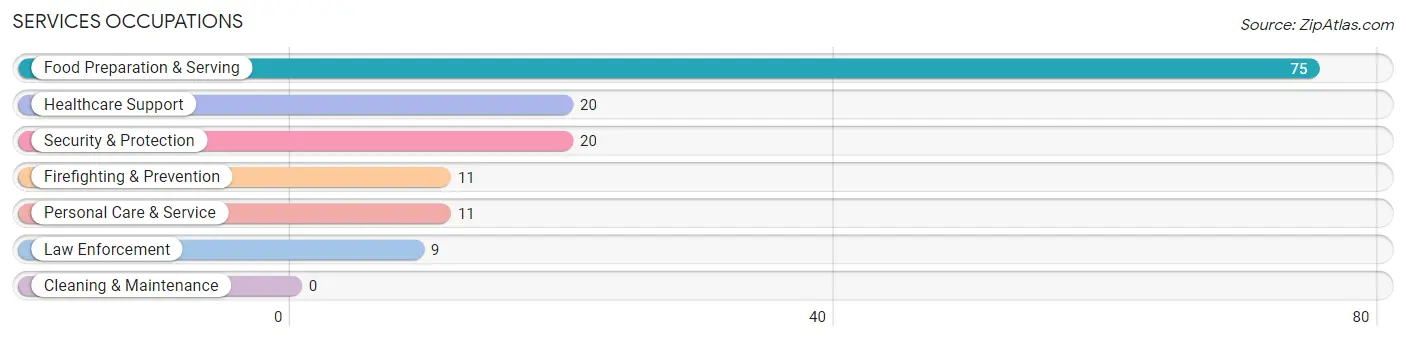
Services Occupations
The most common Services occupations in Teaticket are Food Preparation & Serving (75 | 10.5%), Healthcare Support (20 | 2.8%), Security & Protection (20 | 2.8%), Firefighting & Prevention (11 | 1.5%), and Personal Care & Service (11 | 1.5%).
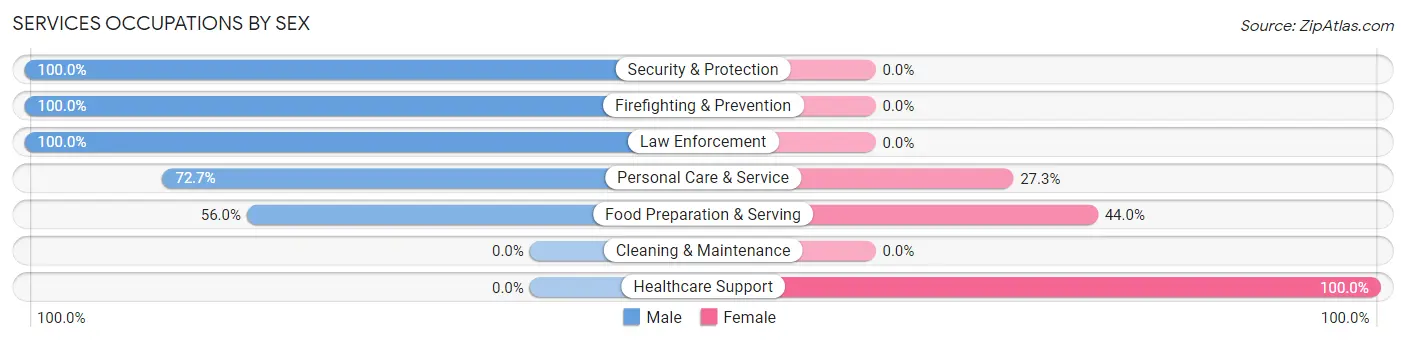
Services Occupations by Sex
Within the Services occupations in Teaticket, the most male-oriented occupations are Security & Protection (100.0%), Firefighting & Prevention (100.0%), and Law Enforcement (100.0%), while the most female-oriented occupations are Healthcare Support (100.0%), Food Preparation & Serving (44.0%), and Personal Care & Service (27.3%).
| Occupation | Male | Female |
| Healthcare Support | 0 (0.0%) | 20 (100.0%) |
| Security & Protection | 20 (100.0%) | 0 (0.0%) |
| Firefighting & Prevention | 11 (100.0%) | 0 (0.0%) |
| Law Enforcement | 9 (100.0%) | 0 (0.0%) |
| Food Preparation & Serving | 42 (56.0%) | 33 (44.0%) |
| Cleaning & Maintenance | 0 (0.0%) | 0 (0.0%) |
| Personal Care & Service | 8 (72.7%) | 3 (27.3%) |
| Total (Category) | 70 (55.6%) | 56 (44.4%) |
| Total (Overall) | 379 (52.9%) | 338 (47.1%) |
Sales and Office Occupations
The most common Sales and Office occupations in Teaticket are Sales & Related (109 | 15.2%), and Office & Administration (71 | 9.9%).
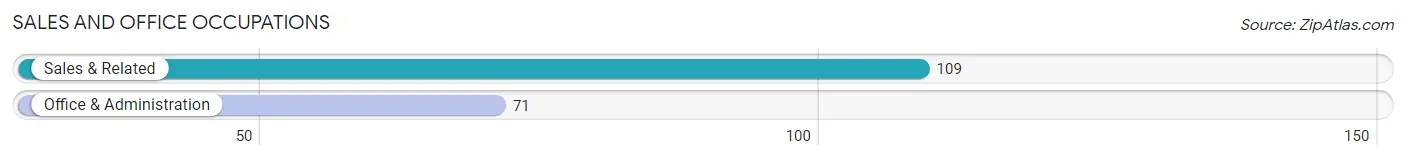
Sales and Office Occupations by Sex
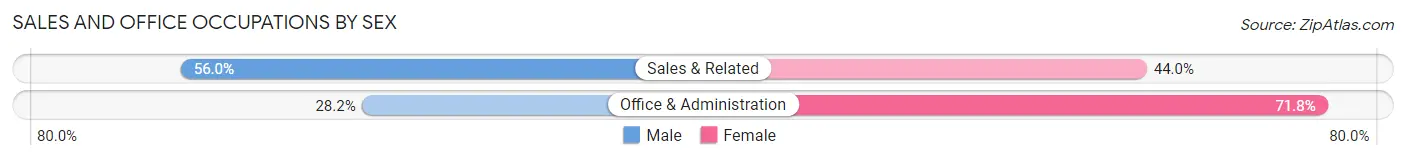
| Occupation | Male | Female |
| Sales & Related | 61 (56.0%) | 48 (44.0%) |
| Office & Administration | 20 (28.2%) | 51 (71.8%) |
| Total (Category) | 81 (45.0%) | 99 (55.0%) |
| Total (Overall) | 379 (52.9%) | 338 (47.1%) |
Natural Resources, Construction and Maintenance Occupations
The most common Natural Resources, Construction and Maintenance occupations in Teaticket are Construction & Extraction (35 | 4.9%), and Installation, Maintenance & Repair (29 | 4.0%).
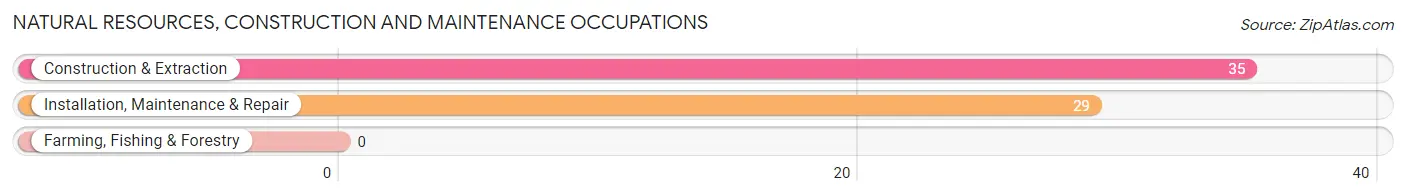
Natural Resources, Construction and Maintenance Occupations by Sex
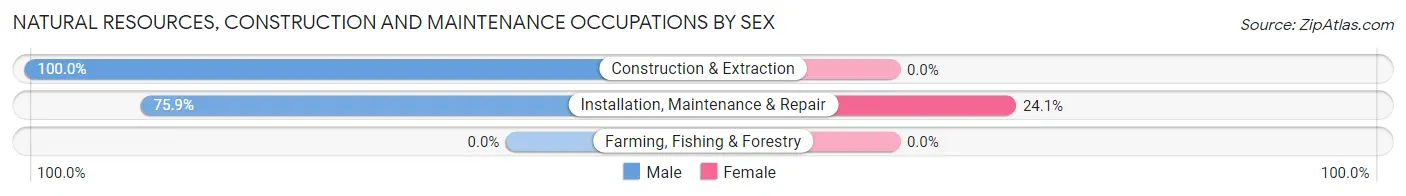
| Occupation | Male | Female |
| Farming, Fishing & Forestry | 0 (0.0%) | 0 (0.0%) |
| Construction & Extraction | 35 (100.0%) | 0 (0.0%) |
| Installation, Maintenance & Repair | 22 (75.9%) | 7 (24.1%) |
| Total (Category) | 57 (89.1%) | 7 (10.9%) |
| Total (Overall) | 379 (52.9%) | 338 (47.1%) |
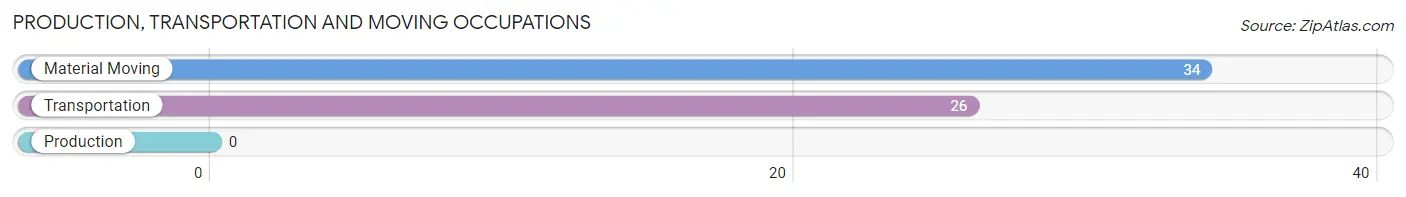
Production, Transportation and Moving Occupations
The most common Production, Transportation and Moving occupations in Teaticket are Material Moving (34 | 4.7%), and Transportation (26 | 3.6%).
Production, Transportation and Moving Occupations by Sex
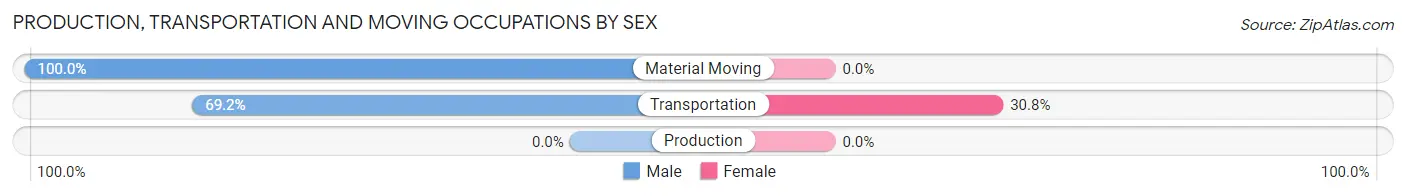
| Occupation | Male | Female |
| Production | 0 (0.0%) | 0 (0.0%) |
| Transportation | 18 (69.2%) | 8 (30.8%) |
| Material Moving | 34 (100.0%) | 0 (0.0%) |
| Total (Category) | 52 (86.7%) | 8 (13.3%) |
| Total (Overall) | 379 (52.9%) | 338 (47.1%) |
Employment Industries by Sex in Teaticket
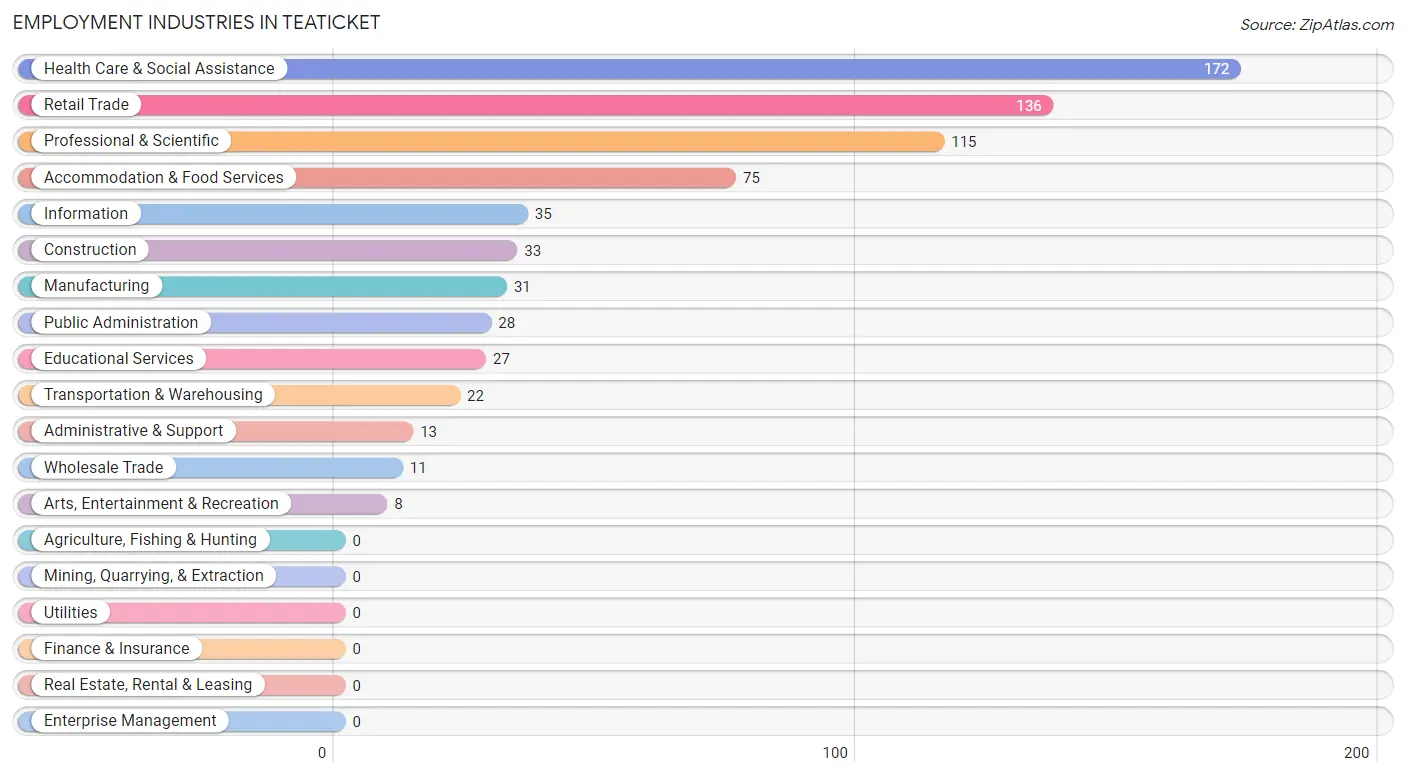
Employment Industries in Teaticket
The major employment industries in Teaticket include Health Care & Social Assistance (172 | 24.0%), Retail Trade (136 | 19.0%), Professional & Scientific (115 | 16.0%), Accommodation & Food Services (75 | 10.5%), and Information (35 | 4.9%).
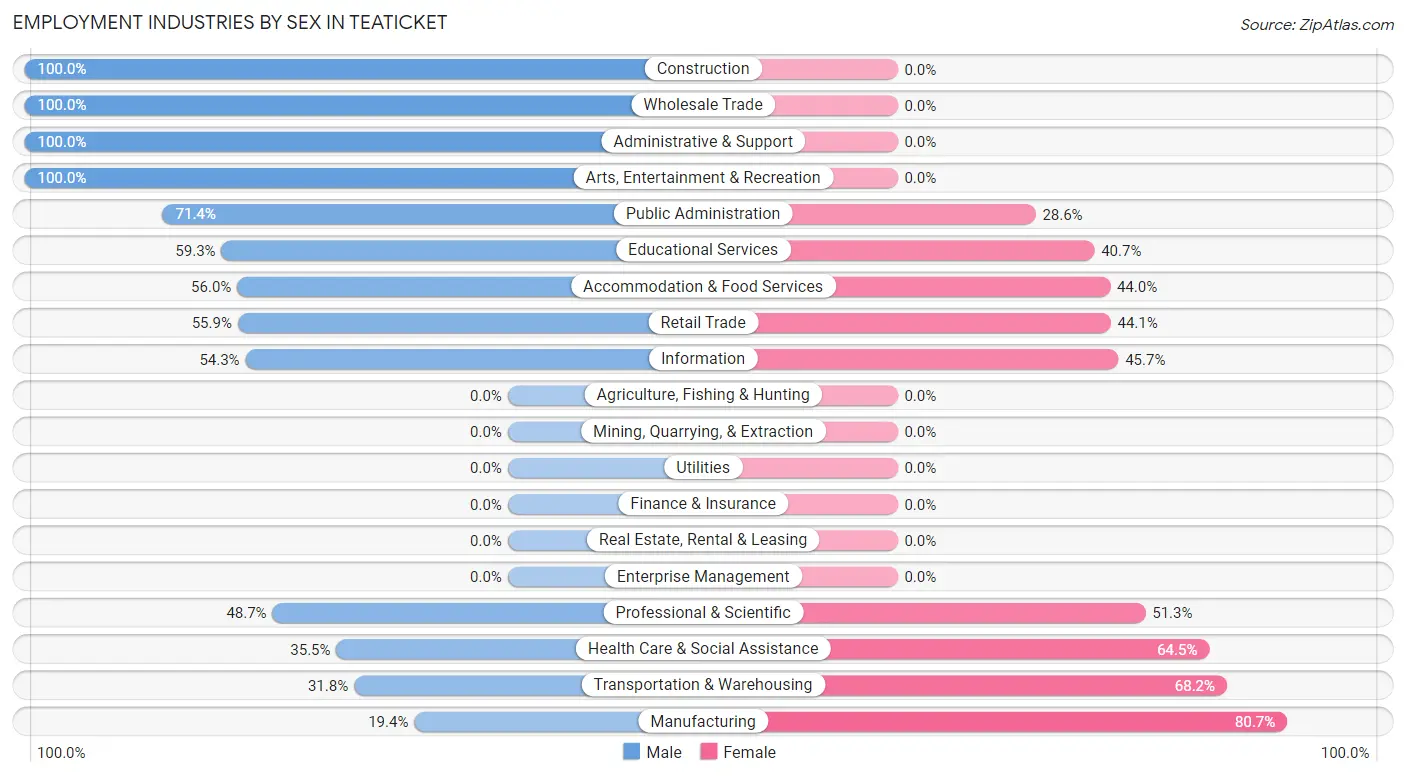
Employment Industries by Sex in Teaticket
The Teaticket industries that see more men than women are Construction (100.0%), Wholesale Trade (100.0%), and Administrative & Support (100.0%), whereas the industries that tend to have a higher number of women are Manufacturing (80.6%), Transportation & Warehousing (68.2%), and Health Care & Social Assistance (64.5%).
| Industry | Male | Female |
| Agriculture, Fishing & Hunting | 0 (0.0%) | 0 (0.0%) |
| Mining, Quarrying, & Extraction | 0 (0.0%) | 0 (0.0%) |
| Construction | 33 (100.0%) | 0 (0.0%) |
| Manufacturing | 6 (19.4%) | 25 (80.6%) |
| Wholesale Trade | 11 (100.0%) | 0 (0.0%) |
| Retail Trade | 76 (55.9%) | 60 (44.1%) |
| Transportation & Warehousing | 7 (31.8%) | 15 (68.2%) |
| Utilities | 0 (0.0%) | 0 (0.0%) |
| Information | 19 (54.3%) | 16 (45.7%) |
| Finance & Insurance | 0 (0.0%) | 0 (0.0%) |
| Real Estate, Rental & Leasing | 0 (0.0%) | 0 (0.0%) |
| Professional & Scientific | 56 (48.7%) | 59 (51.3%) |
| Enterprise Management | 0 (0.0%) | 0 (0.0%) |
| Administrative & Support | 13 (100.0%) | 0 (0.0%) |
| Educational Services | 16 (59.3%) | 11 (40.7%) |
| Health Care & Social Assistance | 61 (35.5%) | 111 (64.5%) |
| Arts, Entertainment & Recreation | 8 (100.0%) | 0 (0.0%) |
| Accommodation & Food Services | 42 (56.0%) | 33 (44.0%) |
| Public Administration | 20 (71.4%) | 8 (28.6%) |
| Total | 379 (52.9%) | 338 (47.1%) |
Education in Teaticket
School Enrollment in Teaticket
The most common levels of schooling among the 204 students in Teaticket are high school (68 | 33.3%), middle school (42 | 20.6%), and nursery / preschool (39 | 19.1%).
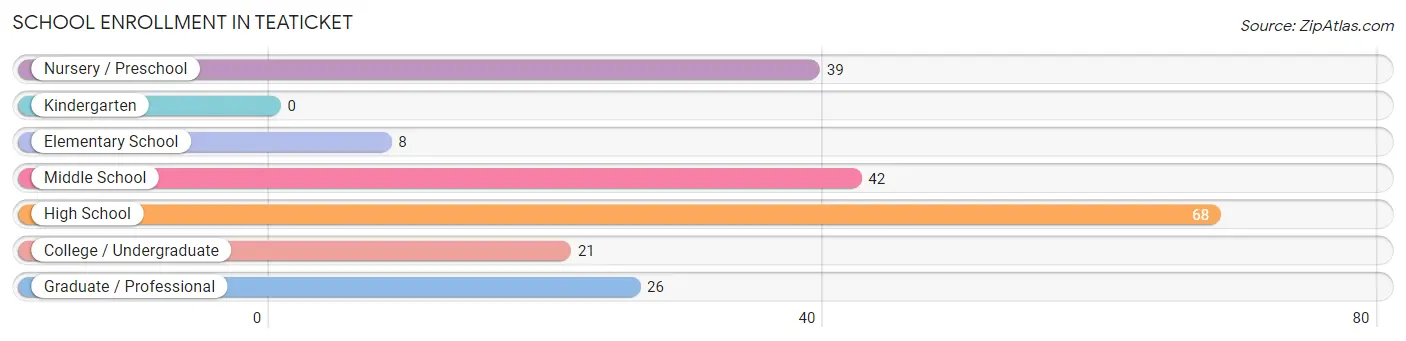
| School Level | # Students | % Students |
| Nursery / Preschool | 39 | 19.1% |
| Kindergarten | 0 | 0.0% |
| Elementary School | 8 | 3.9% |
| Middle School | 42 | 20.6% |
| High School | 68 | 33.3% |
| College / Undergraduate | 21 | 10.3% |
| Graduate / Professional | 26 | 12.8% |
| Total | 204 | 100.0% |
School Enrollment by Age by Funding Source in Teaticket
Out of a total of 204 students who are enrolled in schools in Teaticket, 59 (28.9%) attend a private institution, while the remaining 145 (71.1%) are enrolled in public schools. The age group of 35 years and over has the highest likelihood of being enrolled in private schools, with 26 (70.3% in the age bracket) enrolled. Conversely, the age group of 10 to 14 year olds has the lowest likelihood of being enrolled in a private school, with 50 (100.0% in the age bracket) attending a public institution.
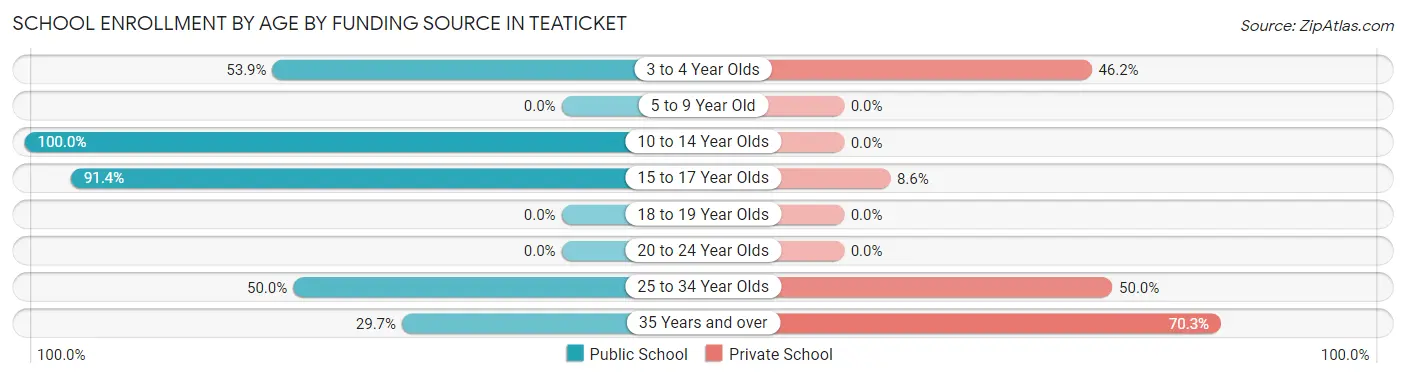
| Age Bracket | Public School | Private School |
| 3 to 4 Year Olds | 21 (53.8%) | 18 (46.2%) |
| 5 to 9 Year Old | 0 (0.0%) | 0 (0.0%) |
| 10 to 14 Year Olds | 50 (100.0%) | 0 (0.0%) |
| 15 to 17 Year Olds | 53 (91.4%) | 5 (8.6%) |
| 18 to 19 Year Olds | 0 (0.0%) | 0 (0.0%) |
| 20 to 24 Year Olds | 0 (0.0%) | 0 (0.0%) |
| 25 to 34 Year Olds | 10 (50.0%) | 10 (50.0%) |
| 35 Years and over | 11 (29.7%) | 26 (70.3%) |
| Total | 145 (71.1%) | 59 (28.9%) |
Educational Attainment by Field of Study in Teaticket
Education (104 | 17.4%), business (94 | 15.8%), science & technology (80 | 13.4%), bio, nature & agricultural (77 | 12.9%), and social sciences (67 | 11.2%) are the most common fields of study among 597 individuals in Teaticket who have obtained a bachelor's degree or higher.
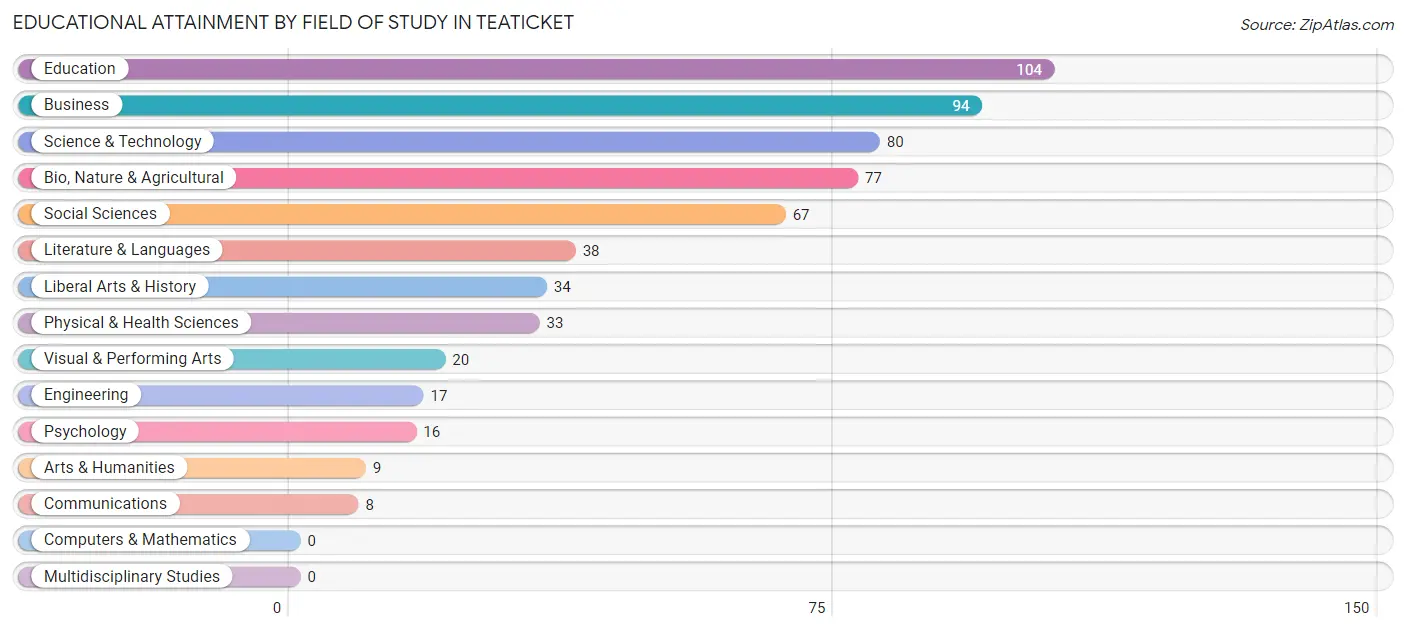
| Field of Study | # Graduates | % Graduates |
| Computers & Mathematics | 0 | 0.0% |
| Bio, Nature & Agricultural | 77 | 12.9% |
| Physical & Health Sciences | 33 | 5.5% |
| Psychology | 16 | 2.7% |
| Social Sciences | 67 | 11.2% |
| Engineering | 17 | 2.9% |
| Multidisciplinary Studies | 0 | 0.0% |
| Science & Technology | 80 | 13.4% |
| Business | 94 | 15.8% |
| Education | 104 | 17.4% |
| Literature & Languages | 38 | 6.4% |
| Liberal Arts & History | 34 | 5.7% |
| Visual & Performing Arts | 20 | 3.4% |
| Communications | 8 | 1.3% |
| Arts & Humanities | 9 | 1.5% |
| Total | 597 | 100.0% |
Transportation & Commute in Teaticket
Vehicle Availability by Sex in Teaticket
The most prevalent vehicle ownership categories in Teaticket are males with 3 vehicles (158, accounting for 41.7%) and females with 3 vehicles (145, making up 45.4%).
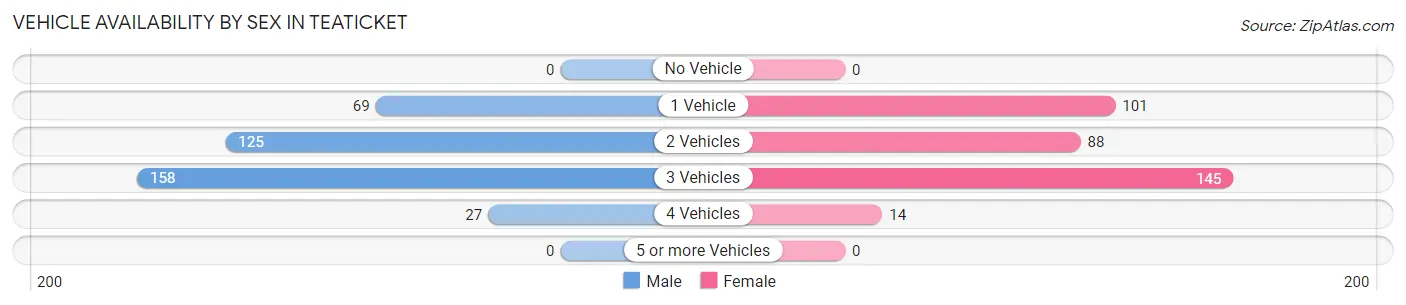
| Vehicles Available | Male | Female |
| No Vehicle | 0 (0.0%) | 0 (0.0%) |
| 1 Vehicle | 69 (18.2%) | 101 (29.0%) |
| 2 Vehicles | 125 (33.0%) | 88 (25.3%) |
| 3 Vehicles | 158 (41.7%) | 145 (41.7%) |
| 4 Vehicles | 27 (7.1%) | 14 (4.0%) |
| 5 or more Vehicles | 0 (0.0%) | 0 (0.0%) |
| Total | 379 (100.0%) | 348 (100.0%) |
Commute Time in Teaticket
The most frequently occuring commute durations in Teaticket are 15 to 19 minutes (145 commuters, 27.6%), 10 to 14 minutes (93 commuters, 17.7%), and 45 to 59 minutes (53 commuters, 10.1%).
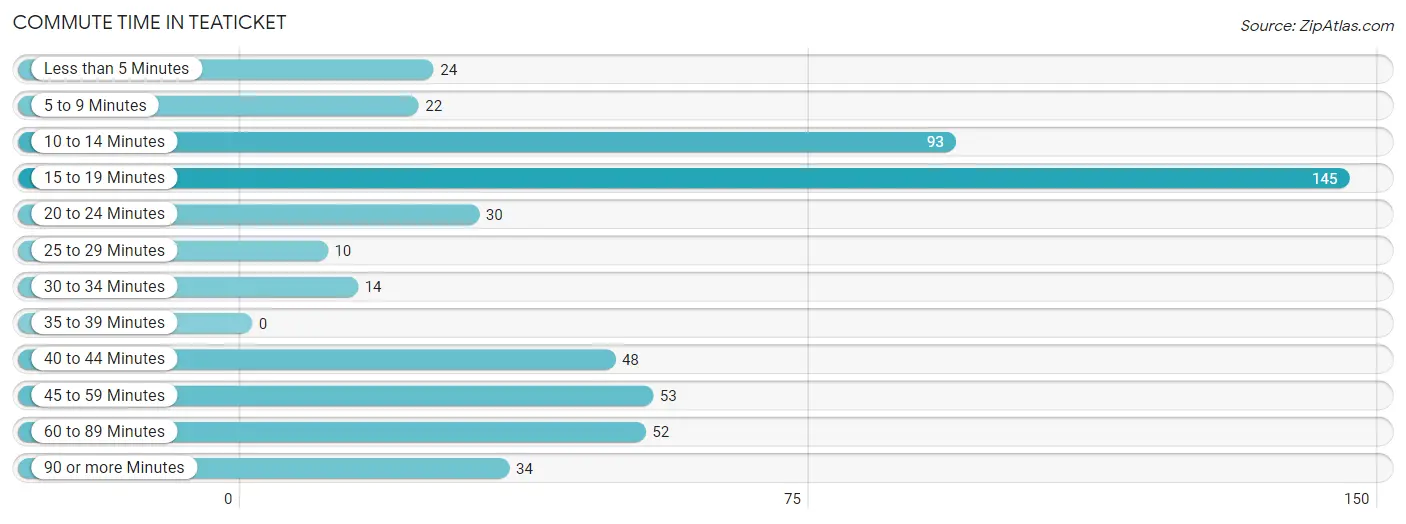
| Commute Time | # Commuters | % Commuters |
| Less than 5 Minutes | 24 | 4.6% |
| 5 to 9 Minutes | 22 | 4.2% |
| 10 to 14 Minutes | 93 | 17.7% |
| 15 to 19 Minutes | 145 | 27.6% |
| 20 to 24 Minutes | 30 | 5.7% |
| 25 to 29 Minutes | 10 | 1.9% |
| 30 to 34 Minutes | 14 | 2.7% |
| 35 to 39 Minutes | 0 | 0.0% |
| 40 to 44 Minutes | 48 | 9.1% |
| 45 to 59 Minutes | 53 | 10.1% |
| 60 to 89 Minutes | 52 | 9.9% |
| 90 or more Minutes | 34 | 6.5% |
Commute Time by Sex in Teaticket
The most common commute times in Teaticket are 10 to 14 minutes (71 commuters, 23.5%) for males and 15 to 19 minutes (81 commuters, 36.3%) for females.
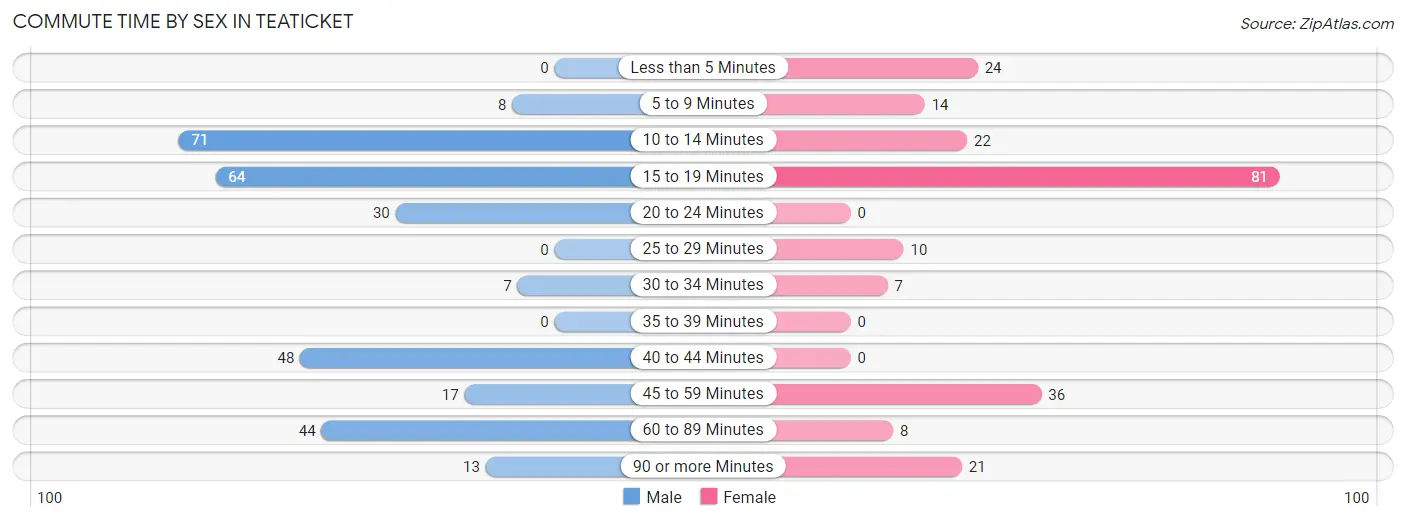
| Commute Time | Male | Female |
| Less than 5 Minutes | 0 (0.0%) | 24 (10.8%) |
| 5 to 9 Minutes | 8 (2.6%) | 14 (6.3%) |
| 10 to 14 Minutes | 71 (23.5%) | 22 (9.9%) |
| 15 to 19 Minutes | 64 (21.2%) | 81 (36.3%) |
| 20 to 24 Minutes | 30 (9.9%) | 0 (0.0%) |
| 25 to 29 Minutes | 0 (0.0%) | 10 (4.5%) |
| 30 to 34 Minutes | 7 (2.3%) | 7 (3.1%) |
| 35 to 39 Minutes | 0 (0.0%) | 0 (0.0%) |
| 40 to 44 Minutes | 48 (15.9%) | 0 (0.0%) |
| 45 to 59 Minutes | 17 (5.6%) | 36 (16.1%) |
| 60 to 89 Minutes | 44 (14.6%) | 8 (3.6%) |
| 90 or more Minutes | 13 (4.3%) | 21 (9.4%) |
Time of Departure to Work by Sex in Teaticket
The most frequent times of departure to work in Teaticket are 7:30 AM to 7:59 AM (67, 22.2%) for males and 12:00 PM to 3:59 PM (38, 17.0%) for females.
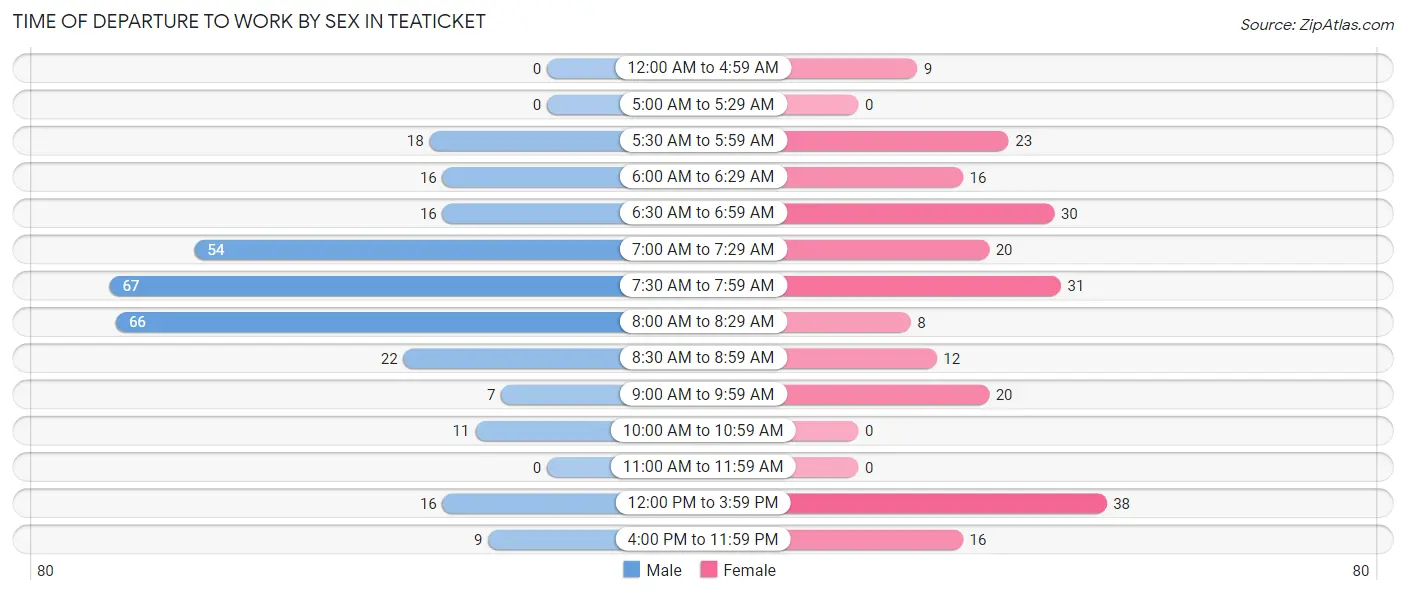
| Time of Departure | Male | Female |
| 12:00 AM to 4:59 AM | 0 (0.0%) | 9 (4.0%) |
| 5:00 AM to 5:29 AM | 0 (0.0%) | 0 (0.0%) |
| 5:30 AM to 5:59 AM | 18 (6.0%) | 23 (10.3%) |
| 6:00 AM to 6:29 AM | 16 (5.3%) | 16 (7.2%) |
| 6:30 AM to 6:59 AM | 16 (5.3%) | 30 (13.5%) |
| 7:00 AM to 7:29 AM | 54 (17.9%) | 20 (9.0%) |
| 7:30 AM to 7:59 AM | 67 (22.2%) | 31 (13.9%) |
| 8:00 AM to 8:29 AM | 66 (21.8%) | 8 (3.6%) |
| 8:30 AM to 8:59 AM | 22 (7.3%) | 12 (5.4%) |
| 9:00 AM to 9:59 AM | 7 (2.3%) | 20 (9.0%) |
| 10:00 AM to 10:59 AM | 11 (3.6%) | 0 (0.0%) |
| 11:00 AM to 11:59 AM | 0 (0.0%) | 0 (0.0%) |
| 12:00 PM to 3:59 PM | 16 (5.3%) | 38 (17.0%) |
| 4:00 PM to 11:59 PM | 9 (3.0%) | 16 (7.2%) |
| Total | 302 (100.0%) | 223 (100.0%) |
Housing Occupancy in Teaticket
Occupancy by Ownership in Teaticket
Of the total 768 dwellings in Teaticket, owner-occupied units account for 684 (89.1%), while renter-occupied units make up 84 (10.9%).
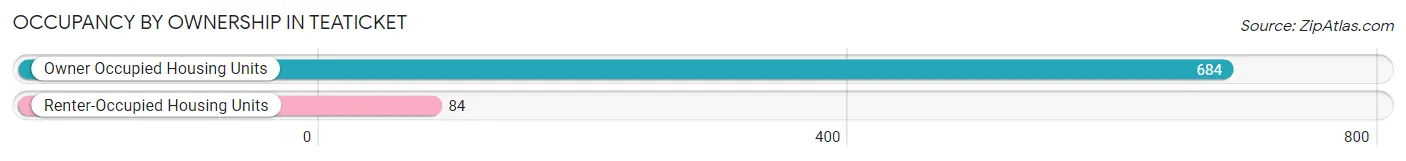
| Occupancy | # Housing Units | % Housing Units |
| Owner Occupied Housing Units | 684 | 89.1% |
| Renter-Occupied Housing Units | 84 | 10.9% |
| Total Occupied Housing Units | 768 | 100.0% |
Occupancy by Household Size in Teaticket
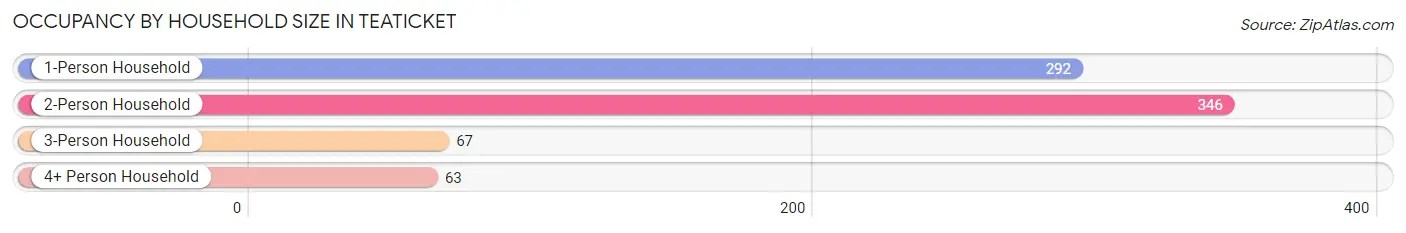
| Household Size | # Housing Units | % Housing Units |
| 1-Person Household | 292 | 38.0% |
| 2-Person Household | 346 | 45.1% |
| 3-Person Household | 67 | 8.7% |
| 4+ Person Household | 63 | 8.2% |
| Total Housing Units | 768 | 100.0% |
Occupancy by Ownership by Household Size in Teaticket
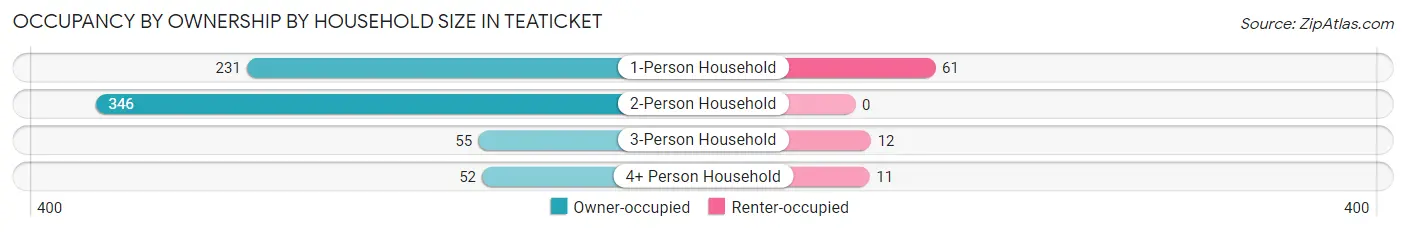
| Household Size | Owner-occupied | Renter-occupied |
| 1-Person Household | 231 (79.1%) | 61 (20.9%) |
| 2-Person Household | 346 (100.0%) | 0 (0.0%) |
| 3-Person Household | 55 (82.1%) | 12 (17.9%) |
| 4+ Person Household | 52 (82.5%) | 11 (17.5%) |
| Total Housing Units | 684 (89.1%) | 84 (10.9%) |
Occupancy by Educational Attainment in Teaticket
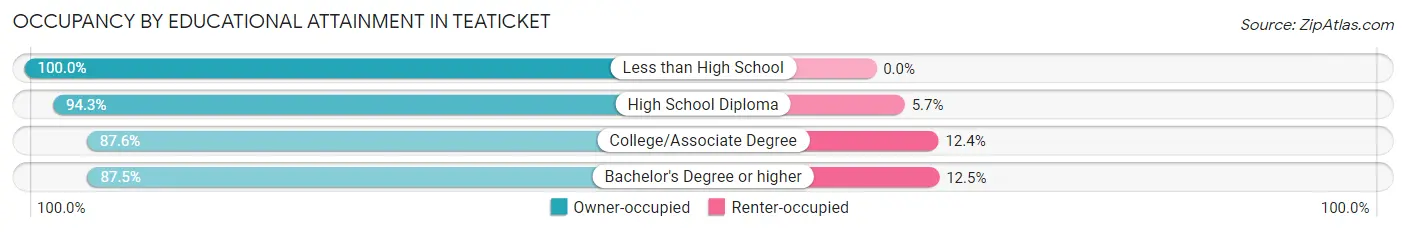
| Household Size | Owner-occupied | Renter-occupied |
| Less than High School | 7 (100.0%) | 0 (0.0%) |
| High School Diploma | 150 (94.3%) | 9 (5.7%) |
| College/Associate Degree | 156 (87.6%) | 22 (12.4%) |
| Bachelor's Degree or higher | 371 (87.5%) | 53 (12.5%) |
Occupancy by Age of Householder in Teaticket
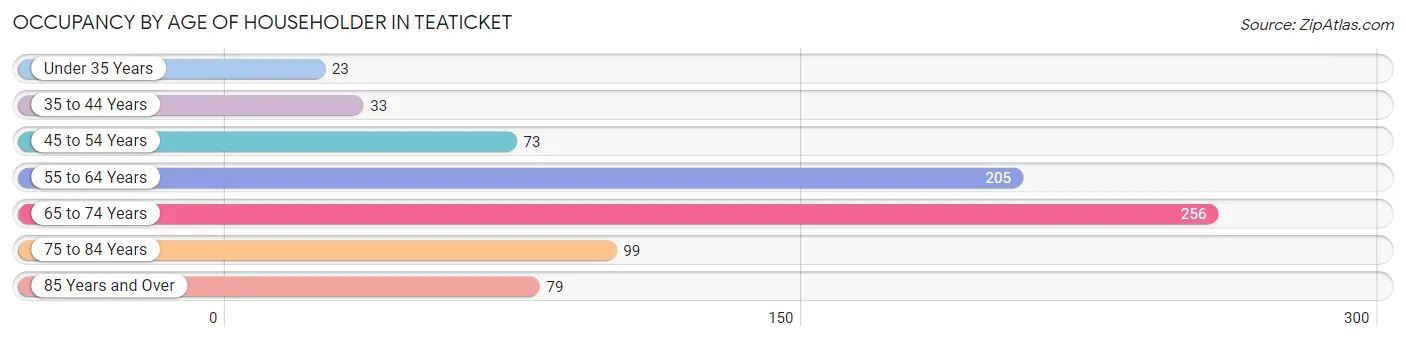
| Age Bracket | # Households | % Households |
| Under 35 Years | 23 | 3.0% |
| 35 to 44 Years | 33 | 4.3% |
| 45 to 54 Years | 73 | 9.5% |
| 55 to 64 Years | 205 | 26.7% |
| 65 to 74 Years | 256 | 33.3% |
| 75 to 84 Years | 99 | 12.9% |
| 85 Years and Over | 79 | 10.3% |
| Total | 768 | 100.0% |
Housing Finances in Teaticket
Median Income by Occupancy in Teaticket
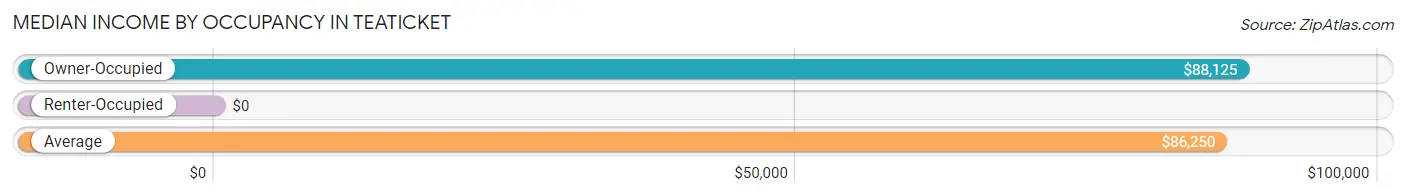
| Occupancy Type | # Households | Median Income |
| Owner-Occupied | 684 (89.1%) | $88,125 |
| Renter-Occupied | 84 (10.9%) | $0 |
| Average | 768 (100.0%) | $86,250 |
Occupancy by Householder Income Bracket in Teaticket
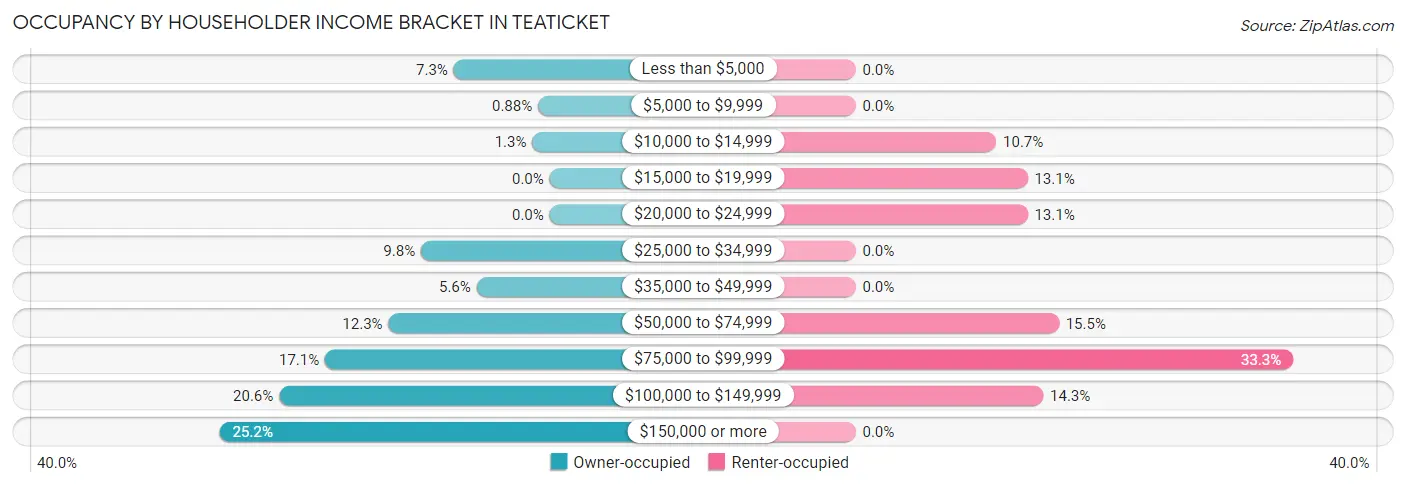
| Income Bracket | Owner-occupied | Renter-occupied |
| Less than $5,000 | 50 (7.3%) | 0 (0.0%) |
| $5,000 to $9,999 | 6 (0.9%) | 0 (0.0%) |
| $10,000 to $14,999 | 9 (1.3%) | 9 (10.7%) |
| $15,000 to $19,999 | 0 (0.0%) | 11 (13.1%) |
| $20,000 to $24,999 | 0 (0.0%) | 11 (13.1%) |
| $25,000 to $34,999 | 67 (9.8%) | 0 (0.0%) |
| $35,000 to $49,999 | 38 (5.6%) | 0 (0.0%) |
| $50,000 to $74,999 | 84 (12.3%) | 13 (15.5%) |
| $75,000 to $99,999 | 117 (17.1%) | 28 (33.3%) |
| $100,000 to $149,999 | 141 (20.6%) | 12 (14.3%) |
| $150,000 or more | 172 (25.2%) | 0 (0.0%) |
| Total | 684 (100.0%) | 84 (100.0%) |
Monthly Housing Cost Tiers in Teaticket
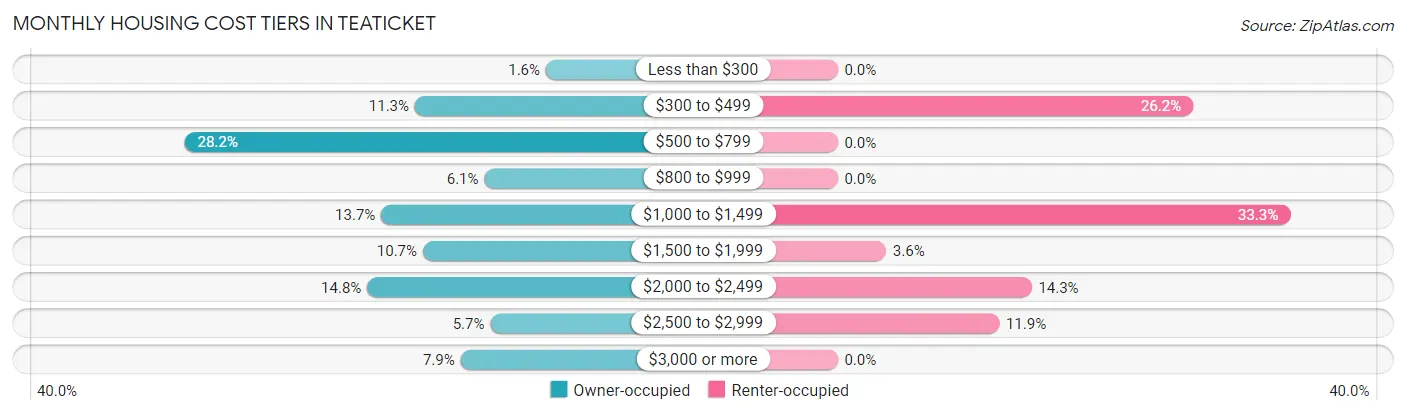
| Monthly Cost | Owner-occupied | Renter-occupied |
| Less than $300 | 11 (1.6%) | 0 (0.0%) |
| $300 to $499 | 77 (11.3%) | 22 (26.2%) |
| $500 to $799 | 193 (28.2%) | 0 (0.0%) |
| $800 to $999 | 42 (6.1%) | 0 (0.0%) |
| $1,000 to $1,499 | 94 (13.7%) | 28 (33.3%) |
| $1,500 to $1,999 | 73 (10.7%) | 3 (3.6%) |
| $2,000 to $2,499 | 101 (14.8%) | 12 (14.3%) |
| $2,500 to $2,999 | 39 (5.7%) | 10 (11.9%) |
| $3,000 or more | 54 (7.9%) | 0 (0.0%) |
| Total | 684 (100.0%) | 84 (100.0%) |
Physical Housing Characteristics in Teaticket
Housing Structures in Teaticket
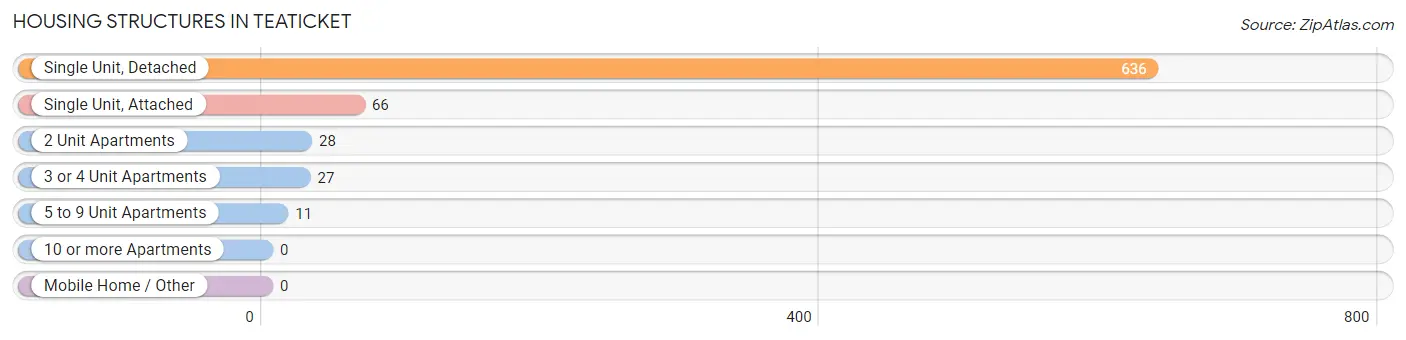
| Structure Type | # Housing Units | % Housing Units |
| Single Unit, Detached | 636 | 82.8% |
| Single Unit, Attached | 66 | 8.6% |
| 2 Unit Apartments | 28 | 3.6% |
| 3 or 4 Unit Apartments | 27 | 3.5% |
| 5 to 9 Unit Apartments | 11 | 1.4% |
| 10 or more Apartments | 0 | 0.0% |
| Mobile Home / Other | 0 | 0.0% |
| Total | 768 | 100.0% |
Housing Structures by Occupancy in Teaticket
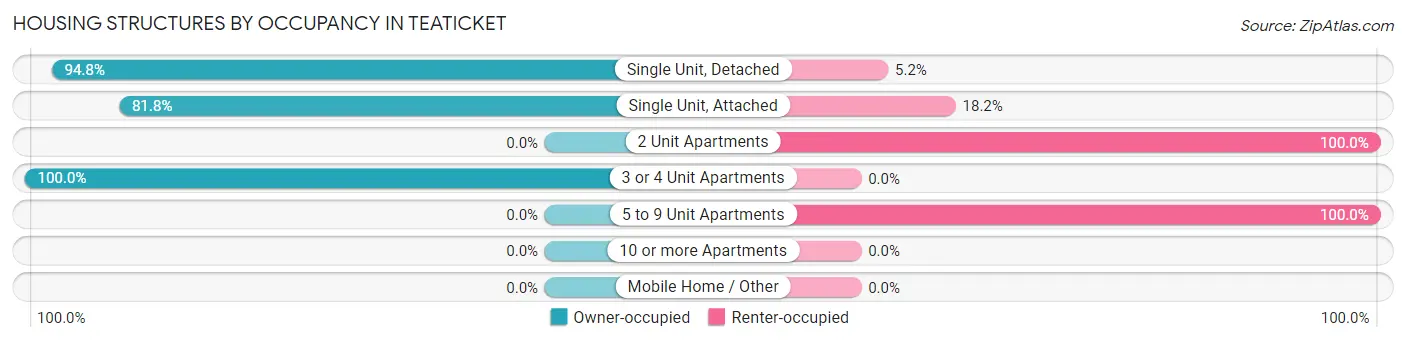
| Structure Type | Owner-occupied | Renter-occupied |
| Single Unit, Detached | 603 (94.8%) | 33 (5.2%) |
| Single Unit, Attached | 54 (81.8%) | 12 (18.2%) |
| 2 Unit Apartments | 0 (0.0%) | 28 (100.0%) |
| 3 or 4 Unit Apartments | 27 (100.0%) | 0 (0.0%) |
| 5 to 9 Unit Apartments | 0 (0.0%) | 11 (100.0%) |
| 10 or more Apartments | 0 (0.0%) | 0 (0.0%) |
| Mobile Home / Other | 0 (0.0%) | 0 (0.0%) |
| Total | 684 (89.1%) | 84 (10.9%) |
Housing Structures by Number of Rooms in Teaticket
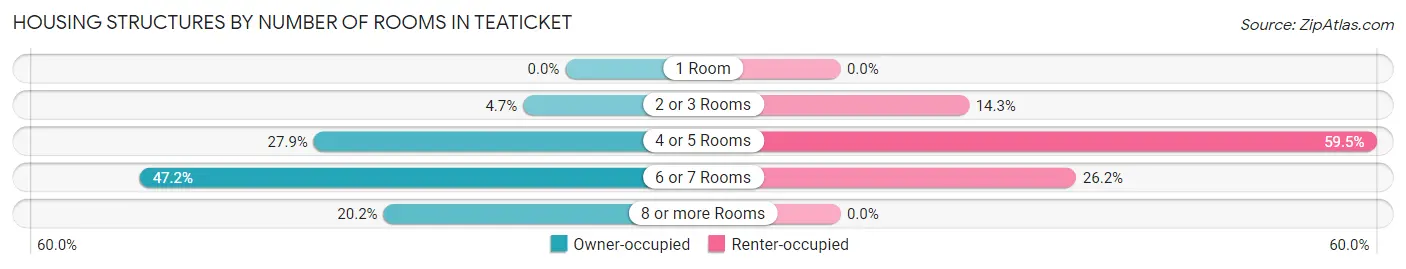
| Number of Rooms | Owner-occupied | Renter-occupied |
| 1 Room | 0 (0.0%) | 0 (0.0%) |
| 2 or 3 Rooms | 32 (4.7%) | 12 (14.3%) |
| 4 or 5 Rooms | 191 (27.9%) | 50 (59.5%) |
| 6 or 7 Rooms | 323 (47.2%) | 22 (26.2%) |
| 8 or more Rooms | 138 (20.2%) | 0 (0.0%) |
| Total | 684 (100.0%) | 84 (100.0%) |
Housing Structure by Heating Type in Teaticket
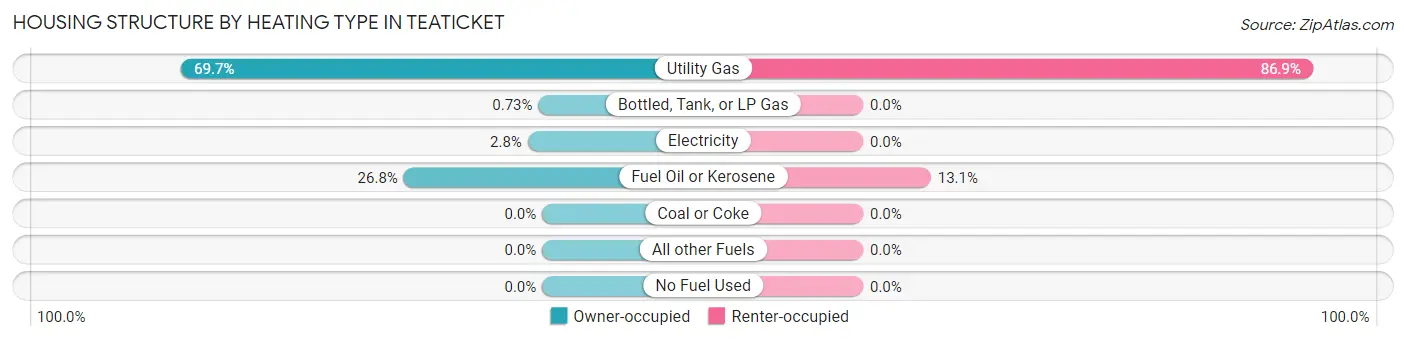
| Heating Type | Owner-occupied | Renter-occupied |
| Utility Gas | 477 (69.7%) | 73 (86.9%) |
| Bottled, Tank, or LP Gas | 5 (0.7%) | 0 (0.0%) |
| Electricity | 19 (2.8%) | 0 (0.0%) |
| Fuel Oil or Kerosene | 183 (26.8%) | 11 (13.1%) |
| Coal or Coke | 0 (0.0%) | 0 (0.0%) |
| All other Fuels | 0 (0.0%) | 0 (0.0%) |
| No Fuel Used | 0 (0.0%) | 0 (0.0%) |
| Total | 684 (100.0%) | 84 (100.0%) |
Household Vehicle Usage in Teaticket
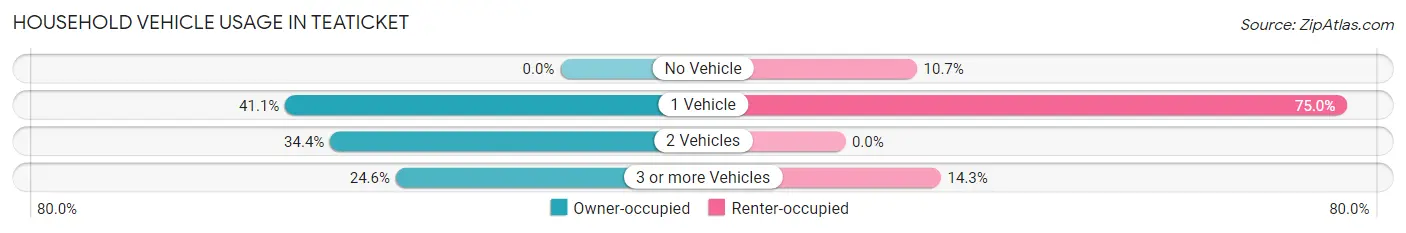
| Vehicles per Household | Owner-occupied | Renter-occupied |
| No Vehicle | 0 (0.0%) | 9 (10.7%) |
| 1 Vehicle | 281 (41.1%) | 63 (75.0%) |
| 2 Vehicles | 235 (34.4%) | 0 (0.0%) |
| 3 or more Vehicles | 168 (24.6%) | 12 (14.3%) |
| Total | 684 (100.0%) | 84 (100.0%) |
Real Estate & Mortgages in Teaticket
Real Estate and Mortgage Overview in Teaticket
| Characteristic | Without Mortgage | With Mortgage |
| Housing Units | 387 | 297 |
| Median Property Value | $425,600 | $489,000 |
| Median Household Income | $83,188 | $97 |
| Monthly Housing Costs | $715 | $54 |
| Real Estate Taxes | $3,164 | $0 |
Property Value by Mortgage Status in Teaticket
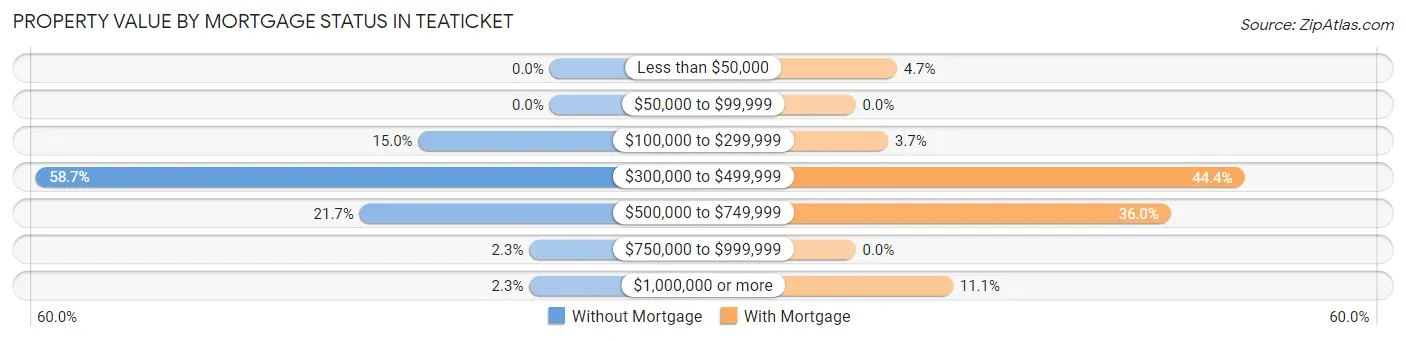
| Property Value | Without Mortgage | With Mortgage |
| Less than $50,000 | 0 (0.0%) | 14 (4.7%) |
| $50,000 to $99,999 | 0 (0.0%) | 0 (0.0%) |
| $100,000 to $299,999 | 58 (15.0%) | 11 (3.7%) |
| $300,000 to $499,999 | 227 (58.7%) | 132 (44.4%) |
| $500,000 to $749,999 | 84 (21.7%) | 107 (36.0%) |
| $750,000 to $999,999 | 9 (2.3%) | 0 (0.0%) |
| $1,000,000 or more | 9 (2.3%) | 33 (11.1%) |
| Total | 387 (100.0%) | 297 (100.0%) |
Household Income by Mortgage Status in Teaticket
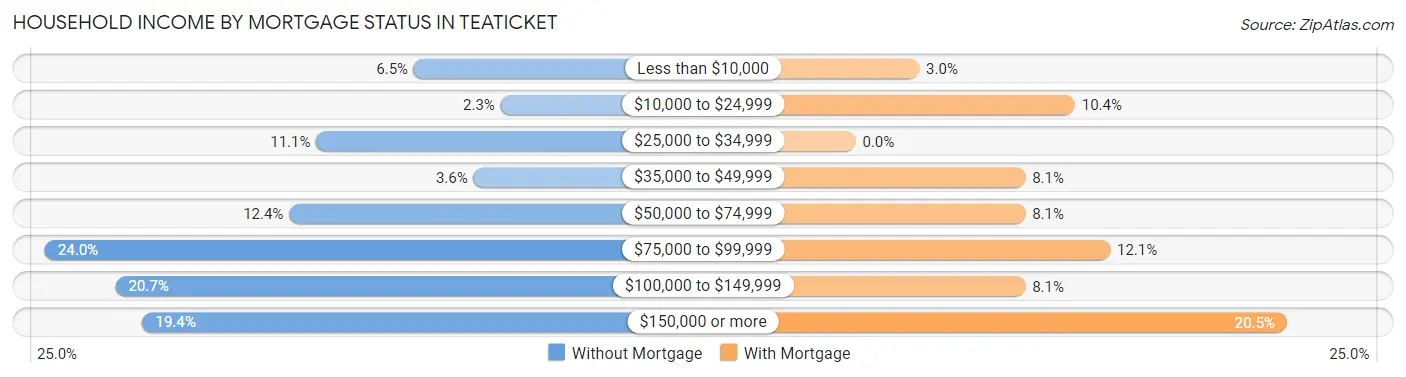
| Household Income | Without Mortgage | With Mortgage |
| Less than $10,000 | 25 (6.5%) | 9 (3.0%) |
| $10,000 to $24,999 | 9 (2.3%) | 31 (10.4%) |
| $25,000 to $34,999 | 43 (11.1%) | 0 (0.0%) |
| $35,000 to $49,999 | 14 (3.6%) | 24 (8.1%) |
| $50,000 to $74,999 | 48 (12.4%) | 24 (8.1%) |
| $75,000 to $99,999 | 93 (24.0%) | 36 (12.1%) |
| $100,000 to $149,999 | 80 (20.7%) | 24 (8.1%) |
| $150,000 or more | 75 (19.4%) | 61 (20.5%) |
| Total | 387 (100.0%) | 297 (100.0%) |
Property Value to Household Income Ratio in Teaticket
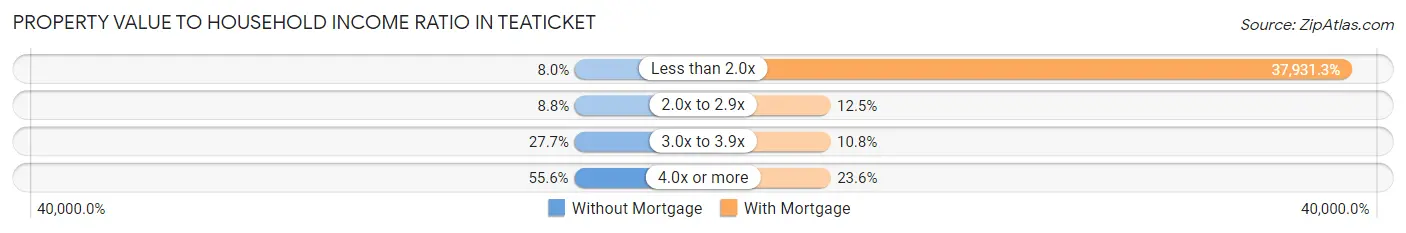
| Value-to-Income Ratio | Without Mortgage | With Mortgage |
| Less than 2.0x | 31 (8.0%) | 112,656 (37,931.3%) |
| 2.0x to 2.9x | 34 (8.8%) | 37 (12.5%) |
| 3.0x to 3.9x | 107 (27.7%) | 32 (10.8%) |
| 4.0x or more | 215 (55.6%) | 70 (23.6%) |
| Total | 387 (100.0%) | 297 (100.0%) |
Real Estate Taxes by Mortgage Status in Teaticket
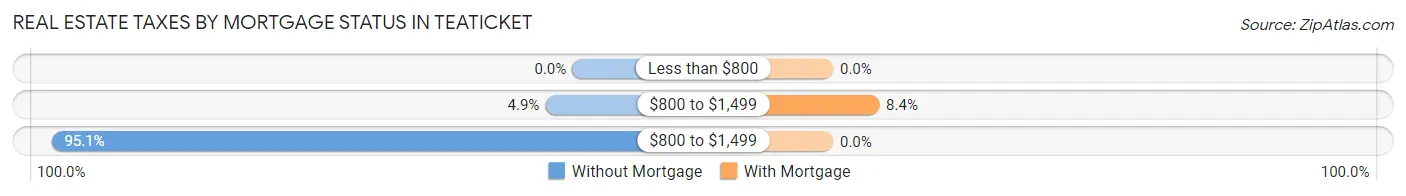
| Property Taxes | Without Mortgage | With Mortgage |
| Less than $800 | 0 (0.0%) | 0 (0.0%) |
| $800 to $1,499 | 19 (4.9%) | 25 (8.4%) |
| $800 to $1,499 | 368 (95.1%) | 0 (0.0%) |
| Total | 387 (100.0%) | 297 (100.0%) |
Health & Disability in Teaticket
Health Insurance Coverage by Age in Teaticket
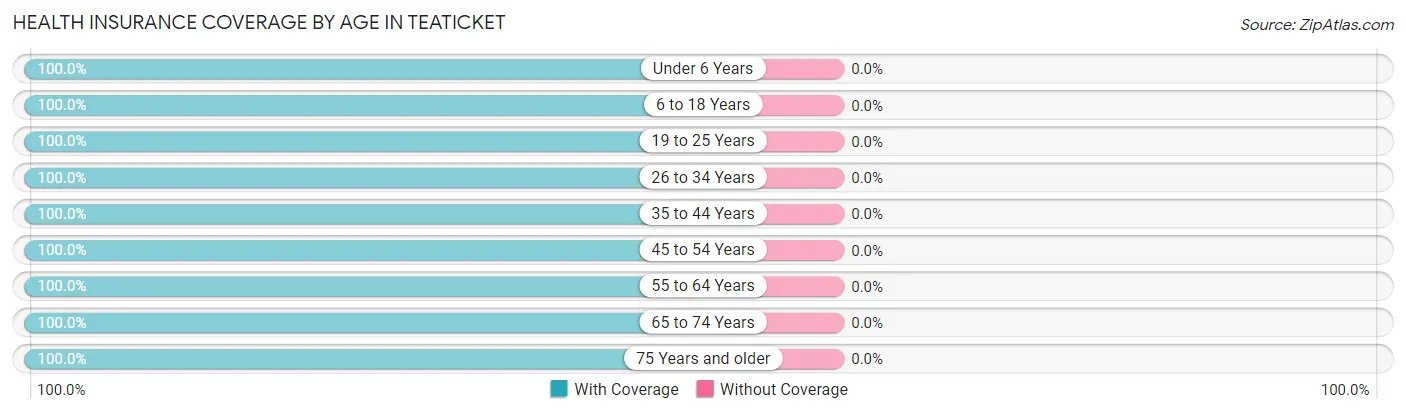
| Age Bracket | With Coverage | Without Coverage |
| Under 6 Years | 50 (100.0%) | 0 (0.0%) |
| 6 to 18 Years | 108 (100.0%) | 0 (0.0%) |
| 19 to 25 Years | 121 (100.0%) | 0 (0.0%) |
| 26 to 34 Years | 95 (100.0%) | 0 (0.0%) |
| 35 to 44 Years | 53 (100.0%) | 0 (0.0%) |
| 45 to 54 Years | 139 (100.0%) | 0 (0.0%) |
| 55 to 64 Years | 293 (100.0%) | 0 (0.0%) |
| 65 to 74 Years | 421 (100.0%) | 0 (0.0%) |
| 75 Years and older | 271 (100.0%) | 0 (0.0%) |
| Total | 1,551 (100.0%) | 0 (0.0%) |
Health Insurance Coverage by Citizenship Status in Teaticket
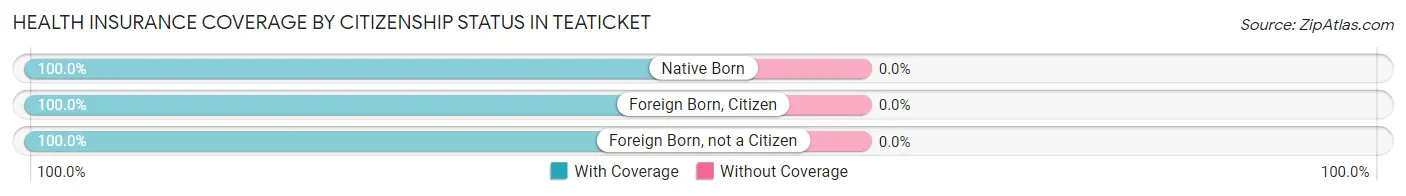
| Citizenship Status | With Coverage | Without Coverage |
| Native Born | 50 (100.0%) | 0 (0.0%) |
| Foreign Born, Citizen | 108 (100.0%) | 0 (0.0%) |
| Foreign Born, not a Citizen | 121 (100.0%) | 0 (0.0%) |
Health Insurance Coverage by Household Income in Teaticket
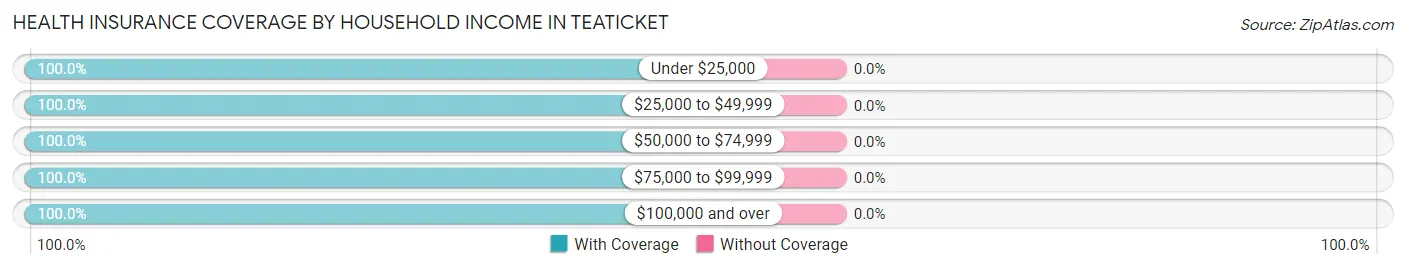
| Household Income | With Coverage | Without Coverage |
| Under $25,000 | 143 (100.0%) | 0 (0.0%) |
| $25,000 to $49,999 | 195 (100.0%) | 0 (0.0%) |
| $50,000 to $74,999 | 263 (100.0%) | 0 (0.0%) |
| $75,000 to $99,999 | 261 (100.0%) | 0 (0.0%) |
| $100,000 and over | 689 (100.0%) | 0 (0.0%) |
Public vs Private Health Insurance Coverage by Age in Teaticket
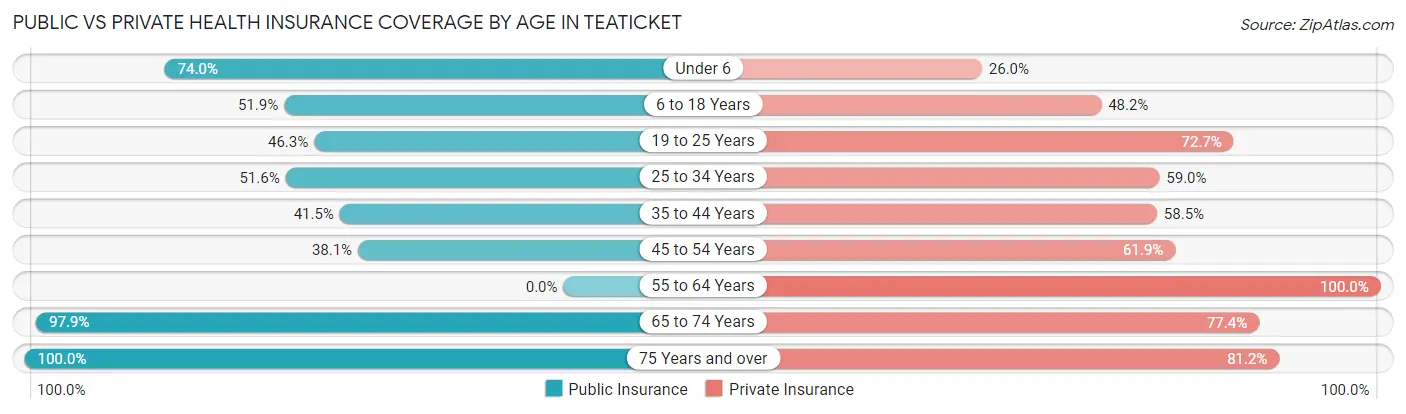
| Age Bracket | Public Insurance | Private Insurance |
| Under 6 | 37 (74.0%) | 13 (26.0%) |
| 6 to 18 Years | 56 (51.8%) | 52 (48.1%) |
| 19 to 25 Years | 56 (46.3%) | 88 (72.7%) |
| 25 to 34 Years | 49 (51.6%) | 56 (59.0%) |
| 35 to 44 Years | 22 (41.5%) | 31 (58.5%) |
| 45 to 54 Years | 53 (38.1%) | 86 (61.9%) |
| 55 to 64 Years | 0 (0.0%) | 293 (100.0%) |
| 65 to 74 Years | 412 (97.9%) | 326 (77.4%) |
| 75 Years and over | 271 (100.0%) | 220 (81.2%) |
| Total | 956 (61.6%) | 1,165 (75.1%) |
Disability Status by Sex by Age in Teaticket
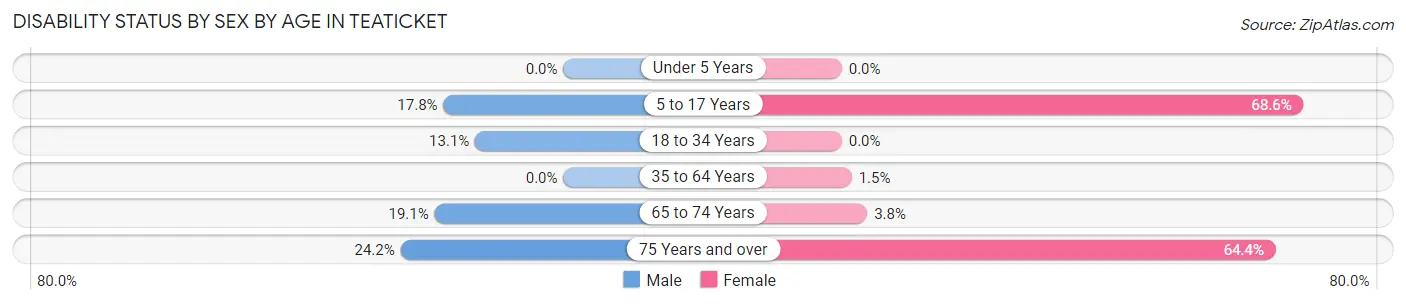
| Age Bracket | Male | Female |
| Under 5 Years | 0 (0.0%) | 0 (0.0%) |
| 5 to 17 Years | 13 (17.8%) | 24 (68.6%) |
| 18 to 34 Years | 19 (13.1%) | 0 (0.0%) |
| 35 to 64 Years | 0 (0.0%) | 4 (1.5%) |
| 65 to 74 Years | 35 (19.1%) | 9 (3.8%) |
| 75 Years and over | 22 (24.2%) | 116 (64.4%) |
Disability Class by Sex by Age in Teaticket
Disability Class: Hearing Difficulty
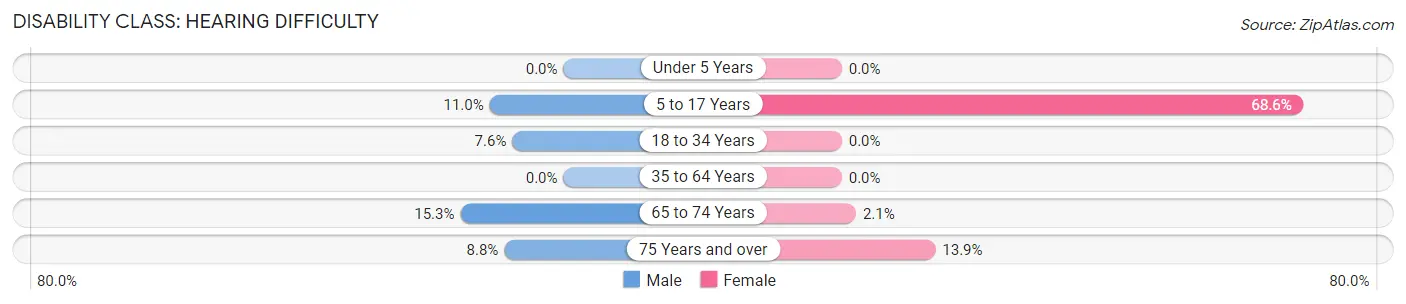
| Age Bracket | Male | Female |
| Under 5 Years | 0 (0.0%) | 0 (0.0%) |
| 5 to 17 Years | 8 (11.0%) | 24 (68.6%) |
| 18 to 34 Years | 11 (7.6%) | 0 (0.0%) |
| 35 to 64 Years | 0 (0.0%) | 0 (0.0%) |
| 65 to 74 Years | 28 (15.3%) | 5 (2.1%) |
| 75 Years and over | 8 (8.8%) | 25 (13.9%) |
Disability Class: Vision Difficulty
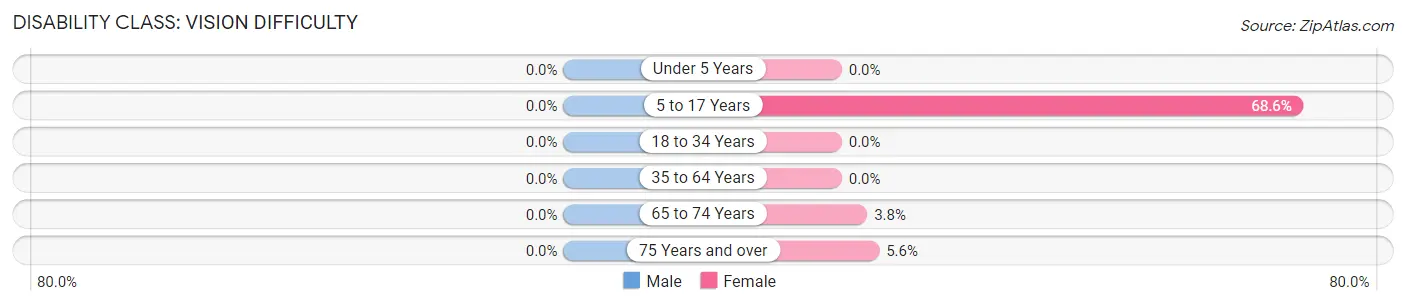
| Age Bracket | Male | Female |
| Under 5 Years | 0 (0.0%) | 0 (0.0%) |
| 5 to 17 Years | 0 (0.0%) | 24 (68.6%) |
| 18 to 34 Years | 0 (0.0%) | 0 (0.0%) |
| 35 to 64 Years | 0 (0.0%) | 0 (0.0%) |
| 65 to 74 Years | 0 (0.0%) | 9 (3.8%) |
| 75 Years and over | 0 (0.0%) | 10 (5.6%) |
Disability Class: Cognitive Difficulty
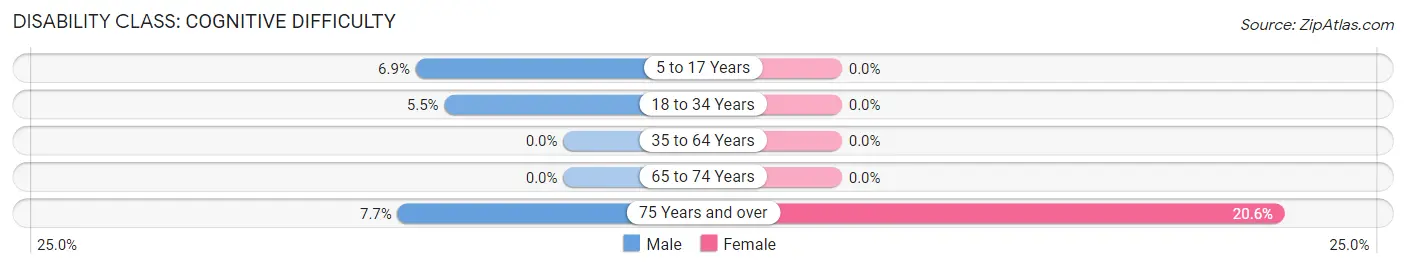
| Age Bracket | Male | Female |
| 5 to 17 Years | 5 (6.9%) | 0 (0.0%) |
| 18 to 34 Years | 8 (5.5%) | 0 (0.0%) |
| 35 to 64 Years | 0 (0.0%) | 0 (0.0%) |
| 65 to 74 Years | 0 (0.0%) | 0 (0.0%) |
| 75 Years and over | 7 (7.7%) | 37 (20.6%) |
Disability Class: Ambulatory Difficulty
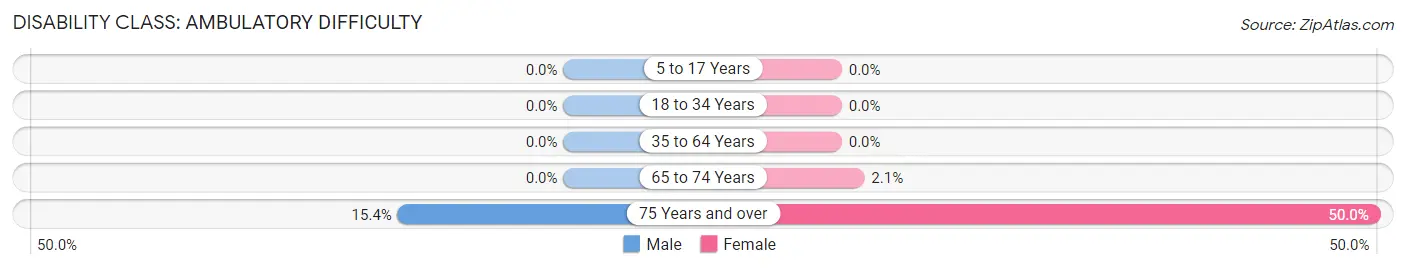
| Age Bracket | Male | Female |
| 5 to 17 Years | 0 (0.0%) | 0 (0.0%) |
| 18 to 34 Years | 0 (0.0%) | 0 (0.0%) |
| 35 to 64 Years | 0 (0.0%) | 0 (0.0%) |
| 65 to 74 Years | 0 (0.0%) | 5 (2.1%) |
| 75 Years and over | 14 (15.4%) | 90 (50.0%) |
Disability Class: Self-Care Difficulty
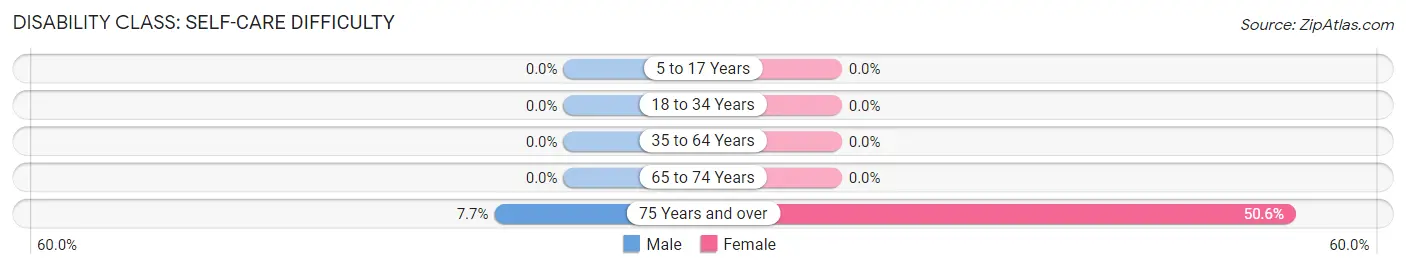
| Age Bracket | Male | Female |
| 5 to 17 Years | 0 (0.0%) | 0 (0.0%) |
| 18 to 34 Years | 0 (0.0%) | 0 (0.0%) |
| 35 to 64 Years | 0 (0.0%) | 0 (0.0%) |
| 65 to 74 Years | 0 (0.0%) | 0 (0.0%) |
| 75 Years and over | 7 (7.7%) | 91 (50.6%) |
Technology Access in Teaticket
Computing Device Access in Teaticket
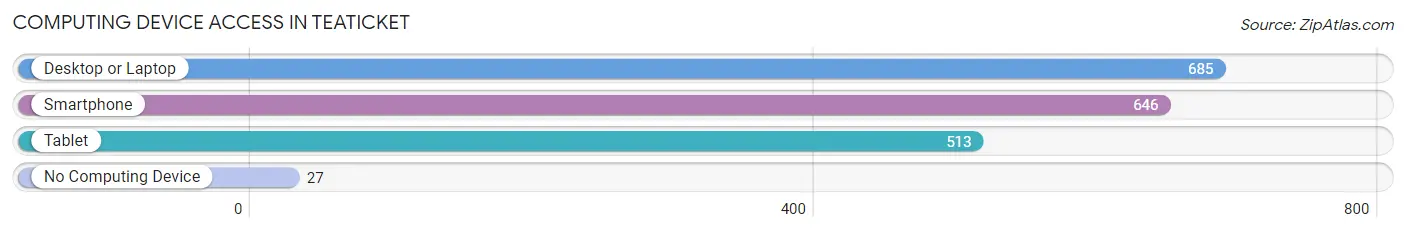
| Device Type | # Households | % Households |
| Desktop or Laptop | 685 | 89.2% |
| Smartphone | 646 | 84.1% |
| Tablet | 513 | 66.8% |
| No Computing Device | 27 | 3.5% |
| Total | 768 | 100.0% |
Internet Access in Teaticket
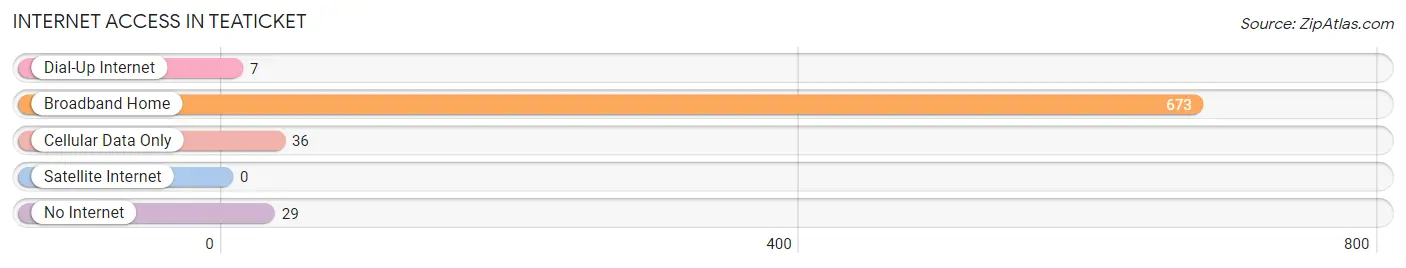
| Internet Type | # Households | % Households |
| Dial-Up Internet | 7 | 0.9% |
| Broadband Home | 673 | 87.6% |
| Cellular Data Only | 36 | 4.7% |
| Satellite Internet | 0 | 0.0% |
| No Internet | 29 | 3.8% |
| Total | 768 | 100.0% |
Teaticket Summary
Teaticket is a small unincorporated village located in the town of Falmouth, Massachusetts, on the south coast of Cape Cod. It is situated on the western shore of Waquoit Bay, which is part of the larger Buzzards Bay. Teaticket is bordered by the towns of Mashpee to the north, Falmouth to the east, and Bourne to the south. The village is home to a population of approximately 1,500 people, and is a popular summer destination for tourists.
Geography
Teaticket is located in the southeastern corner of Falmouth, Massachusetts, on the western shore of Waquoit Bay. The village is bordered by the towns of Mashpee to the north, Falmouth to the east, and Bourne to the south. The village is situated on a peninsula, with the bay to the west and the Atlantic Ocean to the east. The village is approximately 4.5 miles from the mainland, and is accessible by a bridge from the mainland.
The village is home to a variety of natural habitats, including salt marshes, tidal flats, and woodlands. The area is also home to a variety of wildlife, including ospreys, herons, and other waterfowl.
Economy
Teaticket is primarily a residential community, with a small commercial district located in the center of the village. The commercial district includes a variety of small businesses, including restaurants, shops, and services. The village is also home to a marina, which provides access to the bay and the ocean.
The village is also home to a variety of recreational activities, including fishing, boating, and swimming. The area is also popular for its beaches, which are located on both the bay and the ocean.
Demographics
As of the 2010 census, the population of Teaticket was 1,500. The racial makeup of the village was 94.2% White, 1.3% African American, 0.7% Native American, 0.7% Asian, 0.3% from other races, and 2.8% from two or more races. Hispanic or Latino of any race were 1.3% of the population.
The median household income in Teaticket was $62,500, and the median family income was $68,750. The per capita income for the village was $30,000. About 4.3% of families and 5.3% of the population were below the poverty line, including 6.3% of those under age 18 and 4.3% of those age 65 or over.
Conclusion
Teaticket is a small unincorporated village located in the town of Falmouth, Massachusetts, on the south coast of Cape Cod. It is situated on the western shore of Waquoit Bay, which is part of the larger Buzzards Bay. Teaticket is bordered by the towns of Mashpee to the north, Falmouth to the east, and Bourne to the south. The village is home to a population of approximately 1,500 people, and is a popular summer destination for tourists. The village is primarily a residential community, with a small commercial district located in the center of the village. The village is also home to a variety of recreational activities, including fishing, boating, and swimming. The area is also popular for its beaches, which are located on both the bay and the ocean. The population of Teaticket is primarily White, with a small percentage of African American, Native American, and Asian residents. The median household income in Teaticket is $62,500, and the median family income is $68,750.
Common Questions
What is Per Capita Income in Teaticket?
Per Capita income in Teaticket is $65,345.
What is the Median Family Income in Teaticket?
Median Family Income in Teaticket is $94,722.
What is the Median Household income in Teaticket?
Median Household Income in Teaticket is $86,250.
What is Income or Wage Gap in Teaticket?
Income or Wage Gap in Teaticket is 20.7%.
Women in Teaticket earn 79.3 cents for every dollar earned by a man.
What is Inequality or Gini Index in Teaticket?
Inequality or Gini Index in Teaticket is 0.53.
What is the Total Population of Teaticket?
Total Population of Teaticket is 1,561.
What is the Total Male Population of Teaticket?
Total Male Population of Teaticket is 744.
What is the Total Female Population of Teaticket?
Total Female Population of Teaticket is 817.
What is the Ratio of Males per 100 Females in Teaticket?
There are 91.06 Males per 100 Females in Teaticket.
What is the Ratio of Females per 100 Males in Teaticket?
There are 109.81 Females per 100 Males in Teaticket.
What is the Median Population Age in Teaticket?
Median Population Age in Teaticket is 63.2 Years.
What is the Average Family Size in Teaticket
Average Family Size in Teaticket is 2.7 People.
What is the Average Household Size in Teaticket
Average Household Size in Teaticket is 2.0 People.
How Large is the Labor Force in Teaticket?
There are 737 People in the Labor Forcein in Teaticket.
What is the Percentage of People in the Labor Force in Teaticket?
50.6% of People are in the Labor Force in Teaticket.
What is the Unemployment Rate in Teaticket?
Unemployment Rate in Teaticket is 1.4%.