Cities with the Largest Haitian Community in Massachusetts
RELATED REPORTS & OPTIONS
Haitian
Massachusetts
Compare Cities
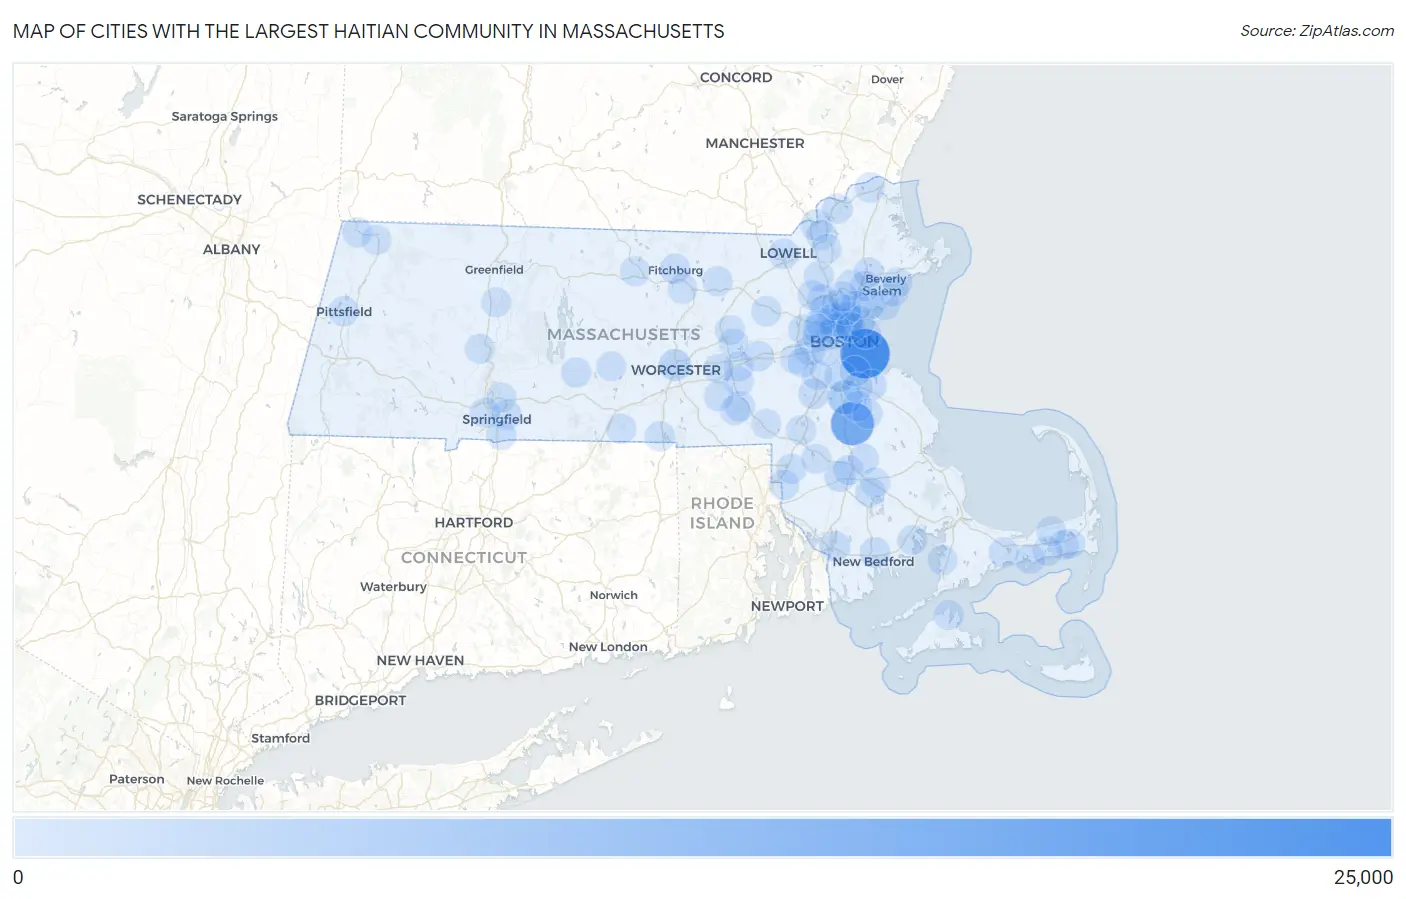
Map of Cities with the Largest Haitian Community in Massachusetts
0
25,000
Cities with the Largest Haitian Community in Massachusetts
| City | Haitian | vs State | vs National | |
| 1. | Boston | 21,059 | 80,378(26.20%)#1 | 1,060,713(1.99%)#3 |
| 2. | Brockton | 14,051 | 80,378(17.48%)#2 | 1,060,713(1.32%)#6 |
| 3. | Randolph Town | 4,396 | 80,378(5.47%)#3 | 1,060,713(0.41%)#35 |
| 4. | Malden | 3,295 | 80,378(4.10%)#4 | 1,060,713(0.31%)#49 |
| 5. | Everett | 2,879 | 80,378(3.58%)#5 | 1,060,713(0.27%)#52 |
| 6. | Medford | 2,120 | 80,378(2.64%)#6 | 1,060,713(0.20%)#68 |
| 7. | Worcester | 2,069 | 80,378(2.57%)#7 | 1,060,713(0.20%)#71 |
| 8. | Lynn | 1,926 | 80,378(2.40%)#8 | 1,060,713(0.18%)#73 |
| 9. | Cambridge | 1,525 | 80,378(1.90%)#9 | 1,060,713(0.14%)#90 |
| 10. | Methuen Town | 1,162 | 80,378(1.45%)#10 | 1,060,713(0.11%)#107 |
| 11. | Milton | 1,020 | 80,378(1.27%)#11 | 1,060,713(0.10%)#124 |
| 12. | Taunton | 967 | 80,378(1.20%)#12 | 1,060,713(0.09%)#130 |
| 13. | Somerville | 934 | 80,378(1.16%)#13 | 1,060,713(0.09%)#133 |
| 14. | Woburn | 846 | 80,378(1.05%)#14 | 1,060,713(0.08%)#146 |
| 15. | Waltham | 839 | 80,378(1.04%)#15 | 1,060,713(0.08%)#150 |
| 16. | Fall River | 823 | 80,378(1.02%)#16 | 1,060,713(0.08%)#152 |
| 17. | Revere | 726 | 80,378(0.90%)#17 | 1,060,713(0.07%)#169 |
| 18. | Weymouth Town | 715 | 80,378(0.89%)#18 | 1,060,713(0.07%)#170 |
| 19. | Quincy | 601 | 80,378(0.75%)#19 | 1,060,713(0.06%)#199 |
| 20. | New Bedford | 600 | 80,378(0.75%)#20 | 1,060,713(0.06%)#200 |
| 21. | Norwood | 570 | 80,378(0.71%)#21 | 1,060,713(0.05%)#210 |
| 22. | Peabody | 566 | 80,378(0.70%)#22 | 1,060,713(0.05%)#215 |
| 23. | Lowell | 523 | 80,378(0.65%)#23 | 1,060,713(0.05%)#237 |
| 24. | Saugus | 427 | 80,378(0.53%)#24 | 1,060,713(0.04%)#277 |
| 25. | Barnstable Town | 396 | 80,378(0.49%)#25 | 1,060,713(0.04%)#292 |
| 26. | Haverhill | 388 | 80,378(0.48%)#26 | 1,060,713(0.04%)#295 |
| 27. | Springfield | 355 | 80,378(0.44%)#27 | 1,060,713(0.03%)#310 |
| 28. | Milford | 345 | 80,378(0.43%)#28 | 1,060,713(0.03%)#314 |
| 29. | Holbrook | 341 | 80,378(0.42%)#29 | 1,060,713(0.03%)#317 |
| 30. | West Yarmouth | 316 | 80,378(0.39%)#30 | 1,060,713(0.03%)#338 |
| 31. | Bridgewater Town | 309 | 80,378(0.38%)#31 | 1,060,713(0.03%)#340 |
| 32. | Salem | 296 | 80,378(0.37%)#32 | 1,060,713(0.03%)#353 |
| 33. | Framingham | 287 | 80,378(0.36%)#33 | 1,060,713(0.03%)#362 |
| 34. | Winchester | 271 | 80,378(0.34%)#34 | 1,060,713(0.03%)#376 |
| 35. | Newton | 268 | 80,378(0.33%)#35 | 1,060,713(0.03%)#381 |
| 36. | Lynnfield | 267 | 80,378(0.33%)#36 | 1,060,713(0.03%)#383 |
| 37. | Danvers | 266 | 80,378(0.33%)#37 | 1,060,713(0.03%)#385 |
| 38. | Raynham Center | 259 | 80,378(0.32%)#38 | 1,060,713(0.02%)#396 |
| 39. | Dedham | 258 | 80,378(0.32%)#39 | 1,060,713(0.02%)#398 |
| 40. | North Seekonk | 249 | 80,378(0.31%)#40 | 1,060,713(0.02%)#414 |
| 41. | Braintree Town | 244 | 80,378(0.30%)#41 | 1,060,713(0.02%)#422 |
| 42. | Attleboro | 235 | 80,378(0.29%)#42 | 1,060,713(0.02%)#436 |
| 43. | Wilmington | 234 | 80,378(0.29%)#43 | 1,060,713(0.02%)#439 |
| 44. | Devens | 210 | 80,378(0.26%)#44 | 1,060,713(0.02%)#469 |
| 45. | Fitchburg | 195 | 80,378(0.24%)#45 | 1,060,713(0.02%)#500 |
| 46. | Ware | 195 | 80,378(0.24%)#46 | 1,060,713(0.02%)#501 |
| 47. | West Concord | 187 | 80,378(0.23%)#47 | 1,060,713(0.02%)#519 |
| 48. | Watertown Town | 185 | 80,378(0.23%)#48 | 1,060,713(0.02%)#523 |
| 49. | Amesbury Town | 177 | 80,378(0.22%)#49 | 1,060,713(0.02%)#541 |
| 50. | Lawrence | 173 | 80,378(0.22%)#50 | 1,060,713(0.02%)#547 |
| 51. | Melrose | 172 | 80,378(0.21%)#51 | 1,060,713(0.02%)#549 |
| 52. | Beverly | 169 | 80,378(0.21%)#52 | 1,060,713(0.02%)#556 |
| 53. | Swampscott | 138 | 80,378(0.17%)#53 | 1,060,713(0.01%)#649 |
| 54. | North Attleborough | 131 | 80,378(0.16%)#54 | 1,060,713(0.01%)#669 |
| 55. | Pittsfield | 128 | 80,378(0.16%)#55 | 1,060,713(0.01%)#678 |
| 56. | Wellesley | 113 | 80,378(0.14%)#56 | 1,060,713(0.01%)#746 |
| 57. | Marlborough | 111 | 80,378(0.14%)#57 | 1,060,713(0.01%)#756 |
| 58. | Chelsea | 108 | 80,378(0.13%)#58 | 1,060,713(0.01%)#765 |
| 59. | Arlington | 106 | 80,378(0.13%)#59 | 1,060,713(0.01%)#774 |
| 60. | Foxborough | 99 | 80,378(0.12%)#60 | 1,060,713(0.01%)#810 |
| 61. | Webster | 98 | 80,378(0.12%)#61 | 1,060,713(0.01%)#815 |
| 62. | Leominster | 89 | 80,378(0.11%)#62 | 1,060,713(0.01%)#867 |
| 63. | Longmeadow | 71 | 80,378(0.09%)#63 | 1,060,713(0.01%)#985 |
| 64. | Franklin Town | 60 | 80,378(0.07%)#64 | 1,060,713(0.01%)#1,082 |
| 65. | Needham | 57 | 80,378(0.07%)#65 | 1,060,713(0.01%)#1,110 |
| 66. | Burlington | 55 | 80,378(0.07%)#66 | 1,060,713(0.01%)#1,132 |
| 67. | Brookline | 54 | 80,378(0.07%)#67 | 1,060,713(0.01%)#1,143 |
| 68. | Abington | 49 | 80,378(0.06%)#68 | 1,060,713(0.00%)#1,198 |
| 69. | Amherst | 48 | 80,378(0.06%)#69 | 1,060,713(0.00%)#1,205 |
| 70. | Harwich Center | 47 | 80,378(0.06%)#70 | 1,060,713(0.00%)#1,228 |
| 71. | Stoneham | 46 | 80,378(0.06%)#71 | 1,060,713(0.00%)#1,235 |
| 72. | Northwest Harwich | 46 | 80,378(0.06%)#72 | 1,060,713(0.00%)#1,242 |
| 73. | Chicopee | 40 | 80,378(0.05%)#73 | 1,060,713(0.00%)#1,310 |
| 74. | North Falmouth | 37 | 80,378(0.05%)#74 | 1,060,713(0.00%)#1,367 |
| 75. | West Dennis | 32 | 80,378(0.04%)#75 | 1,060,713(0.00%)#1,478 |
| 76. | Wakefield | 27 | 80,378(0.03%)#76 | 1,060,713(0.00%)#1,556 |
| 77. | Southbridge Town | 27 | 80,378(0.03%)#77 | 1,060,713(0.00%)#1,559 |
| 78. | Andover | 27 | 80,378(0.03%)#78 | 1,060,713(0.00%)#1,565 |
| 79. | East Dennis | 27 | 80,378(0.03%)#79 | 1,060,713(0.00%)#1,568 |
| 80. | North Lakeville | 27 | 80,378(0.03%)#80 | 1,060,713(0.00%)#1,569 |
| 81. | Marion Center | 27 | 80,378(0.03%)#81 | 1,060,713(0.00%)#1,574 |
| 82. | Greenfield | 22 | 80,378(0.03%)#82 | 1,060,713(0.00%)#1,706 |
| 83. | South Deerfield | 19 | 80,378(0.02%)#83 | 1,060,713(0.00%)#1,815 |
| 84. | Northampton | 15 | 80,378(0.02%)#84 | 1,060,713(0.00%)#1,940 |
| 85. | Belmont | 13 | 80,378(0.02%)#85 | 1,060,713(0.00%)#2,030 |
| 86. | Winthrop Town | 12 | 80,378(0.01%)#86 | 1,060,713(0.00%)#2,075 |
| 87. | North Adams | 12 | 80,378(0.01%)#87 | 1,060,713(0.00%)#2,081 |
| 88. | Hopedale | 12 | 80,378(0.01%)#88 | 1,060,713(0.00%)#2,101 |
| 89. | Gardner | 11 | 80,378(0.01%)#89 | 1,060,713(0.00%)#2,127 |
| 90. | Norton Center | 8 | 80,378(0.01%)#90 | 1,060,713(0.00%)#2,330 |
| 91. | Cordaville | 7 | 80,378(0.01%)#91 | 1,060,713(0.00%)#2,398 |
| 92. | North Brookfield | 6 | 80,378(0.01%)#92 | 1,060,713(0.00%)#2,456 |
| 93. | West Springfield Town | 4 | 80,378(0.00%)#93 | 1,060,713(0.00%)#2,542 |
| 94. | Hudson | 4 | 80,378(0.00%)#94 | 1,060,713(0.00%)#2,547 |
| 95. | Middleborough Center | 3 | 80,378(0.00%)#95 | 1,060,713(0.00%)#2,612 |
| 96. | Williamstown | 3 | 80,378(0.00%)#96 | 1,060,713(0.00%)#2,624 |
| 97. | Hopkinton | 3 | 80,378(0.00%)#97 | 1,060,713(0.00%)#2,627 |
| 98. | Upton | 3 | 80,378(0.00%)#98 | 1,060,713(0.00%)#2,630 |
| 99. | Westborough | 2 | 80,378(0.00%)#99 | 1,060,713(0.00%)#2,666 |
| 100. | Vineyard Haven | 2 | 80,378(0.00%)#100 | 1,060,713(0.00%)#2,677 |
Common Questions
What are the Top 10 Cities with the Largest Haitian Community in Massachusetts?
Top 10 Cities with the Largest Haitian Community in Massachusetts are:
#1
21,059
#2
14,051
#3
4,396
#4
3,295
#5
2,879
#6
2,120
#7
2,069
#8
1,926
#9
1,525
#10
1,162
What city has the Largest Haitian Community in Massachusetts?
Boston has the Largest Haitian Community in Massachusetts with 21,059.
What is the Total Haitian Population in the State of Massachusetts?
Total Haitian Population in Massachusetts is 80,378.
What is the Total Haitian Population in the United States?
Total Haitian Population in the United States is 1,060,713.