Cities with the Highest Percentage of Population Enrolled in Elementary School in Massachusetts
RELATED REPORTS & OPTIONS
Elementary School
Massachusetts
Compare Cities
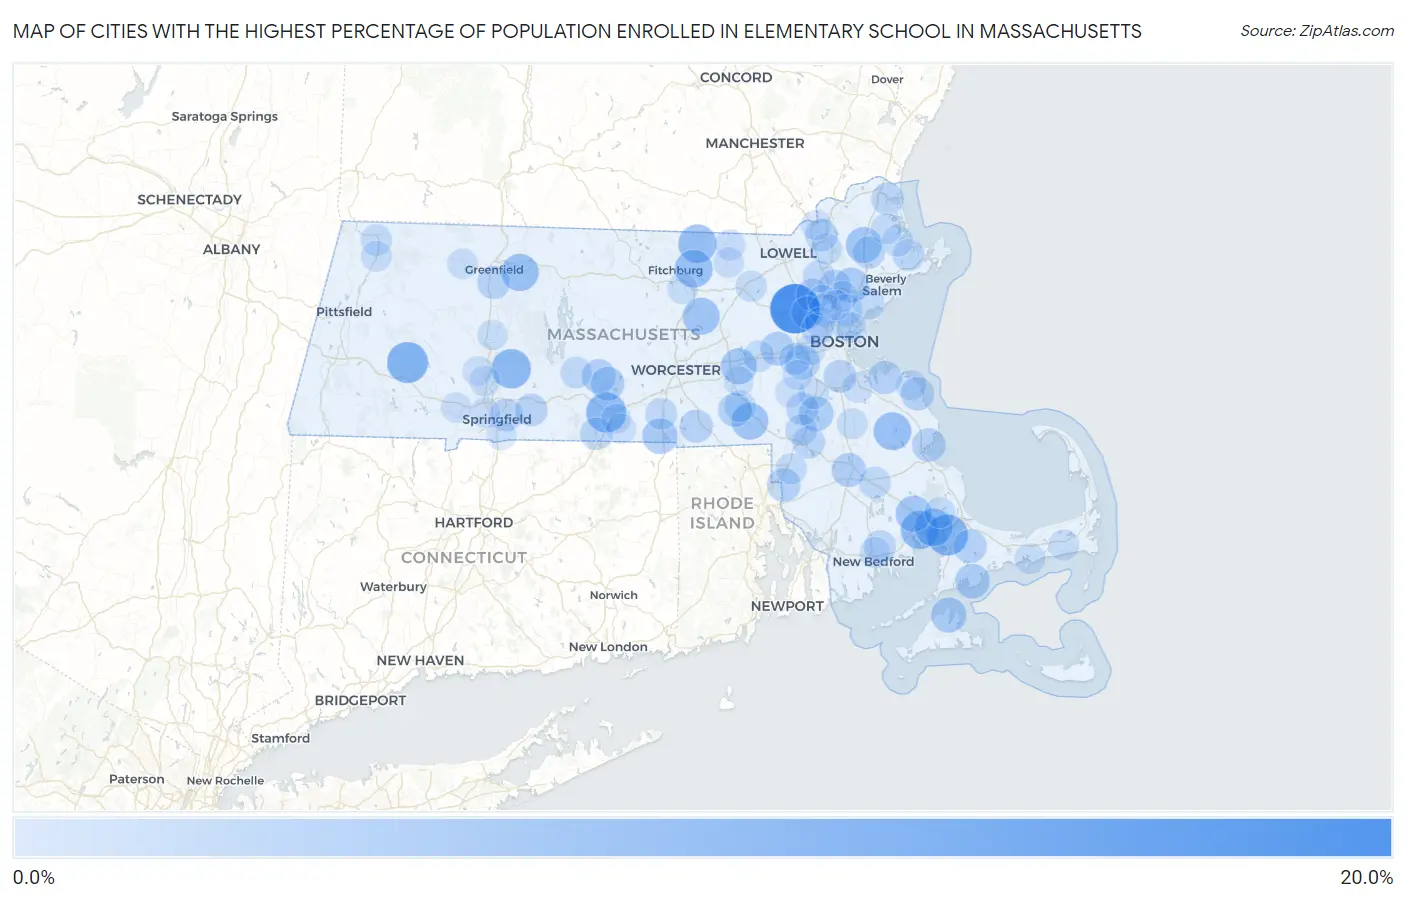
Map of Cities with the Highest Percentage of Population Enrolled in Elementary School in Massachusetts
0.0%
20.0%
Cities with the Highest Percentage of Population Enrolled in Elementary School in Massachusetts
| City | % in Elementary | vs State | vs National | |
| 1. | Hanscom Afb | 17.6% | 4.3%(+13.3)#1 | 4.9%(+12.7)#345 |
| 2. | Chester | 11.7% | 4.3%(+7.47)#2 | 4.9%(+6.81)#1,251 |
| 3. | Monument Beach | 11.7% | 4.3%(+7.44)#3 | 4.9%(+6.78)#1,258 |
| 4. | Fiskdale | 11.1% | 4.3%(+6.80)#4 | 4.9%(+6.14)#1,524 |
| 5. | Granby | 10.5% | 4.3%(+6.28)#5 | 4.9%(+5.61)#1,779 |
| 6. | Cedar Crest | 10.1% | 4.3%(+5.81)#6 | 4.9%(+5.15)#2,025 |
| 7. | Weweantic | 10.0% | 4.3%(+5.71)#7 | 4.9%(+5.05)#2,090 |
| 8. | Townsend | 9.7% | 4.3%(+5.43)#8 | 4.9%(+4.77)#2,270 |
| 9. | Onset | 9.5% | 4.3%(+5.24)#9 | 4.9%(+4.57)#2,412 |
| 10. | Lunenburg | 9.5% | 4.3%(+5.22)#10 | 4.9%(+4.56)#2,429 |
| 11. | Hanson | 9.4% | 4.3%(+5.09)#11 | 4.9%(+4.42)#2,526 |
| 12. | Millers Falls | 9.2% | 4.3%(+4.94)#12 | 4.9%(+4.28)#2,639 |
| 13. | South Lancaster | 8.8% | 4.3%(+4.56)#13 | 4.9%(+3.90)#3,008 |
| 14. | Bellingham | 8.7% | 4.3%(+4.42)#14 | 4.9%(+3.76)#3,164 |
| 15. | West Wareham | 8.4% | 4.3%(+4.09)#15 | 4.9%(+3.42)#3,563 |
| 16. | Boxford | 8.3% | 4.3%(+4.00)#16 | 4.9%(+3.34)#3,694 |
| 17. | Cordaville | 8.2% | 4.3%(+3.93)#17 | 4.9%(+3.27)#3,804 |
| 18. | Webster | 7.8% | 4.3%(+3.58)#18 | 4.9%(+2.91)#4,321 |
| 19. | Vineyard Haven | 7.7% | 4.3%(+3.40)#19 | 4.9%(+2.73)#4,661 |
| 20. | Lynnfield | 7.4% | 4.3%(+3.17)#20 | 4.9%(+2.51)#5,087 |
| 21. | Monomoscoy Island | 7.3% | 4.3%(+3.05)#21 | 4.9%(+2.39)#5,334 |
| 22. | Sharon | 7.3% | 4.3%(+3.04)#22 | 4.9%(+2.37)#5,364 |
| 23. | Needham | 7.2% | 4.3%(+2.98)#23 | 4.9%(+2.32)#5,481 |
| 24. | West Brookfield | 7.0% | 4.3%(+2.73)#24 | 4.9%(+2.07)#5,975 |
| 25. | Raynham Center | 6.9% | 4.3%(+2.67)#25 | 4.9%(+2.01)#6,102 |
| 26. | Brookfield | 6.9% | 4.3%(+2.64)#26 | 4.9%(+1.98)#6,177 |
| 27. | Cochituate | 6.9% | 4.3%(+2.62)#27 | 4.9%(+1.96)#6,240 |
| 28. | Hopedale | 6.7% | 4.3%(+2.47)#28 | 4.9%(+1.81)#6,599 |
| 29. | Forestdale | 6.6% | 4.3%(+2.37)#29 | 4.9%(+1.71)#6,865 |
| 30. | South Duxbury | 6.6% | 4.3%(+2.36)#30 | 4.9%(+1.70)#6,893 |
| 31. | North Seekonk | 6.6% | 4.3%(+2.30)#31 | 4.9%(+1.64)#7,061 |
| 32. | Scituate | 6.5% | 4.3%(+2.26)#32 | 4.9%(+1.59)#7,185 |
| 33. | Hingham | 6.5% | 4.3%(+2.24)#33 | 4.9%(+1.58)#7,234 |
| 34. | Deerfield | 6.4% | 4.3%(+2.11)#34 | 4.9%(+1.45)#7,623 |
| 35. | East Douglas | 6.3% | 4.3%(+2.07)#35 | 4.9%(+1.41)#7,747 |
| 36. | Reading | 6.2% | 4.3%(+1.90)#36 | 4.9%(+1.24)#8,337 |
| 37. | Milton | 6.2% | 4.3%(+1.89)#37 | 4.9%(+1.23)#8,355 |
| 38. | Springfield | 6.1% | 4.3%(+1.85)#38 | 4.9%(+1.19)#8,508 |
| 39. | Burlington | 6.1% | 4.3%(+1.82)#39 | 4.9%(+1.15)#8,608 |
| 40. | Wilbraham | 6.0% | 4.3%(+1.76)#40 | 4.9%(+1.10)#8,818 |
| 41. | Lexington | 6.0% | 4.3%(+1.75)#41 | 4.9%(+1.08)#8,859 |
| 42. | Lawrence | 6.0% | 4.3%(+1.70)#42 | 4.9%(+1.04)#9,021 |
| 43. | Holland | 5.9% | 4.3%(+1.67)#43 | 4.9%(+1.01)#9,133 |
| 44. | Newburyport | 5.9% | 4.3%(+1.67)#44 | 4.9%(+1.00)#9,157 |
| 45. | Mansfield Center | 5.9% | 4.3%(+1.65)#45 | 4.9%(+0.992)#9,207 |
| 46. | Walpole | 5.8% | 4.3%(+1.58)#46 | 4.9%(+0.918)#9,466 |
| 47. | Topsfield | 5.8% | 4.3%(+1.56)#47 | 4.9%(+0.899)#9,526 |
| 48. | Winchester | 5.7% | 4.3%(+1.40)#48 | 4.9%(+0.733)#10,128 |
| 49. | Essex | 5.6% | 4.3%(+1.35)#49 | 4.9%(+0.689)#10,320 |
| 50. | Acushnet Center | 5.6% | 4.3%(+1.32)#50 | 4.9%(+0.659)#10,436 |
| 51. | Belmont | 5.5% | 4.3%(+1.28)#51 | 4.9%(+0.619)#10,607 |
| 52. | Wellesley | 5.5% | 4.3%(+1.27)#52 | 4.9%(+0.609)#10,642 |
| 53. | Foxborough | 5.5% | 4.3%(+1.24)#53 | 4.9%(+0.581)#10,757 |
| 54. | Oxford | 5.5% | 4.3%(+1.21)#54 | 4.9%(+0.545)#10,922 |
| 55. | Wilmington | 5.4% | 4.3%(+1.15)#55 | 4.9%(+0.489)#11,170 |
| 56. | Middleborough Center | 5.4% | 4.3%(+1.14)#56 | 4.9%(+0.474)#11,236 |
| 57. | Melrose | 5.4% | 4.3%(+1.10)#57 | 4.9%(+0.435)#11,390 |
| 58. | Ware | 5.3% | 4.3%(+1.07)#58 | 4.9%(+0.403)#11,526 |
| 59. | North Adams | 5.3% | 4.3%(+1.06)#59 | 4.9%(+0.394)#11,551 |
| 60. | Lynn | 5.3% | 4.3%(+1.03)#60 | 4.9%(+0.371)#11,652 |
| 61. | Milford | 5.3% | 4.3%(+1.02)#61 | 4.9%(+0.359)#11,704 |
| 62. | Andover | 5.2% | 4.3%(+0.981)#62 | 4.9%(+0.318)#11,872 |
| 63. | Framingham | 5.1% | 4.3%(+0.835)#63 | 4.9%(+0.173)#12,494 |
| 64. | Littleton Common | 5.1% | 4.3%(+0.813)#64 | 4.9%(+0.151)#12,598 |
| 65. | Everett | 5.1% | 4.3%(+0.796)#65 | 4.9%(+0.133)#12,698 |
| 66. | Ipswich | 5.0% | 4.3%(+0.697)#66 | 4.9%(+0.034)#13,131 |
| 67. | White Island Shores | 4.9% | 4.3%(+0.682)#67 | 4.9%(+0.019)#13,199 |
| 68. | Attleboro | 4.9% | 4.3%(+0.623)#68 | 4.9%(-0.040)#13,476 |
| 69. | Rowley | 4.9% | 4.3%(+0.616)#69 | 4.9%(-0.047)#13,511 |
| 70. | Brockton | 4.9% | 4.3%(+0.615)#70 | 4.9%(-0.048)#13,516 |
| 71. | Northwest Harwich | 4.9% | 4.3%(+0.590)#71 | 4.9%(-0.073)#13,634 |
| 72. | New Bedford | 4.8% | 4.3%(+0.572)#72 | 4.9%(-0.091)#13,717 |
| 73. | Adams | 4.8% | 4.3%(+0.546)#73 | 4.9%(-0.117)#13,828 |
| 74. | West Yarmouth | 4.8% | 4.3%(+0.543)#74 | 4.9%(-0.120)#13,852 |
| 75. | Holyoke | 4.8% | 4.3%(+0.537)#75 | 4.9%(-0.125)#13,879 |
| 76. | Norwood | 4.8% | 4.3%(+0.537)#76 | 4.9%(-0.125)#13,880 |
| 77. | Newton | 4.8% | 4.3%(+0.520)#77 | 4.9%(-0.143)#13,969 |
| 78. | North Scituate | 4.7% | 4.3%(+0.477)#78 | 4.9%(-0.186)#14,177 |
| 79. | Leominster | 4.7% | 4.3%(+0.445)#79 | 4.9%(-0.218)#14,302 |
| 80. | East Pepperell | 4.7% | 4.3%(+0.439)#80 | 4.9%(-0.224)#14,330 |
| 81. | Shelburne Falls | 4.7% | 4.3%(+0.401)#81 | 4.9%(-0.262)#14,501 |
| 82. | West Springfield Town | 4.7% | 4.3%(+0.391)#82 | 4.9%(-0.272)#14,544 |
| 83. | Wakefield | 4.6% | 4.3%(+0.377)#83 | 4.9%(-0.286)#14,607 |
| 84. | Arlington | 4.6% | 4.3%(+0.342)#84 | 4.9%(-0.321)#14,777 |
| 85. | Westfield | 4.6% | 4.3%(+0.333)#85 | 4.9%(-0.330)#14,827 |
| 86. | Methuen Town | 4.6% | 4.3%(+0.313)#86 | 4.9%(-0.349)#14,913 |
| 87. | Braintree Town | 4.6% | 4.3%(+0.285)#87 | 4.9%(-0.378)#15,024 |
| 88. | Hatfield | 4.5% | 4.3%(+0.265)#88 | 4.9%(-0.398)#15,123 |
| 89. | Groton | 4.5% | 4.3%(+0.228)#89 | 4.9%(-0.435)#15,299 |
| 90. | Greenfield | 4.5% | 4.3%(+0.209)#90 | 4.9%(-0.454)#15,389 |
| 91. | Chelsea | 4.4% | 4.3%(+0.164)#91 | 4.9%(-0.499)#15,584 |
| 92. | Woburn | 4.4% | 4.3%(+0.145)#92 | 4.9%(-0.518)#15,702 |
| 93. | Medfield | 4.4% | 4.3%(+0.143)#93 | 4.9%(-0.520)#15,708 |
| 94. | Hopkinton | 4.4% | 4.3%(+0.122)#94 | 4.9%(-0.541)#15,808 |
| 95. | Easthampton Town | 4.4% | 4.3%(+0.116)#95 | 4.9%(-0.547)#15,838 |
| 96. | Stoneham | 4.4% | 4.3%(+0.111)#96 | 4.9%(-0.552)#15,862 |
| 97. | Southbridge Town | 4.4% | 4.3%(+0.104)#97 | 4.9%(-0.559)#15,904 |
| 98. | Longmeadow | 4.4% | 4.3%(+0.103)#98 | 4.9%(-0.560)#15,908 |
| 99. | Dover | 4.3% | 4.3%(+0.071)#99 | 4.9%(-0.592)#16,070 |
| 100. | Sturbridge | 4.3% | 4.3%(+0.063)#100 | 4.9%(-0.600)#16,100 |
Common Questions
What are the Top 10 Cities with the Highest Percentage of Population Enrolled in Elementary School in Massachusetts?
Top 10 Cities with the Highest Percentage of Population Enrolled in Elementary School in Massachusetts are:
#1
17.6%
#2
11.7%
#3
11.7%
#4
11.1%
#5
10.5%
#6
10.0%
#7
9.7%
#8
9.5%
#9
9.5%
#10
9.4%
What city has the Highest Percentage of Population Enrolled in Elementary School in Massachusetts?
Hanscom AFB has the Highest Percentage of Population Enrolled in Elementary School in Massachusetts with 17.6%.
What is the Percentage of Population Enrolled in Elementary School in the State of Massachusetts?
Percentage of Population Enrolled in Elementary School in Massachusetts is 4.3%.
What is the Percentage of Population Enrolled in Elementary School in the United States?
Percentage of Population Enrolled in Elementary School in the United States is 4.9%.