Cities with the Lowest Percentage of Single Mothers in Massachusetts
RELATED REPORTS & OPTIONS
Fewest Single Mothers
Massachusetts
Compare Cities
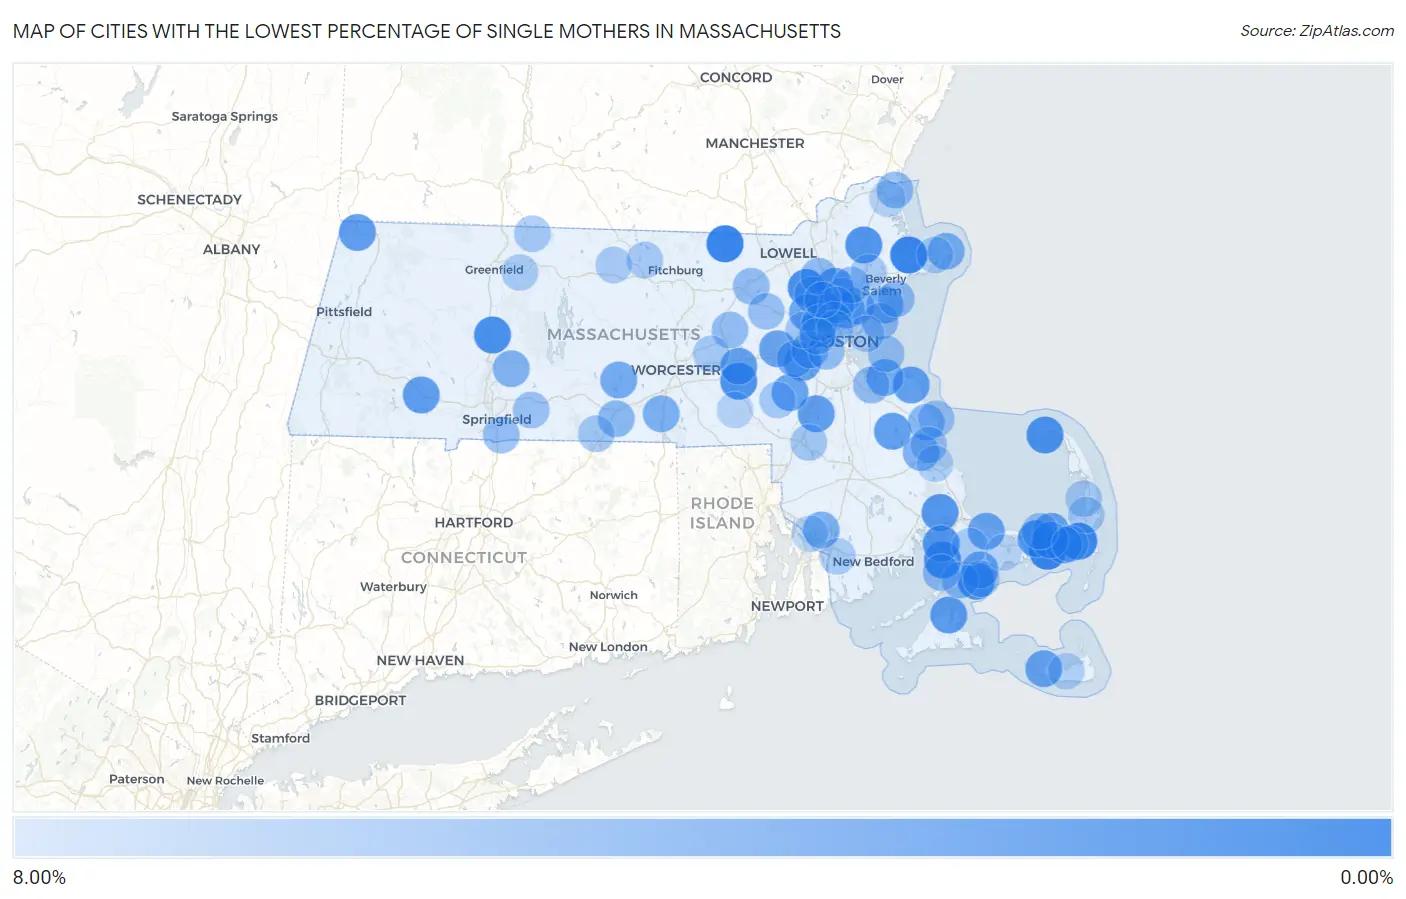
Map of Cities with the Lowest Percentage of Single Mothers in Massachusetts
8.00%
0.00%
Cities with the Lowest Percentage of Single Mothers in Massachusetts
| City | % Single Mothers | vs State | vs National | |
| 1. | Pepperell | 1.60% | 10.74%(-9.15)#1 | 11.49%(-9.89)#592 |
| 2. | West Dennis | 1.60% | 10.74%(-9.14)#2 | 11.49%(-9.89)#595 |
| 3. | Essex | 1.62% | 10.74%(-9.12)#3 | 11.49%(-9.86)#621 |
| 4. | East Harwich | 1.69% | 10.74%(-9.06)#4 | 11.49%(-9.80)#668 |
| 5. | Cedar Crest | 2.16% | 10.74%(-8.58)#5 | 11.49%(-9.33)#1,072 |
| 6. | North Falmouth | 2.33% | 10.74%(-8.41)#6 | 11.49%(-9.16)#1,235 |
| 7. | Hatfield | 2.40% | 10.74%(-8.34)#7 | 11.49%(-9.09)#1,291 |
| 8. | Yarmouth Port | 2.50% | 10.74%(-8.24)#8 | 11.49%(-8.99)#1,385 |
| 9. | Pinehurst | 2.51% | 10.74%(-8.23)#9 | 11.49%(-8.97)#1,399 |
| 10. | Hopkinton | 2.60% | 10.74%(-8.14)#10 | 11.49%(-8.89)#1,479 |
| 11. | Provincetown | 2.61% | 10.74%(-8.13)#11 | 11.49%(-8.88)#1,494 |
| 12. | New Seabury | 2.71% | 10.74%(-8.03)#12 | 11.49%(-8.77)#1,589 |
| 13. | Boxford | 2.83% | 10.74%(-7.91)#13 | 11.49%(-8.66)#1,728 |
| 14. | White Island Shores | 2.97% | 10.74%(-7.77)#14 | 11.49%(-8.52)#1,888 |
| 15. | Pocasset | 3.09% | 10.74%(-7.65)#15 | 11.49%(-8.39)#2,004 |
| 16. | Vineyard Haven | 3.35% | 10.74%(-7.39)#16 | 11.49%(-8.13)#2,260 |
| 17. | Reading | 3.36% | 10.74%(-7.38)#17 | 11.49%(-8.12)#2,270 |
| 18. | Williamstown | 3.49% | 10.74%(-7.25)#18 | 11.49%(-8.00)#2,403 |
| 19. | Blandford | 3.49% | 10.74%(-7.25)#19 | 11.49%(-8.00)#2,408 |
| 20. | Sharon | 3.55% | 10.74%(-7.19)#20 | 11.49%(-7.93)#2,475 |
| 21. | Hanson | 3.61% | 10.74%(-7.13)#21 | 11.49%(-7.88)#2,543 |
| 22. | North Scituate | 3.66% | 10.74%(-7.08)#22 | 11.49%(-7.83)#2,590 |
| 23. | Needham | 3.79% | 10.74%(-6.95)#23 | 11.49%(-7.69)#2,739 |
| 24. | Cordaville | 3.84% | 10.74%(-6.90)#24 | 11.49%(-7.65)#2,772 |
| 25. | East Sandwich | 3.92% | 10.74%(-6.82)#25 | 11.49%(-7.57)#2,881 |
| 26. | East Dennis | 3.93% | 10.74%(-6.81)#26 | 11.49%(-7.56)#2,902 |
| 27. | Madaket | 3.94% | 10.74%(-6.80)#27 | 11.49%(-7.55)#2,912 |
| 28. | Cochituate | 3.95% | 10.74%(-6.79)#28 | 11.49%(-7.54)#2,919 |
| 29. | Northwest Harwich | 4.01% | 10.74%(-6.73)#29 | 11.49%(-7.48)#3,010 |
| 30. | Medfield | 4.04% | 10.74%(-6.70)#30 | 11.49%(-7.45)#3,039 |
| 31. | South Dennis | 4.09% | 10.74%(-6.65)#31 | 11.49%(-7.40)#3,096 |
| 32. | Lexington | 4.15% | 10.74%(-6.59)#32 | 11.49%(-7.34)#3,159 |
| 33. | Melrose | 4.15% | 10.74%(-6.59)#33 | 11.49%(-7.33)#3,168 |
| 34. | Mashpee Neck | 4.35% | 10.74%(-6.39)#34 | 11.49%(-7.14)#3,391 |
| 35. | Hingham | 4.51% | 10.74%(-6.23)#35 | 11.49%(-6.98)#3,580 |
| 36. | East Brookfield | 4.52% | 10.74%(-6.22)#36 | 11.49%(-6.96)#3,599 |
| 37. | Swampscott | 4.66% | 10.74%(-6.08)#37 | 11.49%(-6.82)#3,775 |
| 38. | Winchester | 4.79% | 10.74%(-5.95)#38 | 11.49%(-6.69)#3,958 |
| 39. | Oxford | 4.83% | 10.74%(-5.91)#39 | 11.49%(-6.66)#3,991 |
| 40. | Rockport | 4.85% | 10.74%(-5.89)#40 | 11.49%(-6.64)#4,018 |
| 41. | Somerset | 4.94% | 10.74%(-5.80)#41 | 11.49%(-6.55)#4,122 |
| 42. | Belmont | 4.95% | 10.74%(-5.79)#42 | 11.49%(-6.54)#4,128 |
| 43. | Kingston | 5.00% | 10.74%(-5.74)#43 | 11.49%(-6.49)#4,170 |
| 44. | Wellesley | 5.06% | 10.74%(-5.68)#44 | 11.49%(-6.43)#4,261 |
| 45. | Granby | 5.11% | 10.74%(-5.64)#45 | 11.49%(-6.38)#4,318 |
| 46. | Newton | 5.20% | 10.74%(-5.54)#46 | 11.49%(-6.29)#4,414 |
| 47. | Burlington | 5.41% | 10.74%(-5.33)#47 | 11.49%(-6.07)#4,681 |
| 48. | Marshfield | 5.48% | 10.74%(-5.26)#48 | 11.49%(-6.00)#4,757 |
| 49. | Sturbridge | 5.50% | 10.74%(-5.24)#49 | 11.49%(-5.99)#4,775 |
| 50. | Saugus | 5.57% | 10.74%(-5.17)#50 | 11.49%(-5.92)#4,871 |
| 51. | East Falmouth | 5.57% | 10.74%(-5.17)#51 | 11.49%(-5.91)#4,874 |
| 52. | Wilmington | 5.85% | 10.74%(-4.89)#52 | 11.49%(-5.64)#5,203 |
| 53. | West Falmouth | 5.85% | 10.74%(-4.89)#53 | 11.49%(-5.64)#5,209 |
| 54. | Nahant | 5.86% | 10.74%(-4.88)#54 | 11.49%(-5.63)#5,217 |
| 55. | Salisbury | 5.86% | 10.74%(-4.88)#55 | 11.49%(-5.63)#5,218 |
| 56. | Littleton Common | 5.91% | 10.74%(-4.83)#56 | 11.49%(-5.58)#5,304 |
| 57. | Marblehead | 5.96% | 10.74%(-4.78)#57 | 11.49%(-5.53)#5,358 |
| 58. | Weymouth Town | 5.98% | 10.74%(-4.77)#58 | 11.49%(-5.51)#5,377 |
| 59. | Hudson | 5.98% | 10.74%(-4.76)#59 | 11.49%(-5.51)#5,379 |
| 60. | Longmeadow | 5.99% | 10.74%(-4.76)#60 | 11.49%(-5.50)#5,391 |
| 61. | Brookline | 6.03% | 10.74%(-4.72)#61 | 11.49%(-5.46)#5,437 |
| 62. | Wakefield | 6.23% | 10.74%(-4.52)#62 | 11.49%(-5.26)#5,683 |
| 63. | West Concord | 6.25% | 10.74%(-4.49)#63 | 11.49%(-5.23)#5,772 |
| 64. | Lynnfield | 6.26% | 10.74%(-4.48)#64 | 11.49%(-5.23)#5,775 |
| 65. | Wilbraham | 6.30% | 10.74%(-4.44)#65 | 11.49%(-5.19)#5,808 |
| 66. | Dennis | 6.30% | 10.74%(-4.44)#66 | 11.49%(-5.19)#5,812 |
| 67. | Hull | 6.36% | 10.74%(-4.38)#67 | 11.49%(-5.12)#5,899 |
| 68. | Ocean Bluff Brant Rock | 6.55% | 10.74%(-4.19)#68 | 11.49%(-4.94)#6,156 |
| 69. | South Duxbury | 6.58% | 10.74%(-4.16)#69 | 11.49%(-4.91)#6,194 |
| 70. | Mansfield Center | 6.70% | 10.74%(-4.04)#70 | 11.49%(-4.79)#6,362 |
| 71. | Popponesset | 6.73% | 10.74%(-4.01)#71 | 11.49%(-4.76)#6,400 |
| 72. | Holland | 6.73% | 10.74%(-4.01)#72 | 11.49%(-4.75)#6,406 |
| 73. | Waltham | 6.77% | 10.74%(-3.97)#73 | 11.49%(-4.72)#6,456 |
| 74. | Northfield | 6.81% | 10.74%(-3.93)#74 | 11.49%(-4.68)#6,498 |
| 75. | Millis Clicquot | 6.85% | 10.74%(-3.89)#75 | 11.49%(-4.64)#6,543 |
| 76. | Winthrop Town | 6.85% | 10.74%(-3.89)#76 | 11.49%(-4.64)#6,544 |
| 77. | Arlington | 6.85% | 10.74%(-3.89)#77 | 11.49%(-4.63)#6,556 |
| 78. | Northborough | 6.86% | 10.74%(-3.88)#78 | 11.49%(-4.63)#6,559 |
| 79. | Stoneham | 6.94% | 10.74%(-3.80)#79 | 11.49%(-4.55)#6,669 |
| 80. | North Eastham | 6.96% | 10.74%(-3.78)#80 | 11.49%(-4.53)#6,695 |
| 81. | South Ashburnham | 6.96% | 10.74%(-3.78)#81 | 11.49%(-4.52)#6,700 |
| 82. | Baldwinville | 7.07% | 10.74%(-3.67)#82 | 11.49%(-4.41)#6,829 |
| 83. | Medford | 7.09% | 10.74%(-3.65)#83 | 11.49%(-4.40)#6,848 |
| 84. | Orleans | 7.09% | 10.74%(-3.65)#84 | 11.49%(-4.40)#6,852 |
| 85. | Danvers | 7.09% | 10.74%(-3.65)#85 | 11.49%(-4.40)#6,856 |
| 86. | Millers Falls | 7.11% | 10.74%(-3.63)#86 | 11.49%(-4.37)#6,886 |
| 87. | Somerville | 7.12% | 10.74%(-3.62)#87 | 11.49%(-4.37)#6,895 |
| 88. | Forestdale | 7.12% | 10.74%(-3.62)#88 | 11.49%(-4.36)#6,898 |
| 89. | North Westport | 7.16% | 10.74%(-3.58)#89 | 11.49%(-4.33)#6,979 |
| 90. | Gloucester | 7.16% | 10.74%(-3.58)#90 | 11.49%(-4.33)#6,982 |
| 91. | Watertown Town | 7.24% | 10.74%(-3.51)#91 | 11.49%(-4.25)#7,076 |
| 92. | Harwich Center | 7.26% | 10.74%(-3.48)#92 | 11.49%(-4.23)#7,103 |
| 93. | Plymouth | 7.31% | 10.74%(-3.43)#93 | 11.49%(-4.17)#7,175 |
| 94. | Nantucket | 7.39% | 10.74%(-3.35)#94 | 11.49%(-4.10)#7,278 |
| 95. | Woburn | 7.39% | 10.74%(-3.35)#95 | 11.49%(-4.10)#7,284 |
| 96. | Ocean Grove | 7.50% | 10.74%(-3.24)#96 | 11.49%(-3.99)#7,416 |
| 97. | Hopedale | 7.56% | 10.74%(-3.18)#97 | 11.49%(-3.93)#7,495 |
| 98. | Newburyport | 7.63% | 10.74%(-3.11)#98 | 11.49%(-3.86)#7,580 |
| 99. | Barnstable Town | 7.64% | 10.74%(-3.10)#99 | 11.49%(-3.85)#7,596 |
| 100. | North Attleborough | 7.64% | 10.74%(-3.10)#100 | 11.49%(-3.85)#7,598 |
Common Questions
What are the Top 10 Cities with the Lowest Percentage of Single Mothers in Massachusetts?
Top 10 Cities with the Lowest Percentage of Single Mothers in Massachusetts are:
#1
1.60%
#2
1.60%
#3
1.62%
#4
1.69%
#5
2.33%
#6
2.40%
#7
2.50%
#8
2.51%
#9
2.60%
#10
2.61%
What city has the Lowest Percentage of Single Mothers in Massachusetts?
Pepperell has the Lowest Percentage of Single Mothers in Massachusetts with 1.60%.
What is the Percentage of Single Mothers in the State of Massachusetts?
Percentage of Single Mothers in Massachusetts is 10.74%.
What is the Percentage of Single Mothers in the United States?
Percentage of Single Mothers in the United States is 11.49%.