Norton Center, MA Map & Demographics
Norton Center Map
Norton Center Overview
$26,087
PER CAPITA INCOME
$138,750
AVG FAMILY INCOME
$109,356
AVG HOUSEHOLD INCOME
42.8%
WAGE / INCOME GAP [ % ]
57.2¢/ $1
WAGE / INCOME GAP [ $ ]
0.36
INEQUALITY / GINI INDEX
2,580
TOTAL POPULATION
1,304
MALE POPULATION
1,276
FEMALE POPULATION
102.19
MALES / 100 FEMALES
97.85
FEMALES / 100 MALES
21.5
MEDIAN AGE
3.2
AVG FAMILY SIZE
2.5
AVG HOUSEHOLD SIZE
1,322
LABOR FORCE [ PEOPLE ]
54.1%
PERCENT IN LABOR FORCE
4.1%
UNEMPLOYMENT RATE
Income in Norton Center
Income Overview in Norton Center
Per Capita Income in Norton Center is $26,087, while median incomes of families and households are $138,750 and $109,356 respectively.
| Characteristic | Number | Measure |
| Per Capita Income | 2,580 | $26,087 |
| Median Family Income | 246 | $138,750 |
| Mean Family Income | 246 | $175,917 |
| Median Household Income | 376 | $109,356 |
| Mean Household Income | 376 | $150,566 |
| Income Deficit | 246 | $0 |
| Wage / Income Gap (%) | 2,580 | 42.84% |
| Wage / Income Gap ($) | 2,580 | 57.16¢ per $1 |
| Gini / Inequality Index | 2,580 | 0.36 |
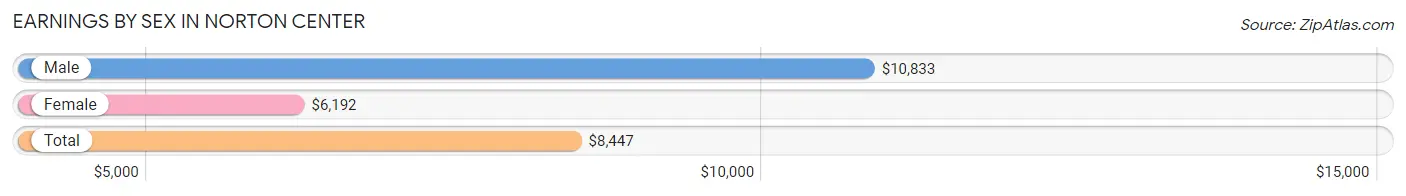
Earnings by Sex in Norton Center
Average Earnings in Norton Center are $8,447, $10,833 for men and $6,192 for women, a difference of 42.8%.
| Sex | Number | Average Earnings |
| Male | 904 (49.6%) | $10,833 |
| Female | 918 (50.4%) | $6,192 |
| Total | 1,822 (100.0%) | $8,447 |
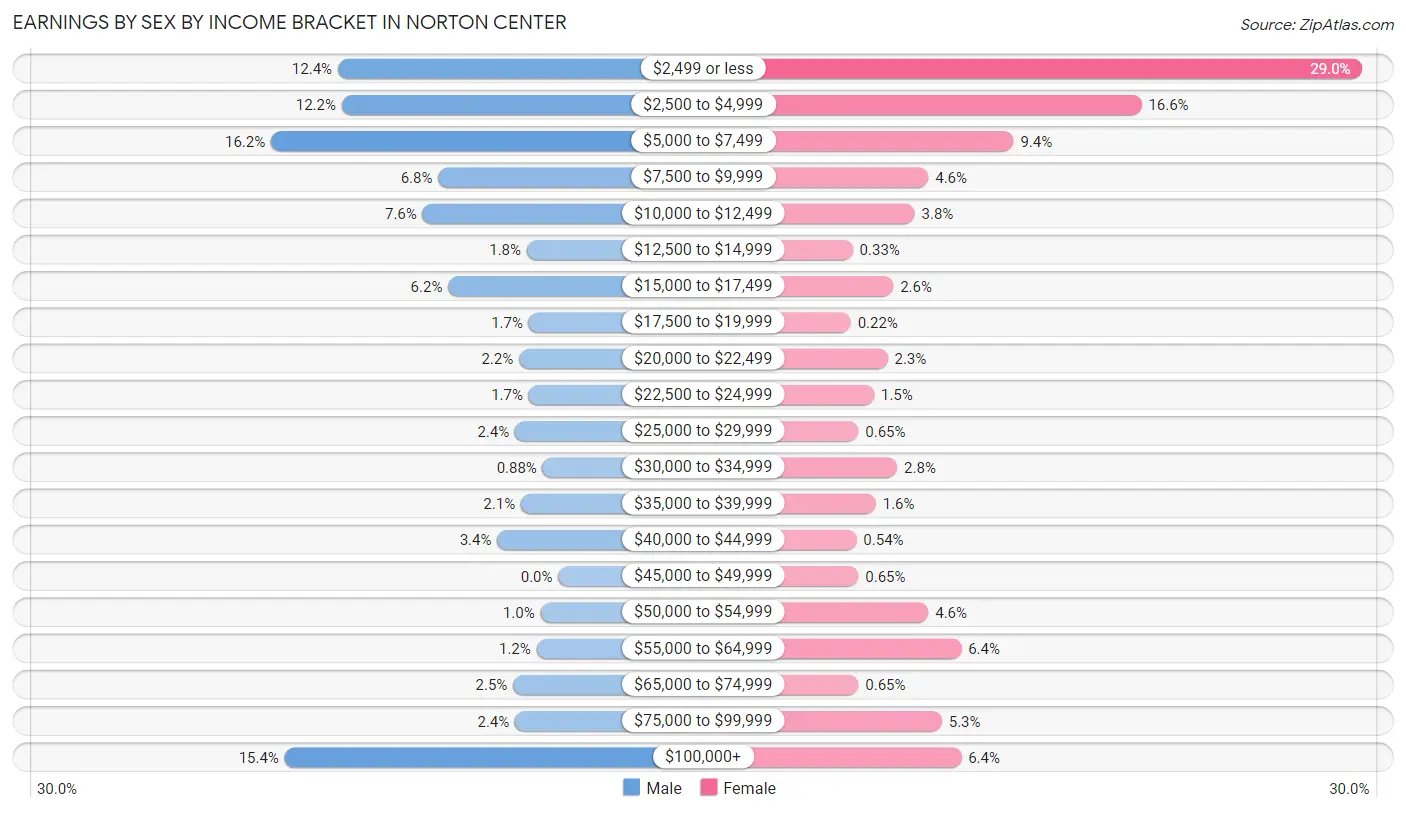
Earnings by Sex by Income Bracket in Norton Center
The most common earnings brackets in Norton Center are $5,000 to $7,499 for men (146 | 16.2%) and $2,499 or less for women (266 | 29.0%).
| Income | Male | Female |
| $2,499 or less | 112 (12.4%) | 266 (29.0%) |
| $2,500 to $4,999 | 110 (12.2%) | 152 (16.6%) |
| $5,000 to $7,499 | 146 (16.2%) | 86 (9.4%) |
| $7,500 to $9,999 | 61 (6.8%) | 42 (4.6%) |
| $10,000 to $12,499 | 69 (7.6%) | 35 (3.8%) |
| $12,500 to $14,999 | 16 (1.8%) | 3 (0.3%) |
| $15,000 to $17,499 | 56 (6.2%) | 24 (2.6%) |
| $17,500 to $19,999 | 15 (1.7%) | 2 (0.2%) |
| $20,000 to $22,499 | 20 (2.2%) | 21 (2.3%) |
| $22,500 to $24,999 | 15 (1.7%) | 14 (1.5%) |
| $25,000 to $29,999 | 22 (2.4%) | 6 (0.6%) |
| $30,000 to $34,999 | 8 (0.9%) | 26 (2.8%) |
| $35,000 to $39,999 | 19 (2.1%) | 15 (1.6%) |
| $40,000 to $44,999 | 31 (3.4%) | 5 (0.5%) |
| $45,000 to $49,999 | 0 (0.0%) | 6 (0.6%) |
| $50,000 to $54,999 | 9 (1.0%) | 42 (4.6%) |
| $55,000 to $64,999 | 11 (1.2%) | 59 (6.4%) |
| $65,000 to $74,999 | 23 (2.5%) | 6 (0.6%) |
| $75,000 to $99,999 | 22 (2.4%) | 49 (5.3%) |
| $100,000+ | 139 (15.4%) | 59 (6.4%) |
| Total | 904 (100.0%) | 918 (100.0%) |
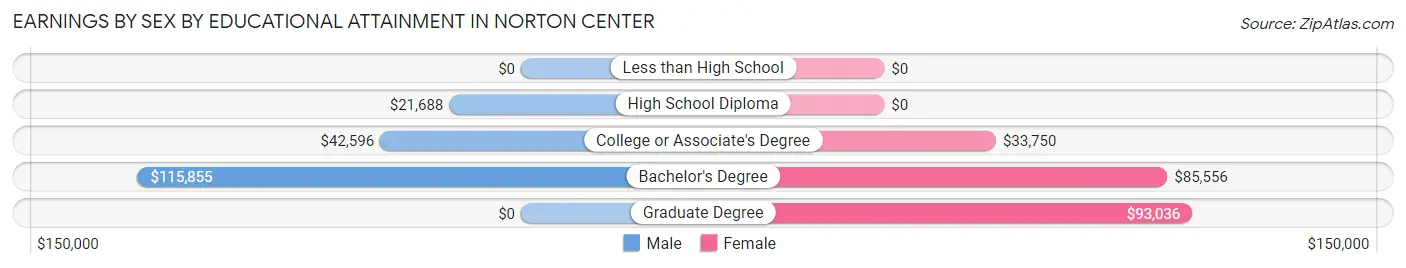
Earnings by Sex by Educational Attainment in Norton Center
Average earnings in Norton Center are $50,833 for men and $60,833 for women, a difference of 16.4%. Men with an educational attainment of bachelor's degree enjoy the highest average annual earnings of $115,855, while those with high school diploma education earn the least with $21,688. Women with an educational attainment of graduate degree earn the most with the average annual earnings of $93,036, while those with college or associate's degree education have the smallest earnings of $33,750.
| Educational Attainment | Male Income | Female Income |
| Less than High School | - | - |
| High School Diploma | $21,688 | $0 |
| College or Associate's Degree | $42,596 | $33,750 |
| Bachelor's Degree | $115,855 | $85,556 |
| Graduate Degree | - | - |
| Total | $50,833 | $60,833 |
Family Income in Norton Center
Family Income Brackets in Norton Center
According to the Norton Center family income data, there are 101 families falling into the $200,000+ income range, which is the most common income bracket and makes up 41.1% of all families.
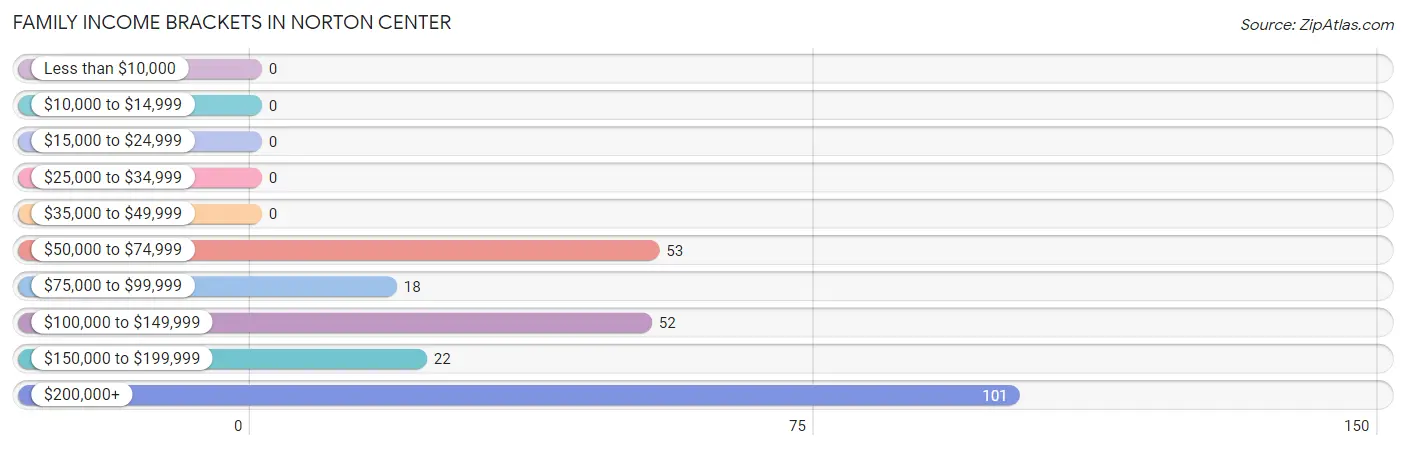
| Income Bracket | # Families | % Families |
| Less than $10,000 | 0 | 0.0% |
| $10,000 to $14,999 | 0 | 0.0% |
| $15,000 to $24,999 | 0 | 0.0% |
| $25,000 to $34,999 | 0 | 0.0% |
| $35,000 to $49,999 | 0 | 0.0% |
| $50,000 to $74,999 | 53 | 21.5% |
| $75,000 to $99,999 | 18 | 7.3% |
| $100,000 to $149,999 | 52 | 21.1% |
| $150,000 to $199,999 | 22 | 8.9% |
| $200,000+ | 101 | 41.1% |
Family Income by Famaliy Size in Norton Center
3-person families (56 | 22.8%) account for the highest median family income in Norton Center with $230,882 per family, while 2-person families (103 | 41.9%) have the highest median income of $95,312 per family member.
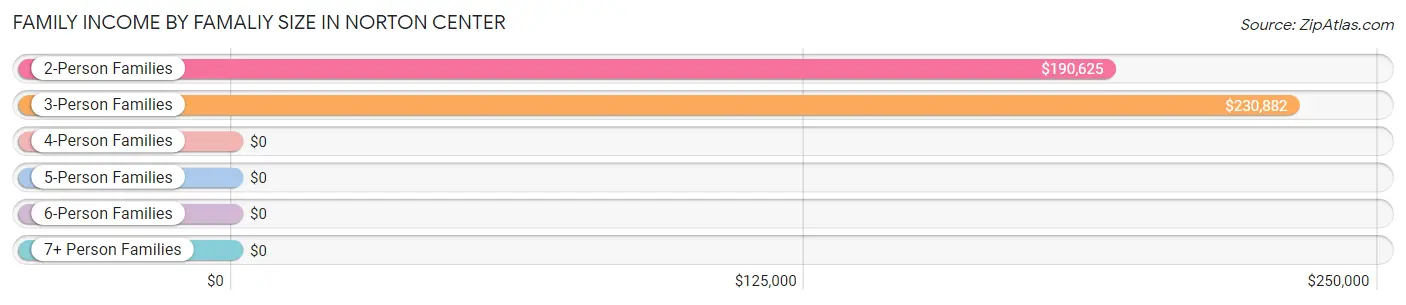
| Income Bracket | # Families | Median Income |
| 2-Person Families | 103 (41.9%) | $190,625 |
| 3-Person Families | 56 (22.8%) | $230,882 |
| 4-Person Families | 70 (28.5%) | $0 |
| 5-Person Families | 10 (4.1%) | $0 |
| 6-Person Families | 7 (2.9%) | $0 |
| 7+ Person Families | 0 (0.0%) | $0 |
| Total | 246 (100.0%) | $138,750 |
Family Income by Number of Earners in Norton Center
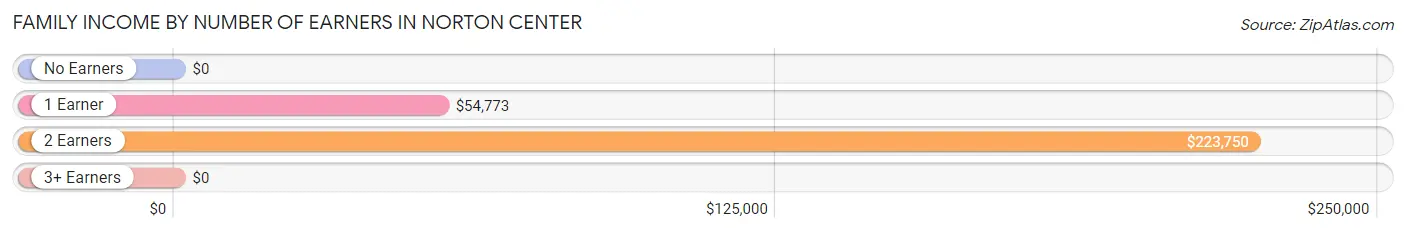
| Number of Earners | # Families | Median Income |
| No Earners | 10 (4.1%) | $0 |
| 1 Earner | 60 (24.4%) | $54,773 |
| 2 Earners | 130 (52.8%) | $223,750 |
| 3+ Earners | 46 (18.7%) | $0 |
| Total | 246 (100.0%) | $138,750 |
Household Income in Norton Center
Household Income Brackets in Norton Center
With 120 households falling in the category, the $100,000 to $149,999 income range is the most frequent in Norton Center, accounting for 31.9% of all households.
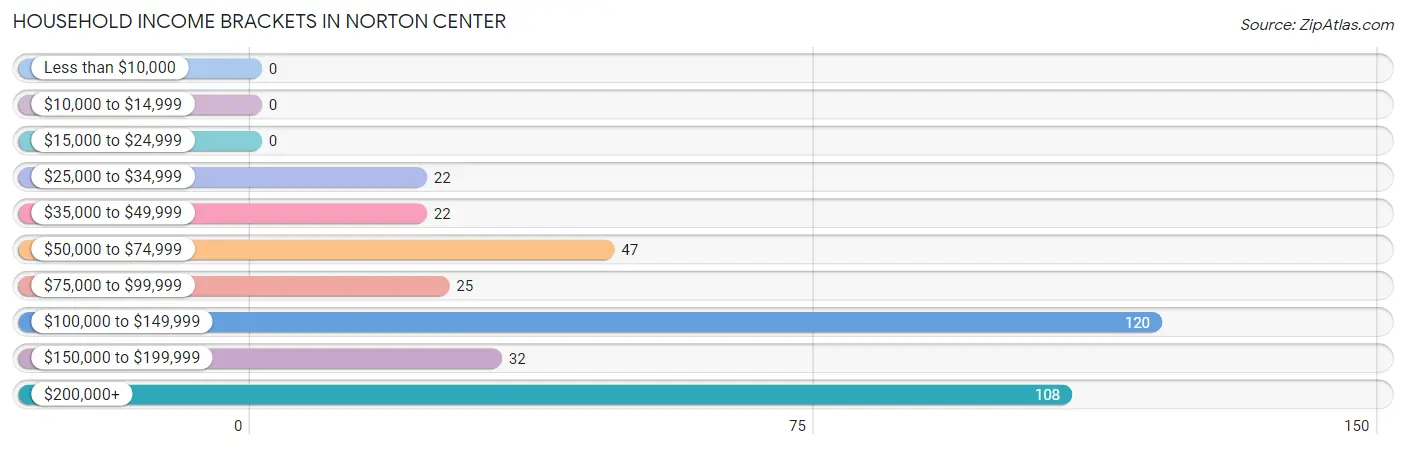
| Income Bracket | # Households | % Households |
| Less than $10,000 | 0 | 0.0% |
| $10,000 to $14,999 | 0 | 0.0% |
| $15,000 to $24,999 | 0 | 0.0% |
| $25,000 to $34,999 | 22 | 5.9% |
| $35,000 to $49,999 | 22 | 5.9% |
| $50,000 to $74,999 | 47 | 12.5% |
| $75,000 to $99,999 | 25 | 6.6% |
| $100,000 to $149,999 | 120 | 31.9% |
| $150,000 to $199,999 | 32 | 8.5% |
| $200,000+ | 108 | 28.7% |
Household Income by Householder Age in Norton Center
The median household income in Norton Center is $109,356, with the highest median household income of $217,292 found in the 45 to 64 years age bracket for the primary householder. A total of 155 households (41.2%) fall into this category. Meanwhile, the 15 to 24 years age bracket for the primary householder has the lowest median household income of $0, with 7 households (1.9%) in this group.
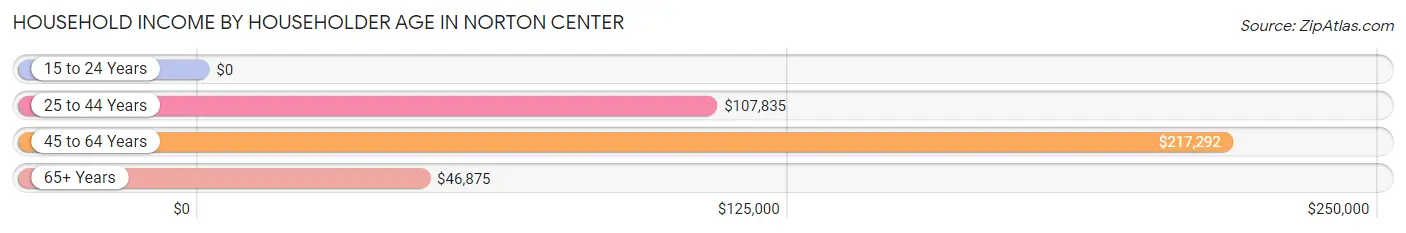
| Income Bracket | # Households | Median Income |
| 15 to 24 Years | 7 (1.9%) | $0 |
| 25 to 44 Years | 137 (36.4%) | $107,835 |
| 45 to 64 Years | 155 (41.2%) | $217,292 |
| 65+ Years | 77 (20.5%) | $46,875 |
| Total | 376 (100.0%) | $109,356 |
Poverty in Norton Center
Income Below Poverty by Sex and Age in Norton Center
With 23.2% poverty level for males and 1.3% for females among the residents of Norton Center, 35 to 44 year old males and 25 to 34 year old females are the most vulnerable to poverty, with 33 males (55.0%) and 4 females (5.0%) in their respective age groups living below the poverty level.
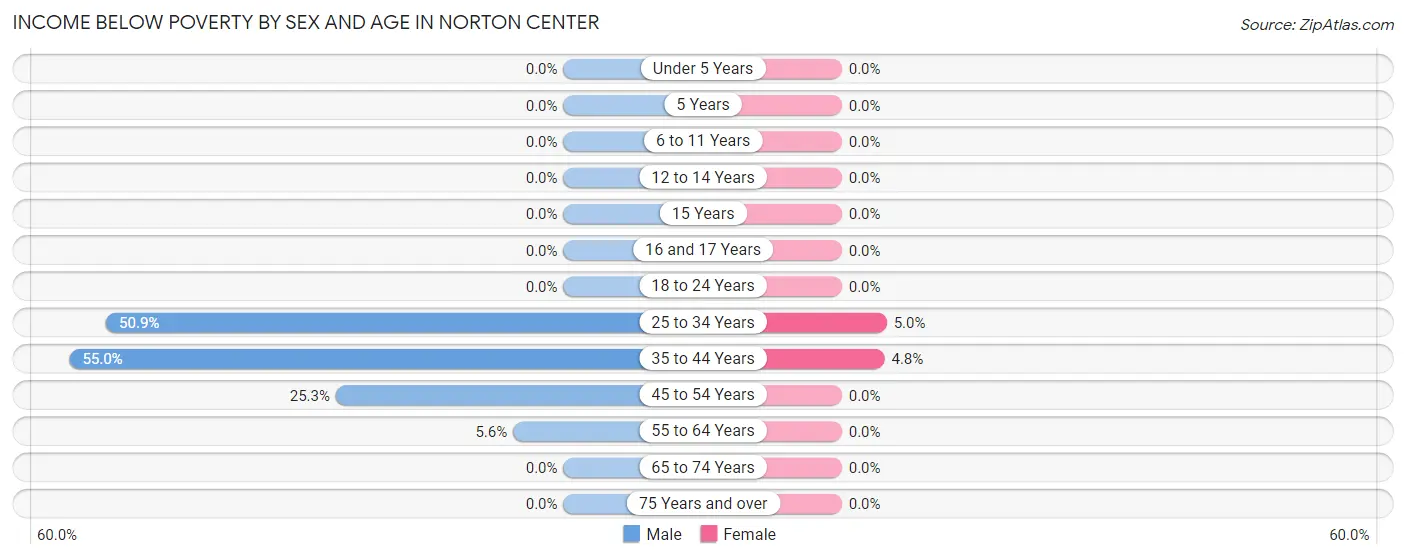
| Age Bracket | Male | Female |
| Under 5 Years | 0 (0.0%) | 0 (0.0%) |
| 5 Years | 0 (0.0%) | 0 (0.0%) |
| 6 to 11 Years | 0 (0.0%) | 0 (0.0%) |
| 12 to 14 Years | 0 (0.0%) | 0 (0.0%) |
| 15 Years | 0 (0.0%) | 0 (0.0%) |
| 16 and 17 Years | 0 (0.0%) | 0 (0.0%) |
| 18 to 24 Years | 0 (0.0%) | 0 (0.0%) |
| 25 to 34 Years | 84 (50.9%) | 4 (5.0%) |
| 35 to 44 Years | 33 (55.0%) | 3 (4.8%) |
| 45 to 54 Years | 37 (25.3%) | 0 (0.0%) |
| 55 to 64 Years | 7 (5.6%) | 0 (0.0%) |
| 65 to 74 Years | 0 (0.0%) | 0 (0.0%) |
| 75 Years and over | 0 (0.0%) | 0 (0.0%) |
| Total | 161 (23.2%) | 7 (1.3%) |
Income Above Poverty by Sex and Age in Norton Center
According to the poverty statistics in Norton Center, males aged under 5 years and females aged under 5 years are the age groups that are most secure financially, with 100.0% of males and 100.0% of females in these age groups living above the poverty line.
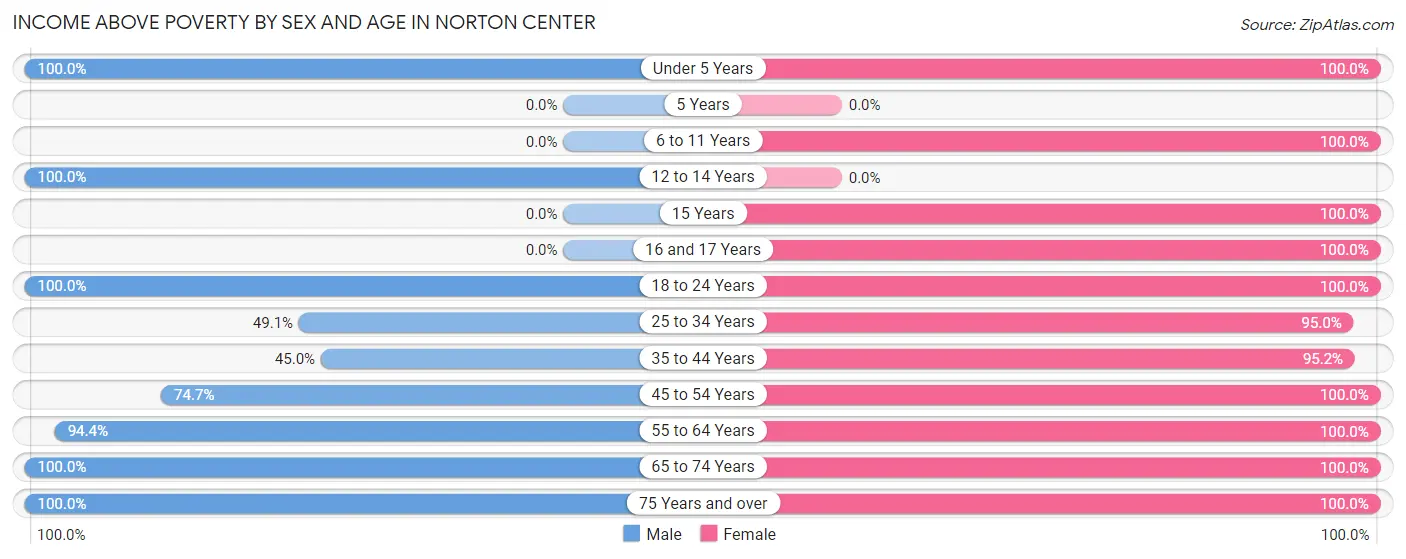
| Age Bracket | Male | Female |
| Under 5 Years | 44 (100.0%) | 49 (100.0%) |
| 5 Years | 0 (0.0%) | 0 (0.0%) |
| 6 to 11 Years | 0 (0.0%) | 6 (100.0%) |
| 12 to 14 Years | 28 (100.0%) | 0 (0.0%) |
| 15 Years | 0 (0.0%) | 9 (100.0%) |
| 16 and 17 Years | 0 (0.0%) | 32 (100.0%) |
| 18 to 24 Years | 87 (100.0%) | 72 (100.0%) |
| 25 to 34 Years | 81 (49.1%) | 76 (95.0%) |
| 35 to 44 Years | 27 (45.0%) | 60 (95.2%) |
| 45 to 54 Years | 109 (74.7%) | 58 (100.0%) |
| 55 to 64 Years | 118 (94.4%) | 81 (100.0%) |
| 65 to 74 Years | 34 (100.0%) | 17 (100.0%) |
| 75 Years and over | 4 (100.0%) | 60 (100.0%) |
| Total | 532 (76.8%) | 520 (98.7%) |
Income Below Poverty Among Married-Couple Families in Norton Center
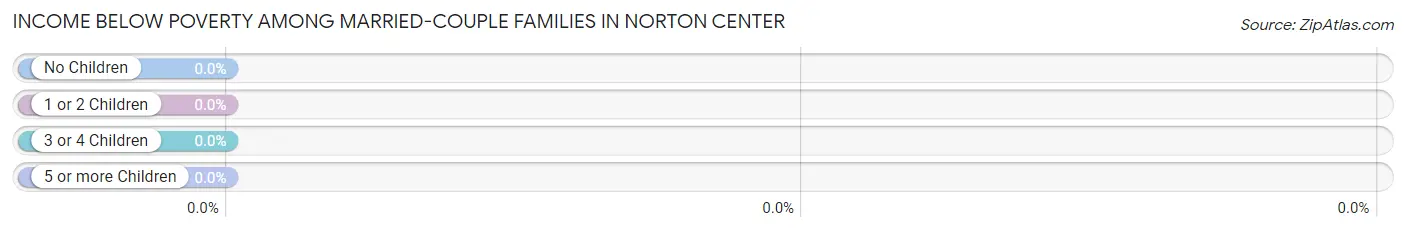
| Children | Above Poverty | Below Poverty |
| No Children | 131 (100.0%) | 0 (0.0%) |
| 1 or 2 Children | 68 (100.0%) | 0 (0.0%) |
| 3 or 4 Children | 0 (0.0%) | 0 (0.0%) |
| 5 or more Children | 0 (0.0%) | 0 (0.0%) |
| Total | 199 (100.0%) | 0 (0.0%) |
Income Below Poverty Among Single-Parent Households in Norton Center
| Children | Single Father | Single Mother |
| No Children | 0 (0.0%) | 0 (0.0%) |
| 1 or 2 Children | 0 (0.0%) | 0 (0.0%) |
| 3 or 4 Children | 0 (0.0%) | 0 (0.0%) |
| 5 or more Children | 0 (0.0%) | 0 (0.0%) |
| Total | 0 (0.0%) | 0 (0.0%) |
Income Below Poverty Among Married-Couple vs Single-Parent Households in Norton Center
| Children | Married-Couple Families | Single-Parent Households |
| No Children | 0 (0.0%) | 0 (0.0%) |
| 1 or 2 Children | 0 (0.0%) | 0 (0.0%) |
| 3 or 4 Children | 0 (0.0%) | 0 (0.0%) |
| 5 or more Children | 0 (0.0%) | 0 (0.0%) |
| Total | 0 (0.0%) | 0 (0.0%) |
Race in Norton Center
The most populous races in Norton Center are White / Caucasian (1,846 | 71.6%), Black / African American (448 | 17.4%), and Hispanic or Latino (257 | 10.0%).
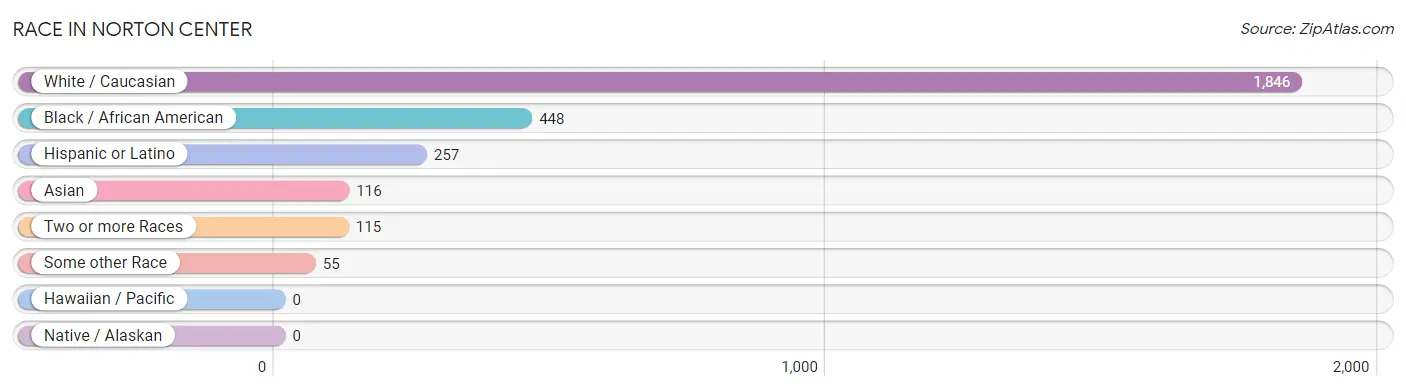
| Race | # Population | % Population |
| Asian | 116 | 4.5% |
| Black / African American | 448 | 17.4% |
| Hawaiian / Pacific | 0 | 0.0% |
| Hispanic or Latino | 257 | 10.0% |
| Native / Alaskan | 0 | 0.0% |
| White / Caucasian | 1,846 | 71.6% |
| Two or more Races | 115 | 4.5% |
| Some other Race | 55 | 2.1% |
| Total | 2,580 | 100.0% |
Ancestry in Norton Center
The most populous ancestries reported in Norton Center are Irish (486 | 18.8%), Italian (237 | 9.2%), Puerto Rican (159 | 6.2%), Portuguese (128 | 5.0%), and English (117 | 4.5%), together accounting for 43.7% of all Norton Center residents.
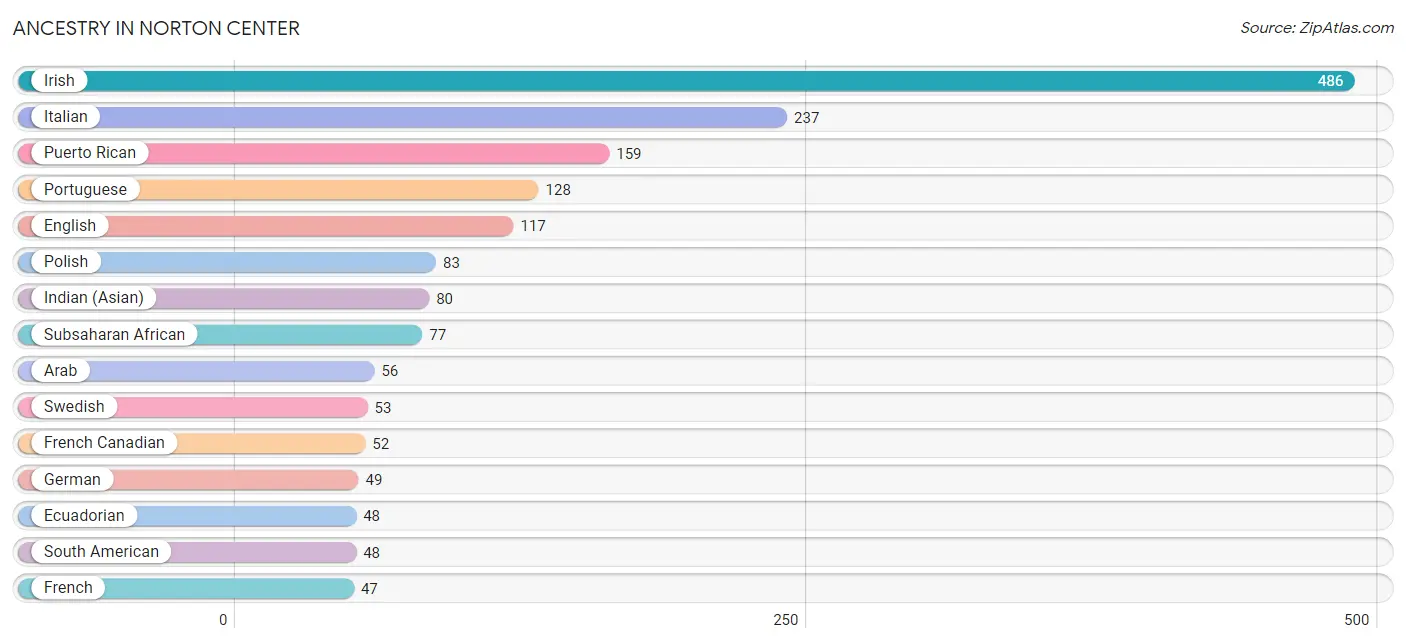
| Ancestry | # Population | % Population |
| African | 39 | 1.5% |
| American | 20 | 0.8% |
| Arab | 56 | 2.2% |
| Armenian | 7 | 0.3% |
| Burmese | 6 | 0.2% |
| Cape Verdean | 23 | 0.9% |
| Croatian | 6 | 0.2% |
| Czechoslovakian | 7 | 0.3% |
| Dominican | 21 | 0.8% |
| Dutch | 5 | 0.2% |
| Eastern European | 24 | 0.9% |
| Ecuadorian | 48 | 1.9% |
| English | 117 | 4.5% |
| European | 32 | 1.2% |
| French | 47 | 1.8% |
| French Canadian | 52 | 2.0% |
| German | 49 | 1.9% |
| Greek | 23 | 0.9% |
| Haitian | 8 | 0.3% |
| Indian (Asian) | 80 | 3.1% |
| Irish | 486 | 18.8% |
| Italian | 237 | 9.2% |
| Jamaican | 2 | 0.1% |
| Korean | 27 | 1.1% |
| Latvian | 7 | 0.3% |
| Lebanese | 24 | 0.9% |
| Mexican | 8 | 0.3% |
| Mexican American Indian | 4 | 0.2% |
| Nigerian | 8 | 0.3% |
| Polish | 83 | 3.2% |
| Portuguese | 128 | 5.0% |
| Puerto Rican | 159 | 6.2% |
| Scottish | 36 | 1.4% |
| Serbian | 6 | 0.2% |
| South American | 48 | 1.9% |
| Sri Lankan | 21 | 0.8% |
| Subsaharan African | 77 | 3.0% |
| Swedish | 53 | 2.1% |
| Thai | 18 | 0.7% | View All 39 Rows |
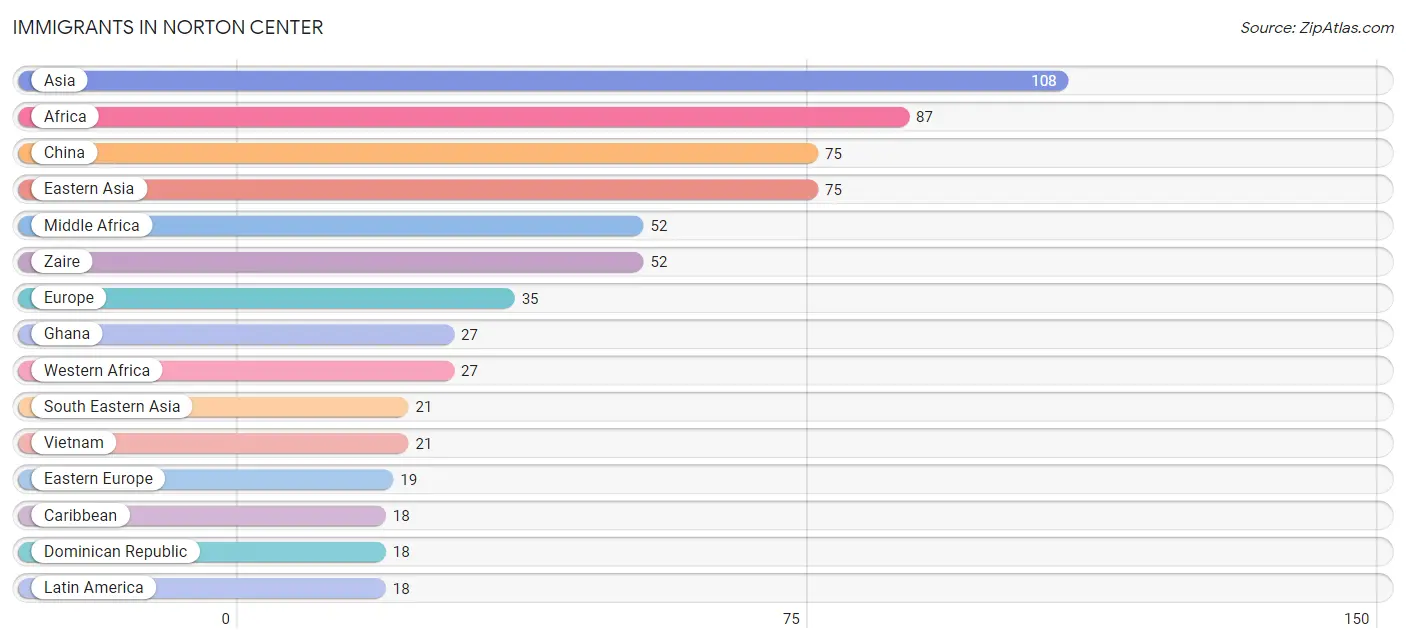
Immigrants in Norton Center
The most numerous immigrant groups reported in Norton Center came from Asia (108 | 4.2%), Africa (87 | 3.4%), China (75 | 2.9%), Eastern Asia (75 | 2.9%), and Middle Africa (52 | 2.0%), together accounting for 15.4% of all Norton Center residents.
| Immigration Origin | # Population | % Population |
| Africa | 87 | 3.4% |
| Asia | 108 | 4.2% |
| Canada | 6 | 0.2% |
| Caribbean | 18 | 0.7% |
| China | 75 | 2.9% |
| Dominican Republic | 18 | 0.7% |
| Eastern Africa | 8 | 0.3% |
| Eastern Asia | 75 | 2.9% |
| Eastern Europe | 19 | 0.7% |
| Europe | 35 | 1.4% |
| Ghana | 27 | 1.1% |
| India | 5 | 0.2% |
| Kenya | 8 | 0.3% |
| Latin America | 18 | 0.7% |
| Middle Africa | 52 | 2.0% |
| Netherlands | 5 | 0.2% |
| Poland | 7 | 0.3% |
| Portugal | 11 | 0.4% |
| South Central Asia | 5 | 0.2% |
| South Eastern Asia | 21 | 0.8% |
| Southern Europe | 11 | 0.4% |
| Vietnam | 21 | 0.8% |
| Western Africa | 27 | 1.1% |
| Western Asia | 2 | 0.1% |
| Western Europe | 5 | 0.2% |
| Zaire | 52 | 2.0% | View All 26 Rows |
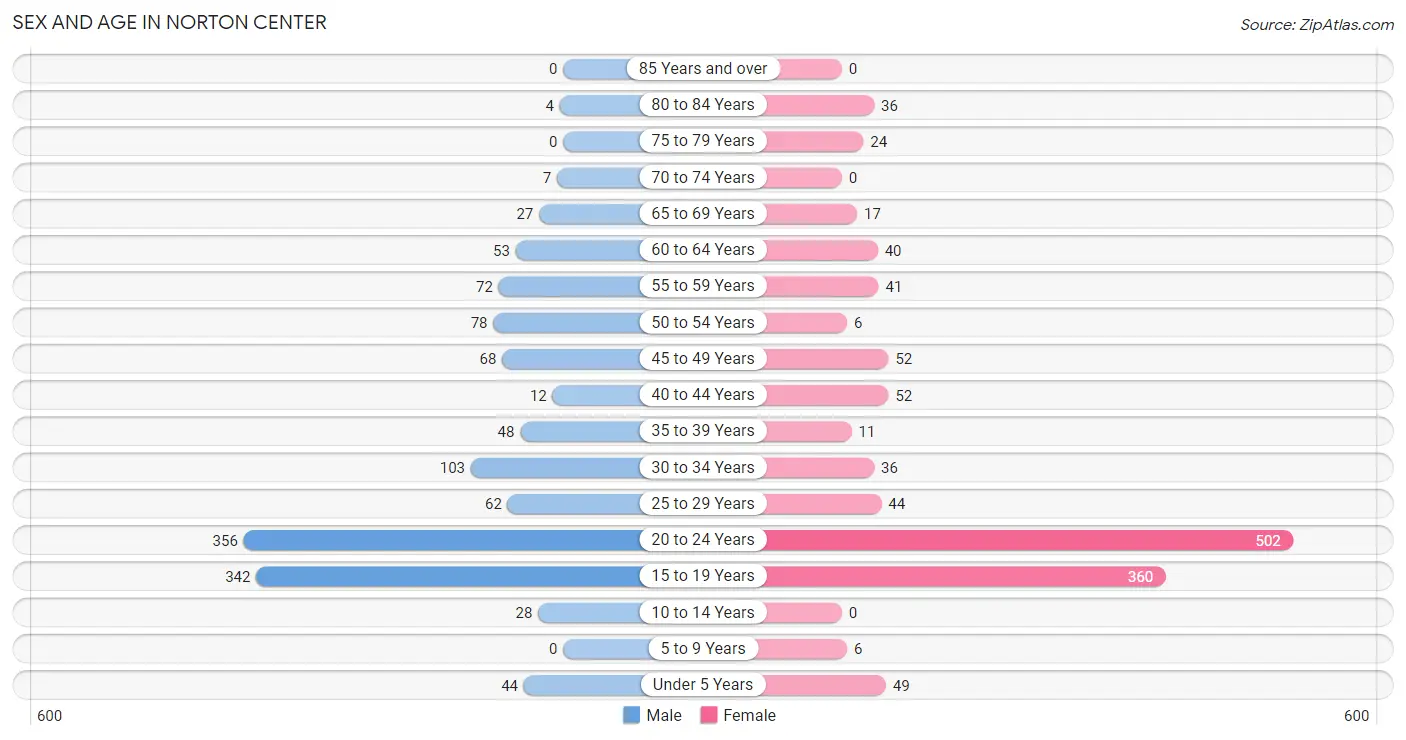
Sex and Age in Norton Center
Sex and Age in Norton Center
The most populous age groups in Norton Center are 20 to 24 Years (356 | 27.3%) for men and 20 to 24 Years (502 | 39.3%) for women.
| Age Bracket | Male | Female |
| Under 5 Years | 44 (3.4%) | 49 (3.8%) |
| 5 to 9 Years | 0 (0.0%) | 6 (0.5%) |
| 10 to 14 Years | 28 (2.1%) | 0 (0.0%) |
| 15 to 19 Years | 342 (26.2%) | 360 (28.2%) |
| 20 to 24 Years | 356 (27.3%) | 502 (39.3%) |
| 25 to 29 Years | 62 (4.8%) | 44 (3.5%) |
| 30 to 34 Years | 103 (7.9%) | 36 (2.8%) |
| 35 to 39 Years | 48 (3.7%) | 11 (0.9%) |
| 40 to 44 Years | 12 (0.9%) | 52 (4.1%) |
| 45 to 49 Years | 68 (5.2%) | 52 (4.1%) |
| 50 to 54 Years | 78 (6.0%) | 6 (0.5%) |
| 55 to 59 Years | 72 (5.5%) | 41 (3.2%) |
| 60 to 64 Years | 53 (4.1%) | 40 (3.1%) |
| 65 to 69 Years | 27 (2.1%) | 17 (1.3%) |
| 70 to 74 Years | 7 (0.5%) | 0 (0.0%) |
| 75 to 79 Years | 0 (0.0%) | 24 (1.9%) |
| 80 to 84 Years | 4 (0.3%) | 36 (2.8%) |
| 85 Years and over | 0 (0.0%) | 0 (0.0%) |
| Total | 1,304 (100.0%) | 1,276 (100.0%) |
Families and Households in Norton Center
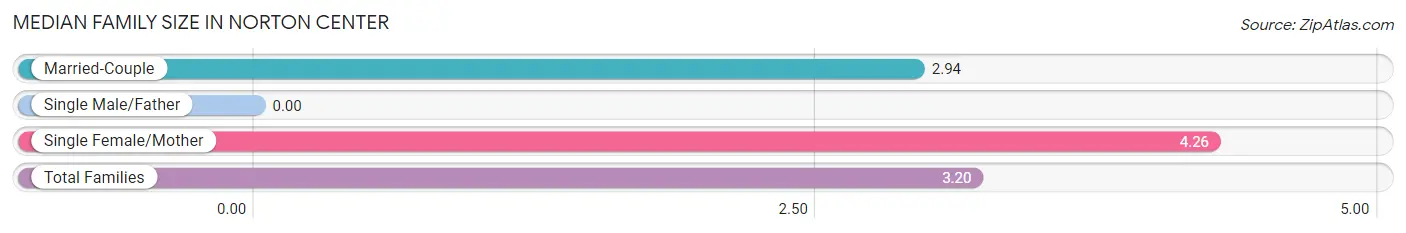
Median Family Size in Norton Center
| Family Type | # Families | Family Size |
| Married-Couple | 199 (80.9%) | 2.94 |
| Single Male/Father | 0 (0.0%) | - |
| Single Female/Mother | 47 (19.1%) | 4.26 |
| Total Families | 246 (100.0%) | 3.20 |
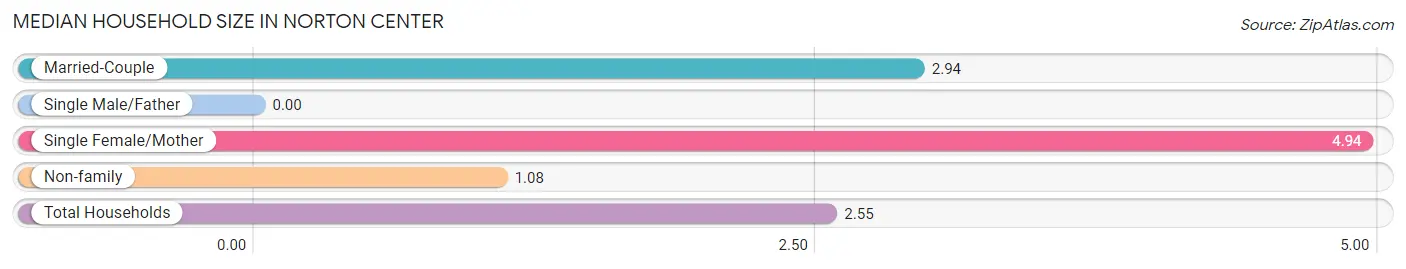
Median Household Size in Norton Center
| Household Type | # Households | Household Size |
| Married-Couple | 199 (52.9%) | 2.94 |
| Single Male/Father | 0 (0.0%) | - |
| Single Female/Mother | 47 (12.5%) | 4.94 |
| Non-family | 130 (34.6%) | 1.08 |
| Total Households | 376 (100.0%) | 2.55 |
Household Size by Marriage Status in Norton Center
Out of a total of 376 households in Norton Center, 246 (65.4%) are family households, while 130 (34.6%) are nonfamily households. The most numerous type of family households are 2-person households, comprising 103, and the most common type of nonfamily households are 1-person households, comprising 120.
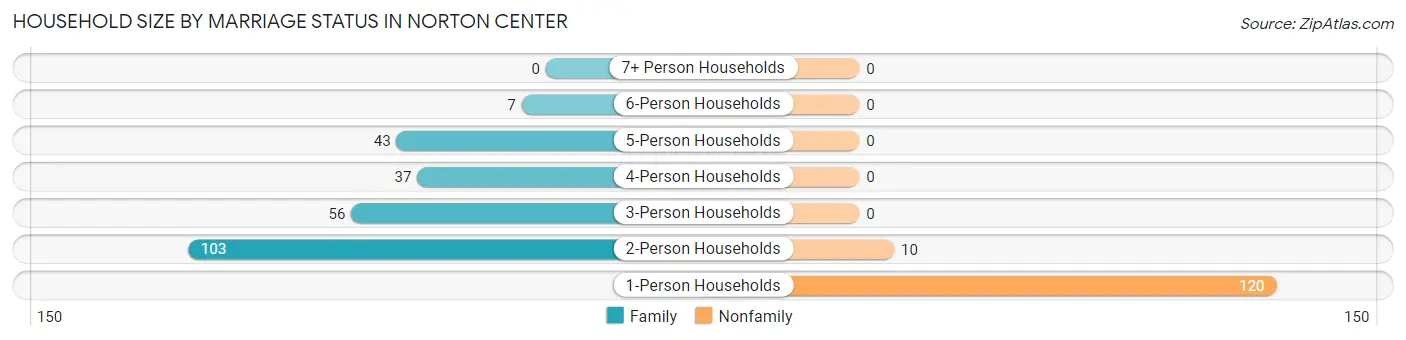
| Household Size | Family Households | Nonfamily Households |
| 1-Person Households | - | 120 (31.9%) |
| 2-Person Households | 103 (27.4%) | 10 (2.7%) |
| 3-Person Households | 56 (14.9%) | 0 (0.0%) |
| 4-Person Households | 37 (9.8%) | 0 (0.0%) |
| 5-Person Households | 43 (11.4%) | 0 (0.0%) |
| 6-Person Households | 7 (1.9%) | 0 (0.0%) |
| 7+ Person Households | 0 (0.0%) | 0 (0.0%) |
| Total | 246 (65.4%) | 130 (34.6%) |
Female Fertility in Norton Center
Fertility by Age in Norton Center
Average fertility rate in Norton Center is 30.0 births per 1,000 women. Women in the age bracket of 20 to 34 years have the highest fertility rate with 55.0 births per 1,000 women. Women in the age bracket of 20 to 34 years acount for 100.0% of all women with births.
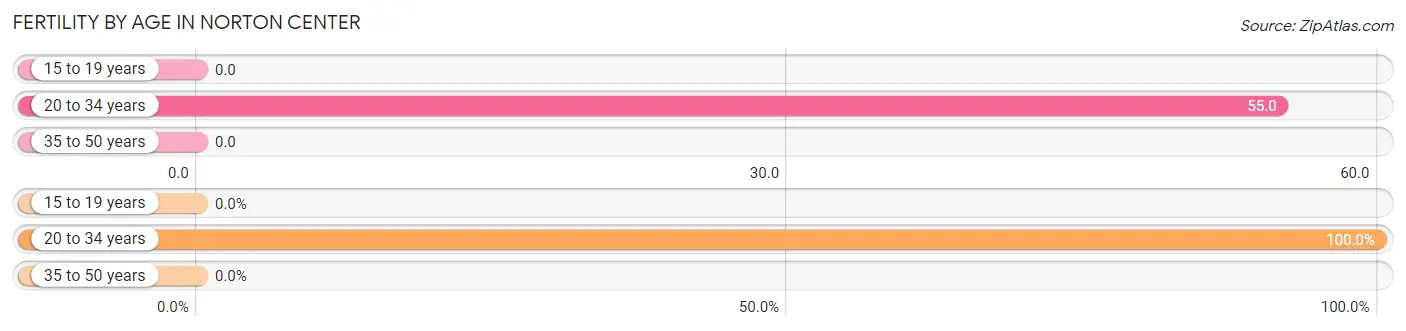
| Age Bracket | Women with Births | Births / 1,000 Women |
| 15 to 19 years | 0 (0.0%) | 0.0 |
| 20 to 34 years | 32 (100.0%) | 55.0 |
| 35 to 50 years | 0 (0.0%) | 0.0 |
| Total | 32 (100.0%) | 30.0 |
Fertility by Age by Marriage Status in Norton Center
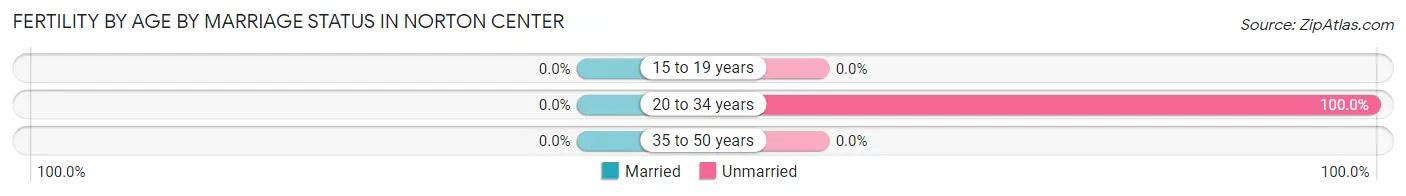
| Age Bracket | Married | Unmarried |
| 15 to 19 years | 0 (0.0%) | 0 (0.0%) |
| 20 to 34 years | 0 (0.0%) | 32 (100.0%) |
| 35 to 50 years | 0 (0.0%) | 0 (0.0%) |
| Total | 0 (0.0%) | 32 (100.0%) |
Fertility by Education in Norton Center
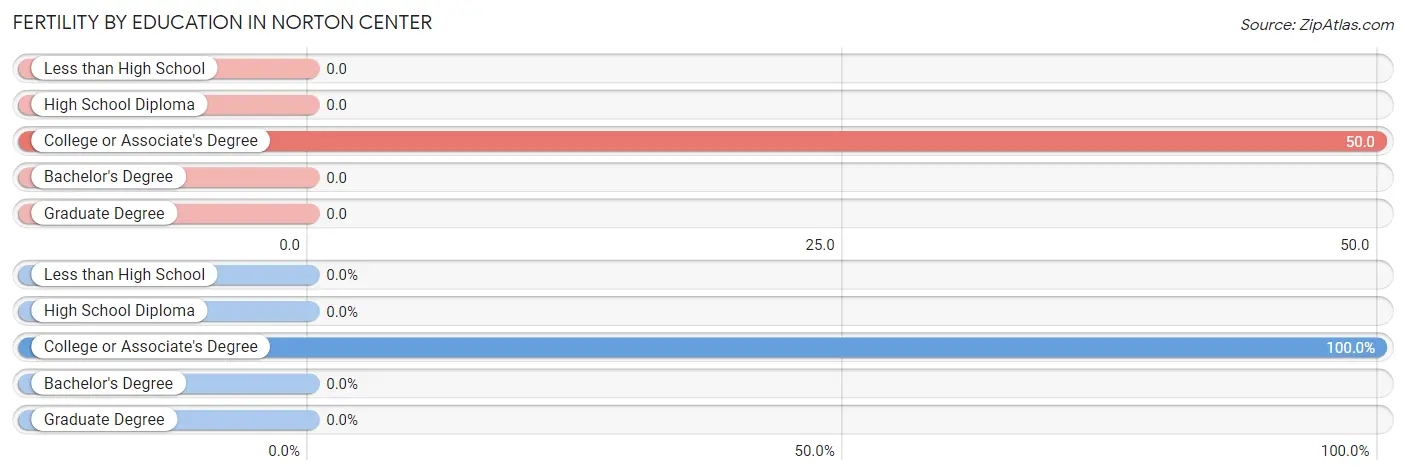
| Educational Attainment | Women with Births | Births / 1,000 Women |
| Less than High School | 0 (0.0%) | 0.0 |
| High School Diploma | 0 (0.0%) | 0.0 |
| College or Associate's Degree | 32 (100.0%) | 50.0 |
| Bachelor's Degree | 0 (0.0%) | 0.0 |
| Graduate Degree | 0 (0.0%) | 0.0 |
| Total | 32 (100.0%) | 30.0 |
Fertility by Education by Marriage Status in Norton Center
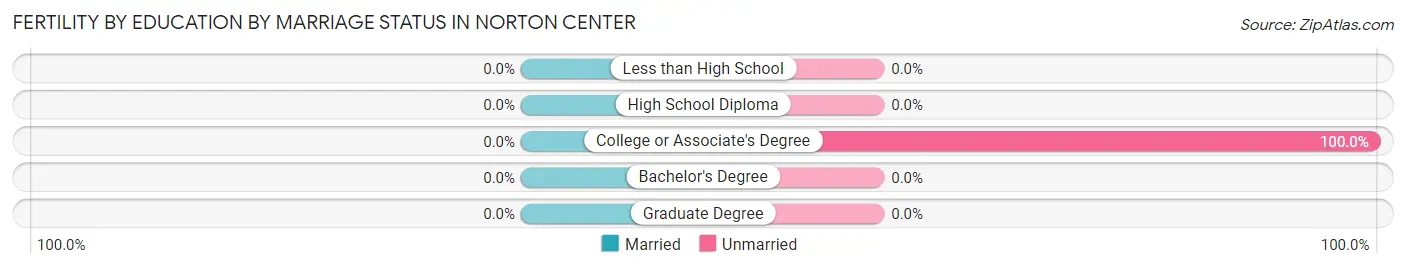
| Educational Attainment | Married | Unmarried |
| Less than High School | 0 (0.0%) | 0 (0.0%) |
| High School Diploma | 0 (0.0%) | 0 (0.0%) |
| College or Associate's Degree | 0 (0.0%) | 32 (100.0%) |
| Bachelor's Degree | 0 (0.0%) | 0 (0.0%) |
| Graduate Degree | 0 (0.0%) | 0 (0.0%) |
| Total | 0 (0.0%) | 32 (100.0%) |
Employment Characteristics in Norton Center
Employment by Class of Employer in Norton Center
Among the 1,177 employed individuals in Norton Center, private company employees (648 | 55.1%), state government employees (238 | 20.2%), and not-for-profit organizations (126 | 10.7%) make up the most common classes of employment.
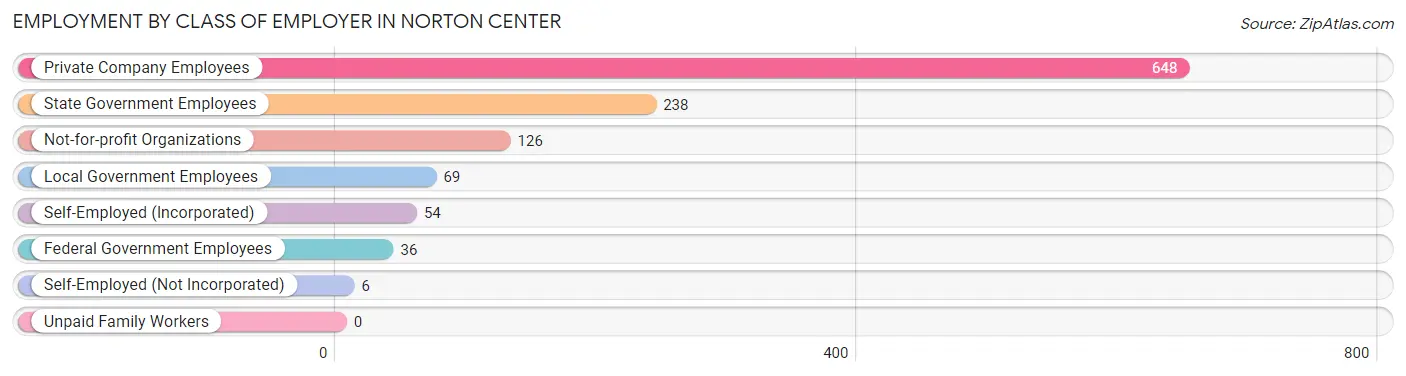
| Employer Class | # Employees | % Employees |
| Private Company Employees | 648 | 55.1% |
| Self-Employed (Incorporated) | 54 | 4.6% |
| Self-Employed (Not Incorporated) | 6 | 0.5% |
| Not-for-profit Organizations | 126 | 10.7% |
| Local Government Employees | 69 | 5.9% |
| State Government Employees | 238 | 20.2% |
| Federal Government Employees | 36 | 3.1% |
| Unpaid Family Workers | 0 | 0.0% |
| Total | 1,177 | 100.0% |
Employment Status by Age in Norton Center
According to the labor force statistics for Norton Center, out of the total population over 16 years of age (2,444), 54.1% or 1,322 individuals are in the labor force, with 4.1% or 54 of them unemployed. The age group with the highest labor force participation rate is 60 to 64 years, with 91.4% or 85 individuals in the labor force. Within the labor force, the 25 to 29 years age range has the highest percentage of unemployed individuals, with 25.3% or 22 of them being unemployed.
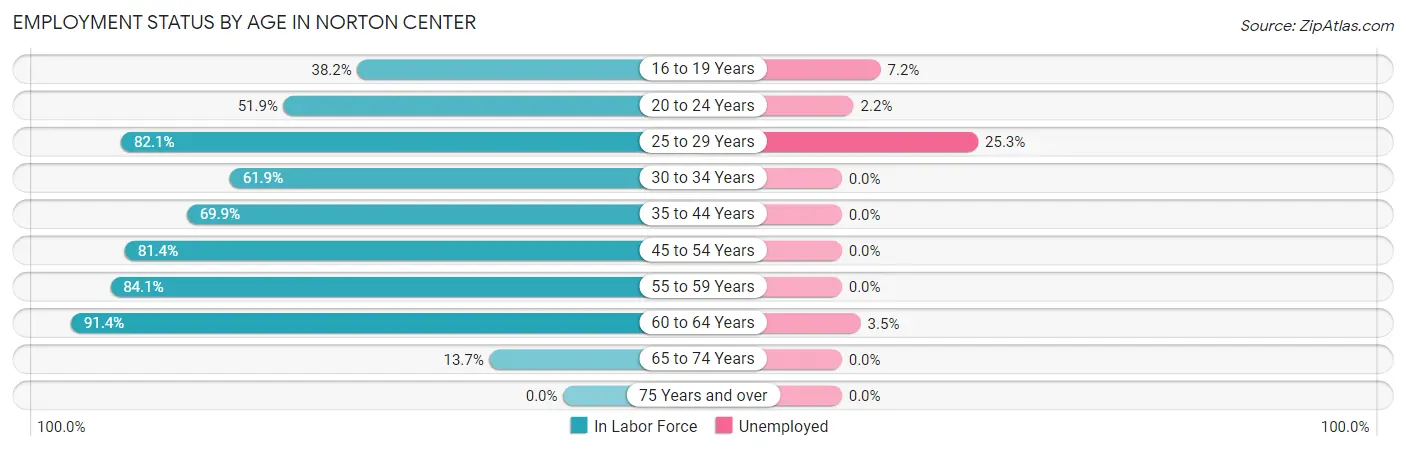
| Age Bracket | In Labor Force | Unemployed |
| 16 to 19 Years | 265 (38.2%) | 19 (7.2%) |
| 20 to 24 Years | 445 (51.9%) | 10 (2.2%) |
| 25 to 29 Years | 87 (82.1%) | 22 (25.3%) |
| 30 to 34 Years | 86 (61.9%) | 0 (0.0%) |
| 35 to 44 Years | 86 (69.9%) | 0 (0.0%) |
| 45 to 54 Years | 166 (81.4%) | 0 (0.0%) |
| 55 to 59 Years | 95 (84.1%) | 0 (0.0%) |
| 60 to 64 Years | 85 (91.4%) | 3 (3.5%) |
| 65 to 74 Years | 7 (13.7%) | 0 (0.0%) |
| 75 Years and over | 0 (0.0%) | 0 (0.0%) |
| Total | 1,322 (54.1%) | 54 (4.1%) |
Employment Status by Educational Attainment in Norton Center
According to labor force statistics for Norton Center, 77.8% of individuals (605) out of the total population between 25 and 64 years of age (778) are in the labor force, with 4.2% or 25 of them being unemployed. The group with the highest labor force participation rate are those with the educational attainment of bachelor's degree or higher, with 97.0% or 354 individuals in the labor force. Within the labor force, individuals with less than high school education have the highest percentage of unemployment, with 11.5% or 3 of them being unemployed.
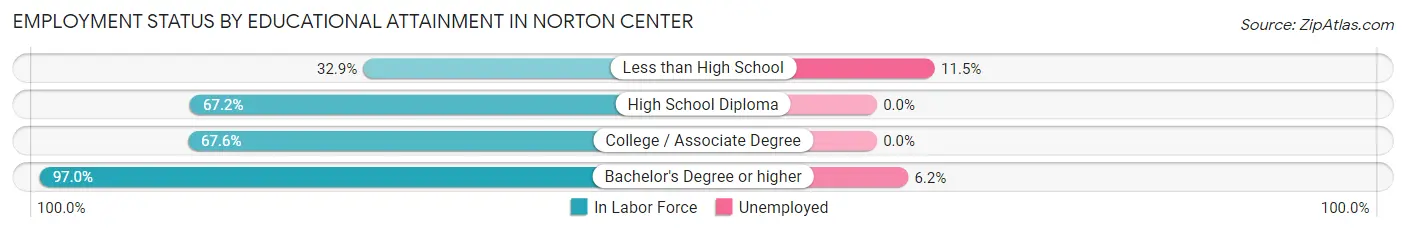
| Educational Attainment | In Labor Force | Unemployed |
| Less than High School | 26 (32.9%) | 9 (11.5%) |
| High School Diploma | 127 (67.2%) | 0 (0.0%) |
| College / Associate Degree | 98 (67.6%) | 0 (0.0%) |
| Bachelor's Degree or higher | 354 (97.0%) | 23 (6.2%) |
| Total | 605 (77.8%) | 33 (4.2%) |
Employment Occupations by Sex in Norton Center
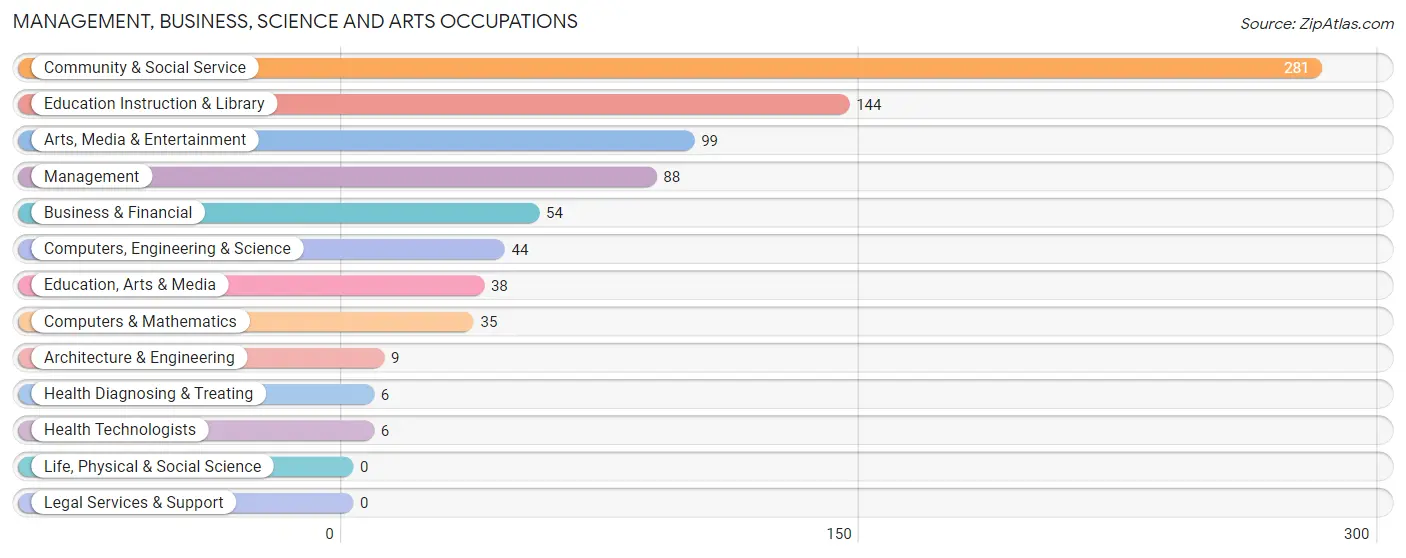
Management, Business, Science and Arts Occupations
The most common Management, Business, Science and Arts occupations in Norton Center are Community & Social Service (281 | 22.3%), Education Instruction & Library (144 | 11.4%), Arts, Media & Entertainment (99 | 7.9%), Management (88 | 7.0%), and Business & Financial (54 | 4.3%).
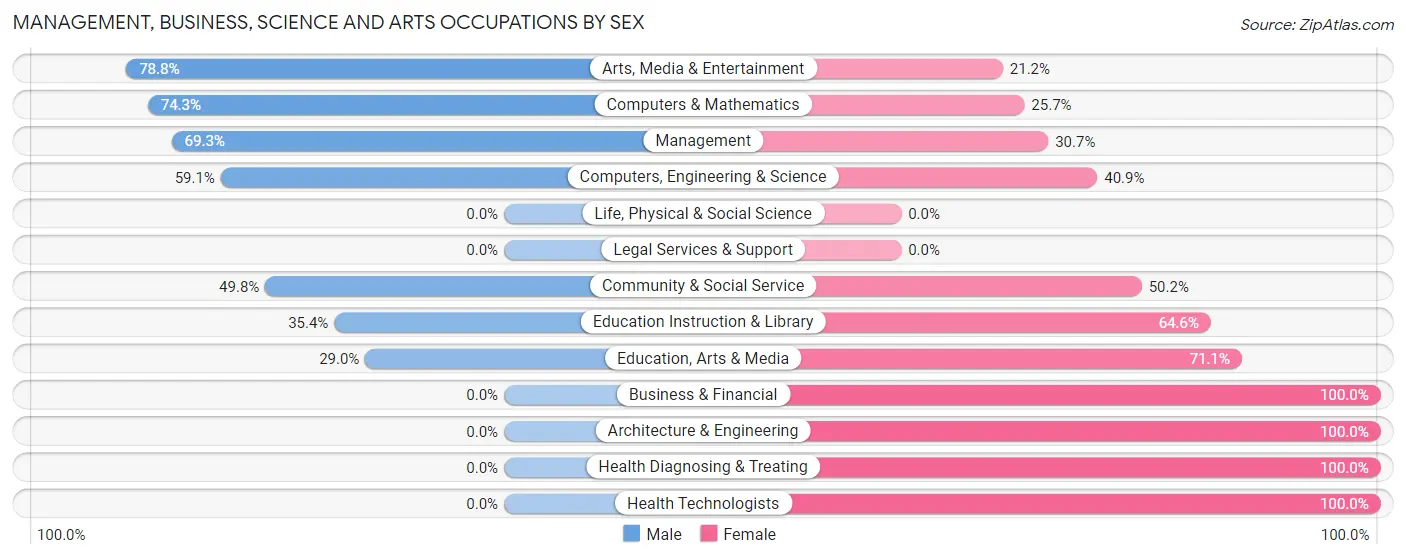
Management, Business, Science and Arts Occupations by Sex
Within the Management, Business, Science and Arts occupations in Norton Center, the most male-oriented occupations are Arts, Media & Entertainment (78.8%), Computers & Mathematics (74.3%), and Management (69.3%), while the most female-oriented occupations are Business & Financial (100.0%), Architecture & Engineering (100.0%), and Health Diagnosing & Treating (100.0%).
| Occupation | Male | Female |
| Management | 61 (69.3%) | 27 (30.7%) |
| Business & Financial | 0 (0.0%) | 54 (100.0%) |
| Computers, Engineering & Science | 26 (59.1%) | 18 (40.9%) |
| Computers & Mathematics | 26 (74.3%) | 9 (25.7%) |
| Architecture & Engineering | 0 (0.0%) | 9 (100.0%) |
| Life, Physical & Social Science | 0 (0.0%) | 0 (0.0%) |
| Community & Social Service | 140 (49.8%) | 141 (50.2%) |
| Education, Arts & Media | 11 (28.9%) | 27 (71.1%) |
| Legal Services & Support | 0 (0.0%) | 0 (0.0%) |
| Education Instruction & Library | 51 (35.4%) | 93 (64.6%) |
| Arts, Media & Entertainment | 78 (78.8%) | 21 (21.2%) |
| Health Diagnosing & Treating | 0 (0.0%) | 6 (100.0%) |
| Health Technologists | 0 (0.0%) | 6 (100.0%) |
| Total (Category) | 227 (48.0%) | 246 (52.0%) |
| Total (Overall) | 498 (39.6%) | 761 (60.4%) |
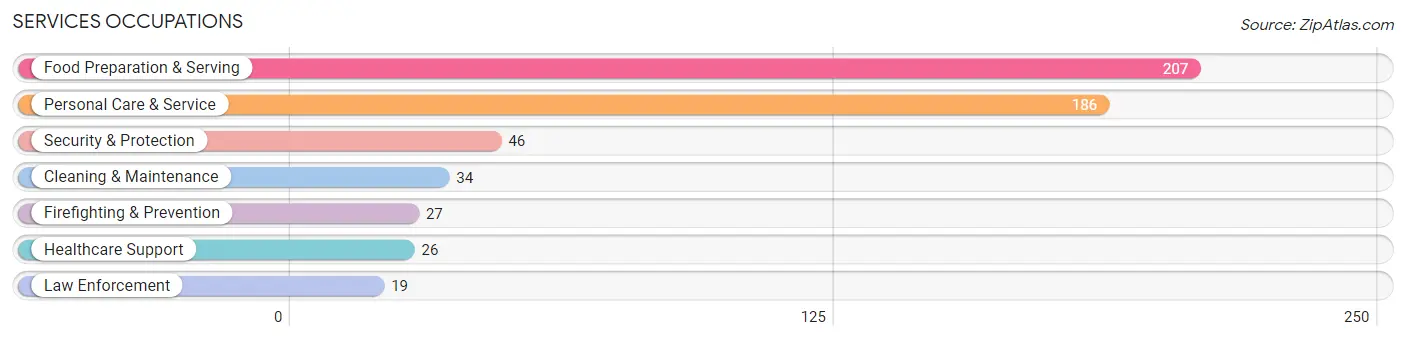
Services Occupations
The most common Services occupations in Norton Center are Food Preparation & Serving (207 | 16.4%), Personal Care & Service (186 | 14.8%), Security & Protection (46 | 3.6%), Cleaning & Maintenance (34 | 2.7%), and Firefighting & Prevention (27 | 2.1%).
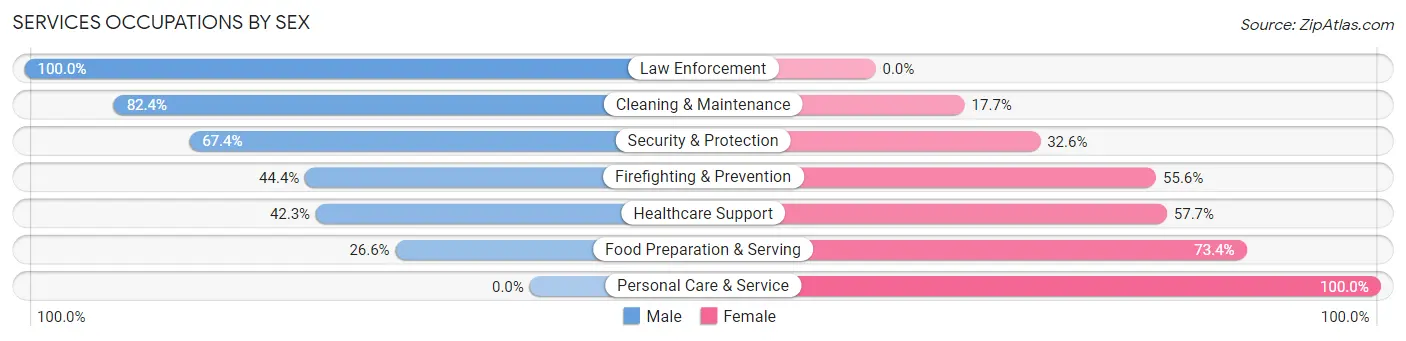
Services Occupations by Sex
Within the Services occupations in Norton Center, the most male-oriented occupations are Law Enforcement (100.0%), Cleaning & Maintenance (82.4%), and Security & Protection (67.4%), while the most female-oriented occupations are Personal Care & Service (100.0%), Food Preparation & Serving (73.4%), and Healthcare Support (57.7%).
| Occupation | Male | Female |
| Healthcare Support | 11 (42.3%) | 15 (57.7%) |
| Security & Protection | 31 (67.4%) | 15 (32.6%) |
| Firefighting & Prevention | 12 (44.4%) | 15 (55.6%) |
| Law Enforcement | 19 (100.0%) | 0 (0.0%) |
| Food Preparation & Serving | 55 (26.6%) | 152 (73.4%) |
| Cleaning & Maintenance | 28 (82.4%) | 6 (17.6%) |
| Personal Care & Service | 0 (0.0%) | 186 (100.0%) |
| Total (Category) | 125 (25.1%) | 374 (75.0%) |
| Total (Overall) | 498 (39.6%) | 761 (60.4%) |
Sales and Office Occupations
The most common Sales and Office occupations in Norton Center are Office & Administration (123 | 9.8%), and Sales & Related (66 | 5.2%).
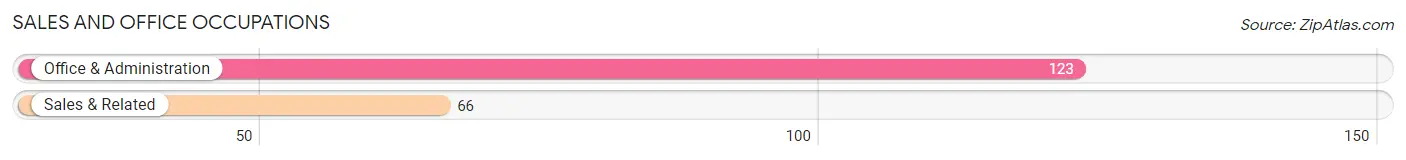
Sales and Office Occupations by Sex
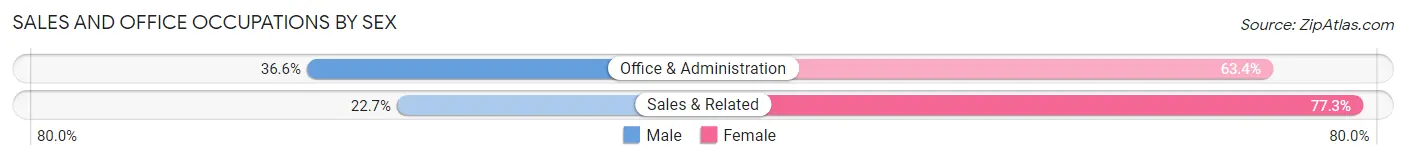
| Occupation | Male | Female |
| Sales & Related | 15 (22.7%) | 51 (77.3%) |
| Office & Administration | 45 (36.6%) | 78 (63.4%) |
| Total (Category) | 60 (31.8%) | 129 (68.2%) |
| Total (Overall) | 498 (39.6%) | 761 (60.4%) |
Natural Resources, Construction and Maintenance Occupations
The most common Natural Resources, Construction and Maintenance occupations in Norton Center are Construction & Extraction (24 | 1.9%), and Installation, Maintenance & Repair (7 | 0.6%).
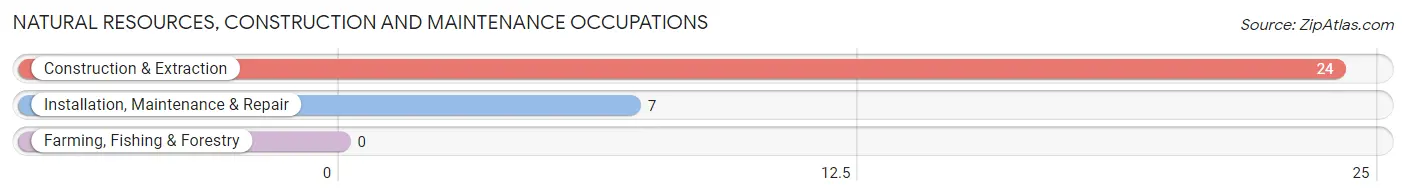
Natural Resources, Construction and Maintenance Occupations by Sex
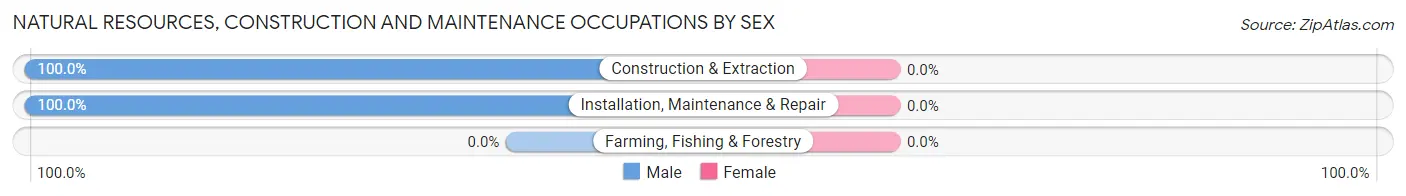
| Occupation | Male | Female |
| Farming, Fishing & Forestry | 0 (0.0%) | 0 (0.0%) |
| Construction & Extraction | 24 (100.0%) | 0 (0.0%) |
| Installation, Maintenance & Repair | 7 (100.0%) | 0 (0.0%) |
| Total (Category) | 31 (100.0%) | 0 (0.0%) |
| Total (Overall) | 498 (39.6%) | 761 (60.4%) |
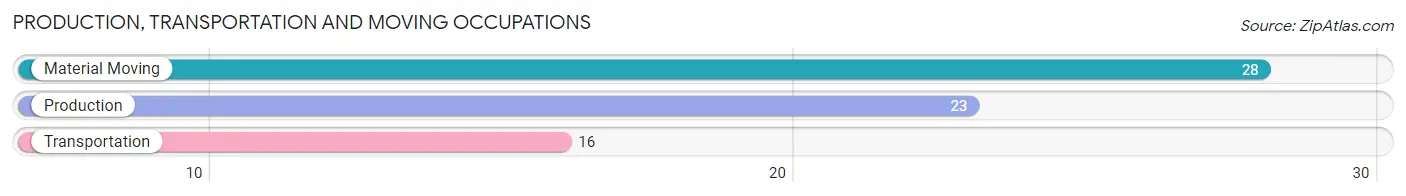
Production, Transportation and Moving Occupations
The most common Production, Transportation and Moving occupations in Norton Center are Material Moving (28 | 2.2%), Production (23 | 1.8%), and Transportation (16 | 1.3%).
Production, Transportation and Moving Occupations by Sex
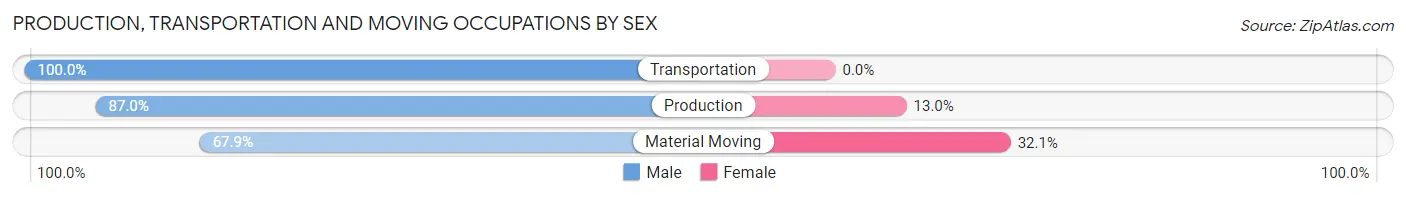
| Occupation | Male | Female |
| Production | 20 (87.0%) | 3 (13.0%) |
| Transportation | 16 (100.0%) | 0 (0.0%) |
| Material Moving | 19 (67.9%) | 9 (32.1%) |
| Total (Category) | 55 (82.1%) | 12 (17.9%) |
| Total (Overall) | 498 (39.6%) | 761 (60.4%) |
Employment Industries by Sex in Norton Center
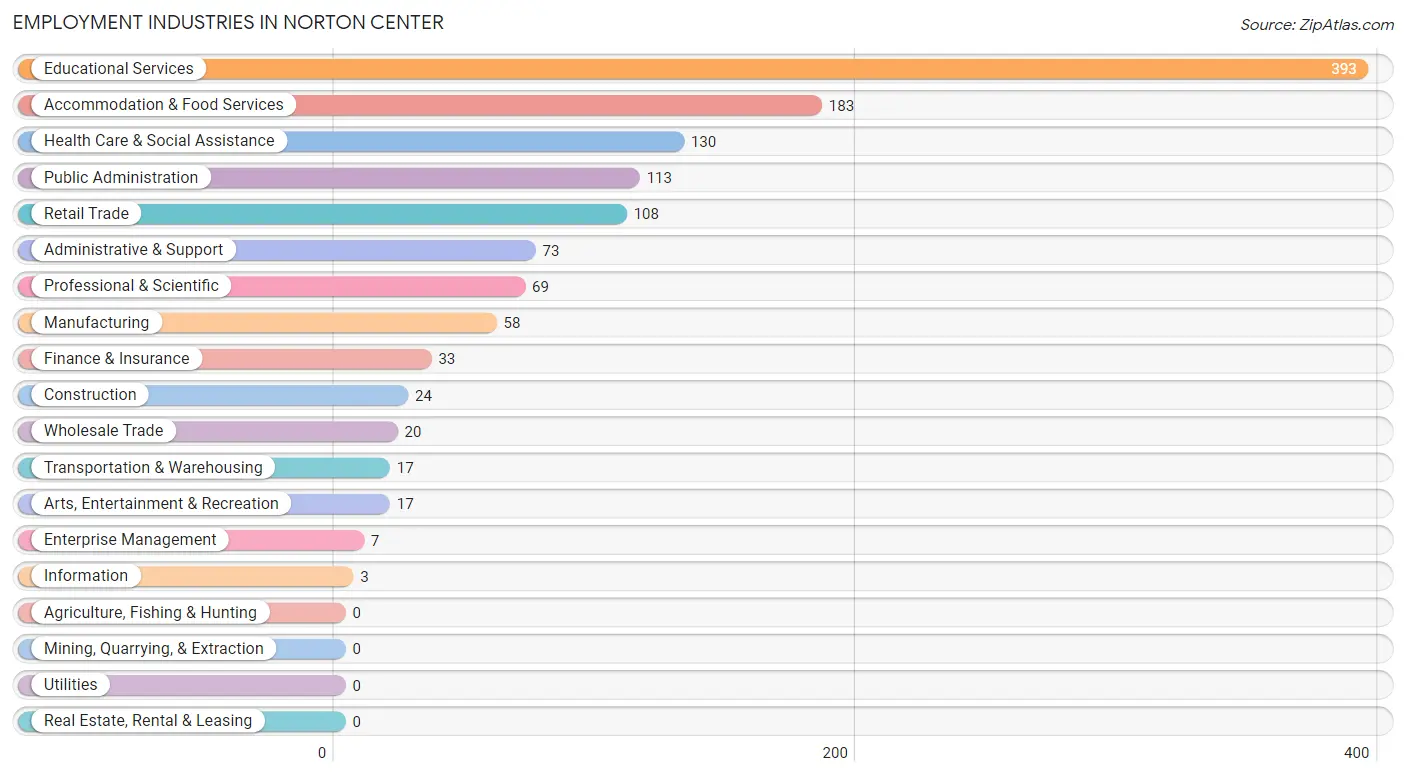
Employment Industries in Norton Center
The major employment industries in Norton Center include Educational Services (393 | 31.2%), Accommodation & Food Services (183 | 14.5%), Health Care & Social Assistance (130 | 10.3%), Public Administration (113 | 9.0%), and Retail Trade (108 | 8.6%).
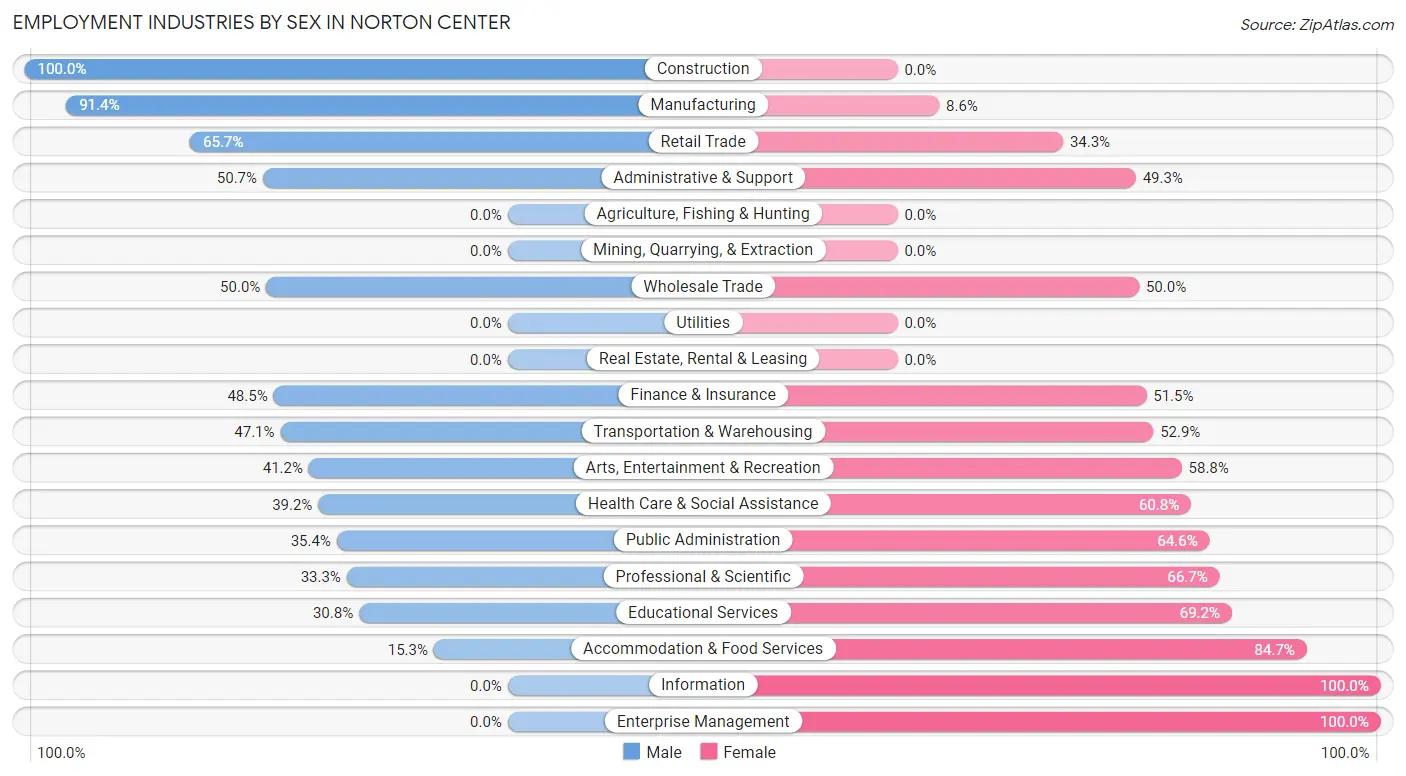
Employment Industries by Sex in Norton Center
The Norton Center industries that see more men than women are Construction (100.0%), Manufacturing (91.4%), and Retail Trade (65.7%), whereas the industries that tend to have a higher number of women are Information (100.0%), Enterprise Management (100.0%), and Accommodation & Food Services (84.7%).
| Industry | Male | Female |
| Agriculture, Fishing & Hunting | 0 (0.0%) | 0 (0.0%) |
| Mining, Quarrying, & Extraction | 0 (0.0%) | 0 (0.0%) |
| Construction | 24 (100.0%) | 0 (0.0%) |
| Manufacturing | 53 (91.4%) | 5 (8.6%) |
| Wholesale Trade | 10 (50.0%) | 10 (50.0%) |
| Retail Trade | 71 (65.7%) | 37 (34.3%) |
| Transportation & Warehousing | 8 (47.1%) | 9 (52.9%) |
| Utilities | 0 (0.0%) | 0 (0.0%) |
| Information | 0 (0.0%) | 3 (100.0%) |
| Finance & Insurance | 16 (48.5%) | 17 (51.5%) |
| Real Estate, Rental & Leasing | 0 (0.0%) | 0 (0.0%) |
| Professional & Scientific | 23 (33.3%) | 46 (66.7%) |
| Enterprise Management | 0 (0.0%) | 7 (100.0%) |
| Administrative & Support | 37 (50.7%) | 36 (49.3%) |
| Educational Services | 121 (30.8%) | 272 (69.2%) |
| Health Care & Social Assistance | 51 (39.2%) | 79 (60.8%) |
| Arts, Entertainment & Recreation | 7 (41.2%) | 10 (58.8%) |
| Accommodation & Food Services | 28 (15.3%) | 155 (84.7%) |
| Public Administration | 40 (35.4%) | 73 (64.6%) |
| Total | 498 (39.6%) | 761 (60.4%) |
Education in Norton Center
School Enrollment in Norton Center
The most common levels of schooling among the 1,558 students in Norton Center are college / undergraduate (1,432 | 91.9%), graduate / professional (51 | 3.3%), and high school (41 | 2.6%).
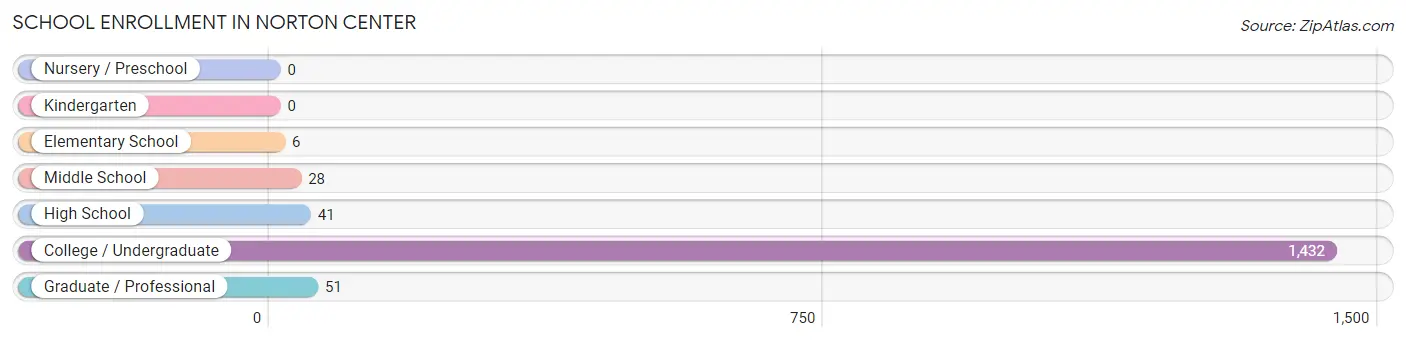
| School Level | # Students | % Students |
| Nursery / Preschool | 0 | 0.0% |
| Kindergarten | 0 | 0.0% |
| Elementary School | 6 | 0.4% |
| Middle School | 28 | 1.8% |
| High School | 41 | 2.6% |
| College / Undergraduate | 1,432 | 91.9% |
| Graduate / Professional | 51 | 3.3% |
| Total | 1,558 | 100.0% |
School Enrollment by Age by Funding Source in Norton Center
Out of a total of 1,558 students who are enrolled in schools in Norton Center, 989 (63.5%) attend a private institution, while the remaining 569 (36.5%) are enrolled in public schools. The age group of 18 to 19 year olds has the highest likelihood of being enrolled in private schools, with 488 (75.4% in the age bracket) enrolled. Conversely, the age group of 5 to 9 year old has the lowest likelihood of being enrolled in a private school, with 6 (100.0% in the age bracket) attending a public institution.
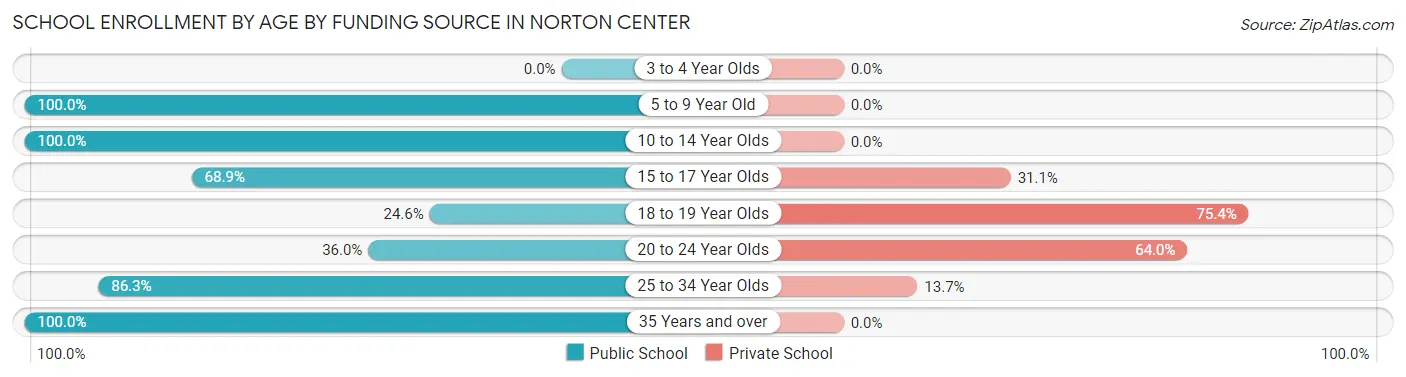
| Age Bracket | Public School | Private School |
| 3 to 4 Year Olds | 0 (0.0%) | 0 (0.0%) |
| 5 to 9 Year Old | 6 (100.0%) | 0 (0.0%) |
| 10 to 14 Year Olds | 28 (100.0%) | 0 (0.0%) |
| 15 to 17 Year Olds | 31 (68.9%) | 14 (31.1%) |
| 18 to 19 Year Olds | 159 (24.6%) | 488 (75.4%) |
| 20 to 24 Year Olds | 270 (36.0%) | 480 (64.0%) |
| 25 to 34 Year Olds | 44 (86.3%) | 7 (13.7%) |
| 35 Years and over | 31 (100.0%) | 0 (0.0%) |
| Total | 569 (36.5%) | 989 (63.5%) |
Educational Attainment by Field of Study in Norton Center
Business (97 | 22.8%), arts & humanities (71 | 16.7%), psychology (47 | 11.0%), visual & performing arts (47 | 11.0%), and education (41 | 9.6%) are the most common fields of study among 426 individuals in Norton Center who have obtained a bachelor's degree or higher.
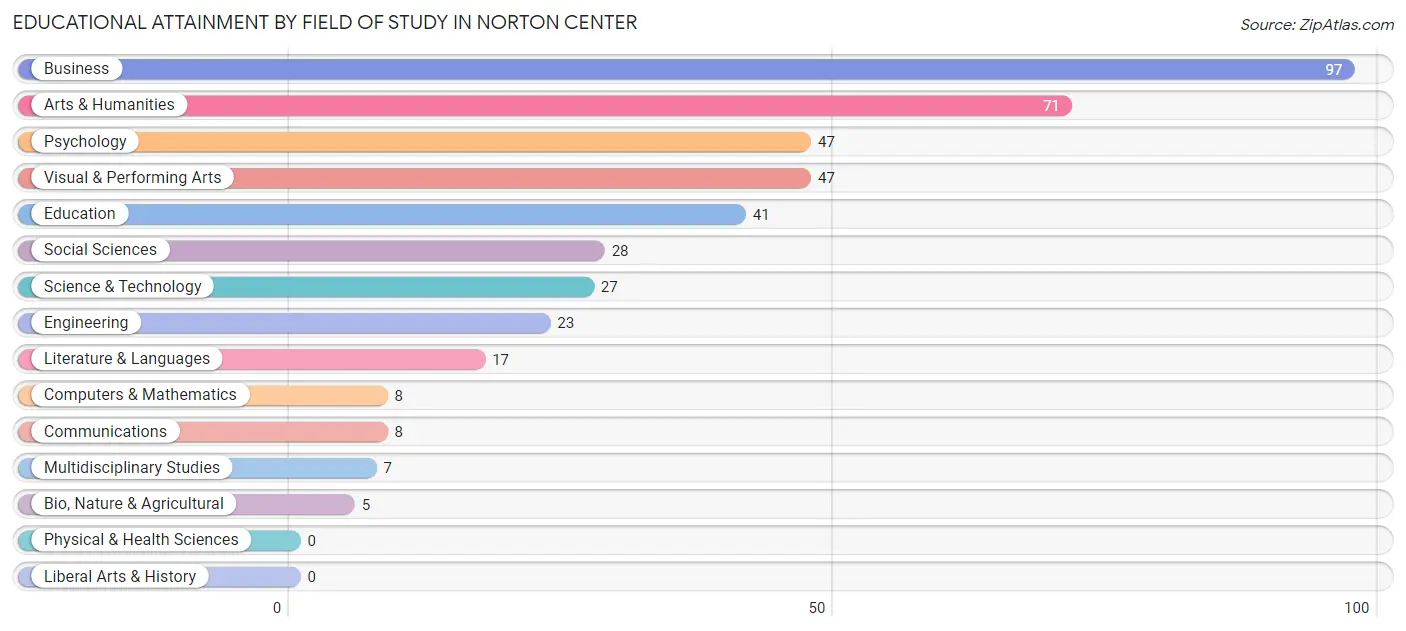
| Field of Study | # Graduates | % Graduates |
| Computers & Mathematics | 8 | 1.9% |
| Bio, Nature & Agricultural | 5 | 1.2% |
| Physical & Health Sciences | 0 | 0.0% |
| Psychology | 47 | 11.0% |
| Social Sciences | 28 | 6.6% |
| Engineering | 23 | 5.4% |
| Multidisciplinary Studies | 7 | 1.6% |
| Science & Technology | 27 | 6.3% |
| Business | 97 | 22.8% |
| Education | 41 | 9.6% |
| Literature & Languages | 17 | 4.0% |
| Liberal Arts & History | 0 | 0.0% |
| Visual & Performing Arts | 47 | 11.0% |
| Communications | 8 | 1.9% |
| Arts & Humanities | 71 | 16.7% |
| Total | 426 | 100.0% |
Transportation & Commute in Norton Center
Vehicle Availability by Sex in Norton Center
The most prevalent vehicle ownership categories in Norton Center are males with 2 vehicles (132, accounting for 48.0%) and females with 2 vehicles (195, making up 41.4%).
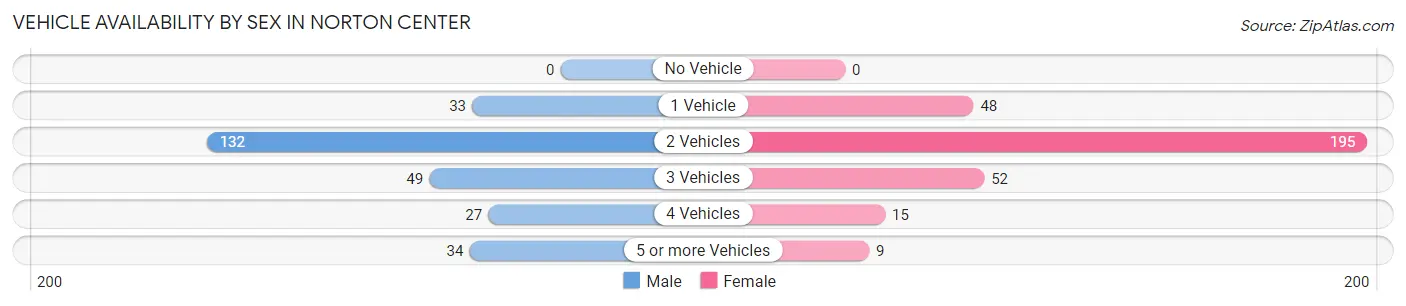
| Vehicles Available | Male | Female |
| No Vehicle | 0 (0.0%) | 0 (0.0%) |
| 1 Vehicle | 33 (12.0%) | 48 (15.0%) |
| 2 Vehicles | 132 (48.0%) | 195 (61.1%) |
| 3 Vehicles | 49 (17.8%) | 52 (16.3%) |
| 4 Vehicles | 27 (9.8%) | 15 (4.7%) |
| 5 or more Vehicles | 34 (12.4%) | 9 (2.8%) |
| Total | 275 (100.0%) | 319 (100.0%) |
Commute Time in Norton Center
The most frequently occuring commute durations in Norton Center are 10 to 14 minutes (208 commuters, 21.7%), 15 to 19 minutes (133 commuters, 13.9%), and 5 to 9 minutes (108 commuters, 11.3%).
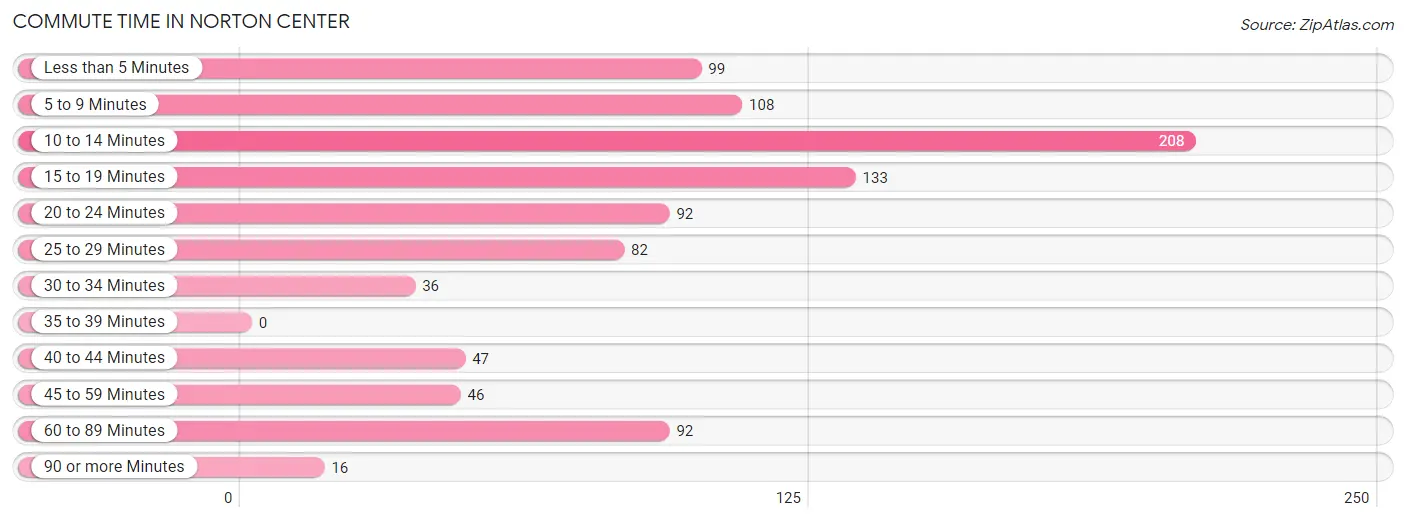
| Commute Time | # Commuters | % Commuters |
| Less than 5 Minutes | 99 | 10.3% |
| 5 to 9 Minutes | 108 | 11.3% |
| 10 to 14 Minutes | 208 | 21.7% |
| 15 to 19 Minutes | 133 | 13.9% |
| 20 to 24 Minutes | 92 | 9.6% |
| 25 to 29 Minutes | 82 | 8.6% |
| 30 to 34 Minutes | 36 | 3.7% |
| 35 to 39 Minutes | 0 | 0.0% |
| 40 to 44 Minutes | 47 | 4.9% |
| 45 to 59 Minutes | 46 | 4.8% |
| 60 to 89 Minutes | 92 | 9.6% |
| 90 or more Minutes | 16 | 1.7% |
Commute Time by Sex in Norton Center
The most common commute times in Norton Center are 10 to 14 minutes (86 commuters, 22.7%) for males and 10 to 14 minutes (122 commuters, 21.0%) for females.
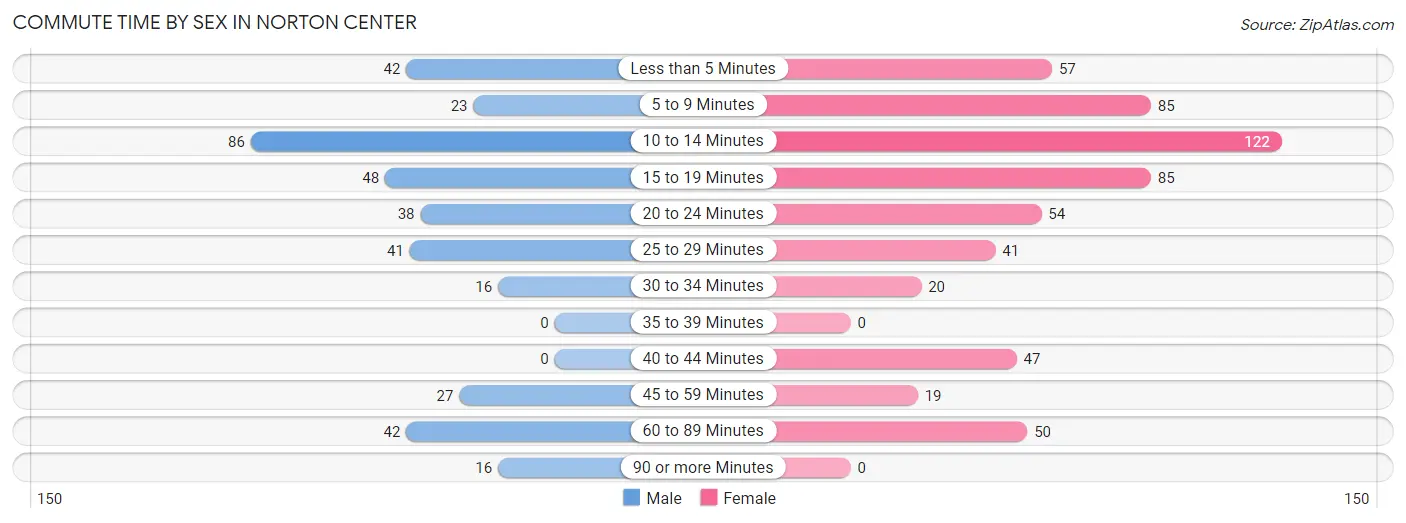
| Commute Time | Male | Female |
| Less than 5 Minutes | 42 (11.1%) | 57 (9.8%) |
| 5 to 9 Minutes | 23 (6.1%) | 85 (14.7%) |
| 10 to 14 Minutes | 86 (22.7%) | 122 (21.0%) |
| 15 to 19 Minutes | 48 (12.7%) | 85 (14.7%) |
| 20 to 24 Minutes | 38 (10.0%) | 54 (9.3%) |
| 25 to 29 Minutes | 41 (10.8%) | 41 (7.1%) |
| 30 to 34 Minutes | 16 (4.2%) | 20 (3.5%) |
| 35 to 39 Minutes | 0 (0.0%) | 0 (0.0%) |
| 40 to 44 Minutes | 0 (0.0%) | 47 (8.1%) |
| 45 to 59 Minutes | 27 (7.1%) | 19 (3.3%) |
| 60 to 89 Minutes | 42 (11.1%) | 50 (8.6%) |
| 90 or more Minutes | 16 (4.2%) | 0 (0.0%) |
Time of Departure to Work by Sex in Norton Center
The most frequent times of departure to work in Norton Center are 7:00 AM to 7:29 AM (74, 19.5%) for males and 12:00 PM to 3:59 PM (139, 24.0%) for females.
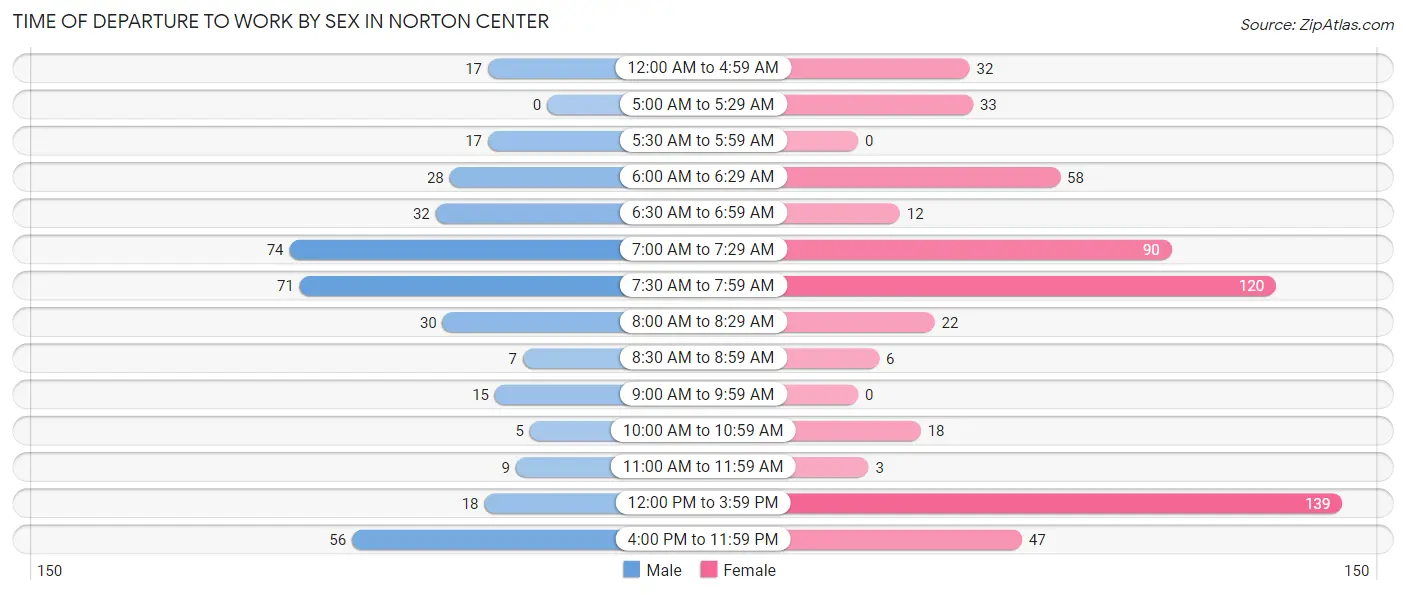
| Time of Departure | Male | Female |
| 12:00 AM to 4:59 AM | 17 (4.5%) | 32 (5.5%) |
| 5:00 AM to 5:29 AM | 0 (0.0%) | 33 (5.7%) |
| 5:30 AM to 5:59 AM | 17 (4.5%) | 0 (0.0%) |
| 6:00 AM to 6:29 AM | 28 (7.4%) | 58 (10.0%) |
| 6:30 AM to 6:59 AM | 32 (8.4%) | 12 (2.1%) |
| 7:00 AM to 7:29 AM | 74 (19.5%) | 90 (15.5%) |
| 7:30 AM to 7:59 AM | 71 (18.7%) | 120 (20.7%) |
| 8:00 AM to 8:29 AM | 30 (7.9%) | 22 (3.8%) |
| 8:30 AM to 8:59 AM | 7 (1.8%) | 6 (1.0%) |
| 9:00 AM to 9:59 AM | 15 (4.0%) | 0 (0.0%) |
| 10:00 AM to 10:59 AM | 5 (1.3%) | 18 (3.1%) |
| 11:00 AM to 11:59 AM | 9 (2.4%) | 3 (0.5%) |
| 12:00 PM to 3:59 PM | 18 (4.8%) | 139 (24.0%) |
| 4:00 PM to 11:59 PM | 56 (14.8%) | 47 (8.1%) |
| Total | 379 (100.0%) | 580 (100.0%) |
Housing Occupancy in Norton Center
Occupancy by Ownership in Norton Center
Of the total 376 dwellings in Norton Center, owner-occupied units account for 337 (89.6%), while renter-occupied units make up 39 (10.4%).
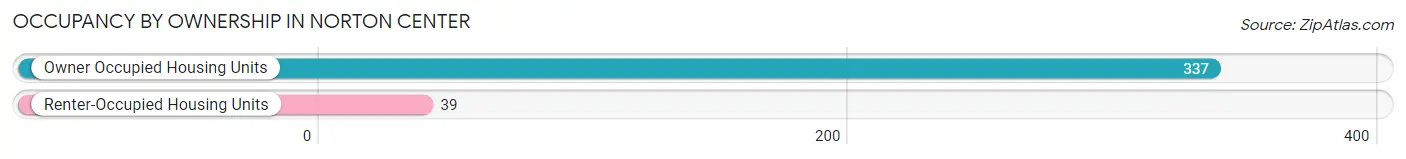
| Occupancy | # Housing Units | % Housing Units |
| Owner Occupied Housing Units | 337 | 89.6% |
| Renter-Occupied Housing Units | 39 | 10.4% |
| Total Occupied Housing Units | 376 | 100.0% |
Occupancy by Household Size in Norton Center
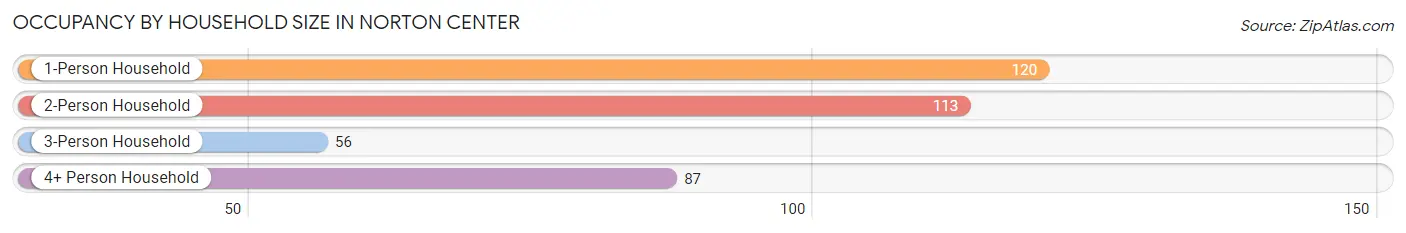
| Household Size | # Housing Units | % Housing Units |
| 1-Person Household | 120 | 31.9% |
| 2-Person Household | 113 | 30.0% |
| 3-Person Household | 56 | 14.9% |
| 4+ Person Household | 87 | 23.1% |
| Total Housing Units | 376 | 100.0% |
Occupancy by Ownership by Household Size in Norton Center
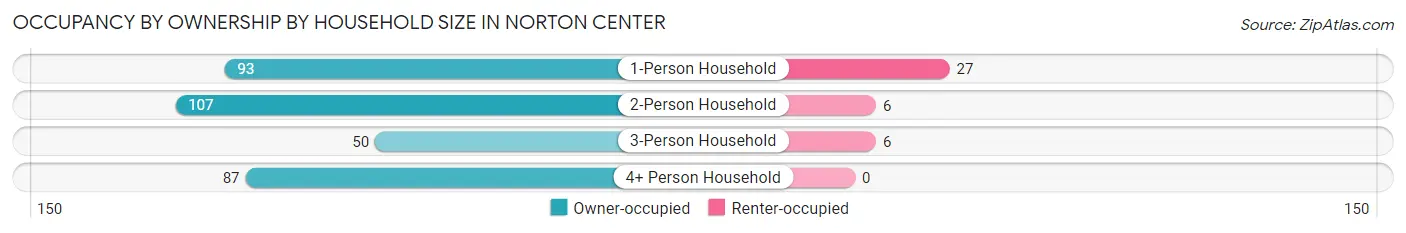
| Household Size | Owner-occupied | Renter-occupied |
| 1-Person Household | 93 (77.5%) | 27 (22.5%) |
| 2-Person Household | 107 (94.7%) | 6 (5.3%) |
| 3-Person Household | 50 (89.3%) | 6 (10.7%) |
| 4+ Person Household | 87 (100.0%) | 0 (0.0%) |
| Total Housing Units | 337 (89.6%) | 39 (10.4%) |
Occupancy by Educational Attainment in Norton Center
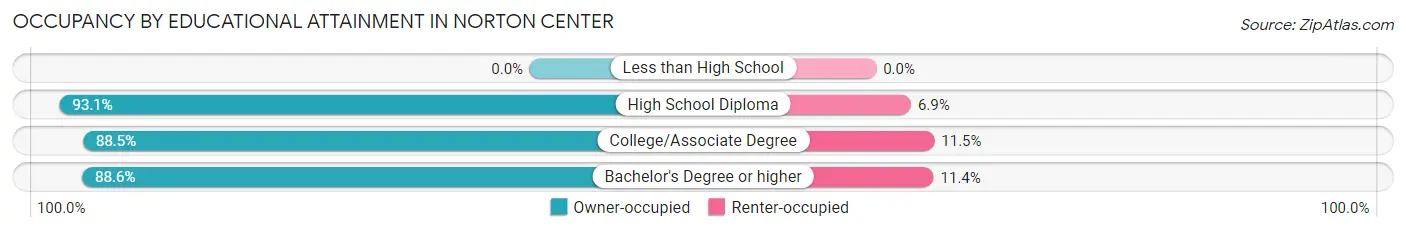
| Household Size | Owner-occupied | Renter-occupied |
| Less than High School | 0 (0.0%) | 0 (0.0%) |
| High School Diploma | 81 (93.1%) | 6 (6.9%) |
| College/Associate Degree | 46 (88.5%) | 6 (11.5%) |
| Bachelor's Degree or higher | 210 (88.6%) | 27 (11.4%) |
Occupancy by Age of Householder in Norton Center
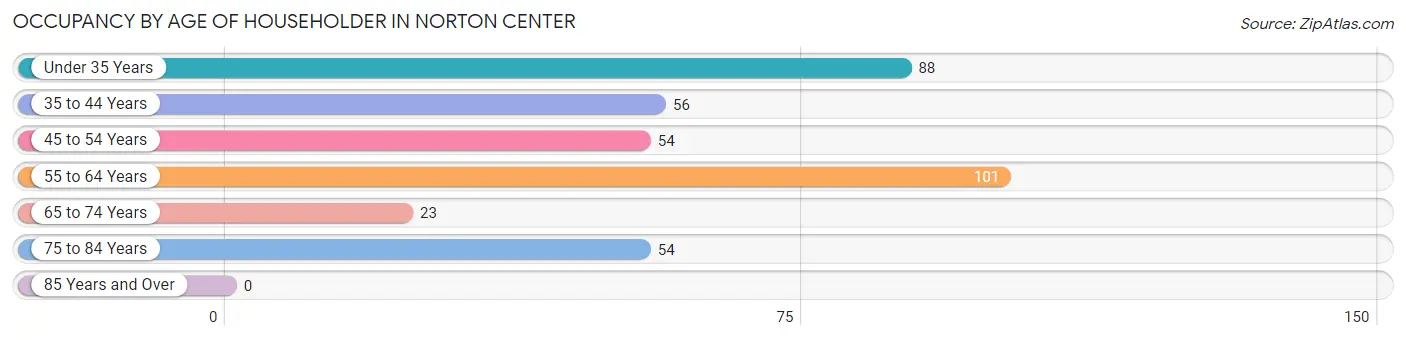
| Age Bracket | # Households | % Households |
| Under 35 Years | 88 | 23.4% |
| 35 to 44 Years | 56 | 14.9% |
| 45 to 54 Years | 54 | 14.4% |
| 55 to 64 Years | 101 | 26.9% |
| 65 to 74 Years | 23 | 6.1% |
| 75 to 84 Years | 54 | 14.4% |
| 85 Years and Over | 0 | 0.0% |
| Total | 376 | 100.0% |
Housing Finances in Norton Center
Median Income by Occupancy in Norton Center
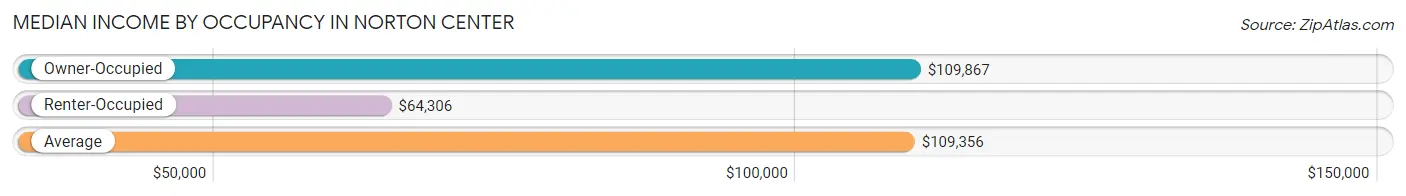
| Occupancy Type | # Households | Median Income |
| Owner-Occupied | 337 (89.6%) | $109,867 |
| Renter-Occupied | 39 (10.4%) | $64,306 |
| Average | 376 (100.0%) | $109,356 |
Occupancy by Householder Income Bracket in Norton Center
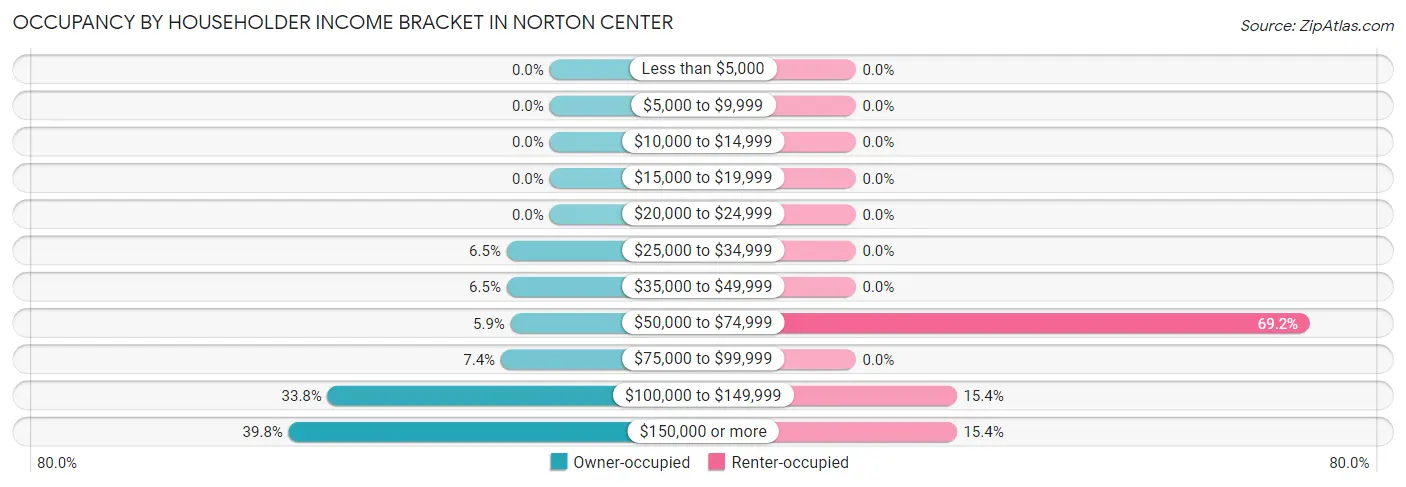
| Income Bracket | Owner-occupied | Renter-occupied |
| Less than $5,000 | 0 (0.0%) | 0 (0.0%) |
| $5,000 to $9,999 | 0 (0.0%) | 0 (0.0%) |
| $10,000 to $14,999 | 0 (0.0%) | 0 (0.0%) |
| $15,000 to $19,999 | 0 (0.0%) | 0 (0.0%) |
| $20,000 to $24,999 | 0 (0.0%) | 0 (0.0%) |
| $25,000 to $34,999 | 22 (6.5%) | 0 (0.0%) |
| $35,000 to $49,999 | 22 (6.5%) | 0 (0.0%) |
| $50,000 to $74,999 | 20 (5.9%) | 27 (69.2%) |
| $75,000 to $99,999 | 25 (7.4%) | 0 (0.0%) |
| $100,000 to $149,999 | 114 (33.8%) | 6 (15.4%) |
| $150,000 or more | 134 (39.8%) | 6 (15.4%) |
| Total | 337 (100.0%) | 39 (100.0%) |
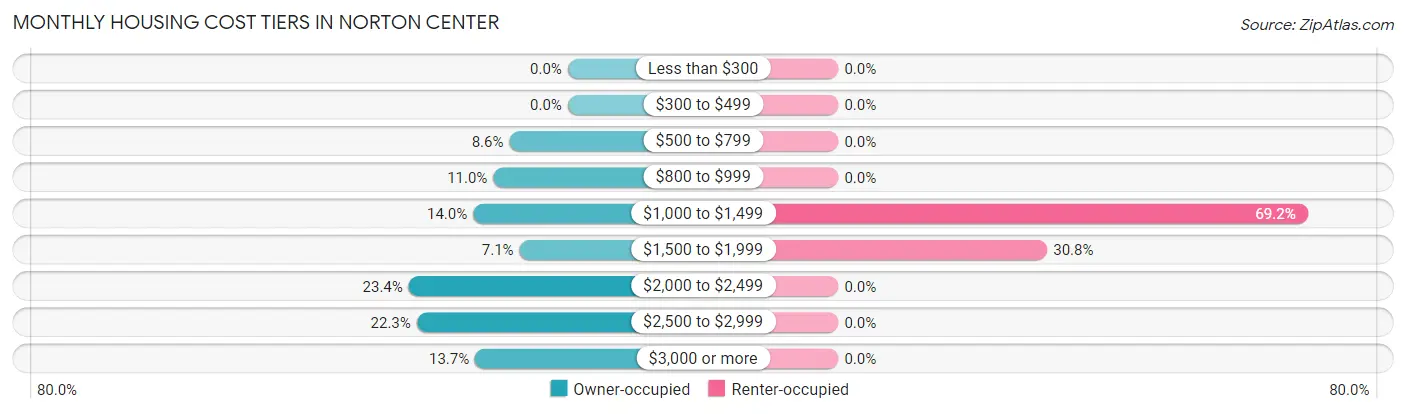
Monthly Housing Cost Tiers in Norton Center
| Monthly Cost | Owner-occupied | Renter-occupied |
| Less than $300 | 0 (0.0%) | 0 (0.0%) |
| $300 to $499 | 0 (0.0%) | 0 (0.0%) |
| $500 to $799 | 29 (8.6%) | 0 (0.0%) |
| $800 to $999 | 37 (11.0%) | 0 (0.0%) |
| $1,000 to $1,499 | 47 (14.0%) | 27 (69.2%) |
| $1,500 to $1,999 | 24 (7.1%) | 12 (30.8%) |
| $2,000 to $2,499 | 79 (23.4%) | 0 (0.0%) |
| $2,500 to $2,999 | 75 (22.3%) | 0 (0.0%) |
| $3,000 or more | 46 (13.7%) | 0 (0.0%) |
| Total | 337 (100.0%) | 39 (100.0%) |
Physical Housing Characteristics in Norton Center
Housing Structures in Norton Center
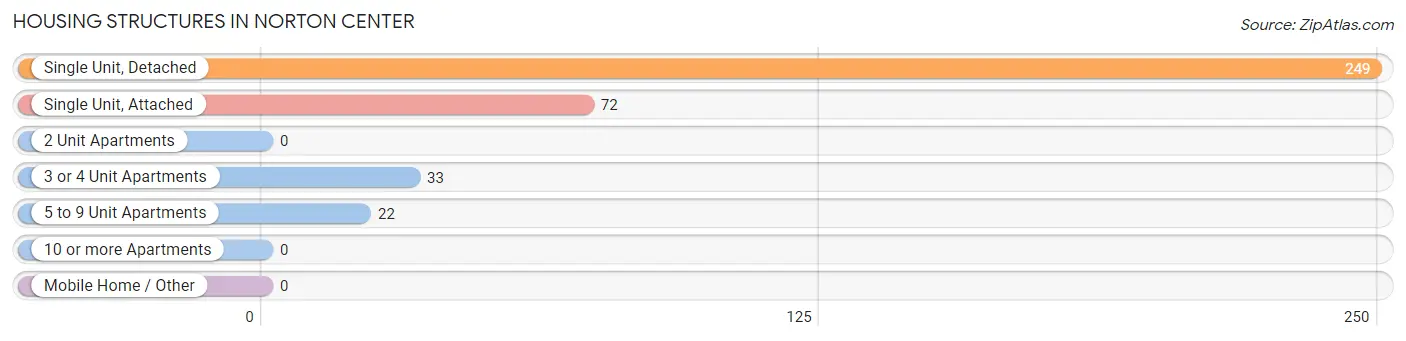
| Structure Type | # Housing Units | % Housing Units |
| Single Unit, Detached | 249 | 66.2% |
| Single Unit, Attached | 72 | 19.2% |
| 2 Unit Apartments | 0 | 0.0% |
| 3 or 4 Unit Apartments | 33 | 8.8% |
| 5 to 9 Unit Apartments | 22 | 5.9% |
| 10 or more Apartments | 0 | 0.0% |
| Mobile Home / Other | 0 | 0.0% |
| Total | 376 | 100.0% |
Housing Structures by Occupancy in Norton Center
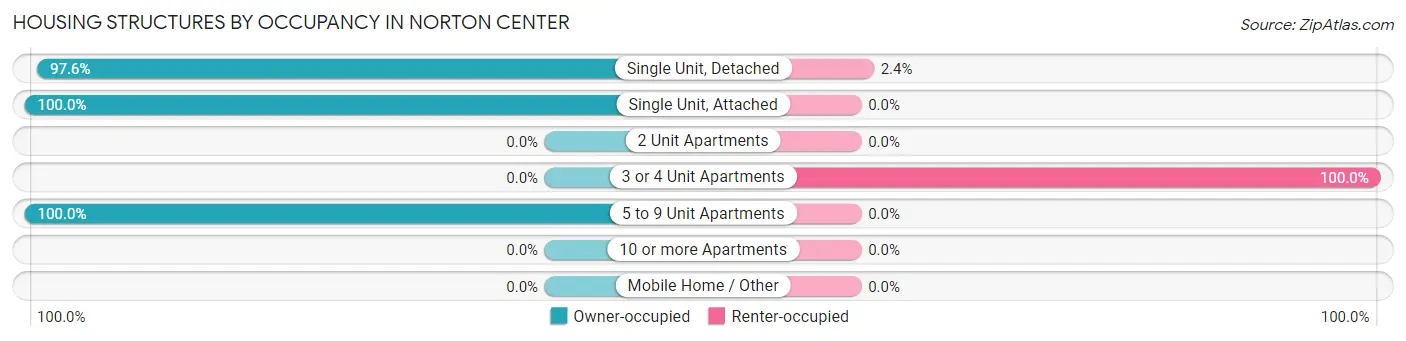
| Structure Type | Owner-occupied | Renter-occupied |
| Single Unit, Detached | 243 (97.6%) | 6 (2.4%) |
| Single Unit, Attached | 72 (100.0%) | 0 (0.0%) |
| 2 Unit Apartments | 0 (0.0%) | 0 (0.0%) |
| 3 or 4 Unit Apartments | 0 (0.0%) | 33 (100.0%) |
| 5 to 9 Unit Apartments | 22 (100.0%) | 0 (0.0%) |
| 10 or more Apartments | 0 (0.0%) | 0 (0.0%) |
| Mobile Home / Other | 0 (0.0%) | 0 (0.0%) |
| Total | 337 (89.6%) | 39 (10.4%) |
Housing Structures by Number of Rooms in Norton Center
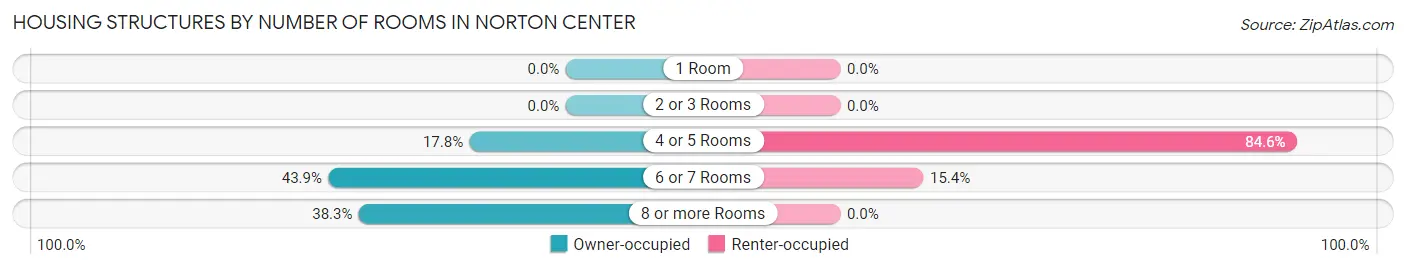
| Number of Rooms | Owner-occupied | Renter-occupied |
| 1 Room | 0 (0.0%) | 0 (0.0%) |
| 2 or 3 Rooms | 0 (0.0%) | 0 (0.0%) |
| 4 or 5 Rooms | 60 (17.8%) | 33 (84.6%) |
| 6 or 7 Rooms | 148 (43.9%) | 6 (15.4%) |
| 8 or more Rooms | 129 (38.3%) | 0 (0.0%) |
| Total | 337 (100.0%) | 39 (100.0%) |
Housing Structure by Heating Type in Norton Center
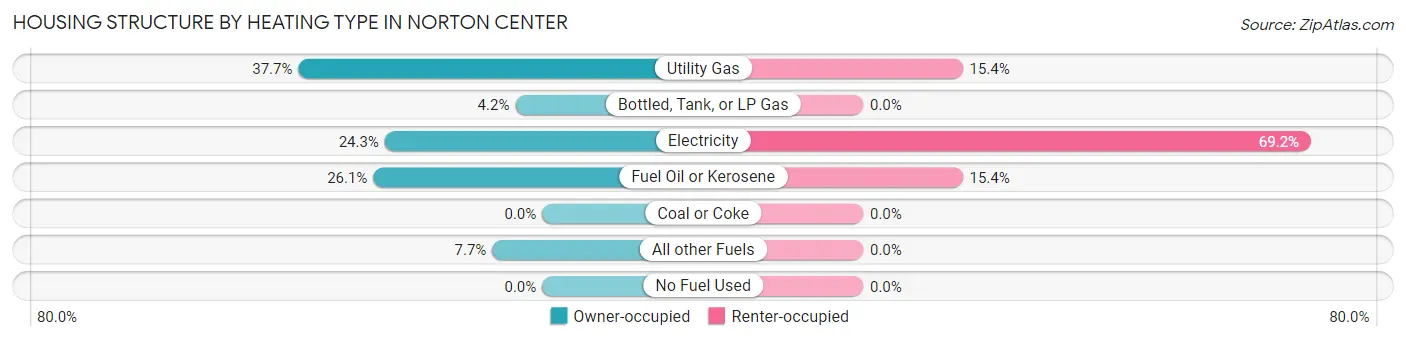
| Heating Type | Owner-occupied | Renter-occupied |
| Utility Gas | 127 (37.7%) | 6 (15.4%) |
| Bottled, Tank, or LP Gas | 14 (4.2%) | 0 (0.0%) |
| Electricity | 82 (24.3%) | 27 (69.2%) |
| Fuel Oil or Kerosene | 88 (26.1%) | 6 (15.4%) |
| Coal or Coke | 0 (0.0%) | 0 (0.0%) |
| All other Fuels | 26 (7.7%) | 0 (0.0%) |
| No Fuel Used | 0 (0.0%) | 0 (0.0%) |
| Total | 337 (100.0%) | 39 (100.0%) |
Household Vehicle Usage in Norton Center
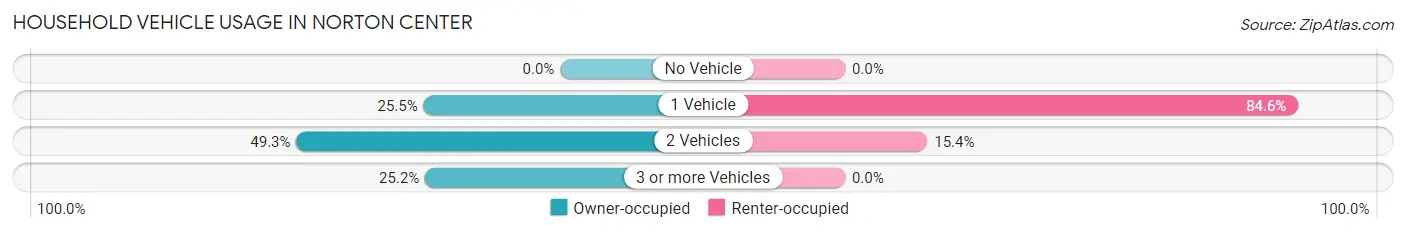
| Vehicles per Household | Owner-occupied | Renter-occupied |
| No Vehicle | 0 (0.0%) | 0 (0.0%) |
| 1 Vehicle | 86 (25.5%) | 33 (84.6%) |
| 2 Vehicles | 166 (49.3%) | 6 (15.4%) |
| 3 or more Vehicles | 85 (25.2%) | 0 (0.0%) |
| Total | 337 (100.0%) | 39 (100.0%) |
Real Estate & Mortgages in Norton Center
Real Estate and Mortgage Overview in Norton Center
| Characteristic | Without Mortgage | With Mortgage |
| Housing Units | 126 | 211 |
| Median Property Value | $351,200 | $470,500 |
| Median Household Income | $79,583 | $108 |
| Monthly Housing Costs | $979 | $46 |
| Real Estate Taxes | $5,111 | $0 |
Property Value by Mortgage Status in Norton Center
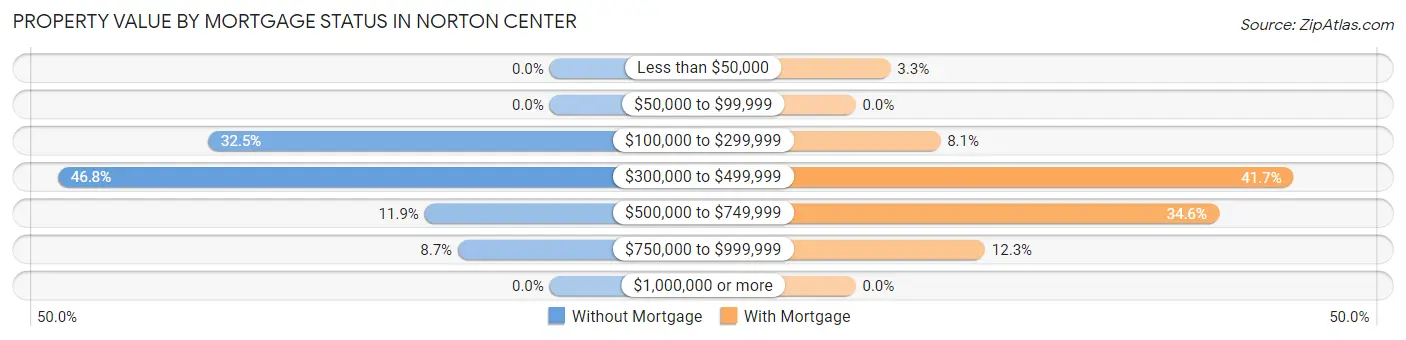
| Property Value | Without Mortgage | With Mortgage |
| Less than $50,000 | 0 (0.0%) | 7 (3.3%) |
| $50,000 to $99,999 | 0 (0.0%) | 0 (0.0%) |
| $100,000 to $299,999 | 41 (32.5%) | 17 (8.1%) |
| $300,000 to $499,999 | 59 (46.8%) | 88 (41.7%) |
| $500,000 to $749,999 | 15 (11.9%) | 73 (34.6%) |
| $750,000 to $999,999 | 11 (8.7%) | 26 (12.3%) |
| $1,000,000 or more | 0 (0.0%) | 0 (0.0%) |
| Total | 126 (100.0%) | 211 (100.0%) |
Household Income by Mortgage Status in Norton Center
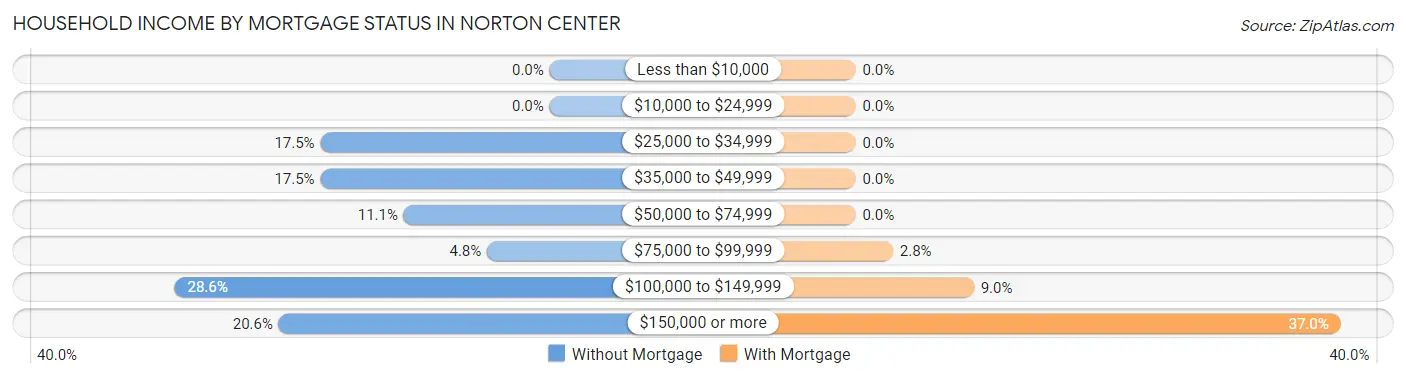
| Household Income | Without Mortgage | With Mortgage |
| Less than $10,000 | 0 (0.0%) | 0 (0.0%) |
| $10,000 to $24,999 | 0 (0.0%) | 0 (0.0%) |
| $25,000 to $34,999 | 22 (17.5%) | 0 (0.0%) |
| $35,000 to $49,999 | 22 (17.5%) | 0 (0.0%) |
| $50,000 to $74,999 | 14 (11.1%) | 0 (0.0%) |
| $75,000 to $99,999 | 6 (4.8%) | 6 (2.8%) |
| $100,000 to $149,999 | 36 (28.6%) | 19 (9.0%) |
| $150,000 or more | 26 (20.6%) | 78 (37.0%) |
| Total | 126 (100.0%) | 211 (100.0%) |
Property Value to Household Income Ratio in Norton Center
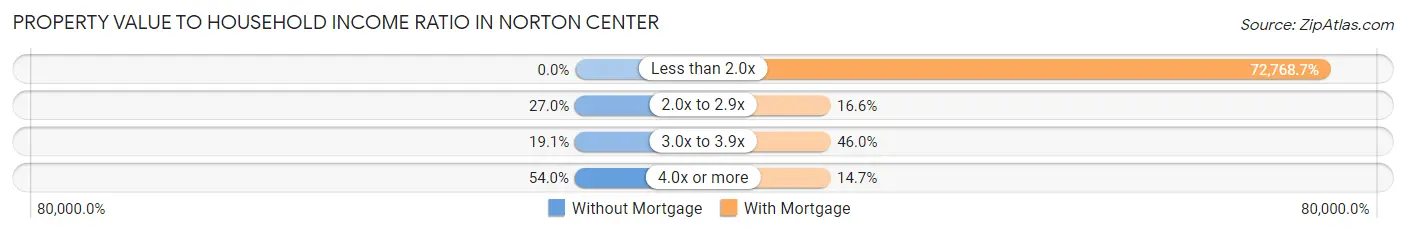
| Value-to-Income Ratio | Without Mortgage | With Mortgage |
| Less than 2.0x | 0 (0.0%) | 153,542 (72,768.7%) |
| 2.0x to 2.9x | 34 (27.0%) | 35 (16.6%) |
| 3.0x to 3.9x | 24 (19.1%) | 97 (46.0%) |
| 4.0x or more | 68 (54.0%) | 31 (14.7%) |
| Total | 126 (100.0%) | 211 (100.0%) |
Real Estate Taxes by Mortgage Status in Norton Center
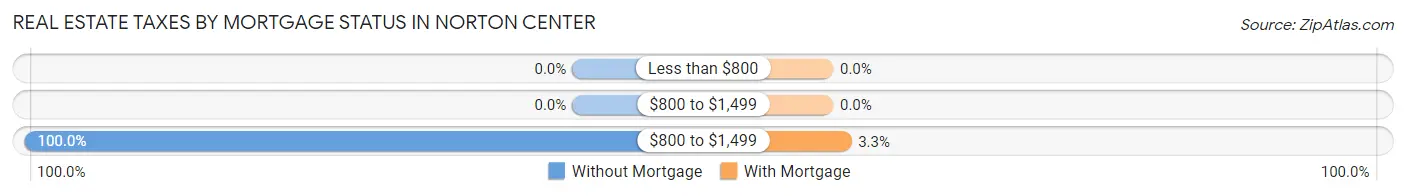
| Property Taxes | Without Mortgage | With Mortgage |
| Less than $800 | 0 (0.0%) | 0 (0.0%) |
| $800 to $1,499 | 0 (0.0%) | 0 (0.0%) |
| $800 to $1,499 | 126 (100.0%) | 7 (3.3%) |
| Total | 126 (100.0%) | 211 (100.0%) |
Health & Disability in Norton Center
Health Insurance Coverage by Age in Norton Center
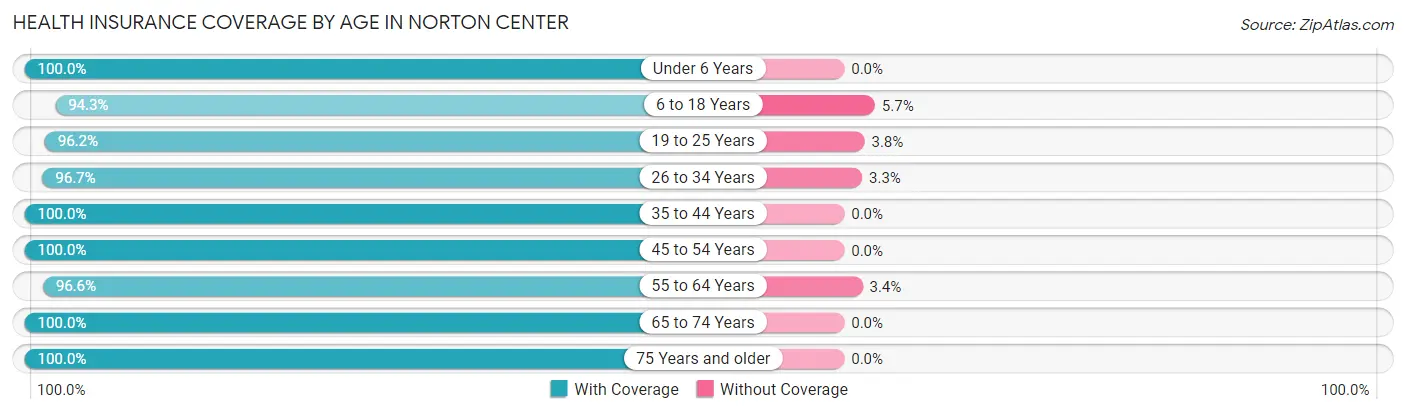
| Age Bracket | With Coverage | Without Coverage |
| Under 6 Years | 93 (100.0%) | 0 (0.0%) |
| 6 to 18 Years | 330 (94.3%) | 20 (5.7%) |
| 19 to 25 Years | 1,221 (96.2%) | 48 (3.8%) |
| 26 to 34 Years | 204 (96.7%) | 7 (3.3%) |
| 35 to 44 Years | 123 (100.0%) | 0 (0.0%) |
| 45 to 54 Years | 204 (100.0%) | 0 (0.0%) |
| 55 to 64 Years | 199 (96.6%) | 7 (3.4%) |
| 65 to 74 Years | 51 (100.0%) | 0 (0.0%) |
| 75 Years and older | 64 (100.0%) | 0 (0.0%) |
| Total | 2,489 (96.8%) | 82 (3.2%) |
Health Insurance Coverage by Citizenship Status in Norton Center
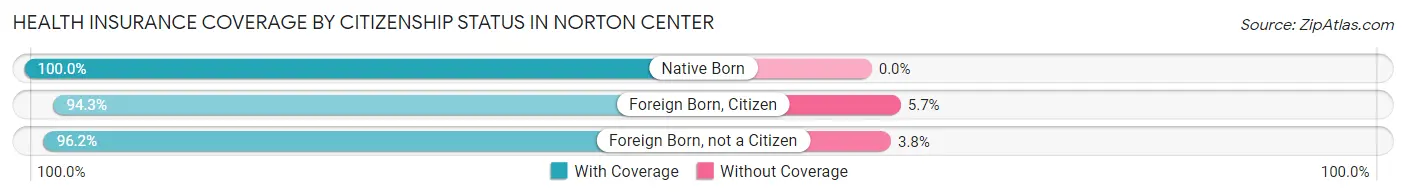
| Citizenship Status | With Coverage | Without Coverage |
| Native Born | 93 (100.0%) | 0 (0.0%) |
| Foreign Born, Citizen | 330 (94.3%) | 20 (5.7%) |
| Foreign Born, not a Citizen | 1,221 (96.2%) | 48 (3.8%) |
Health Insurance Coverage by Household Income in Norton Center
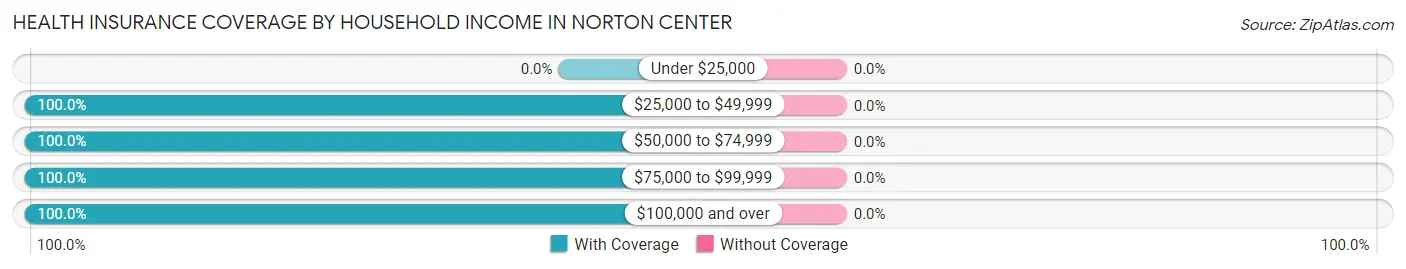
| Household Income | With Coverage | Without Coverage |
| Under $25,000 | 0 (0.0%) | 0 (0.0%) |
| $25,000 to $49,999 | 44 (100.0%) | 0 (0.0%) |
| $50,000 to $74,999 | 69 (100.0%) | 0 (0.0%) |
| $75,000 to $99,999 | 42 (100.0%) | 0 (0.0%) |
| $100,000 and over | 794 (100.0%) | 0 (0.0%) |
Public vs Private Health Insurance Coverage by Age in Norton Center
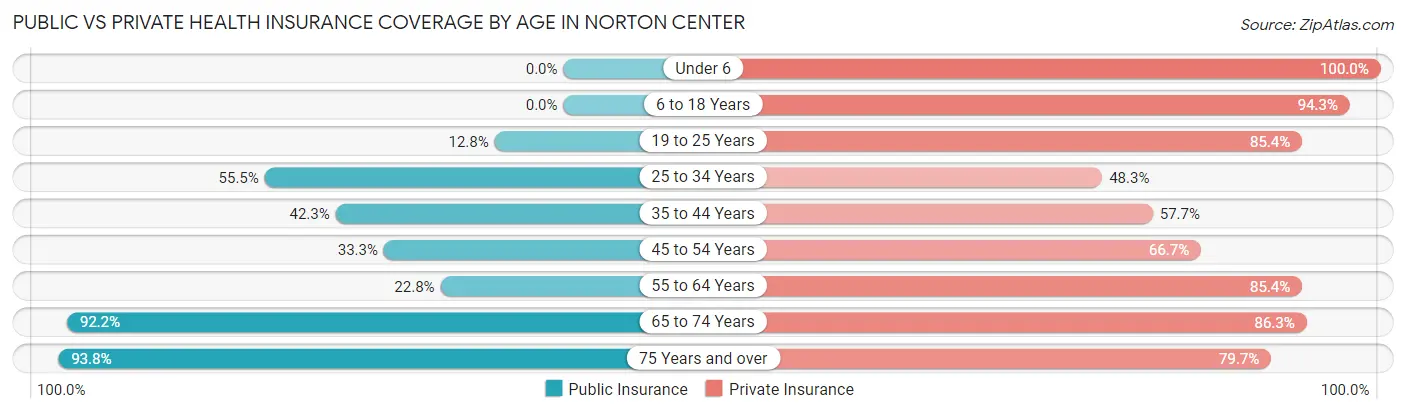
| Age Bracket | Public Insurance | Private Insurance |
| Under 6 | 0 (0.0%) | 93 (100.0%) |
| 6 to 18 Years | 0 (0.0%) | 330 (94.3%) |
| 19 to 25 Years | 162 (12.8%) | 1,084 (85.4%) |
| 25 to 34 Years | 117 (55.4%) | 102 (48.3%) |
| 35 to 44 Years | 52 (42.3%) | 71 (57.7%) |
| 45 to 54 Years | 68 (33.3%) | 136 (66.7%) |
| 55 to 64 Years | 47 (22.8%) | 176 (85.4%) |
| 65 to 74 Years | 47 (92.2%) | 44 (86.3%) |
| 75 Years and over | 60 (93.8%) | 51 (79.7%) |
| Total | 553 (21.5%) | 2,087 (81.2%) |
Disability Status by Sex by Age in Norton Center
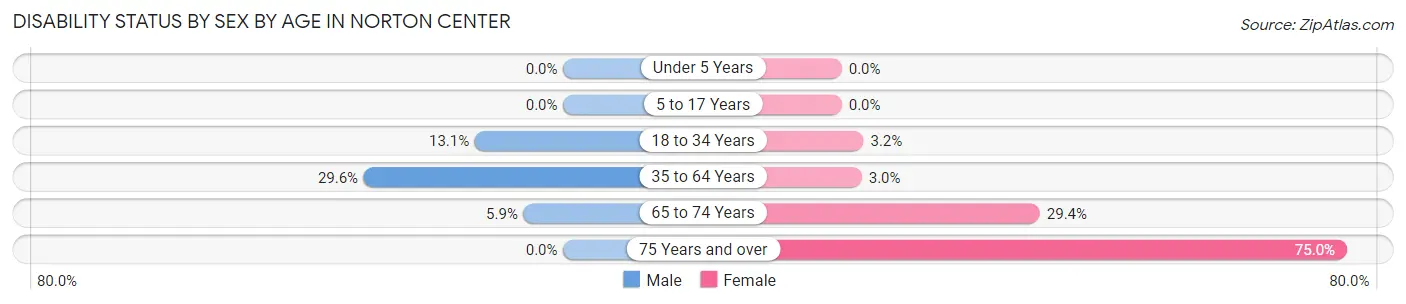
| Age Bracket | Male | Female |
| Under 5 Years | 0 (0.0%) | 0 (0.0%) |
| 5 to 17 Years | 0 (0.0%) | 0 (0.0%) |
| 18 to 34 Years | 112 (13.1%) | 29 (3.2%) |
| 35 to 64 Years | 98 (29.6%) | 6 (3.0%) |
| 65 to 74 Years | 2 (5.9%) | 5 (29.4%) |
| 75 Years and over | 0 (0.0%) | 45 (75.0%) |
Disability Class by Sex by Age in Norton Center
Disability Class: Hearing Difficulty
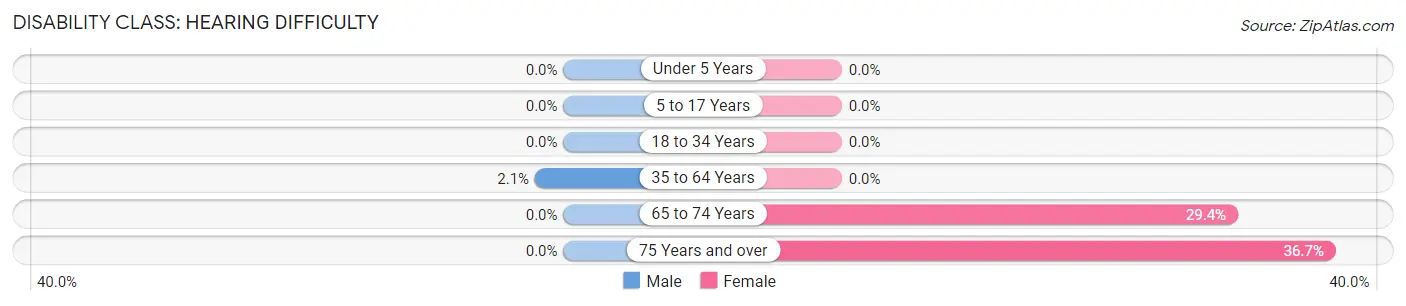
| Age Bracket | Male | Female |
| Under 5 Years | 0 (0.0%) | 0 (0.0%) |
| 5 to 17 Years | 0 (0.0%) | 0 (0.0%) |
| 18 to 34 Years | 0 (0.0%) | 0 (0.0%) |
| 35 to 64 Years | 7 (2.1%) | 0 (0.0%) |
| 65 to 74 Years | 0 (0.0%) | 5 (29.4%) |
| 75 Years and over | 0 (0.0%) | 22 (36.7%) |
Disability Class: Vision Difficulty
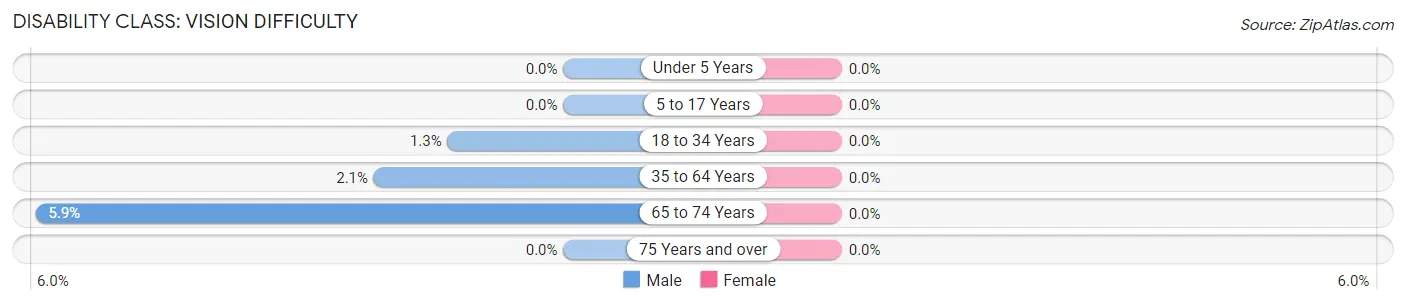
| Age Bracket | Male | Female |
| Under 5 Years | 0 (0.0%) | 0 (0.0%) |
| 5 to 17 Years | 0 (0.0%) | 0 (0.0%) |
| 18 to 34 Years | 11 (1.3%) | 0 (0.0%) |
| 35 to 64 Years | 7 (2.1%) | 0 (0.0%) |
| 65 to 74 Years | 2 (5.9%) | 0 (0.0%) |
| 75 Years and over | 0 (0.0%) | 0 (0.0%) |
Disability Class: Cognitive Difficulty
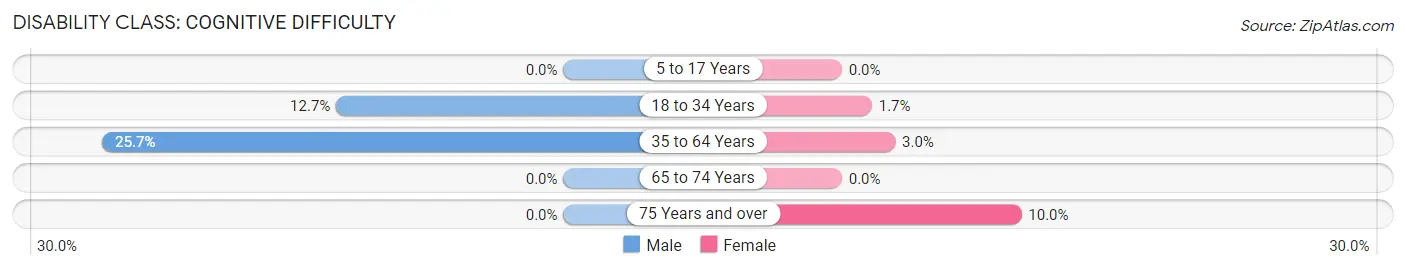
| Age Bracket | Male | Female |
| 5 to 17 Years | 0 (0.0%) | 0 (0.0%) |
| 18 to 34 Years | 108 (12.7%) | 15 (1.7%) |
| 35 to 64 Years | 85 (25.7%) | 6 (3.0%) |
| 65 to 74 Years | 0 (0.0%) | 0 (0.0%) |
| 75 Years and over | 0 (0.0%) | 6 (10.0%) |
Disability Class: Ambulatory Difficulty
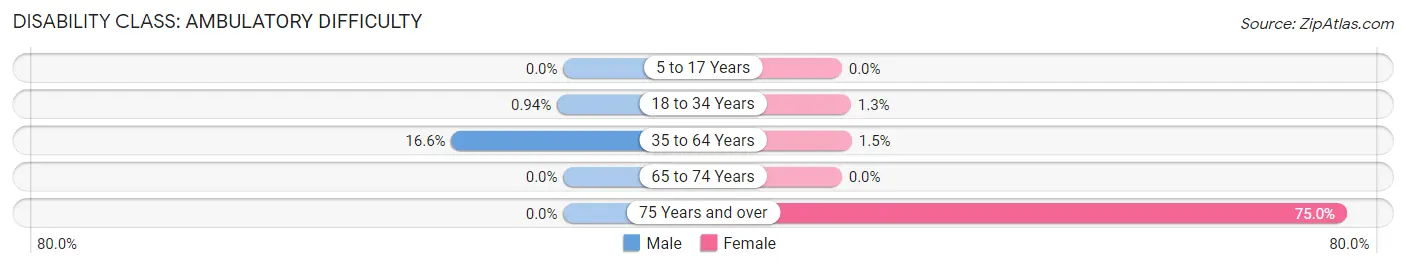
| Age Bracket | Male | Female |
| 5 to 17 Years | 0 (0.0%) | 0 (0.0%) |
| 18 to 34 Years | 8 (0.9%) | 12 (1.3%) |
| 35 to 64 Years | 55 (16.6%) | 3 (1.5%) |
| 65 to 74 Years | 0 (0.0%) | 0 (0.0%) |
| 75 Years and over | 0 (0.0%) | 45 (75.0%) |
Disability Class: Self-Care Difficulty
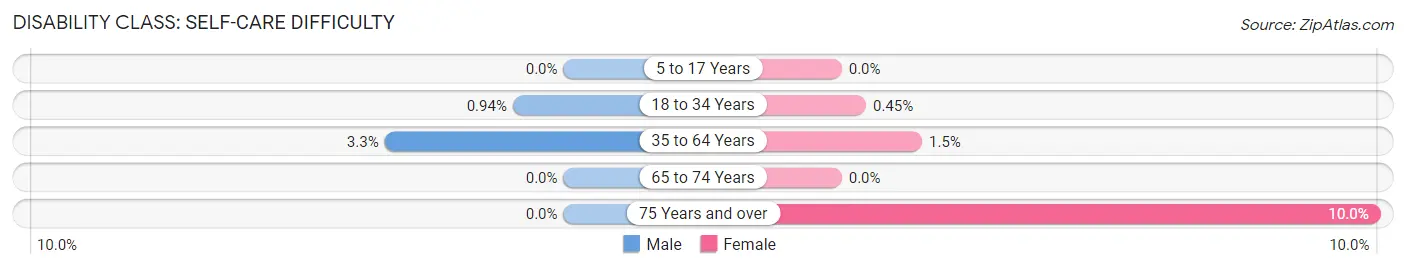
| Age Bracket | Male | Female |
| 5 to 17 Years | 0 (0.0%) | 0 (0.0%) |
| 18 to 34 Years | 8 (0.9%) | 4 (0.4%) |
| 35 to 64 Years | 11 (3.3%) | 3 (1.5%) |
| 65 to 74 Years | 0 (0.0%) | 0 (0.0%) |
| 75 Years and over | 0 (0.0%) | 6 (10.0%) |
Technology Access in Norton Center
Computing Device Access in Norton Center
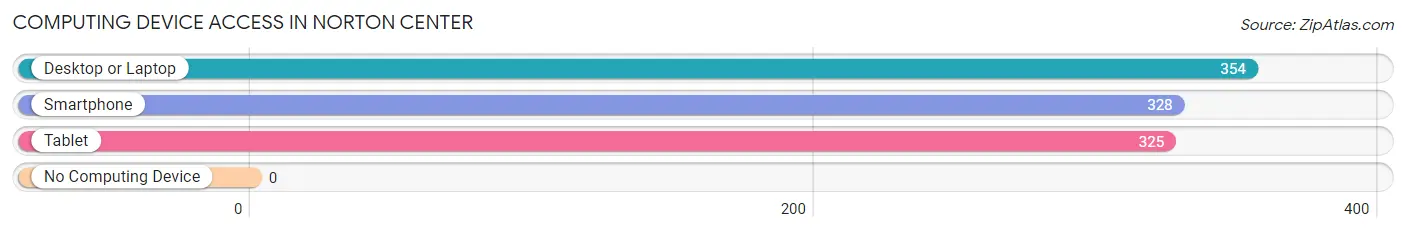
| Device Type | # Households | % Households |
| Desktop or Laptop | 354 | 94.2% |
| Smartphone | 328 | 87.2% |
| Tablet | 325 | 86.4% |
| No Computing Device | 0 | 0.0% |
| Total | 376 | 100.0% |
Internet Access in Norton Center
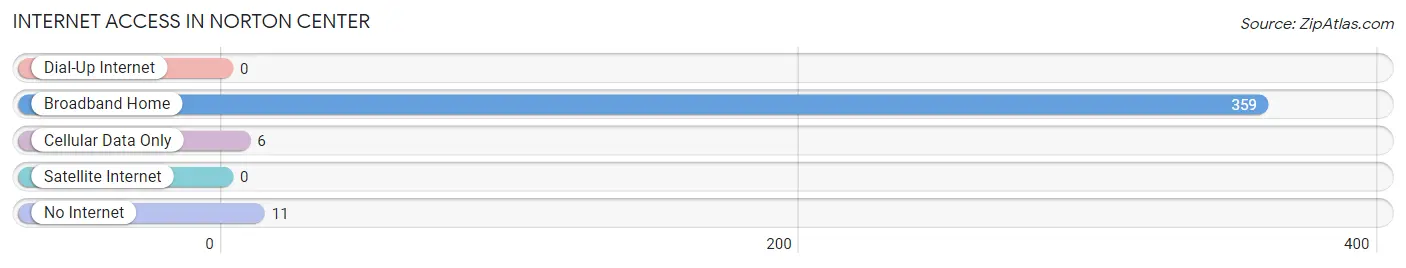
| Internet Type | # Households | % Households |
| Dial-Up Internet | 0 | 0.0% |
| Broadband Home | 359 | 95.5% |
| Cellular Data Only | 6 | 1.6% |
| Satellite Internet | 0 | 0.0% |
| No Internet | 11 | 2.9% |
| Total | 376 | 100.0% |
Norton Center Summary
Norton Center is a small town located in the state of Massachusetts, in the United States of America. It is situated in Bristol County, and is part of the Greater Boston metropolitan area. The town has a population of approximately 8,000 people, and is known for its rural charm and small-town atmosphere.
History
Norton Center was first settled in 1669 by a group of English settlers from the nearby town of Taunton. The town was originally known as East Taunton, and was part of the Taunton Purchase. In 1711, the town was officially incorporated as Norton, after the Norton family, who were prominent landowners in the area.
The town was primarily an agricultural community for much of its history, with the main crops being corn, potatoes, and hay. In the late 19th century, the town began to industrialize, with the establishment of several factories, including a paper mill, a shoe factory, and a brickyard.
Geography
Norton Center is located in southeastern Massachusetts, in Bristol County. It is situated on the Taunton River, and is bordered by the towns of Easton, Mansfield, and Attleboro. The town is approximately 25 miles south of Boston, and is part of the Greater Boston metropolitan area.
The town has a total area of 8.3 square miles, of which 8.2 square miles is land and 0.1 square miles is water. The town is mostly flat, with some rolling hills in the northern part of town. The highest point in town is the summit of Norton Hill, which is approximately 300 feet above sea level.
Economy
Norton Center is primarily a residential community, with most of its residents commuting to nearby cities for work. The town does have some small businesses, including a few restaurants, a grocery store, and a few retail stores.
The town is also home to several industrial and manufacturing businesses, including a paper mill, a shoe factory, and a brickyard. These businesses provide employment for many of the town’s residents.
Demographics
As of the 2010 census, the population of Norton Center was 8,039. The racial makeup of the town was 94.3% White, 1.7% African American, 0.3% Native American, 1.2% Asian, 0.1% Pacific Islander, 1.2% from other races, and 1.4% from two or more races. Hispanic or Latino of any race were 3.2% of the population.
The median household income in Norton Center was $68,944, and the median family income was $77,917. The per capita income for the town was $30,945. About 4.3% of families and 5.7% of the population were below the poverty line, including 6.3% of those under age 18 and 4.2% of those age 65 or over.
Common Questions
What is Per Capita Income in Norton Center?
Per Capita income in Norton Center is $26,087.
What is the Median Family Income in Norton Center?
Median Family Income in Norton Center is $138,750.
What is the Median Household income in Norton Center?
Median Household Income in Norton Center is $109,356.
What is Income or Wage Gap in Norton Center?
Income or Wage Gap in Norton Center is 42.8%.
Women in Norton Center earn 57.2 cents for every dollar earned by a man.
What is Inequality or Gini Index in Norton Center?
Inequality or Gini Index in Norton Center is 0.36.
What is the Total Population of Norton Center?
Total Population of Norton Center is 2,580.
What is the Total Male Population of Norton Center?
Total Male Population of Norton Center is 1,304.
What is the Total Female Population of Norton Center?
Total Female Population of Norton Center is 1,276.
What is the Ratio of Males per 100 Females in Norton Center?
There are 102.19 Males per 100 Females in Norton Center.
What is the Ratio of Females per 100 Males in Norton Center?
There are 97.85 Females per 100 Males in Norton Center.
What is the Median Population Age in Norton Center?
Median Population Age in Norton Center is 21.5 Years.
What is the Average Family Size in Norton Center
Average Family Size in Norton Center is 3.2 People.
What is the Average Household Size in Norton Center
Average Household Size in Norton Center is 2.5 People.
How Large is the Labor Force in Norton Center?
There are 1,322 People in the Labor Forcein in Norton Center.
What is the Percentage of People in the Labor Force in Norton Center?
54.1% of People are in the Labor Force in Norton Center.
What is the Unemployment Rate in Norton Center?
Unemployment Rate in Norton Center is 4.1%.