Woburn, MA Map & Demographics
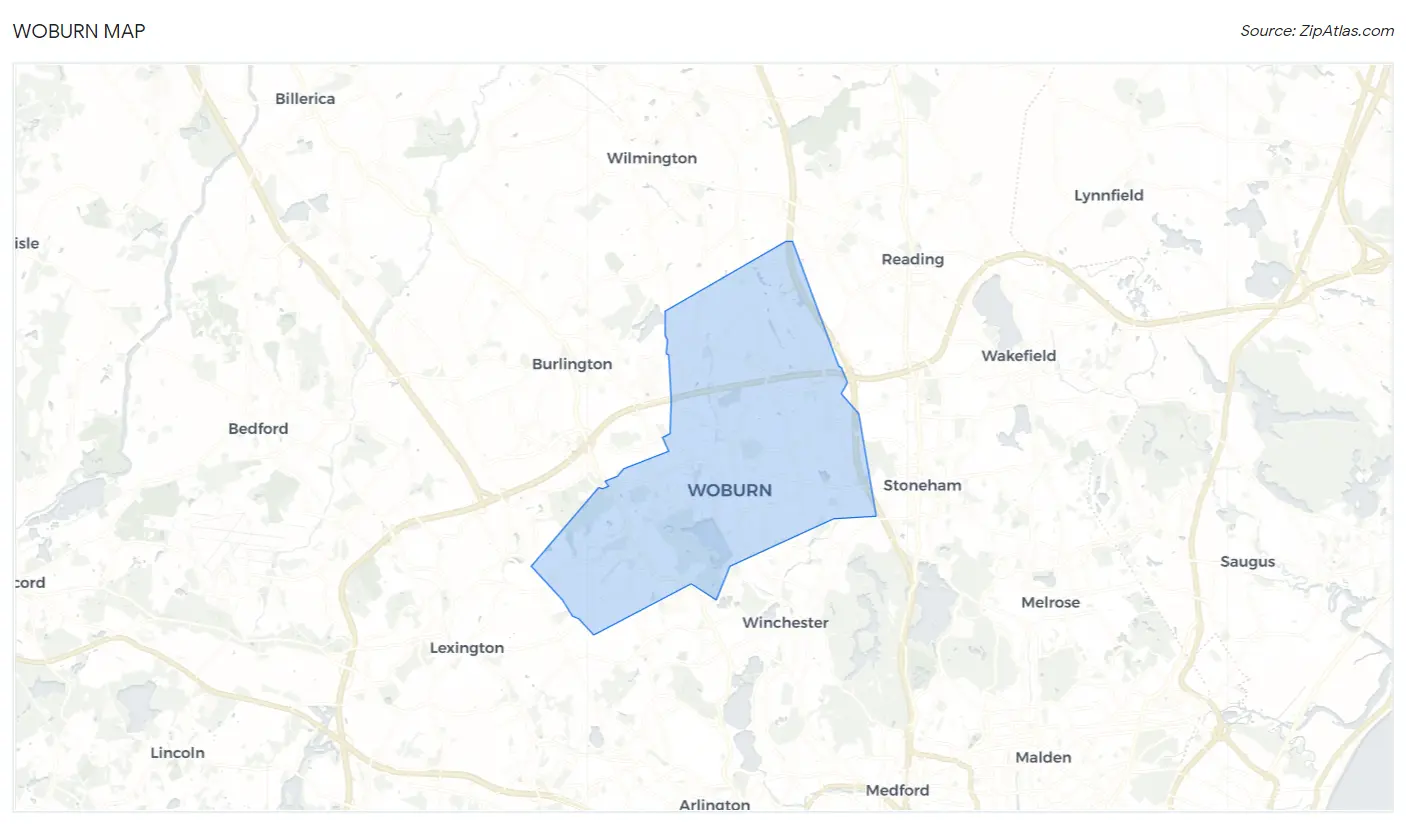
Woburn Map
Woburn Overview
$54,578
PER CAPITA INCOME
$127,328
AVG FAMILY INCOME
$104,780
AVG HOUSEHOLD INCOME
38.7%
WAGE / INCOME GAP [ % ]
61.3¢/ $1
WAGE / INCOME GAP [ $ ]
0.43
INEQUALITY / GINI INDEX
40,992
TOTAL POPULATION
20,032
MALE POPULATION
20,960
FEMALE POPULATION
95.57
MALES / 100 FEMALES
104.63
FEMALES / 100 MALES
39.2
MEDIAN AGE
3.1
AVG FAMILY SIZE
2.5
AVG HOUSEHOLD SIZE
24,895
LABOR FORCE [ PEOPLE ]
72.2%
PERCENT IN LABOR FORCE
7.4%
UNEMPLOYMENT RATE
Woburn Zip Codes
Income in Woburn
Income Overview in Woburn
Per Capita Income in Woburn is $54,578, while median incomes of families and households are $127,328 and $104,780 respectively.
| Characteristic | Number | Measure |
| Per Capita Income | 40,992 | $54,578 |
| Median Family Income | 10,458 | $127,328 |
| Mean Family Income | 10,458 | $160,556 |
| Median Household Income | 16,121 | $104,780 |
| Mean Household Income | 16,121 | $137,519 |
| Income Deficit | 10,458 | $0 |
| Wage / Income Gap (%) | 40,992 | 38.74% |
| Wage / Income Gap ($) | 40,992 | 61.26¢ per $1 |
| Gini / Inequality Index | 40,992 | 0.43 |
Earnings by Sex in Woburn
Average Earnings in Woburn are $57,034, $73,294 for men and $44,902 for women, a difference of 38.7%.
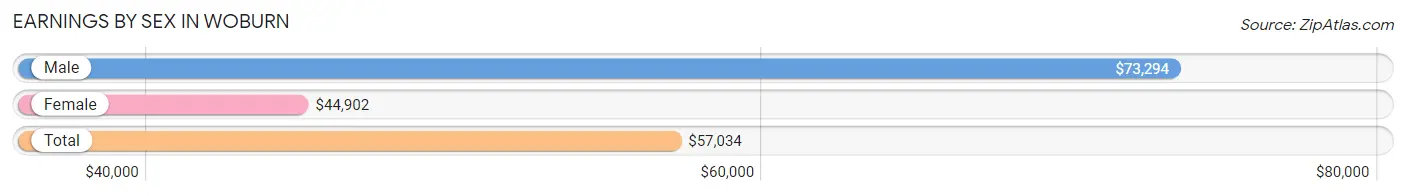
| Sex | Number | Average Earnings |
| Male | 13,054 (51.2%) | $73,294 |
| Female | 12,444 (48.8%) | $44,902 |
| Total | 25,498 (100.0%) | $57,034 |
Earnings by Sex by Income Bracket in Woburn
The most common earnings brackets in Woburn are $100,000+ for men (4,379 | 33.6%) and $100,000+ for women (2,120 | 17.0%).
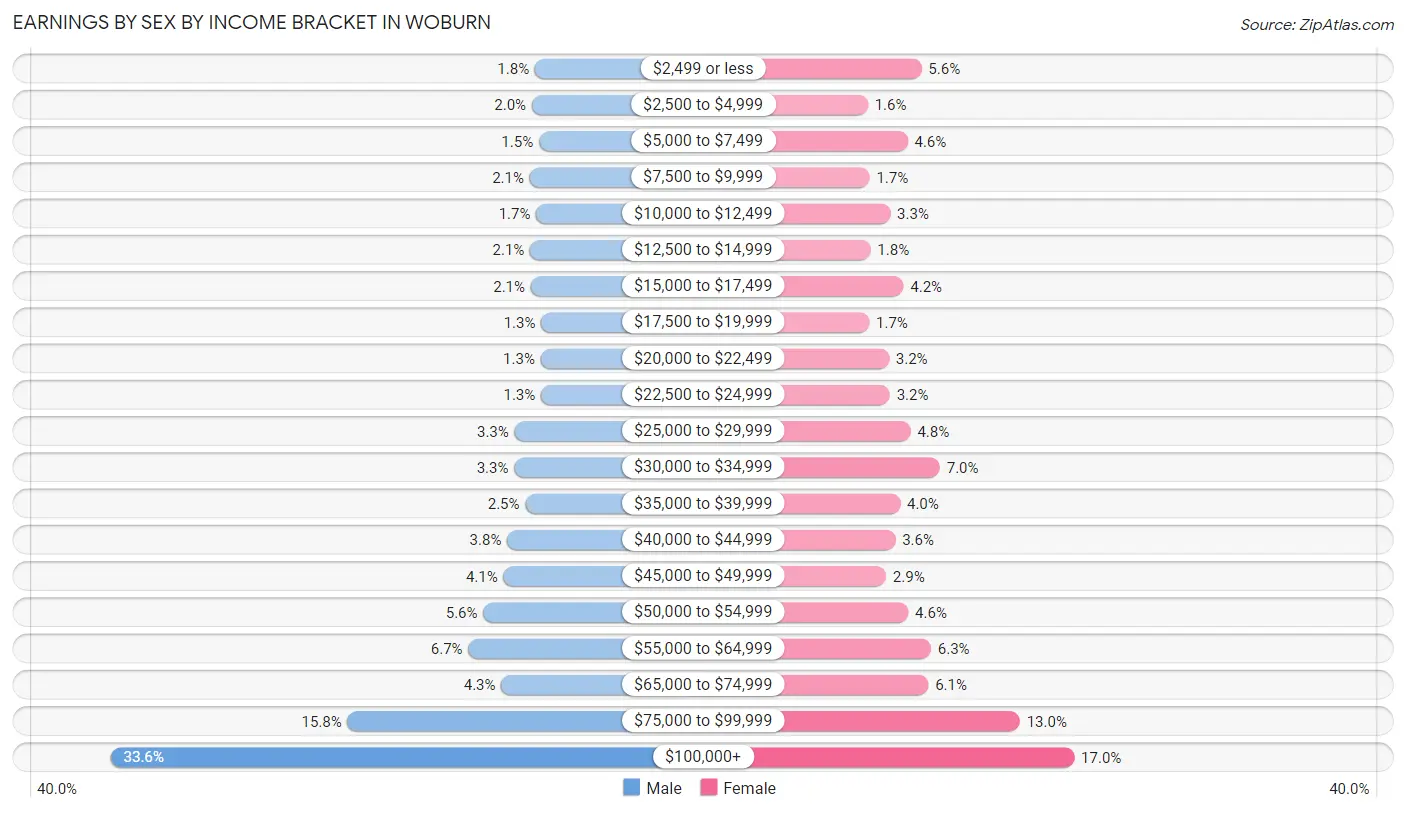
| Income | Male | Female |
| $2,499 or less | 228 (1.8%) | 695 (5.6%) |
| $2,500 to $4,999 | 259 (2.0%) | 195 (1.6%) |
| $5,000 to $7,499 | 189 (1.5%) | 566 (4.5%) |
| $7,500 to $9,999 | 280 (2.1%) | 212 (1.7%) |
| $10,000 to $12,499 | 216 (1.7%) | 404 (3.3%) |
| $12,500 to $14,999 | 276 (2.1%) | 220 (1.8%) |
| $15,000 to $17,499 | 269 (2.1%) | 528 (4.2%) |
| $17,500 to $19,999 | 167 (1.3%) | 208 (1.7%) |
| $20,000 to $22,499 | 172 (1.3%) | 392 (3.2%) |
| $22,500 to $24,999 | 168 (1.3%) | 401 (3.2%) |
| $25,000 to $29,999 | 428 (3.3%) | 594 (4.8%) |
| $30,000 to $34,999 | 431 (3.3%) | 867 (7.0%) |
| $35,000 to $39,999 | 323 (2.5%) | 497 (4.0%) |
| $40,000 to $44,999 | 500 (3.8%) | 452 (3.6%) |
| $45,000 to $49,999 | 536 (4.1%) | 364 (2.9%) |
| $50,000 to $54,999 | 733 (5.6%) | 573 (4.6%) |
| $55,000 to $64,999 | 880 (6.7%) | 784 (6.3%) |
| $65,000 to $74,999 | 558 (4.3%) | 759 (6.1%) |
| $75,000 to $99,999 | 2,062 (15.8%) | 1,613 (13.0%) |
| $100,000+ | 4,379 (33.6%) | 2,120 (17.0%) |
| Total | 13,054 (100.0%) | 12,444 (100.0%) |
Earnings by Sex by Educational Attainment in Woburn
Average earnings in Woburn are $80,677 for men and $54,623 for women, a difference of 32.3%. Men with an educational attainment of graduate degree enjoy the highest average annual earnings of $111,818, while those with less than high school education earn the least with $46,317. Women with an educational attainment of graduate degree earn the most with the average annual earnings of $93,902, while those with less than high school education have the smallest earnings of $31,979.
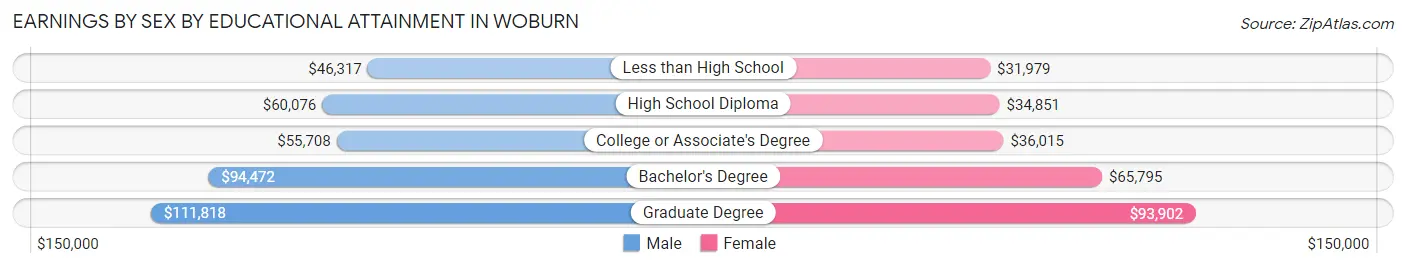
| Educational Attainment | Male Income | Female Income |
| Less than High School | $46,317 | $31,979 |
| High School Diploma | $60,076 | $34,851 |
| College or Associate's Degree | $55,708 | $36,015 |
| Bachelor's Degree | $94,472 | $65,795 |
| Graduate Degree | $111,818 | $93,902 |
| Total | $80,677 | $54,623 |
Family Income in Woburn
Family Income Brackets in Woburn
According to the Woburn family income data, there are 2,803 families falling into the $200,000+ income range, which is the most common income bracket and makes up 26.8% of all families. Conversely, the $15,000 to $24,999 income bracket is the least frequent group with only 94 families (0.9%) belonging to this category.
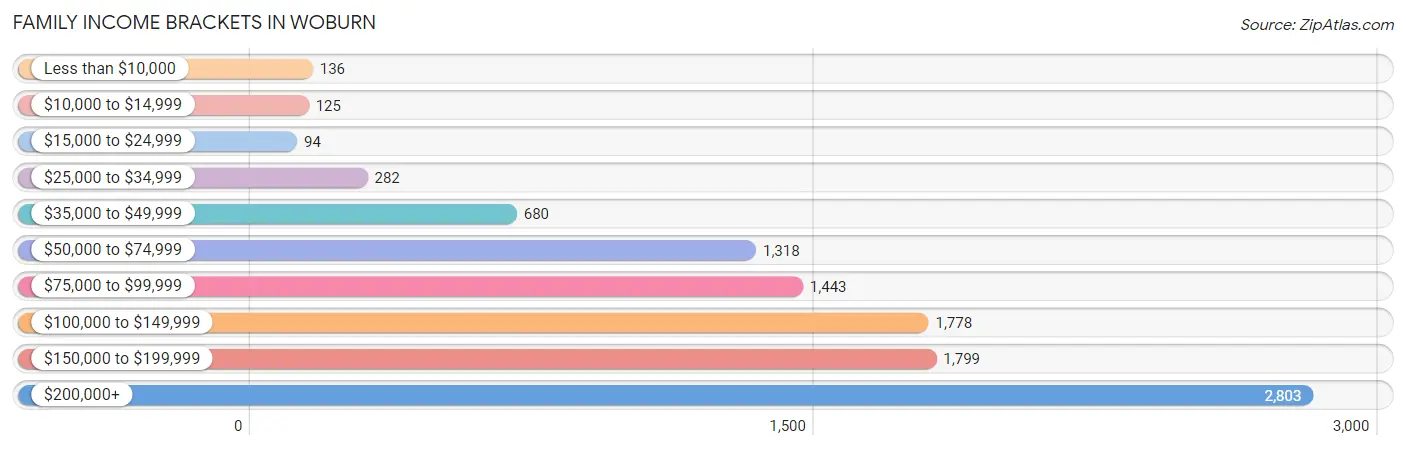
| Income Bracket | # Families | % Families |
| Less than $10,000 | 136 | 1.3% |
| $10,000 to $14,999 | 125 | 1.2% |
| $15,000 to $24,999 | 94 | 0.9% |
| $25,000 to $34,999 | 282 | 2.7% |
| $35,000 to $49,999 | 680 | 6.5% |
| $50,000 to $74,999 | 1,318 | 12.6% |
| $75,000 to $99,999 | 1,443 | 13.8% |
| $100,000 to $149,999 | 1,778 | 17.0% |
| $150,000 to $199,999 | 1,799 | 17.2% |
| $200,000+ | 2,803 | 26.8% |
Family Income by Famaliy Size in Woburn
7+ person families (64 | 0.6%) account for the highest median family income in Woburn with $250,001 per family, while 2-person families (4,168 | 39.9%) have the highest median income of $50,962 per family member.
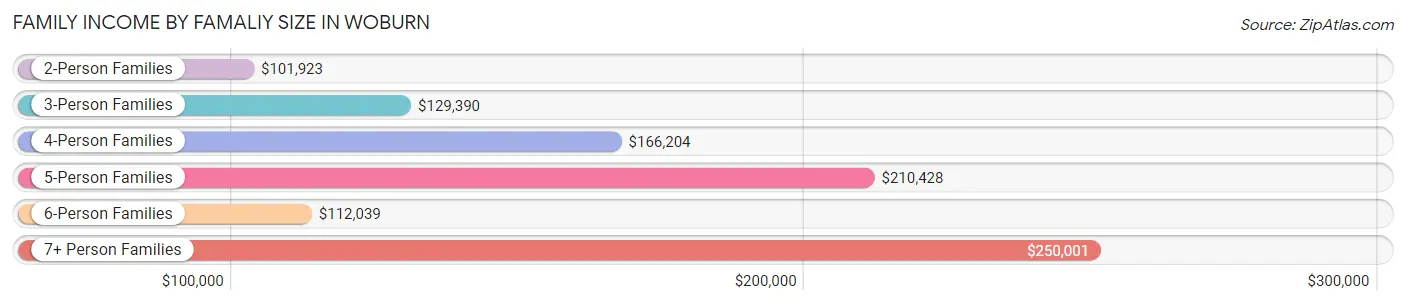
| Income Bracket | # Families | Median Income |
| 2-Person Families | 4,168 (39.9%) | $101,923 |
| 3-Person Families | 2,862 (27.4%) | $129,390 |
| 4-Person Families | 2,312 (22.1%) | $166,204 |
| 5-Person Families | 880 (8.4%) | $210,428 |
| 6-Person Families | 172 (1.6%) | $112,039 |
| 7+ Person Families | 64 (0.6%) | $250,001 |
| Total | 10,458 (100.0%) | $127,328 |
Family Income by Number of Earners in Woburn
The median family income in Woburn is $127,328, with families comprising 3+ earners (1,881) having the highest median family income of $195,417, while families with no earners (842) have the lowest median family income of $50,523, accounting for 18.0% and 8.1% of families, respectively.
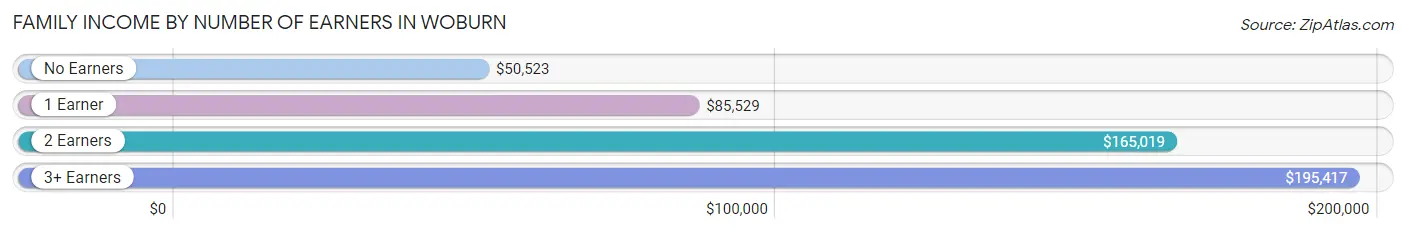
| Number of Earners | # Families | Median Income |
| No Earners | 842 (8.1%) | $50,523 |
| 1 Earner | 2,617 (25.0%) | $85,529 |
| 2 Earners | 5,118 (48.9%) | $165,019 |
| 3+ Earners | 1,881 (18.0%) | $195,417 |
| Total | 10,458 (100.0%) | $127,328 |
Household Income in Woburn
Household Income Brackets in Woburn
With 3,466 households falling in the category, the $200,000+ income range is the most frequent in Woburn, accounting for 21.5% of all households. In contrast, only 387 households (2.4%) fall into the less than $10,000 income bracket, making it the least populous group.
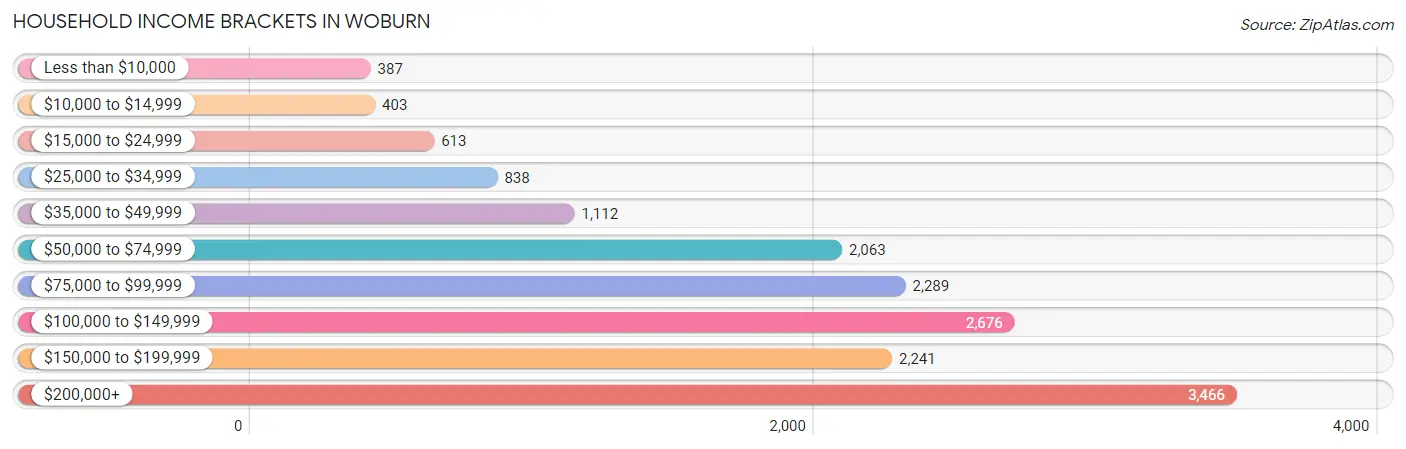
| Income Bracket | # Households | % Households |
| Less than $10,000 | 387 | 2.4% |
| $10,000 to $14,999 | 403 | 2.5% |
| $15,000 to $24,999 | 613 | 3.8% |
| $25,000 to $34,999 | 838 | 5.2% |
| $35,000 to $49,999 | 1,112 | 6.9% |
| $50,000 to $74,999 | 2,063 | 12.8% |
| $75,000 to $99,999 | 2,289 | 14.2% |
| $100,000 to $149,999 | 2,676 | 16.6% |
| $150,000 to $199,999 | 2,241 | 13.9% |
| $200,000+ | 3,466 | 21.5% |
Household Income by Householder Age in Woburn
The median household income in Woburn is $104,780, with the highest median household income of $129,271 found in the 25 to 44 years age bracket for the primary householder. A total of 5,202 households (32.3%) fall into this category. Meanwhile, the 15 to 24 years age bracket for the primary householder has the lowest median household income of $57,917, with 430 households (2.7%) in this group.
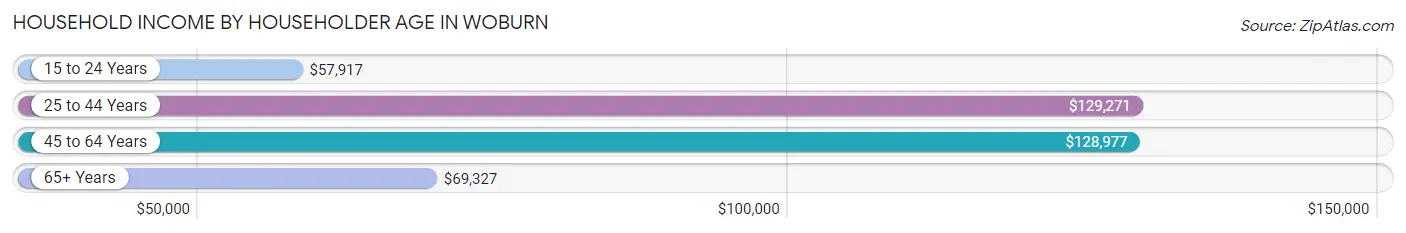
| Income Bracket | # Households | Median Income |
| 15 to 24 Years | 430 (2.7%) | $57,917 |
| 25 to 44 Years | 5,202 (32.3%) | $129,271 |
| 45 to 64 Years | 6,304 (39.1%) | $128,977 |
| 65+ Years | 4,185 (26.0%) | $69,327 |
| Total | 16,121 (100.0%) | $104,780 |
Poverty in Woburn
Income Below Poverty by Sex and Age in Woburn
With 5.7% poverty level for males and 7.3% for females among the residents of Woburn, 15 year old males and 5 year old females are the most vulnerable to poverty, with 36 males (17.4%) and 48 females (28.6%) in their respective age groups living below the poverty level.
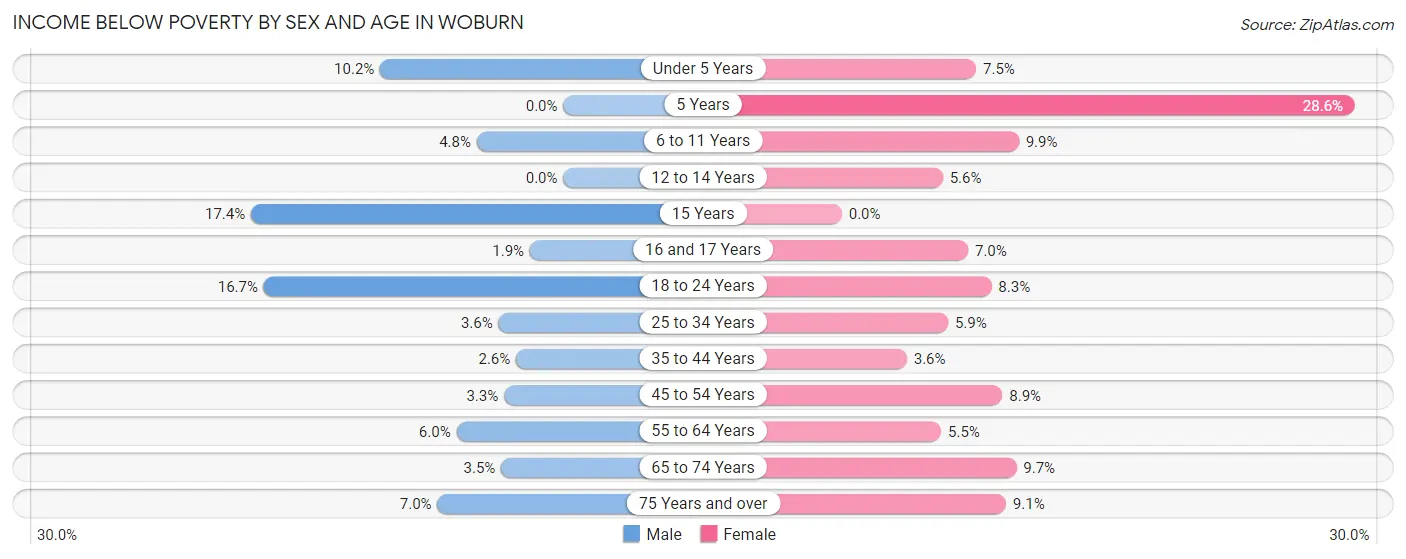
| Age Bracket | Male | Female |
| Under 5 Years | 130 (10.2%) | 80 (7.5%) |
| 5 Years | 0 (0.0%) | 48 (28.6%) |
| 6 to 11 Years | 56 (4.8%) | 115 (9.9%) |
| 12 to 14 Years | 0 (0.0%) | 27 (5.6%) |
| 15 Years | 36 (17.4%) | 0 (0.0%) |
| 16 and 17 Years | 8 (1.9%) | 32 (7.0%) |
| 18 to 24 Years | 343 (16.7%) | 190 (8.3%) |
| 25 to 34 Years | 134 (3.6%) | 170 (5.9%) |
| 35 to 44 Years | 66 (2.6%) | 92 (3.6%) |
| 45 to 54 Years | 86 (3.3%) | 256 (8.9%) |
| 55 to 64 Years | 162 (5.9%) | 162 (5.5%) |
| 65 to 74 Years | 60 (3.5%) | 191 (9.7%) |
| 75 Years and over | 59 (7.0%) | 162 (9.1%) |
| Total | 1,140 (5.7%) | 1,525 (7.3%) |
Income Above Poverty by Sex and Age in Woburn
According to the poverty statistics in Woburn, males aged 5 years and females aged 15 years are the age groups that are most secure financially, with 100.0% of males and 100.0% of females in these age groups living above the poverty line.
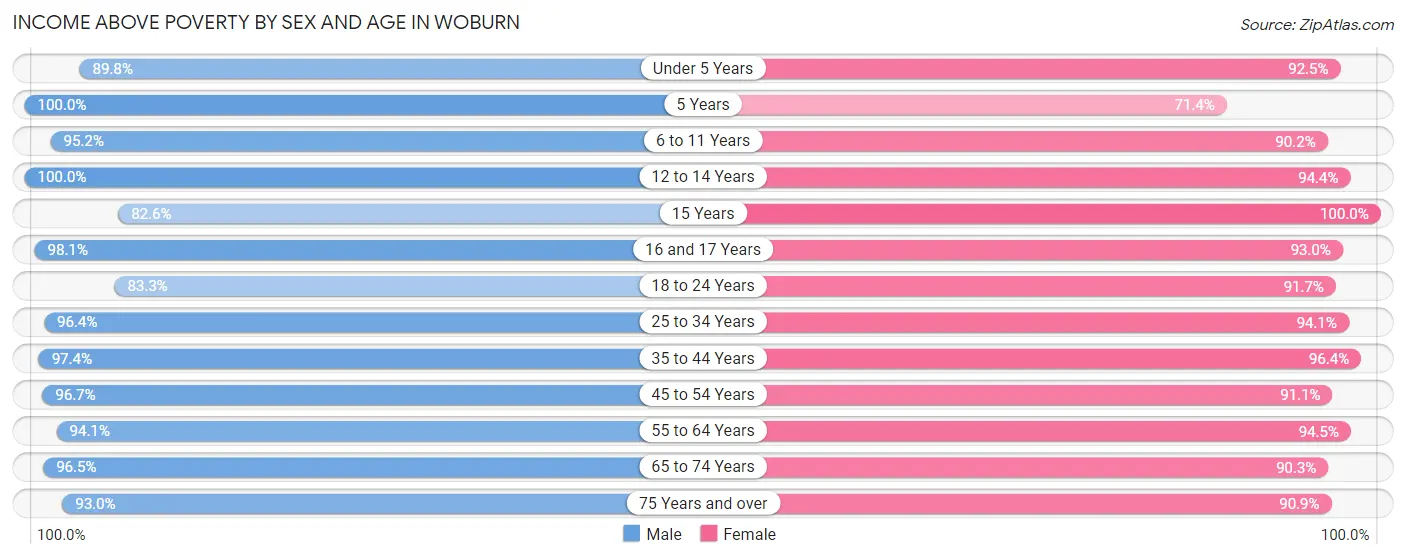
| Age Bracket | Male | Female |
| Under 5 Years | 1,145 (89.8%) | 989 (92.5%) |
| 5 Years | 149 (100.0%) | 120 (71.4%) |
| 6 to 11 Years | 1,106 (95.2%) | 1,053 (90.1%) |
| 12 to 14 Years | 516 (100.0%) | 453 (94.4%) |
| 15 Years | 171 (82.6%) | 258 (100.0%) |
| 16 and 17 Years | 423 (98.1%) | 423 (93.0%) |
| 18 to 24 Years | 1,713 (83.3%) | 2,091 (91.7%) |
| 25 to 34 Years | 3,582 (96.4%) | 2,708 (94.1%) |
| 35 to 44 Years | 2,445 (97.4%) | 2,447 (96.4%) |
| 45 to 54 Years | 2,517 (96.7%) | 2,607 (91.1%) |
| 55 to 64 Years | 2,560 (94.1%) | 2,770 (94.5%) |
| 65 to 74 Years | 1,672 (96.5%) | 1,775 (90.3%) |
| 75 Years and over | 783 (93.0%) | 1,611 (90.9%) |
| Total | 18,782 (94.3%) | 19,305 (92.7%) |
Income Below Poverty Among Married-Couple Families in Woburn
The poverty statistics for married-couple families in Woburn show that 2.4% or 193 of the total 7,902 families live below the poverty line. Families with 1 or 2 children have the highest poverty rate of 2.6%, comprising of 81 families. On the other hand, families with 3 or 4 children have the lowest poverty rate of 0.0%, which includes 0 families.
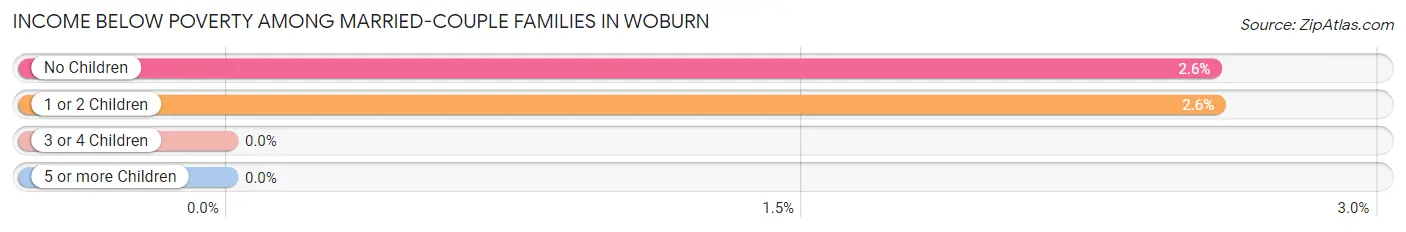
| Children | Above Poverty | Below Poverty |
| No Children | 4,247 (97.4%) | 112 (2.6%) |
| 1 or 2 Children | 3,054 (97.4%) | 81 (2.6%) |
| 3 or 4 Children | 408 (100.0%) | 0 (0.0%) |
| 5 or more Children | 0 (0.0%) | 0 (0.0%) |
| Total | 7,709 (97.6%) | 193 (2.4%) |
Income Below Poverty Among Single-Parent Households in Woburn
According to the poverty data in Woburn, 2.3% or 16 single-father households and 9.3% or 172 single-mother households are living below the poverty line. Among single-father households, those with no children have the highest poverty rate, with 16 households (3.9%) experiencing poverty. Likewise, among single-mother households, those with 5 or more children have the highest poverty rate, with 11 households (100.0%) falling below the poverty line.
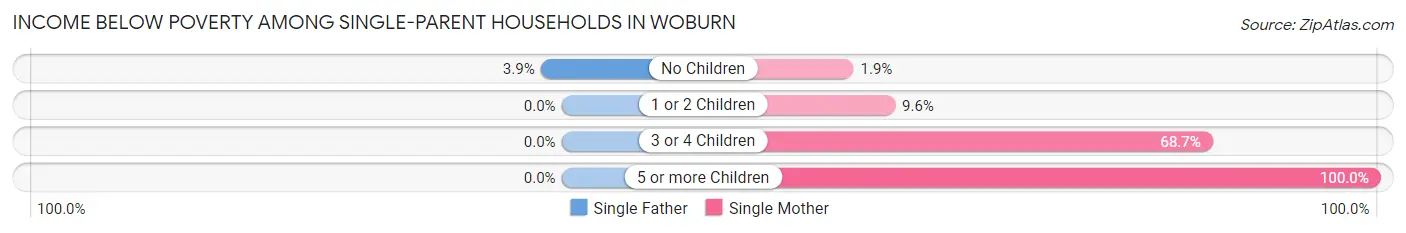
| Children | Single Father | Single Mother |
| No Children | 16 (3.9%) | 20 (1.8%) |
| 1 or 2 Children | 0 (0.0%) | 62 (9.6%) |
| 3 or 4 Children | 0 (0.0%) | 79 (68.7%) |
| 5 or more Children | 0 (0.0%) | 11 (100.0%) |
| Total | 16 (2.3%) | 172 (9.3%) |
Income Below Poverty Among Married-Couple vs Single-Parent Households in Woburn
The poverty data for Woburn shows that 193 of the married-couple family households (2.4%) and 188 of the single-parent households (7.4%) are living below the poverty level. Within the married-couple family households, those with 1 or 2 children have the highest poverty rate, with 81 households (2.6%) falling below the poverty line. Among the single-parent households, those with 5 or more children have the highest poverty rate, with 11 household (100.0%) living below poverty.
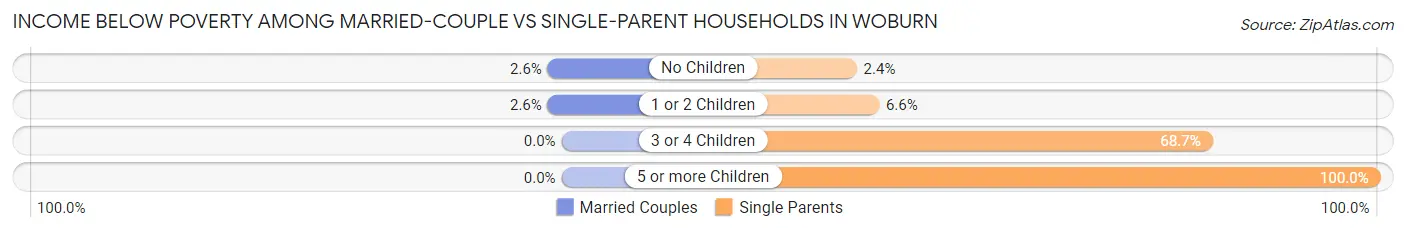
| Children | Married-Couple Families | Single-Parent Households |
| No Children | 112 (2.6%) | 36 (2.4%) |
| 1 or 2 Children | 81 (2.6%) | 62 (6.6%) |
| 3 or 4 Children | 0 (0.0%) | 79 (68.7%) |
| 5 or more Children | 0 (0.0%) | 11 (100.0%) |
| Total | 193 (2.4%) | 188 (7.4%) |
Race in Woburn
The most populous races in Woburn are White / Caucasian (31,205 | 76.1%), Asian (3,929 | 9.6%), and Hispanic or Latino (2,486 | 6.1%).
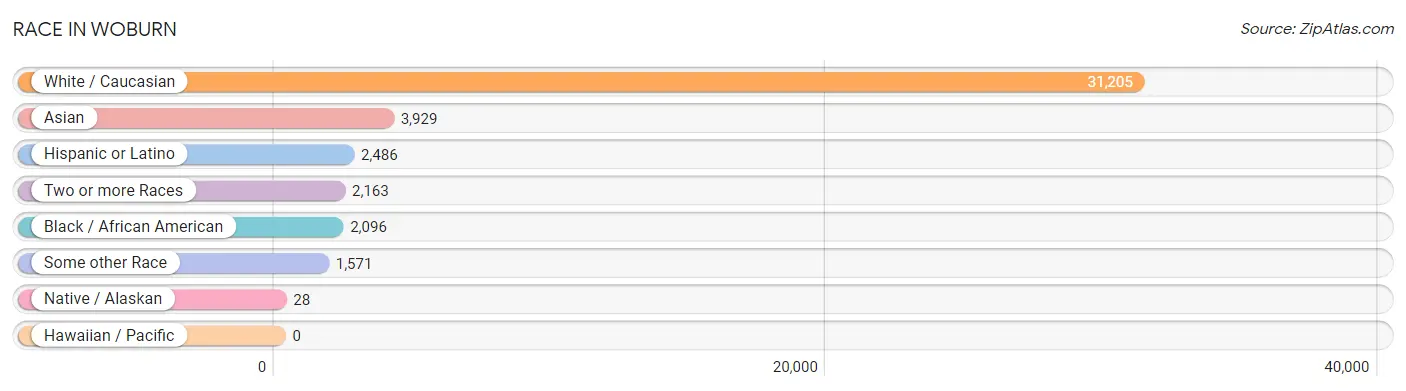
| Race | # Population | % Population |
| Asian | 3,929 | 9.6% |
| Black / African American | 2,096 | 5.1% |
| Hawaiian / Pacific | 0 | 0.0% |
| Hispanic or Latino | 2,486 | 6.1% |
| Native / Alaskan | 28 | 0.1% |
| White / Caucasian | 31,205 | 76.1% |
| Two or more Races | 2,163 | 5.3% |
| Some other Race | 1,571 | 3.8% |
| Total | 40,992 | 100.0% |
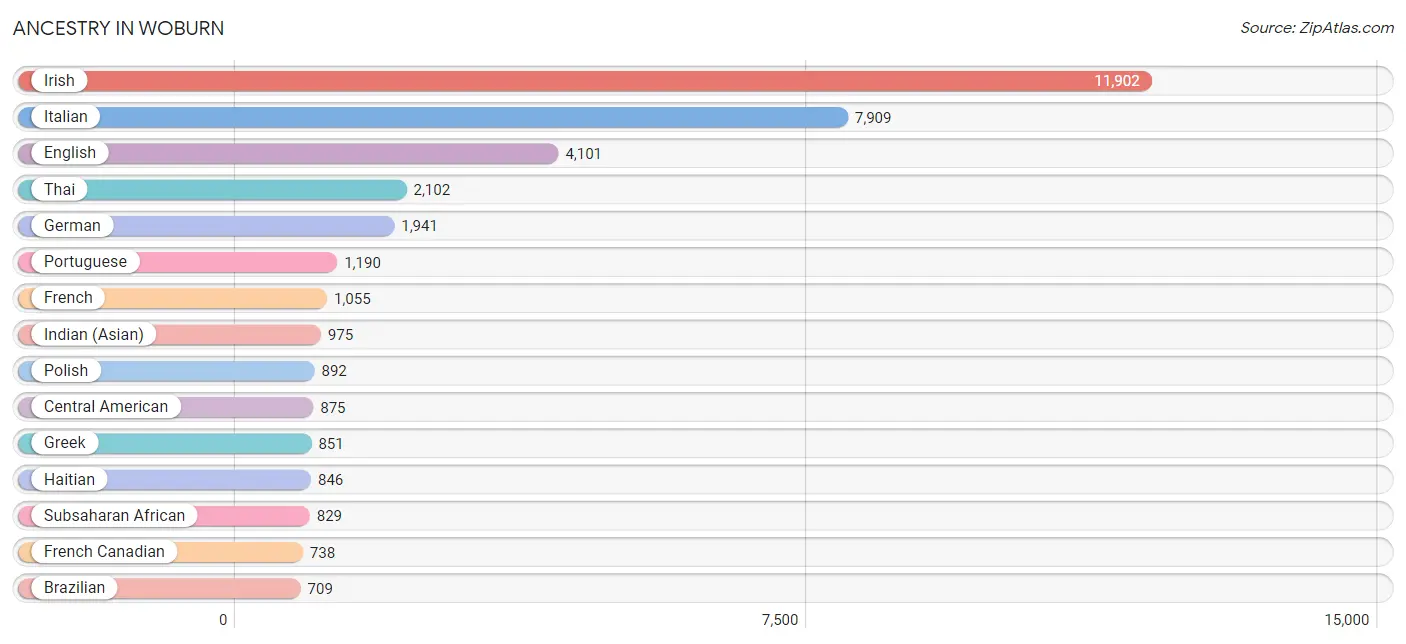
Ancestry in Woburn
The most populous ancestries reported in Woburn are Irish (11,902 | 29.0%), Italian (7,909 | 19.3%), English (4,101 | 10.0%), Thai (2,102 | 5.1%), and German (1,941 | 4.7%), together accounting for 68.2% of all Woburn residents.
| Ancestry | # Population | % Population |
| Afghan | 6 | 0.0% |
| African | 93 | 0.2% |
| Albanian | 178 | 0.4% |
| American | 698 | 1.7% |
| Arab | 389 | 0.9% |
| Argentinean | 19 | 0.1% |
| Armenian | 210 | 0.5% |
| Austrian | 42 | 0.1% |
| Barbadian | 46 | 0.1% |
| Belgian | 125 | 0.3% |
| Bhutanese | 138 | 0.3% |
| Blackfeet | 9 | 0.0% |
| Brazilian | 709 | 1.7% |
| British | 164 | 0.4% |
| British West Indian | 24 | 0.1% |
| Bulgarian | 135 | 0.3% |
| Burmese | 69 | 0.2% |
| Canadian | 261 | 0.6% |
| Central American | 875 | 2.1% |
| Central American Indian | 78 | 0.2% |
| Cherokee | 9 | 0.0% |
| Colombian | 230 | 0.6% |
| Croatian | 2 | 0.0% |
| Cuban | 162 | 0.4% |
| Czech | 16 | 0.0% |
| Czechoslovakian | 76 | 0.2% |
| Danish | 426 | 1.0% |
| Dominican | 154 | 0.4% |
| Dutch | 89 | 0.2% |
| Eastern European | 123 | 0.3% |
| Ecuadorian | 21 | 0.1% |
| Egyptian | 50 | 0.1% |
| English | 4,101 | 10.0% |
| European | 206 | 0.5% |
| Filipino | 21 | 0.1% |
| Finnish | 69 | 0.2% |
| French | 1,055 | 2.6% |
| French Canadian | 738 | 1.8% |
| German | 1,941 | 4.7% |
| Greek | 851 | 2.1% |
| Guatemalan | 144 | 0.4% |
| Haitian | 846 | 2.1% |
| Honduran | 421 | 1.0% |
| Hungarian | 196 | 0.5% |
| Indian (Asian) | 975 | 2.4% |
| Iranian | 22 | 0.1% |
| Irish | 11,902 | 29.0% |
| Italian | 7,909 | 19.3% |
| Jamaican | 104 | 0.3% |
| Japanese | 1 | 0.0% |
| Jordanian | 55 | 0.1% |
| Kenyan | 272 | 0.7% |
| Korean | 20 | 0.1% |
| Laotian | 434 | 1.1% |
| Lebanese | 68 | 0.2% |
| Lithuanian | 214 | 0.5% |
| Mexican | 292 | 0.7% |
| Moroccan | 16 | 0.0% |
| New Zealander | 16 | 0.0% |
| Nigerian | 37 | 0.1% |
| Northern European | 91 | 0.2% |
| Norwegian | 79 | 0.2% |
| Okinawan | 10 | 0.0% |
| Pakistani | 37 | 0.1% |
| Palestinian | 120 | 0.3% |
| Polish | 892 | 2.2% |
| Portuguese | 1,190 | 2.9% |
| Puerto Rican | 557 | 1.4% |
| Romanian | 40 | 0.1% |
| Russian | 263 | 0.6% |
| Salvadoran | 310 | 0.8% |
| Scandinavian | 83 | 0.2% |
| Scotch-Irish | 249 | 0.6% |
| Scottish | 555 | 1.3% |
| Sioux | 115 | 0.3% |
| South American | 341 | 0.8% |
| South American Indian | 73 | 0.2% |
| Spaniard | 15 | 0.0% |
| Spanish | 6 | 0.0% |
| Sri Lankan | 365 | 0.9% |
| Subsaharan African | 829 | 2.0% |
| Sudanese | 58 | 0.1% |
| Swedish | 590 | 1.4% |
| Swiss | 73 | 0.2% |
| Syrian | 26 | 0.1% |
| Thai | 2,102 | 5.1% |
| Trinidadian and Tobagonian | 24 | 0.1% |
| Turkish | 30 | 0.1% |
| Ugandan | 323 | 0.8% |
| Ukrainian | 52 | 0.1% |
| Uruguayan | 7 | 0.0% |
| Venezuelan | 64 | 0.2% |
| Vietnamese | 75 | 0.2% |
| Welsh | 35 | 0.1% |
| Yugoslavian | 14 | 0.0% | View All 95 Rows |
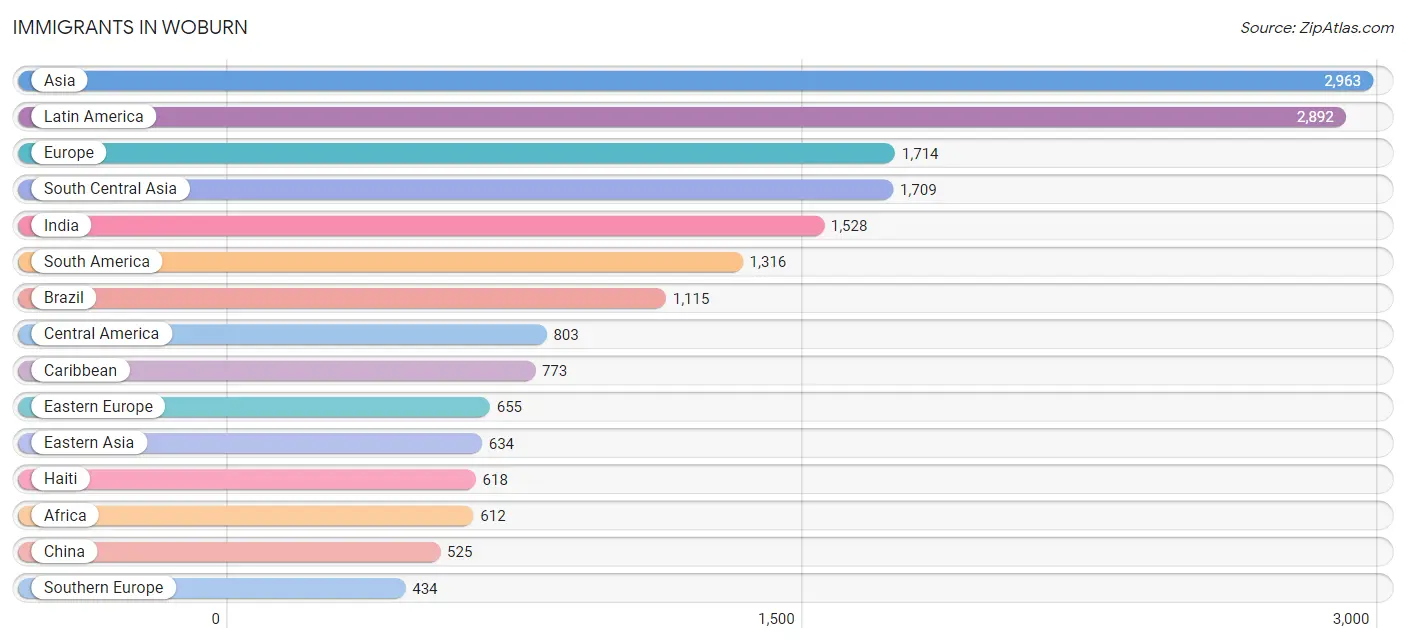
Immigrants in Woburn
The most numerous immigrant groups reported in Woburn came from Asia (2,963 | 7.2%), Latin America (2,892 | 7.1%), Europe (1,714 | 4.2%), South Central Asia (1,709 | 4.2%), and India (1,528 | 3.7%), together accounting for 26.4% of all Woburn residents.
| Immigration Origin | # Population | % Population |
| Afghanistan | 6 | 0.0% |
| Africa | 612 | 1.5% |
| Albania | 168 | 0.4% |
| Asia | 2,963 | 7.2% |
| Bahamas | 10 | 0.0% |
| Bangladesh | 15 | 0.0% |
| Barbados | 46 | 0.1% |
| Belarus | 29 | 0.1% |
| Belgium | 20 | 0.1% |
| Brazil | 1,115 | 2.7% |
| Bulgaria | 153 | 0.4% |
| Cambodia | 1 | 0.0% |
| Canada | 70 | 0.2% |
| Caribbean | 773 | 1.9% |
| Central America | 803 | 2.0% |
| China | 525 | 1.3% |
| Colombia | 131 | 0.3% |
| Denmark | 152 | 0.4% |
| Dominican Republic | 95 | 0.2% |
| Eastern Africa | 408 | 1.0% |
| Eastern Asia | 634 | 1.5% |
| Eastern Europe | 655 | 1.6% |
| Ecuador | 8 | 0.0% |
| El Salvador | 222 | 0.5% |
| England | 55 | 0.1% |
| Europe | 1,714 | 4.2% |
| France | 104 | 0.3% |
| Germany | 121 | 0.3% |
| Greece | 72 | 0.2% |
| Guatemala | 136 | 0.3% |
| Haiti | 618 | 1.5% |
| Honduras | 354 | 0.9% |
| Hungary | 72 | 0.2% |
| India | 1,528 | 3.7% |
| Indonesia | 74 | 0.2% |
| Iran | 11 | 0.0% |
| Iraq | 16 | 0.0% |
| Ireland | 90 | 0.2% |
| Italy | 134 | 0.3% |
| Jamaica | 4 | 0.0% |
| Japan | 30 | 0.1% |
| Jordan | 87 | 0.2% |
| Kenya | 130 | 0.3% |
| Korea | 79 | 0.2% |
| Latin America | 2,892 | 7.1% |
| Lebanon | 22 | 0.1% |
| Mexico | 91 | 0.2% |
| Moldova | 118 | 0.3% |
| Morocco | 44 | 0.1% |
| Nepal | 91 | 0.2% |
| Nigeria | 27 | 0.1% |
| Northern Africa | 134 | 0.3% |
| Northern Europe | 380 | 0.9% |
| Oceania | 16 | 0.0% |
| Pakistan | 53 | 0.1% |
| Philippines | 40 | 0.1% |
| Poland | 6 | 0.0% |
| Portugal | 228 | 0.6% |
| Romania | 18 | 0.0% |
| Saudi Arabia | 60 | 0.2% |
| Scotland | 27 | 0.1% |
| Singapore | 13 | 0.0% |
| South America | 1,316 | 3.2% |
| South Central Asia | 1,709 | 4.2% |
| South Eastern Asia | 301 | 0.7% |
| Southern Europe | 434 | 1.1% |
| Sudan | 58 | 0.1% |
| Syria | 90 | 0.2% |
| Taiwan | 32 | 0.1% |
| Uganda | 278 | 0.7% |
| Ukraine | 36 | 0.1% |
| Uruguay | 7 | 0.0% |
| Venezuela | 55 | 0.1% |
| Vietnam | 173 | 0.4% |
| Western Africa | 70 | 0.2% |
| Western Asia | 275 | 0.7% |
| Western Europe | 245 | 0.6% | View All 77 Rows |
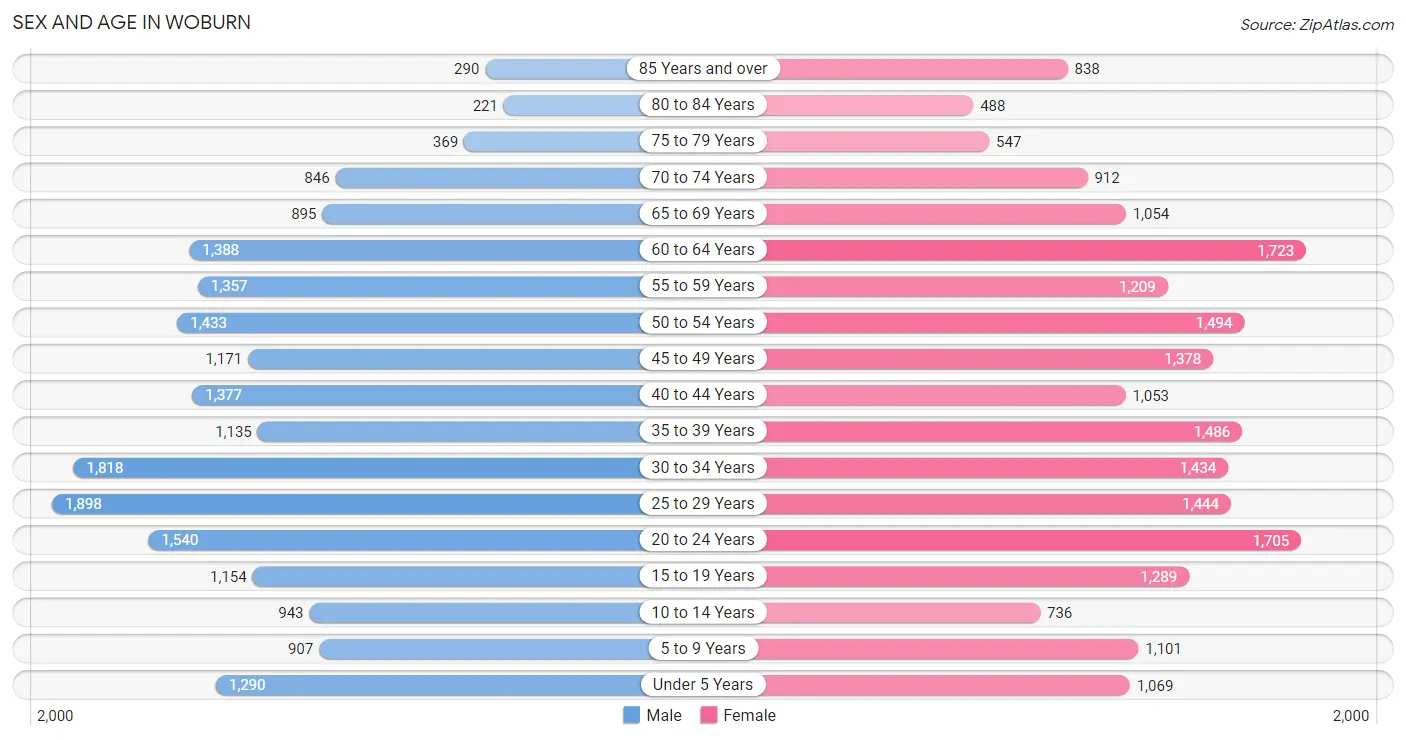
Sex and Age in Woburn
Sex and Age in Woburn
The most populous age groups in Woburn are 25 to 29 Years (1,898 | 9.5%) for men and 60 to 64 Years (1,723 | 8.2%) for women.
| Age Bracket | Male | Female |
| Under 5 Years | 1,290 (6.4%) | 1,069 (5.1%) |
| 5 to 9 Years | 907 (4.5%) | 1,101 (5.2%) |
| 10 to 14 Years | 943 (4.7%) | 736 (3.5%) |
| 15 to 19 Years | 1,154 (5.8%) | 1,289 (6.1%) |
| 20 to 24 Years | 1,540 (7.7%) | 1,705 (8.1%) |
| 25 to 29 Years | 1,898 (9.5%) | 1,444 (6.9%) |
| 30 to 34 Years | 1,818 (9.1%) | 1,434 (6.8%) |
| 35 to 39 Years | 1,135 (5.7%) | 1,486 (7.1%) |
| 40 to 44 Years | 1,377 (6.9%) | 1,053 (5.0%) |
| 45 to 49 Years | 1,171 (5.9%) | 1,378 (6.6%) |
| 50 to 54 Years | 1,433 (7.1%) | 1,494 (7.1%) |
| 55 to 59 Years | 1,357 (6.8%) | 1,209 (5.8%) |
| 60 to 64 Years | 1,388 (6.9%) | 1,723 (8.2%) |
| 65 to 69 Years | 895 (4.5%) | 1,054 (5.0%) |
| 70 to 74 Years | 846 (4.2%) | 912 (4.3%) |
| 75 to 79 Years | 369 (1.8%) | 547 (2.6%) |
| 80 to 84 Years | 221 (1.1%) | 488 (2.3%) |
| 85 Years and over | 290 (1.5%) | 838 (4.0%) |
| Total | 20,032 (100.0%) | 20,960 (100.0%) |
Families and Households in Woburn
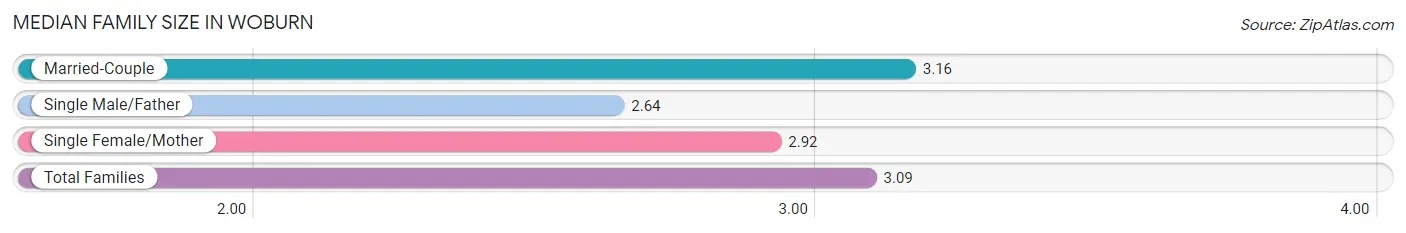
Median Family Size in Woburn
The median family size in Woburn is 3.09 persons per family, with married-couple families (7,902 | 75.6%) accounting for the largest median family size of 3.16 persons per family. On the other hand, single male/father families (704 | 6.7%) represent the smallest median family size with 2.64 persons per family.
| Family Type | # Families | Family Size |
| Married-Couple | 7,902 (75.6%) | 3.16 |
| Single Male/Father | 704 (6.7%) | 2.64 |
| Single Female/Mother | 1,852 (17.7%) | 2.92 |
| Total Families | 10,458 (100.0%) | 3.09 |
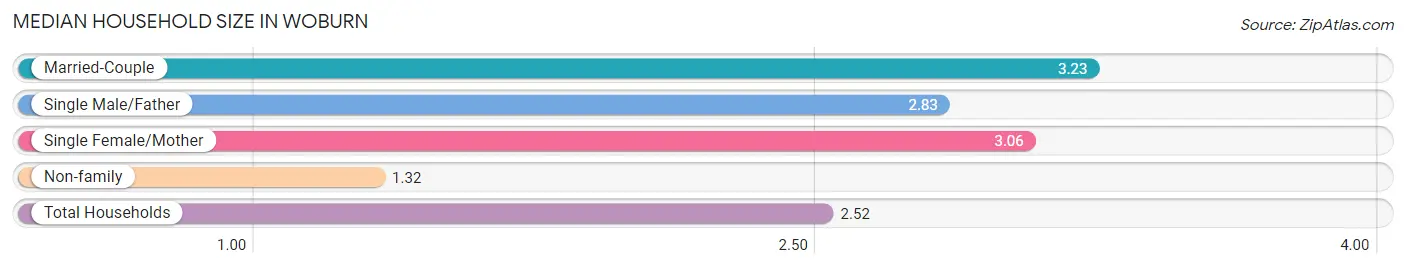
Median Household Size in Woburn
The median household size in Woburn is 2.52 persons per household, with married-couple households (7,902 | 49.0%) accounting for the largest median household size of 3.23 persons per household. non-family households (5,663 | 35.1%) represent the smallest median household size with 1.32 persons per household.
| Household Type | # Households | Household Size |
| Married-Couple | 7,902 (49.0%) | 3.23 |
| Single Male/Father | 704 (4.4%) | 2.83 |
| Single Female/Mother | 1,852 (11.5%) | 3.06 |
| Non-family | 5,663 (35.1%) | 1.32 |
| Total Households | 16,121 (100.0%) | 2.52 |
Household Size by Marriage Status in Woburn
Out of a total of 16,121 households in Woburn, 10,458 (64.9%) are family households, while 5,663 (35.1%) are nonfamily households. The most numerous type of family households are 2-person households, comprising 3,929, and the most common type of nonfamily households are 1-person households, comprising 4,215.
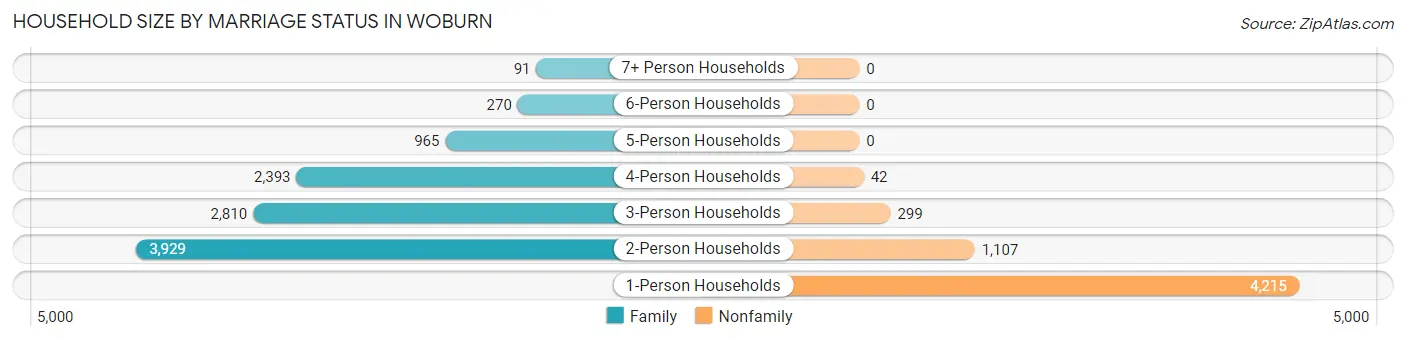
| Household Size | Family Households | Nonfamily Households |
| 1-Person Households | - | 4,215 (26.2%) |
| 2-Person Households | 3,929 (24.4%) | 1,107 (6.9%) |
| 3-Person Households | 2,810 (17.4%) | 299 (1.8%) |
| 4-Person Households | 2,393 (14.8%) | 42 (0.3%) |
| 5-Person Households | 965 (6.0%) | 0 (0.0%) |
| 6-Person Households | 270 (1.7%) | 0 (0.0%) |
| 7+ Person Households | 91 (0.6%) | 0 (0.0%) |
| Total | 10,458 (64.9%) | 5,663 (35.1%) |
Female Fertility in Woburn
Fertility by Age in Woburn
Average fertility rate in Woburn is 53.0 births per 1,000 women. Women in the age bracket of 20 to 34 years have the highest fertility rate with 63.0 births per 1,000 women. Women in the age bracket of 20 to 34 years acount for 54.8% of all women with births.
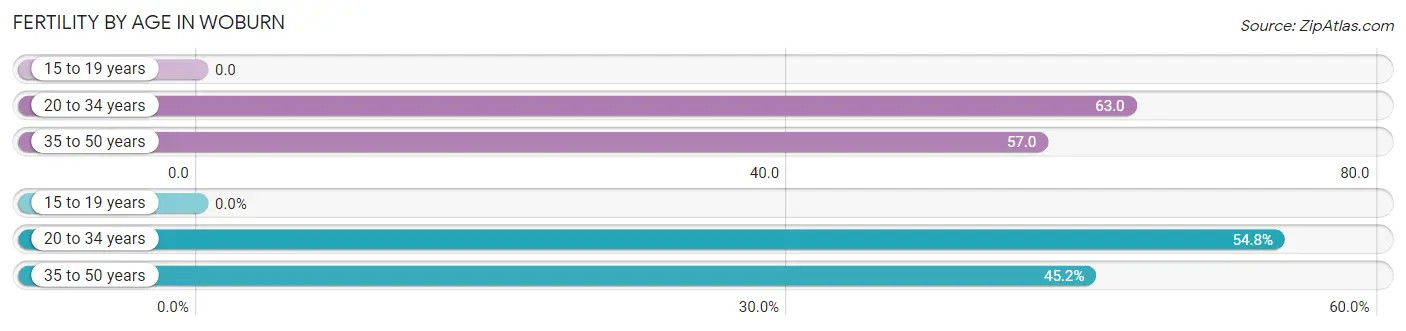
| Age Bracket | Women with Births | Births / 1,000 Women |
| 15 to 19 years | 0 (0.0%) | 0.0 |
| 20 to 34 years | 291 (54.8%) | 63.0 |
| 35 to 50 years | 240 (45.2%) | 57.0 |
| Total | 531 (100.0%) | 53.0 |
Fertility by Age by Marriage Status in Woburn
93.0% of women with births (531) in Woburn are married. The highest percentage of unmarried women with births falls into 20 to 34 years age bracket with 8.9% of them unmarried at the time of birth, while the lowest percentage of unmarried women with births belong to 35 to 50 years age bracket with 4.6% of them unmarried.
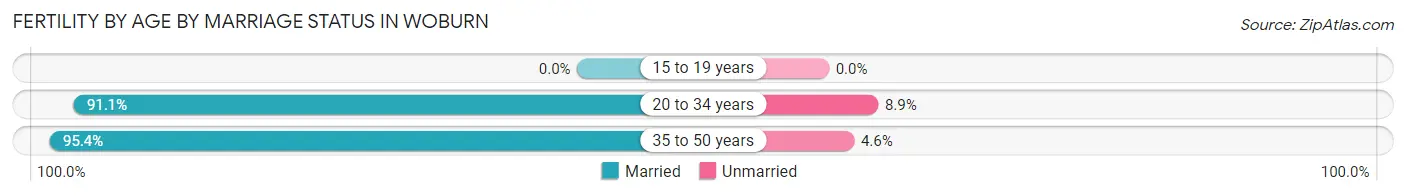
| Age Bracket | Married | Unmarried |
| 15 to 19 years | 0 (0.0%) | 0 (0.0%) |
| 20 to 34 years | 265 (91.1%) | 26 (8.9%) |
| 35 to 50 years | 229 (95.4%) | 11 (4.6%) |
| Total | 494 (93.0%) | 37 (7.0%) |
Fertility by Education in Woburn
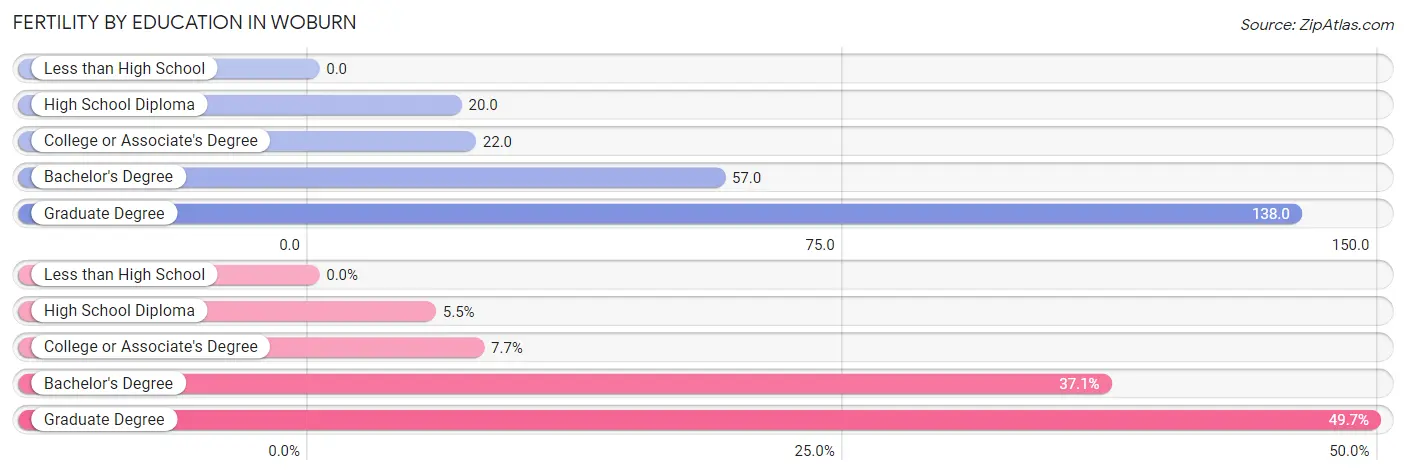
| Educational Attainment | Women with Births | Births / 1,000 Women |
| Less than High School | 0 (0.0%) | 0.0 |
| High School Diploma | 29 (5.5%) | 20.0 |
| College or Associate's Degree | 41 (7.7%) | 22.0 |
| Bachelor's Degree | 197 (37.1%) | 57.0 |
| Graduate Degree | 264 (49.7%) | 138.0 |
| Total | 531 (100.0%) | 53.0 |
Fertility by Education by Marriage Status in Woburn
7.0% of women with births in Woburn are unmarried. Women with the educational attainment of high school diploma are most likely to be married with 100.0% of them married at childbirth, while women with the educational attainment of bachelor's degree are least likely to be married with 18.8% of them unmarried at childbirth.
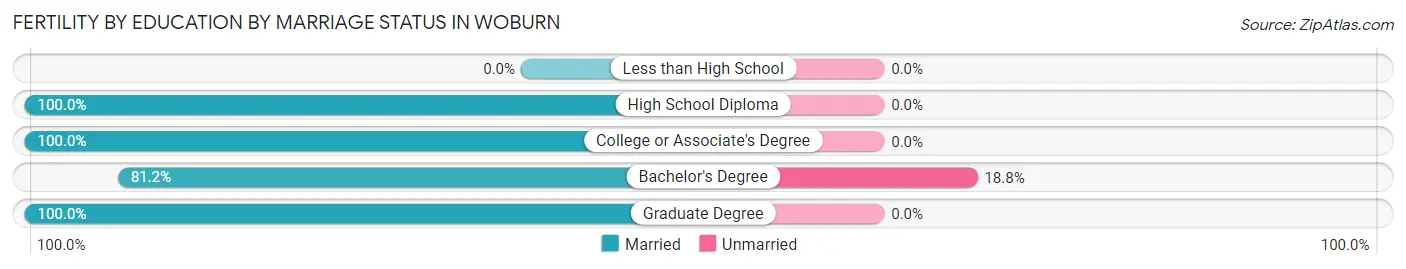
| Educational Attainment | Married | Unmarried |
| Less than High School | 0 (0.0%) | 0 (0.0%) |
| High School Diploma | 29 (100.0%) | 0 (0.0%) |
| College or Associate's Degree | 41 (100.0%) | 0 (0.0%) |
| Bachelor's Degree | 160 (81.2%) | 37 (18.8%) |
| Graduate Degree | 264 (100.0%) | 0 (0.0%) |
| Total | 494 (93.0%) | 37 (7.0%) |
Employment Characteristics in Woburn
Employment by Class of Employer in Woburn
Among the 22,591 employed individuals in Woburn, private company employees (15,602 | 69.1%), not-for-profit organizations (2,512 | 11.1%), and local government employees (1,641 | 7.3%) make up the most common classes of employment.
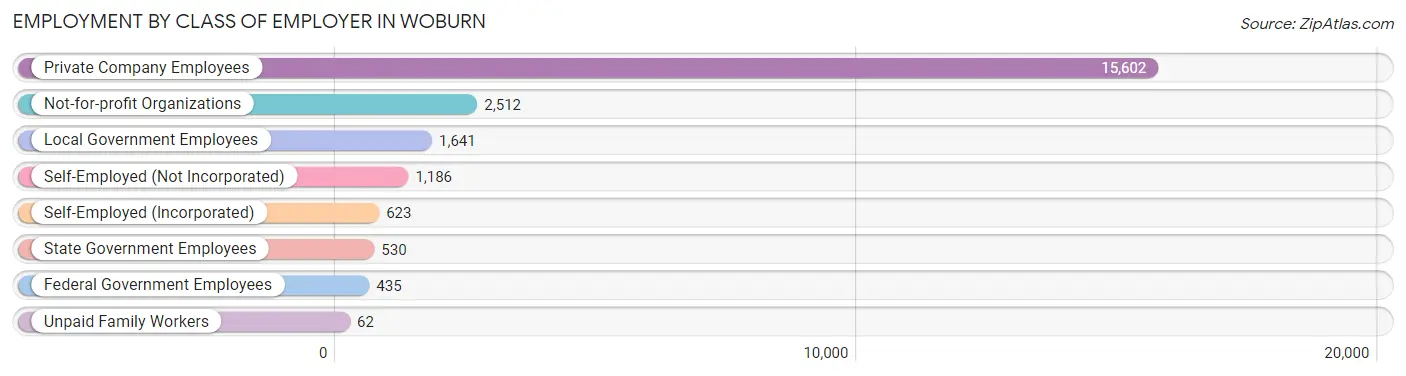
| Employer Class | # Employees | % Employees |
| Private Company Employees | 15,602 | 69.1% |
| Self-Employed (Incorporated) | 623 | 2.8% |
| Self-Employed (Not Incorporated) | 1,186 | 5.2% |
| Not-for-profit Organizations | 2,512 | 11.1% |
| Local Government Employees | 1,641 | 7.3% |
| State Government Employees | 530 | 2.4% |
| Federal Government Employees | 435 | 1.9% |
| Unpaid Family Workers | 62 | 0.3% |
| Total | 22,591 | 100.0% |
Employment Status by Age in Woburn
According to the labor force statistics for Woburn, out of the total population over 16 years of age (34,481), 72.2% or 24,895 individuals are in the labor force, with 7.4% or 1,842 of them unemployed. The age group with the highest labor force participation rate is 25 to 29 years, with 95.5% or 3,192 individuals in the labor force. Within the labor force, the 16 to 19 years age range has the highest percentage of unemployed individuals, with 16.6% or 144 of them being unemployed.
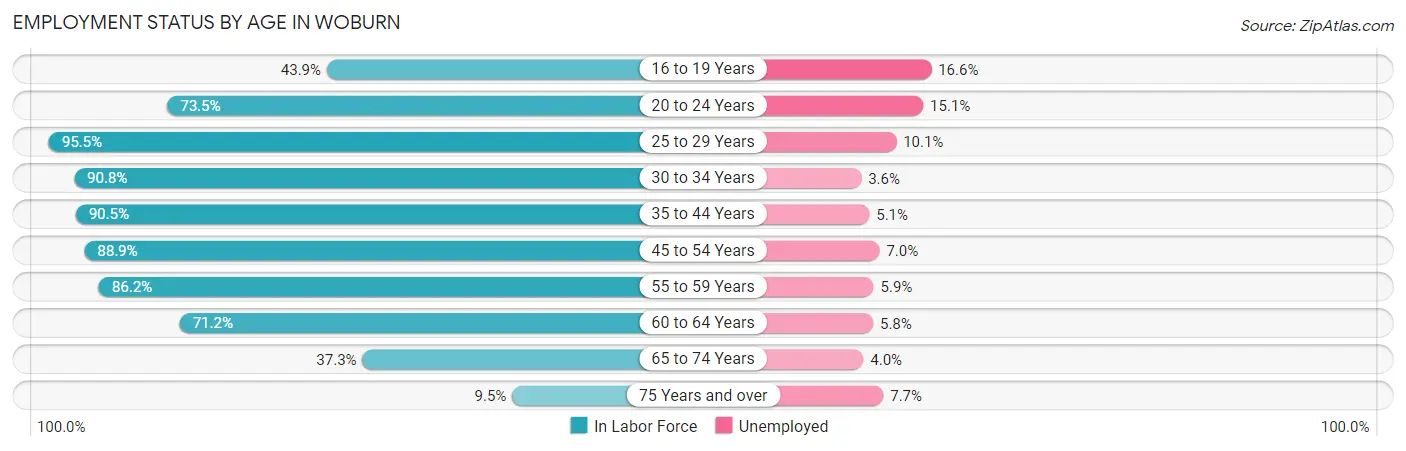
| Age Bracket | In Labor Force | Unemployed |
| 16 to 19 Years | 868 (43.9%) | 144 (16.6%) |
| 20 to 24 Years | 2,385 (73.5%) | 360 (15.1%) |
| 25 to 29 Years | 3,192 (95.5%) | 322 (10.1%) |
| 30 to 34 Years | 2,953 (90.8%) | 106 (3.6%) |
| 35 to 44 Years | 4,571 (90.5%) | 233 (5.1%) |
| 45 to 54 Years | 4,868 (88.9%) | 341 (7.0%) |
| 55 to 59 Years | 2,212 (86.2%) | 131 (5.9%) |
| 60 to 64 Years | 2,215 (71.2%) | 128 (5.8%) |
| 65 to 74 Years | 1,383 (37.3%) | 55 (4.0%) |
| 75 Years and over | 262 (9.5%) | 20 (7.7%) |
| Total | 24,895 (72.2%) | 1,842 (7.4%) |
Employment Status by Educational Attainment in Woburn
According to labor force statistics for Woburn, 87.8% of individuals (20,017) out of the total population between 25 and 64 years of age (22,798) are in the labor force, with 6.3% or 1,261 of them being unemployed. The group with the highest labor force participation rate are those with the educational attainment of bachelor's degree or higher, with 92.4% or 11,019 individuals in the labor force. Within the labor force, individuals with less than high school education have the highest percentage of unemployment, with 22.5% or 196 of them being unemployed.
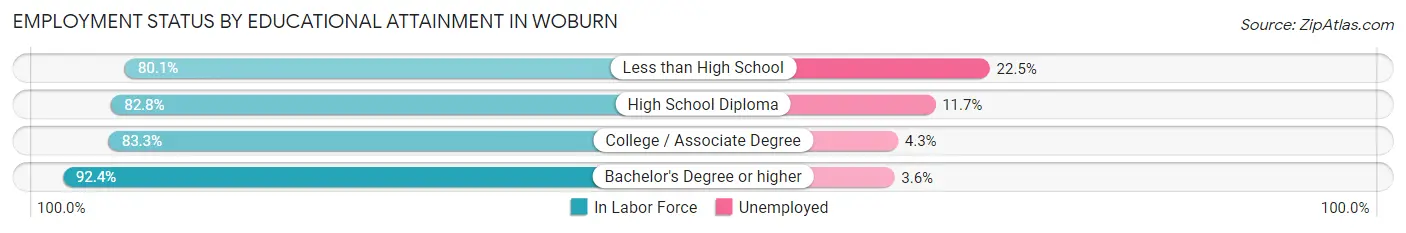
| Educational Attainment | In Labor Force | Unemployed |
| Less than High School | 872 (80.1%) | 245 (22.5%) |
| High School Diploma | 4,348 (82.8%) | 614 (11.7%) |
| College / Associate Degree | 3,776 (83.3%) | 195 (4.3%) |
| Bachelor's Degree or higher | 11,019 (92.4%) | 429 (3.6%) |
| Total | 20,017 (87.8%) | 1,436 (6.3%) |
Employment Occupations by Sex in Woburn
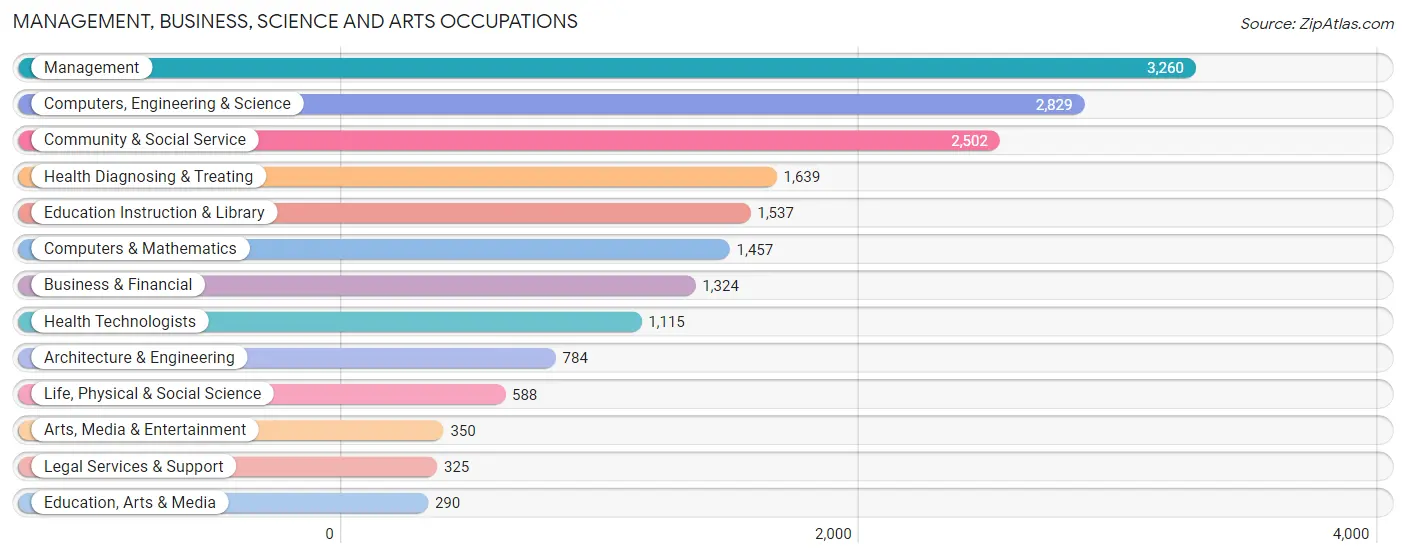
Management, Business, Science and Arts Occupations
The most common Management, Business, Science and Arts occupations in Woburn are Management (3,260 | 14.1%), Computers, Engineering & Science (2,829 | 12.3%), Community & Social Service (2,502 | 10.8%), Health Diagnosing & Treating (1,639 | 7.1%), and Education Instruction & Library (1,537 | 6.7%).
Management, Business, Science and Arts Occupations by Sex
Within the Management, Business, Science and Arts occupations in Woburn, the most male-oriented occupations are Architecture & Engineering (87.1%), Computers & Mathematics (80.1%), and Computers, Engineering & Science (76.3%), while the most female-oriented occupations are Health Technologists (90.9%), Health Diagnosing & Treating (88.0%), and Education Instruction & Library (78.4%).
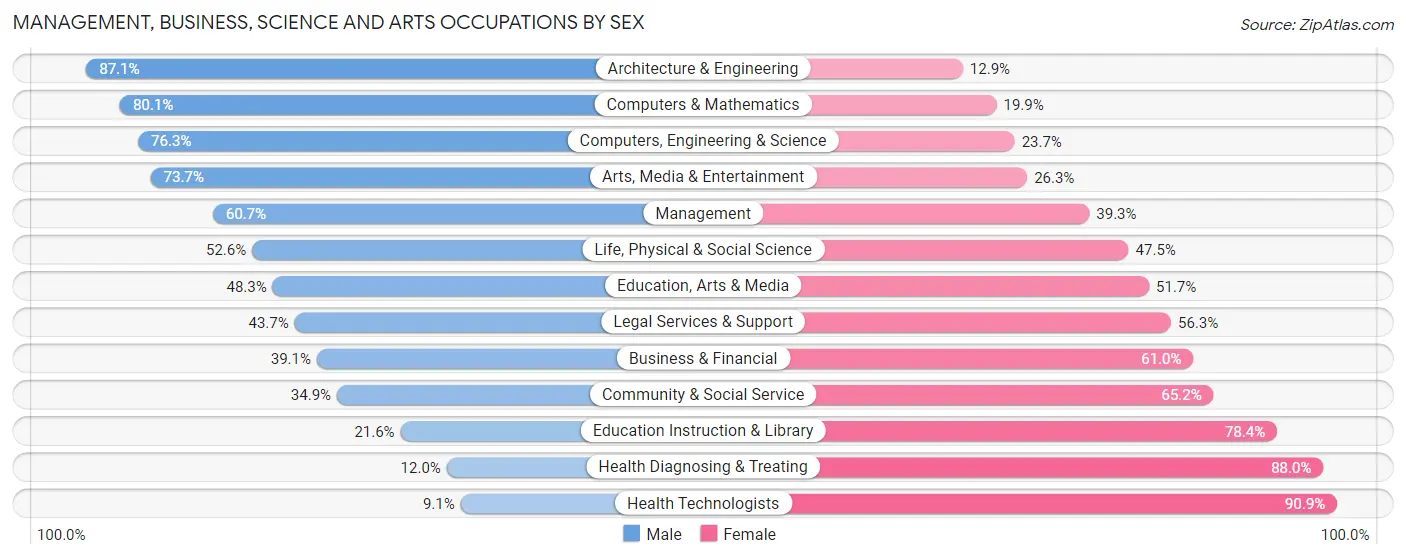
| Occupation | Male | Female |
| Management | 1,980 (60.7%) | 1,280 (39.3%) |
| Business & Financial | 517 (39.1%) | 807 (61.0%) |
| Computers, Engineering & Science | 2,159 (76.3%) | 670 (23.7%) |
| Computers & Mathematics | 1,167 (80.1%) | 290 (19.9%) |
| Architecture & Engineering | 683 (87.1%) | 101 (12.9%) |
| Life, Physical & Social Science | 309 (52.5%) | 279 (47.4%) |
| Community & Social Service | 872 (34.8%) | 1,630 (65.1%) |
| Education, Arts & Media | 140 (48.3%) | 150 (51.7%) |
| Legal Services & Support | 142 (43.7%) | 183 (56.3%) |
| Education Instruction & Library | 332 (21.6%) | 1,205 (78.4%) |
| Arts, Media & Entertainment | 258 (73.7%) | 92 (26.3%) |
| Health Diagnosing & Treating | 196 (12.0%) | 1,443 (88.0%) |
| Health Technologists | 101 (9.1%) | 1,014 (90.9%) |
| Total (Category) | 5,724 (49.5%) | 5,830 (50.5%) |
| Total (Overall) | 11,901 (51.6%) | 11,169 (48.4%) |
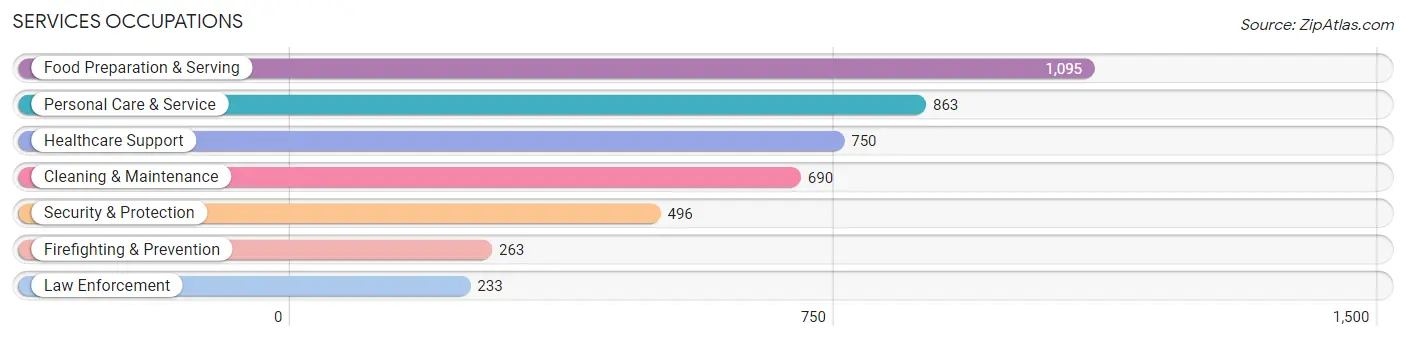
Services Occupations
The most common Services occupations in Woburn are Food Preparation & Serving (1,095 | 4.8%), Personal Care & Service (863 | 3.7%), Healthcare Support (750 | 3.3%), Cleaning & Maintenance (690 | 3.0%), and Security & Protection (496 | 2.1%).
Services Occupations by Sex
Within the Services occupations in Woburn, the most male-oriented occupations are Firefighting & Prevention (75.7%), Security & Protection (75.4%), and Law Enforcement (75.1%), while the most female-oriented occupations are Healthcare Support (90.9%), Personal Care & Service (82.9%), and Food Preparation & Serving (58.5%).
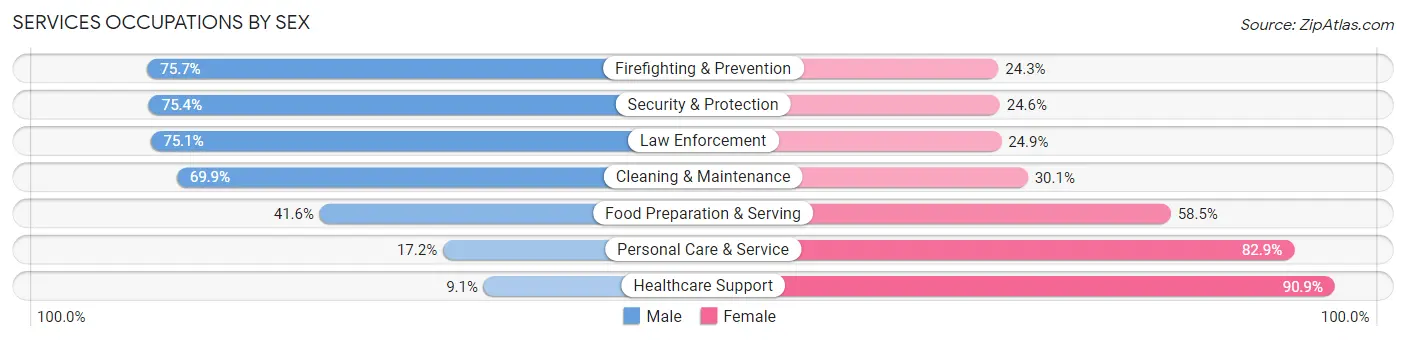
| Occupation | Male | Female |
| Healthcare Support | 68 (9.1%) | 682 (90.9%) |
| Security & Protection | 374 (75.4%) | 122 (24.6%) |
| Firefighting & Prevention | 199 (75.7%) | 64 (24.3%) |
| Law Enforcement | 175 (75.1%) | 58 (24.9%) |
| Food Preparation & Serving | 455 (41.5%) | 640 (58.5%) |
| Cleaning & Maintenance | 482 (69.9%) | 208 (30.1%) |
| Personal Care & Service | 148 (17.2%) | 715 (82.9%) |
| Total (Category) | 1,527 (39.2%) | 2,367 (60.8%) |
| Total (Overall) | 11,901 (51.6%) | 11,169 (48.4%) |
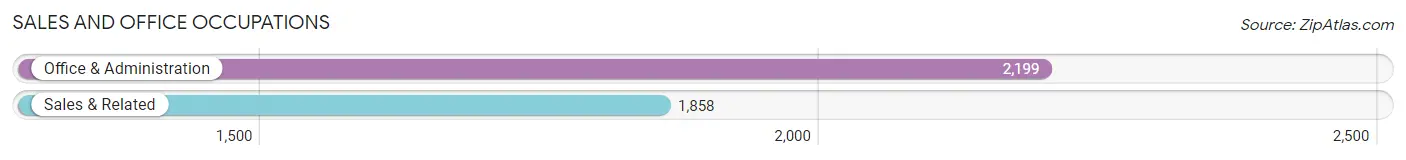
Sales and Office Occupations
The most common Sales and Office occupations in Woburn are Office & Administration (2,199 | 9.5%), and Sales & Related (1,858 | 8.1%).
Sales and Office Occupations by Sex
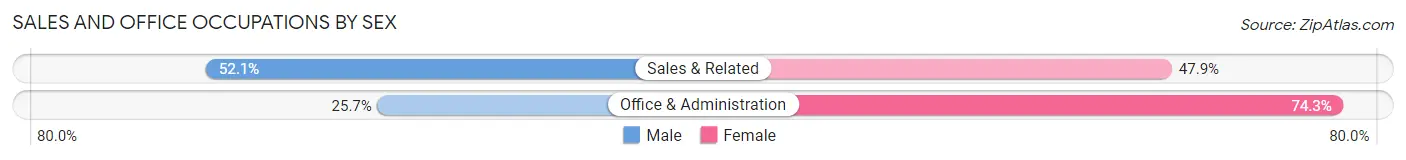
| Occupation | Male | Female |
| Sales & Related | 968 (52.1%) | 890 (47.9%) |
| Office & Administration | 565 (25.7%) | 1,634 (74.3%) |
| Total (Category) | 1,533 (37.8%) | 2,524 (62.2%) |
| Total (Overall) | 11,901 (51.6%) | 11,169 (48.4%) |
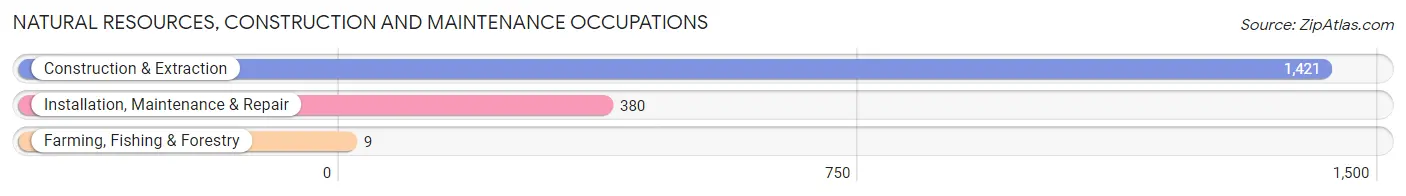
Natural Resources, Construction and Maintenance Occupations
The most common Natural Resources, Construction and Maintenance occupations in Woburn are Construction & Extraction (1,421 | 6.2%), Installation, Maintenance & Repair (380 | 1.7%), and Farming, Fishing & Forestry (9 | 0.0%).
Natural Resources, Construction and Maintenance Occupations by Sex
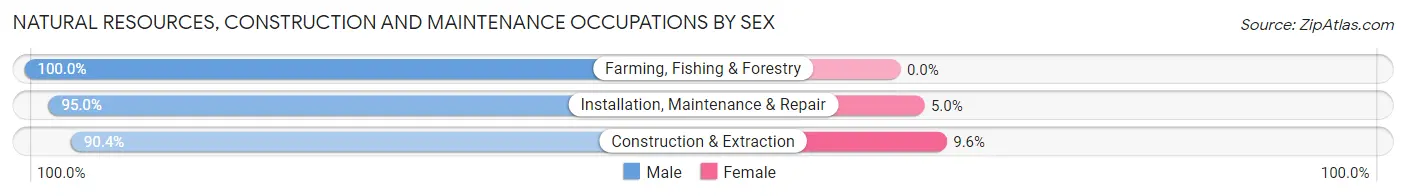
| Occupation | Male | Female |
| Farming, Fishing & Forestry | 9 (100.0%) | 0 (0.0%) |
| Construction & Extraction | 1,284 (90.4%) | 137 (9.6%) |
| Installation, Maintenance & Repair | 361 (95.0%) | 19 (5.0%) |
| Total (Category) | 1,654 (91.4%) | 156 (8.6%) |
| Total (Overall) | 11,901 (51.6%) | 11,169 (48.4%) |
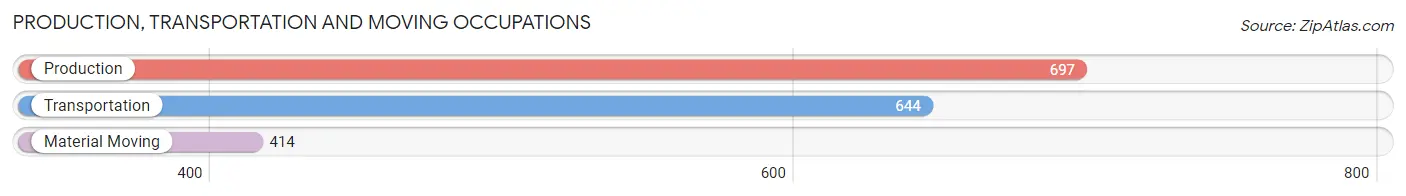
Production, Transportation and Moving Occupations
The most common Production, Transportation and Moving occupations in Woburn are Production (697 | 3.0%), Transportation (644 | 2.8%), and Material Moving (414 | 1.8%).
Production, Transportation and Moving Occupations by Sex
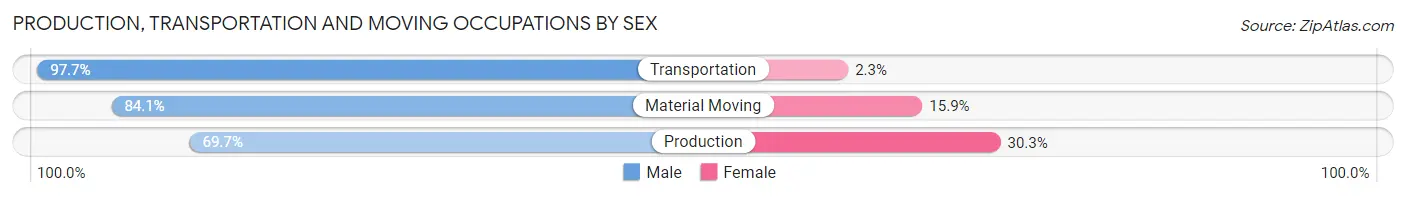
| Occupation | Male | Female |
| Production | 486 (69.7%) | 211 (30.3%) |
| Transportation | 629 (97.7%) | 15 (2.3%) |
| Material Moving | 348 (84.1%) | 66 (15.9%) |
| Total (Category) | 1,463 (83.4%) | 292 (16.6%) |
| Total (Overall) | 11,901 (51.6%) | 11,169 (48.4%) |
Employment Industries by Sex in Woburn
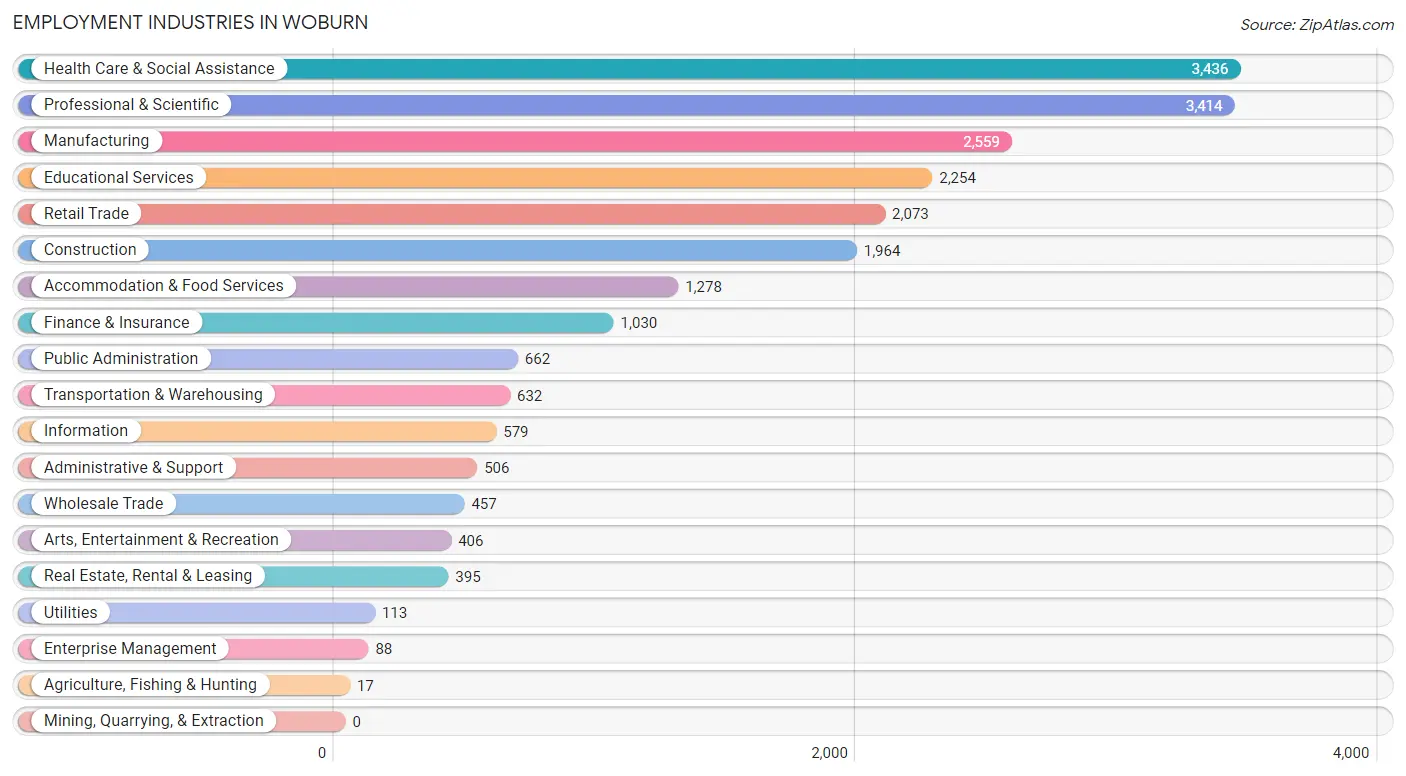
Employment Industries in Woburn
The major employment industries in Woburn include Health Care & Social Assistance (3,436 | 14.9%), Professional & Scientific (3,414 | 14.8%), Manufacturing (2,559 | 11.1%), Educational Services (2,254 | 9.8%), and Retail Trade (2,073 | 9.0%).
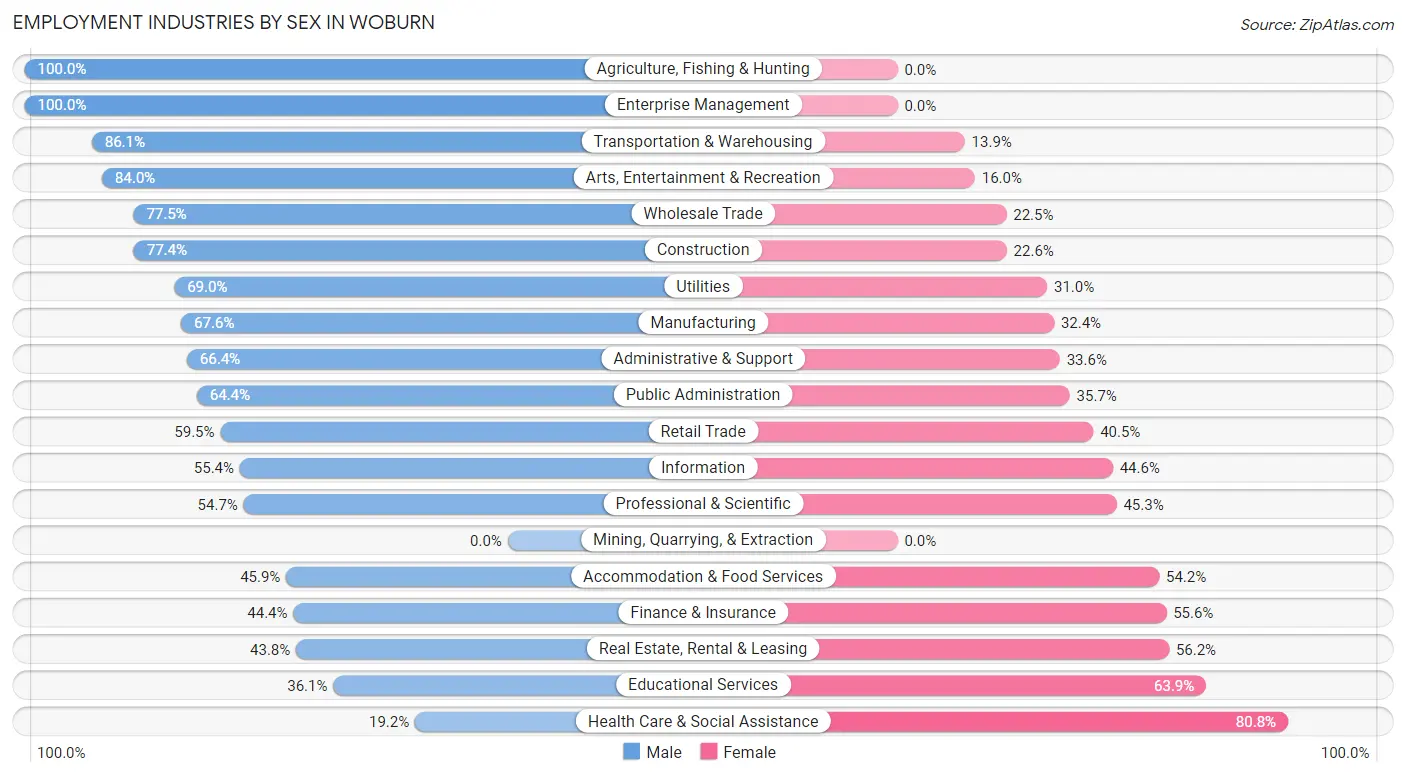
Employment Industries by Sex in Woburn
The Woburn industries that see more men than women are Agriculture, Fishing & Hunting (100.0%), Enterprise Management (100.0%), and Transportation & Warehousing (86.1%), whereas the industries that tend to have a higher number of women are Health Care & Social Assistance (80.8%), Educational Services (63.9%), and Real Estate, Rental & Leasing (56.2%).
| Industry | Male | Female |
| Agriculture, Fishing & Hunting | 17 (100.0%) | 0 (0.0%) |
| Mining, Quarrying, & Extraction | 0 (0.0%) | 0 (0.0%) |
| Construction | 1,520 (77.4%) | 444 (22.6%) |
| Manufacturing | 1,730 (67.6%) | 829 (32.4%) |
| Wholesale Trade | 354 (77.5%) | 103 (22.5%) |
| Retail Trade | 1,233 (59.5%) | 840 (40.5%) |
| Transportation & Warehousing | 544 (86.1%) | 88 (13.9%) |
| Utilities | 78 (69.0%) | 35 (31.0%) |
| Information | 321 (55.4%) | 258 (44.6%) |
| Finance & Insurance | 457 (44.4%) | 573 (55.6%) |
| Real Estate, Rental & Leasing | 173 (43.8%) | 222 (56.2%) |
| Professional & Scientific | 1,866 (54.7%) | 1,548 (45.3%) |
| Enterprise Management | 88 (100.0%) | 0 (0.0%) |
| Administrative & Support | 336 (66.4%) | 170 (33.6%) |
| Educational Services | 814 (36.1%) | 1,440 (63.9%) |
| Health Care & Social Assistance | 659 (19.2%) | 2,777 (80.8%) |
| Arts, Entertainment & Recreation | 341 (84.0%) | 65 (16.0%) |
| Accommodation & Food Services | 586 (45.9%) | 692 (54.1%) |
| Public Administration | 426 (64.3%) | 236 (35.6%) |
| Total | 11,901 (51.6%) | 11,169 (48.4%) |
Education in Woburn
School Enrollment in Woburn
The most common levels of schooling among the 8,794 students in Woburn are high school (2,150 | 24.4%), college / undergraduate (1,776 | 20.2%), and elementary school (1,743 | 19.8%).
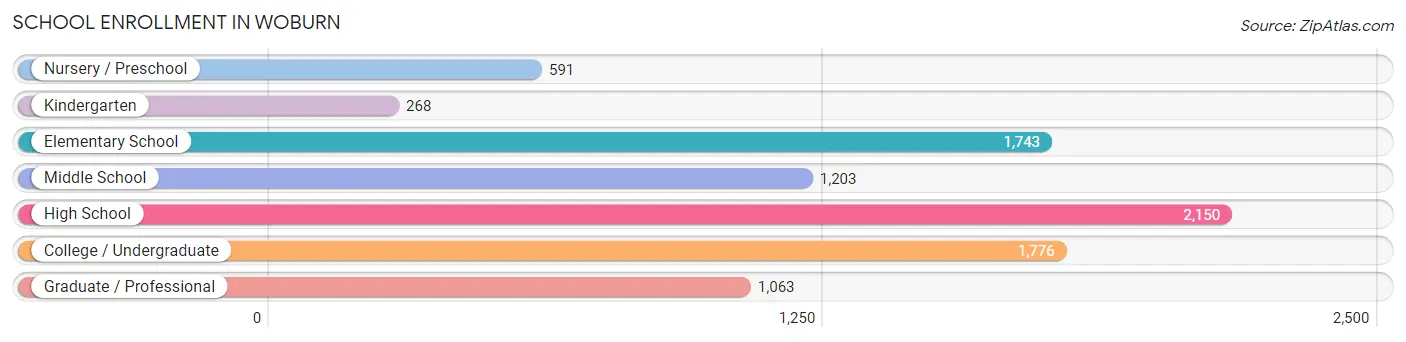
| School Level | # Students | % Students |
| Nursery / Preschool | 591 | 6.7% |
| Kindergarten | 268 | 3.0% |
| Elementary School | 1,743 | 19.8% |
| Middle School | 1,203 | 13.7% |
| High School | 2,150 | 24.4% |
| College / Undergraduate | 1,776 | 20.2% |
| Graduate / Professional | 1,063 | 12.1% |
| Total | 8,794 | 100.0% |
School Enrollment by Age by Funding Source in Woburn
Out of a total of 8,794 students who are enrolled in schools in Woburn, 2,480 (28.2%) attend a private institution, while the remaining 6,314 (71.8%) are enrolled in public schools. The age group of 35 years and over has the highest likelihood of being enrolled in private schools, with 448 (72.1% in the age bracket) enrolled. Conversely, the age group of 15 to 17 year olds has the lowest likelihood of being enrolled in a private school, with 1,228 (91.6% in the age bracket) attending a public institution.
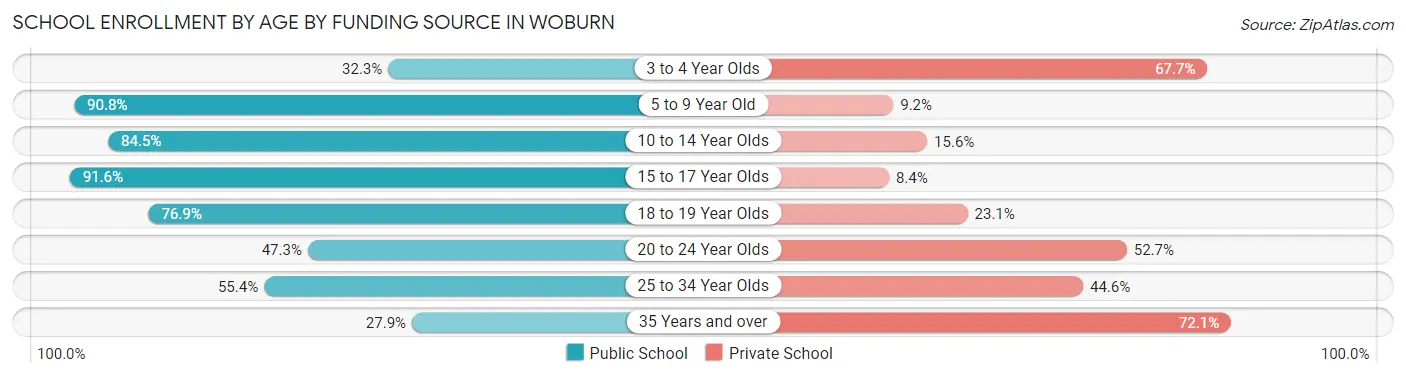
| Age Bracket | Public School | Private School |
| 3 to 4 Year Olds | 144 (32.3%) | 302 (67.7%) |
| 5 to 9 Year Old | 1,768 (90.8%) | 180 (9.2%) |
| 10 to 14 Year Olds | 1,325 (84.5%) | 244 (15.5%) |
| 15 to 17 Year Olds | 1,228 (91.6%) | 113 (8.4%) |
| 18 to 19 Year Olds | 690 (76.9%) | 207 (23.1%) |
| 20 to 24 Year Olds | 613 (47.3%) | 684 (52.7%) |
| 25 to 34 Year Olds | 374 (55.4%) | 301 (44.6%) |
| 35 Years and over | 173 (27.9%) | 448 (72.1%) |
| Total | 6,314 (71.8%) | 2,480 (28.2%) |
Educational Attainment by Field of Study in Woburn
Business (2,669 | 17.4%), engineering (1,896 | 12.3%), science & technology (1,704 | 11.1%), social sciences (1,203 | 7.8%), and arts & humanities (1,200 | 7.8%) are the most common fields of study among 15,372 individuals in Woburn who have obtained a bachelor's degree or higher.
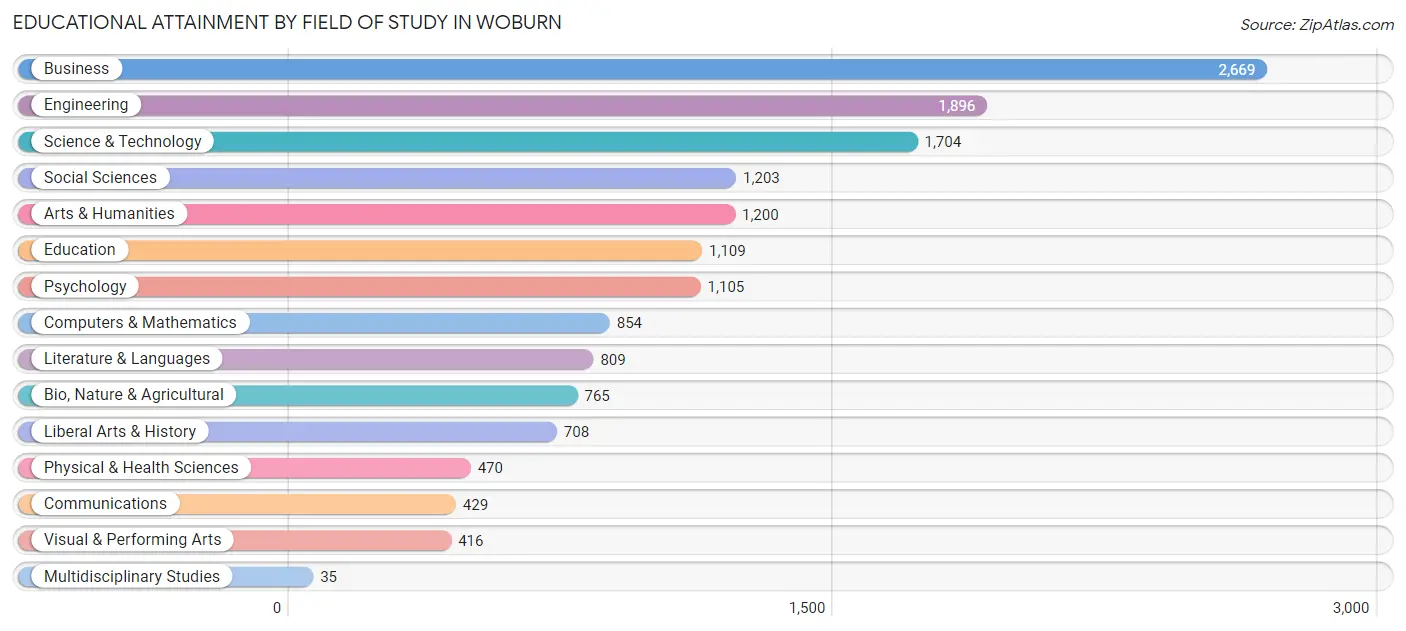
| Field of Study | # Graduates | % Graduates |
| Computers & Mathematics | 854 | 5.6% |
| Bio, Nature & Agricultural | 765 | 5.0% |
| Physical & Health Sciences | 470 | 3.1% |
| Psychology | 1,105 | 7.2% |
| Social Sciences | 1,203 | 7.8% |
| Engineering | 1,896 | 12.3% |
| Multidisciplinary Studies | 35 | 0.2% |
| Science & Technology | 1,704 | 11.1% |
| Business | 2,669 | 17.4% |
| Education | 1,109 | 7.2% |
| Literature & Languages | 809 | 5.3% |
| Liberal Arts & History | 708 | 4.6% |
| Visual & Performing Arts | 416 | 2.7% |
| Communications | 429 | 2.8% |
| Arts & Humanities | 1,200 | 7.8% |
| Total | 15,372 | 100.0% |
Transportation & Commute in Woburn
Vehicle Availability by Sex in Woburn
The most prevalent vehicle ownership categories in Woburn are males with 2 vehicles (4,801, accounting for 41.2%) and females with 2 vehicles (4,597, making up 43.9%).
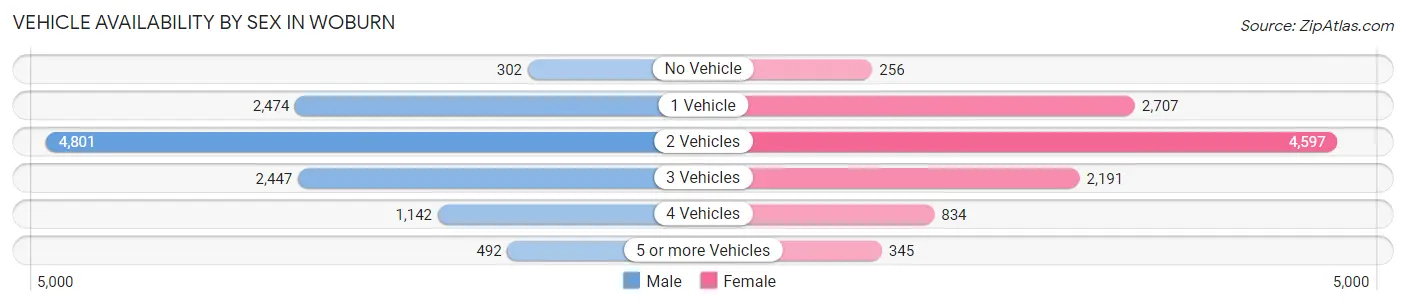
| Vehicles Available | Male | Female |
| No Vehicle | 302 (2.6%) | 256 (2.3%) |
| 1 Vehicle | 2,474 (21.2%) | 2,707 (24.8%) |
| 2 Vehicles | 4,801 (41.2%) | 4,597 (42.1%) |
| 3 Vehicles | 2,447 (21.0%) | 2,191 (20.1%) |
| 4 Vehicles | 1,142 (9.8%) | 834 (7.6%) |
| 5 or more Vehicles | 492 (4.2%) | 345 (3.2%) |
| Total | 11,658 (100.0%) | 10,930 (100.0%) |
Commute Time in Woburn
The most frequently occuring commute durations in Woburn are 15 to 19 minutes (2,963 commuters, 15.2%), 30 to 34 minutes (2,717 commuters, 13.9%), and 10 to 14 minutes (2,545 commuters, 13.0%).
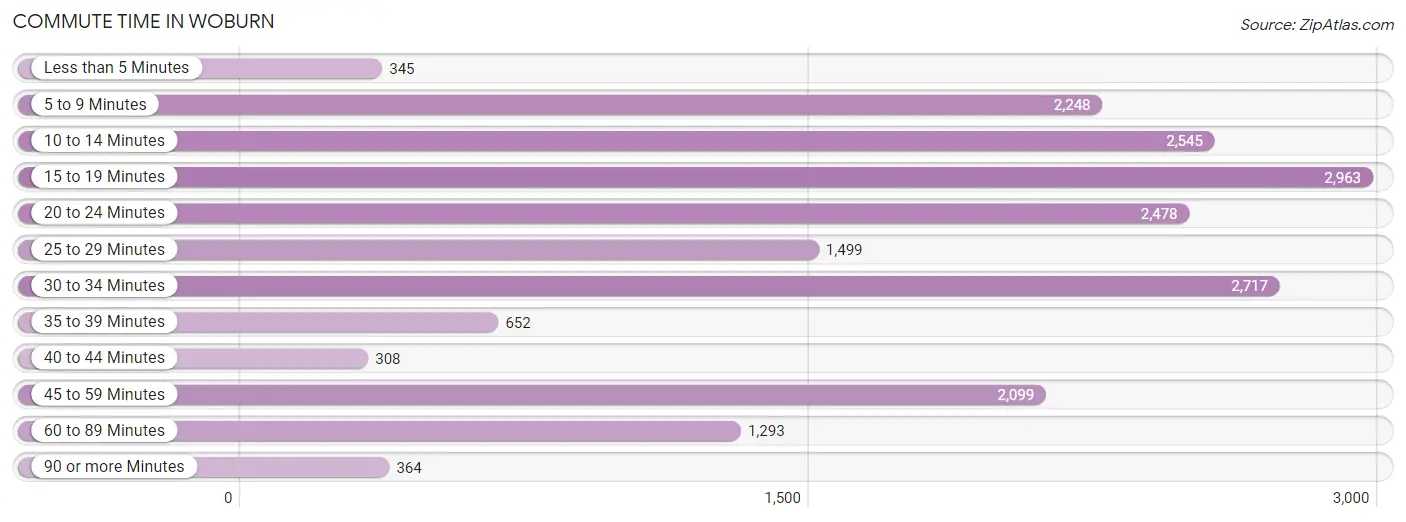
| Commute Time | # Commuters | % Commuters |
| Less than 5 Minutes | 345 | 1.8% |
| 5 to 9 Minutes | 2,248 | 11.5% |
| 10 to 14 Minutes | 2,545 | 13.0% |
| 15 to 19 Minutes | 2,963 | 15.2% |
| 20 to 24 Minutes | 2,478 | 12.7% |
| 25 to 29 Minutes | 1,499 | 7.7% |
| 30 to 34 Minutes | 2,717 | 13.9% |
| 35 to 39 Minutes | 652 | 3.3% |
| 40 to 44 Minutes | 308 | 1.6% |
| 45 to 59 Minutes | 2,099 | 10.8% |
| 60 to 89 Minutes | 1,293 | 6.6% |
| 90 or more Minutes | 364 | 1.9% |
Commute Time by Sex in Woburn
The most common commute times in Woburn are 30 to 34 minutes (1,719 commuters, 16.7%) for males and 15 to 19 minutes (1,499 commuters, 16.2%) for females.
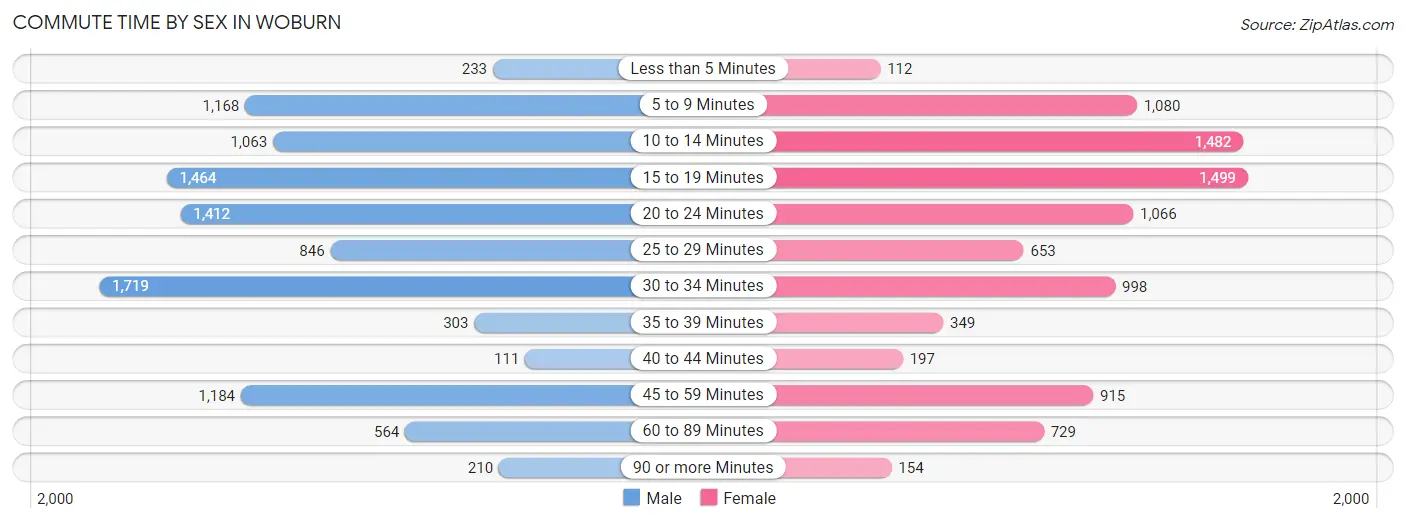
| Commute Time | Male | Female |
| Less than 5 Minutes | 233 (2.3%) | 112 (1.2%) |
| 5 to 9 Minutes | 1,168 (11.4%) | 1,080 (11.7%) |
| 10 to 14 Minutes | 1,063 (10.3%) | 1,482 (16.1%) |
| 15 to 19 Minutes | 1,464 (14.2%) | 1,499 (16.2%) |
| 20 to 24 Minutes | 1,412 (13.7%) | 1,066 (11.5%) |
| 25 to 29 Minutes | 846 (8.2%) | 653 (7.1%) |
| 30 to 34 Minutes | 1,719 (16.7%) | 998 (10.8%) |
| 35 to 39 Minutes | 303 (2.9%) | 349 (3.8%) |
| 40 to 44 Minutes | 111 (1.1%) | 197 (2.1%) |
| 45 to 59 Minutes | 1,184 (11.5%) | 915 (9.9%) |
| 60 to 89 Minutes | 564 (5.5%) | 729 (7.9%) |
| 90 or more Minutes | 210 (2.0%) | 154 (1.7%) |
Time of Departure to Work by Sex in Woburn
The most frequent times of departure to work in Woburn are 7:00 AM to 7:29 AM (1,565, 15.2%) for males and 7:00 AM to 7:29 AM (1,318, 14.3%) for females.
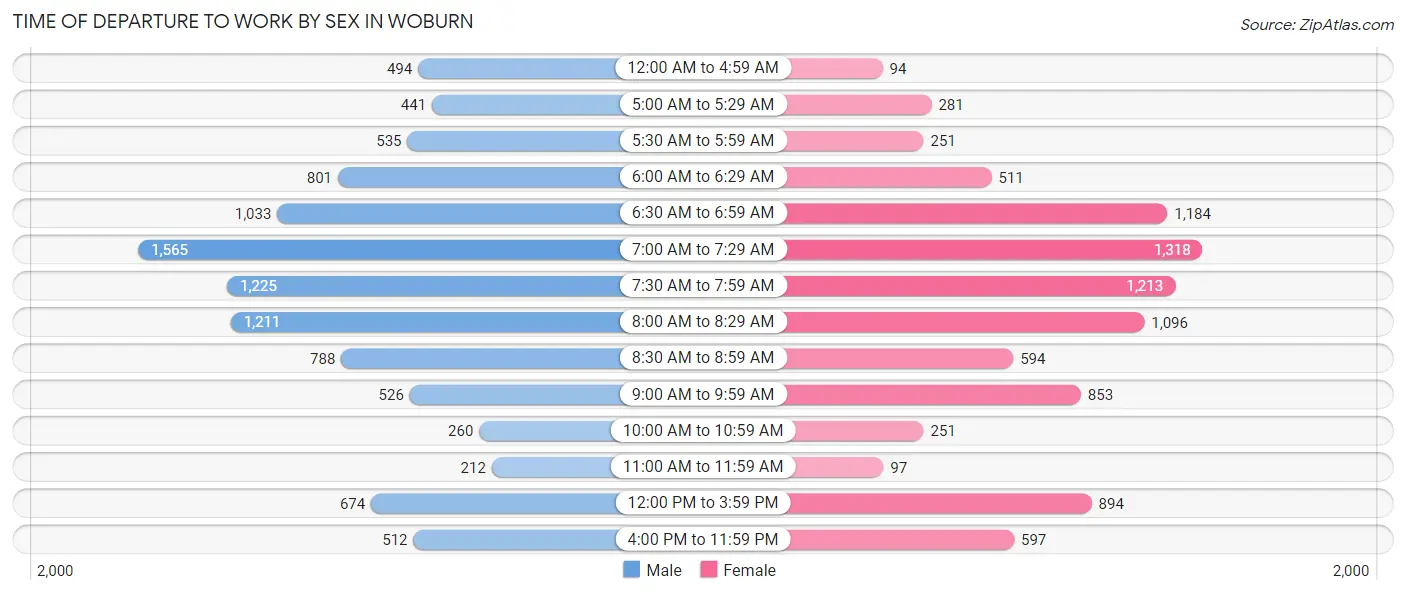
| Time of Departure | Male | Female |
| 12:00 AM to 4:59 AM | 494 (4.8%) | 94 (1.0%) |
| 5:00 AM to 5:29 AM | 441 (4.3%) | 281 (3.0%) |
| 5:30 AM to 5:59 AM | 535 (5.2%) | 251 (2.7%) |
| 6:00 AM to 6:29 AM | 801 (7.8%) | 511 (5.5%) |
| 6:30 AM to 6:59 AM | 1,033 (10.1%) | 1,184 (12.8%) |
| 7:00 AM to 7:29 AM | 1,565 (15.2%) | 1,318 (14.3%) |
| 7:30 AM to 7:59 AM | 1,225 (11.9%) | 1,213 (13.1%) |
| 8:00 AM to 8:29 AM | 1,211 (11.8%) | 1,096 (11.9%) |
| 8:30 AM to 8:59 AM | 788 (7.7%) | 594 (6.4%) |
| 9:00 AM to 9:59 AM | 526 (5.1%) | 853 (9.2%) |
| 10:00 AM to 10:59 AM | 260 (2.5%) | 251 (2.7%) |
| 11:00 AM to 11:59 AM | 212 (2.1%) | 97 (1.1%) |
| 12:00 PM to 3:59 PM | 674 (6.6%) | 894 (9.7%) |
| 4:00 PM to 11:59 PM | 512 (5.0%) | 597 (6.5%) |
| Total | 10,277 (100.0%) | 9,234 (100.0%) |
Housing Occupancy in Woburn
Occupancy by Ownership in Woburn
Of the total 16,121 dwellings in Woburn, owner-occupied units account for 9,483 (58.8%), while renter-occupied units make up 6,638 (41.2%).
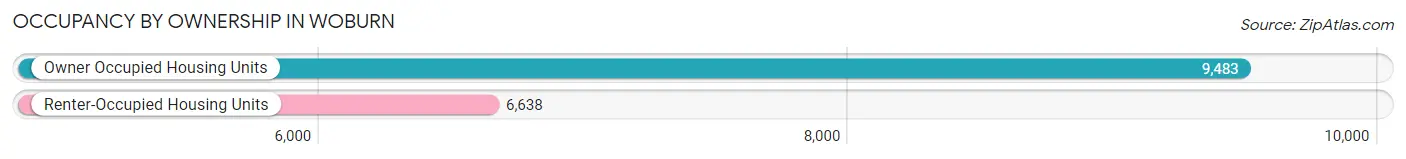
| Occupancy | # Housing Units | % Housing Units |
| Owner Occupied Housing Units | 9,483 | 58.8% |
| Renter-Occupied Housing Units | 6,638 | 41.2% |
| Total Occupied Housing Units | 16,121 | 100.0% |
Occupancy by Household Size in Woburn
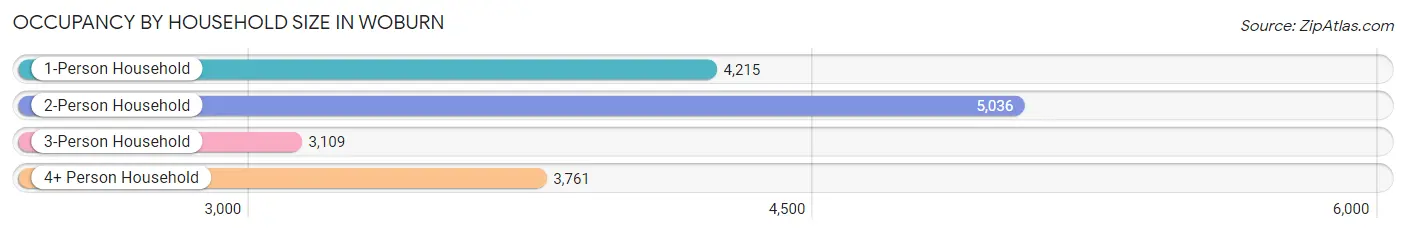
| Household Size | # Housing Units | % Housing Units |
| 1-Person Household | 4,215 | 26.2% |
| 2-Person Household | 5,036 | 31.2% |
| 3-Person Household | 3,109 | 19.3% |
| 4+ Person Household | 3,761 | 23.3% |
| Total Housing Units | 16,121 | 100.0% |
Occupancy by Ownership by Household Size in Woburn

| Household Size | Owner-occupied | Renter-occupied |
| 1-Person Household | 1,909 (45.3%) | 2,306 (54.7%) |
| 2-Person Household | 3,112 (61.8%) | 1,924 (38.2%) |
| 3-Person Household | 1,883 (60.6%) | 1,226 (39.4%) |
| 4+ Person Household | 2,579 (68.6%) | 1,182 (31.4%) |
| Total Housing Units | 9,483 (58.8%) | 6,638 (41.2%) |
Occupancy by Educational Attainment in Woburn
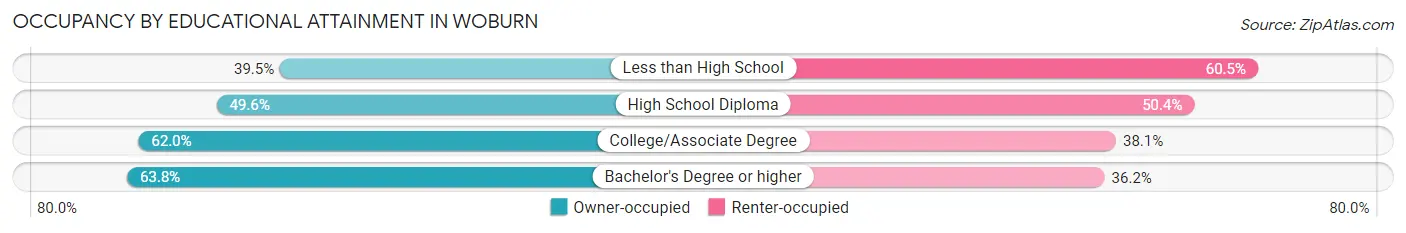
| Household Size | Owner-occupied | Renter-occupied |
| Less than High School | 398 (39.5%) | 610 (60.5%) |
| High School Diploma | 1,707 (49.6%) | 1,737 (50.4%) |
| College/Associate Degree | 2,131 (62.0%) | 1,309 (38.1%) |
| Bachelor's Degree or higher | 5,247 (63.8%) | 2,982 (36.2%) |
Occupancy by Age of Householder in Woburn
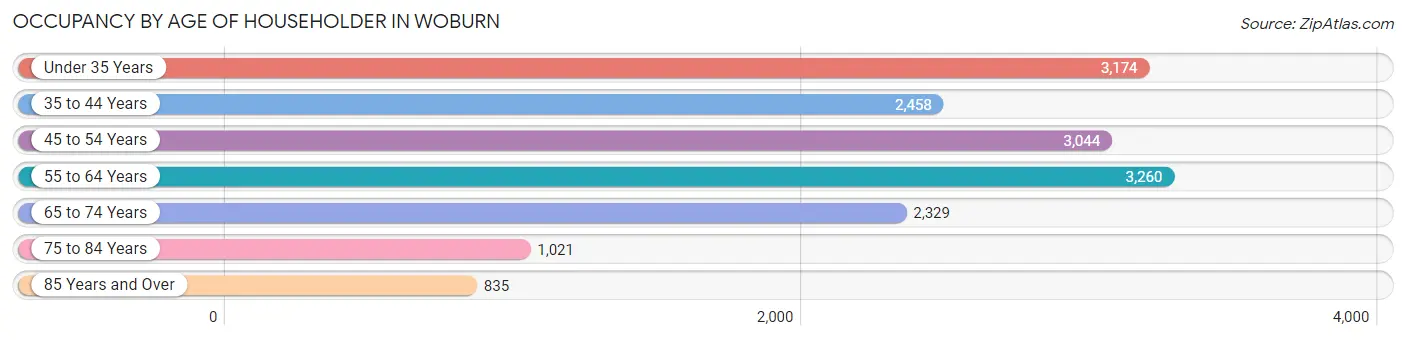
| Age Bracket | # Households | % Households |
| Under 35 Years | 3,174 | 19.7% |
| 35 to 44 Years | 2,458 | 15.2% |
| 45 to 54 Years | 3,044 | 18.9% |
| 55 to 64 Years | 3,260 | 20.2% |
| 65 to 74 Years | 2,329 | 14.4% |
| 75 to 84 Years | 1,021 | 6.3% |
| 85 Years and Over | 835 | 5.2% |
| Total | 16,121 | 100.0% |
Housing Finances in Woburn
Median Income by Occupancy in Woburn
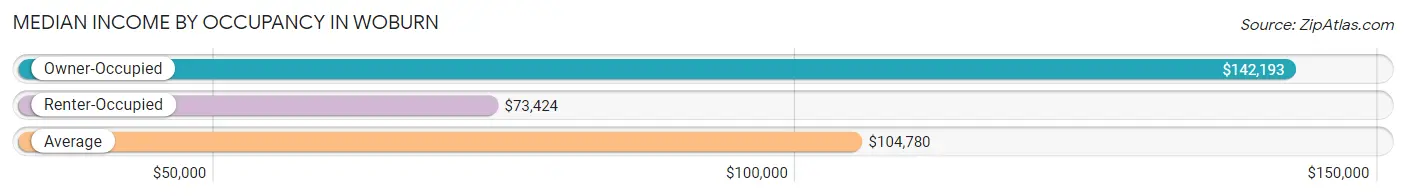
| Occupancy Type | # Households | Median Income |
| Owner-Occupied | 9,483 (58.8%) | $142,193 |
| Renter-Occupied | 6,638 (41.2%) | $73,424 |
| Average | 16,121 (100.0%) | $104,780 |
Occupancy by Householder Income Bracket in Woburn
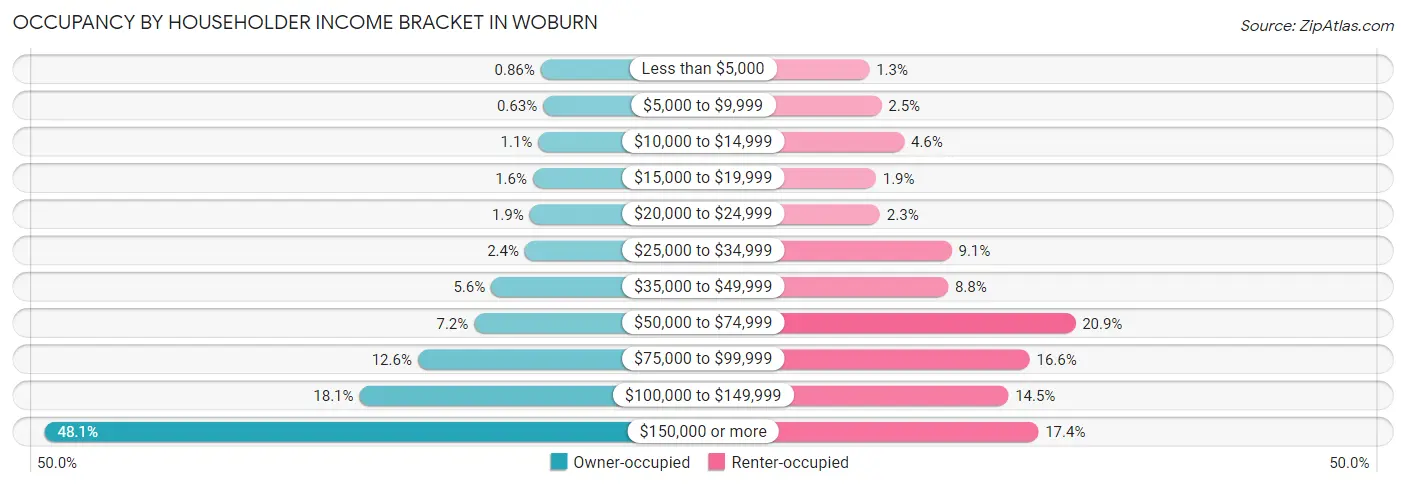
| Income Bracket | Owner-occupied | Renter-occupied |
| Less than $5,000 | 82 (0.9%) | 86 (1.3%) |
| $5,000 to $9,999 | 60 (0.6%) | 163 (2.5%) |
| $10,000 to $14,999 | 103 (1.1%) | 307 (4.6%) |
| $15,000 to $19,999 | 152 (1.6%) | 128 (1.9%) |
| $20,000 to $24,999 | 181 (1.9%) | 154 (2.3%) |
| $25,000 to $34,999 | 224 (2.4%) | 607 (9.1%) |
| $35,000 to $49,999 | 529 (5.6%) | 584 (8.8%) |
| $50,000 to $74,999 | 682 (7.2%) | 1,389 (20.9%) |
| $75,000 to $99,999 | 1,191 (12.6%) | 1,100 (16.6%) |
| $100,000 to $149,999 | 1,718 (18.1%) | 965 (14.5%) |
| $150,000 or more | 4,561 (48.1%) | 1,155 (17.4%) |
| Total | 9,483 (100.0%) | 6,638 (100.0%) |
Monthly Housing Cost Tiers in Woburn
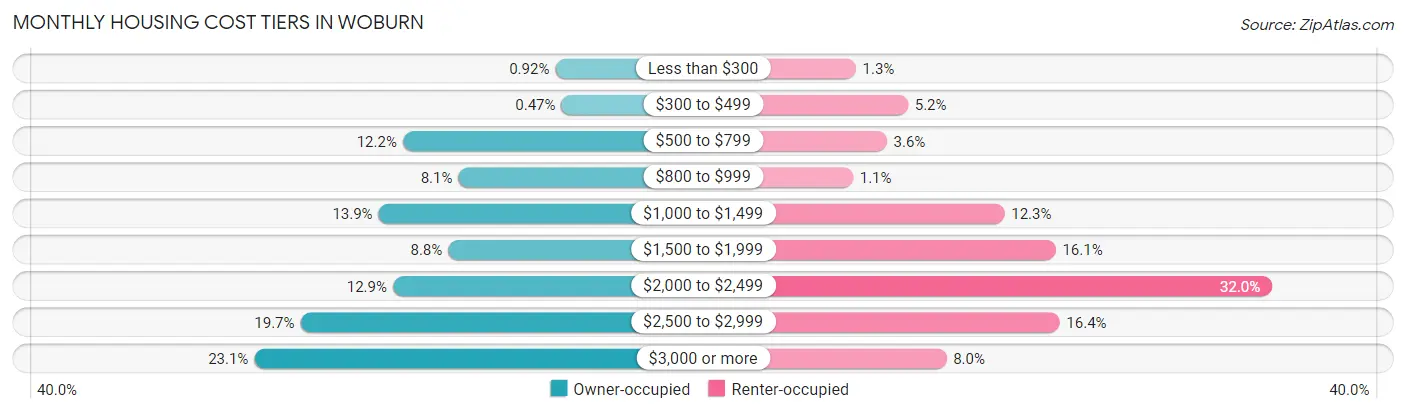
| Monthly Cost | Owner-occupied | Renter-occupied |
| Less than $300 | 87 (0.9%) | 89 (1.3%) |
| $300 to $499 | 45 (0.5%) | 344 (5.2%) |
| $500 to $799 | 1,152 (12.1%) | 240 (3.6%) |
| $800 to $999 | 764 (8.1%) | 75 (1.1%) |
| $1,000 to $1,499 | 1,322 (13.9%) | 816 (12.3%) |
| $1,500 to $1,999 | 835 (8.8%) | 1,066 (16.1%) |
| $2,000 to $2,499 | 1,221 (12.9%) | 2,125 (32.0%) |
| $2,500 to $2,999 | 1,867 (19.7%) | 1,085 (16.4%) |
| $3,000 or more | 2,190 (23.1%) | 532 (8.0%) |
| Total | 9,483 (100.0%) | 6,638 (100.0%) |
Physical Housing Characteristics in Woburn
Housing Structures in Woburn
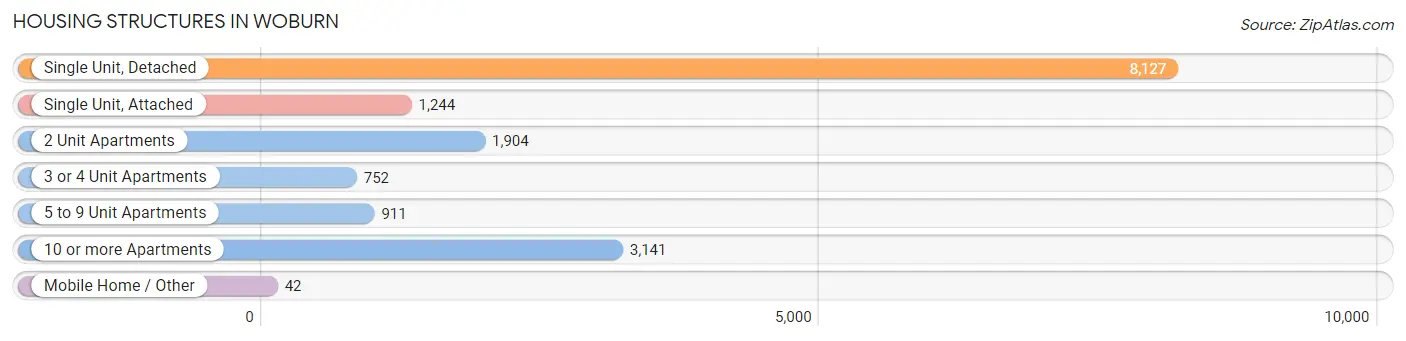
| Structure Type | # Housing Units | % Housing Units |
| Single Unit, Detached | 8,127 | 50.4% |
| Single Unit, Attached | 1,244 | 7.7% |
| 2 Unit Apartments | 1,904 | 11.8% |
| 3 or 4 Unit Apartments | 752 | 4.7% |
| 5 to 9 Unit Apartments | 911 | 5.7% |
| 10 or more Apartments | 3,141 | 19.5% |
| Mobile Home / Other | 42 | 0.3% |
| Total | 16,121 | 100.0% |
Housing Structures by Occupancy in Woburn
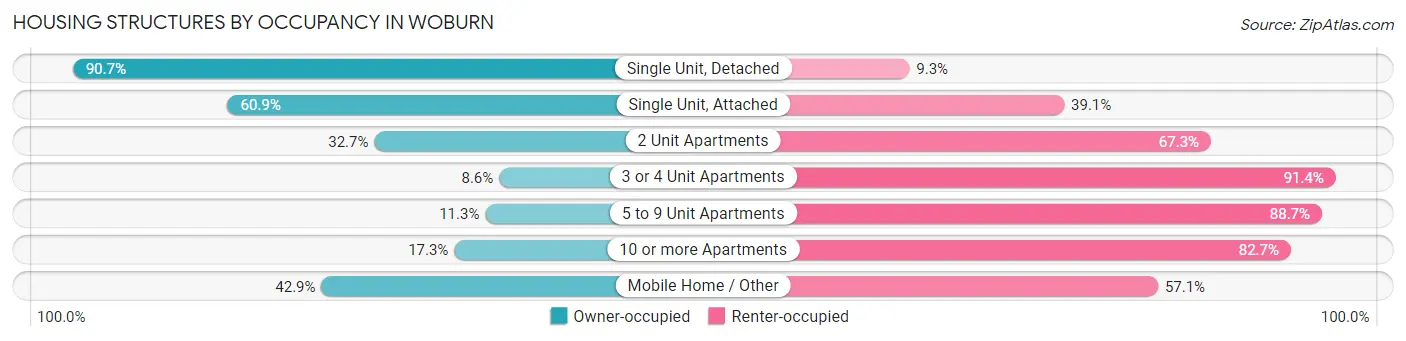
| Structure Type | Owner-occupied | Renter-occupied |
| Single Unit, Detached | 7,374 (90.7%) | 753 (9.3%) |
| Single Unit, Attached | 758 (60.9%) | 486 (39.1%) |
| 2 Unit Apartments | 622 (32.7%) | 1,282 (67.3%) |
| 3 or 4 Unit Apartments | 65 (8.6%) | 687 (91.4%) |
| 5 to 9 Unit Apartments | 103 (11.3%) | 808 (88.7%) |
| 10 or more Apartments | 543 (17.3%) | 2,598 (82.7%) |
| Mobile Home / Other | 18 (42.9%) | 24 (57.1%) |
| Total | 9,483 (58.8%) | 6,638 (41.2%) |
Housing Structures by Number of Rooms in Woburn
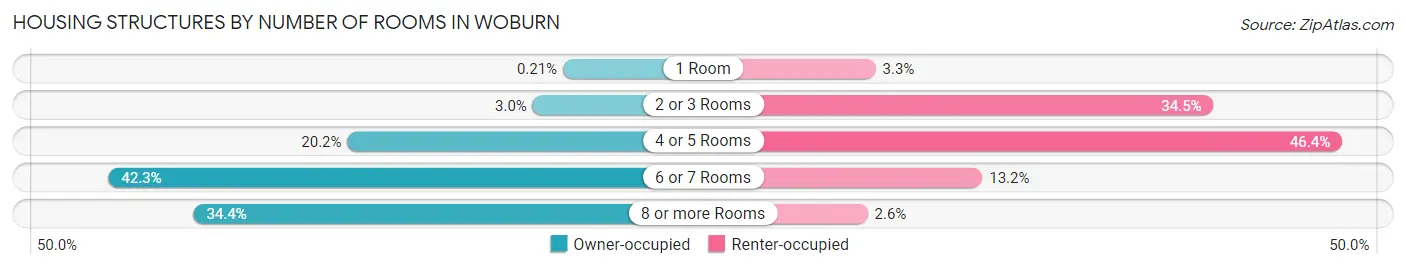
| Number of Rooms | Owner-occupied | Renter-occupied |
| 1 Room | 20 (0.2%) | 219 (3.3%) |
| 2 or 3 Rooms | 285 (3.0%) | 2,293 (34.5%) |
| 4 or 5 Rooms | 1,911 (20.2%) | 3,082 (46.4%) |
| 6 or 7 Rooms | 4,007 (42.2%) | 874 (13.2%) |
| 8 or more Rooms | 3,260 (34.4%) | 170 (2.6%) |
| Total | 9,483 (100.0%) | 6,638 (100.0%) |
Housing Structure by Heating Type in Woburn
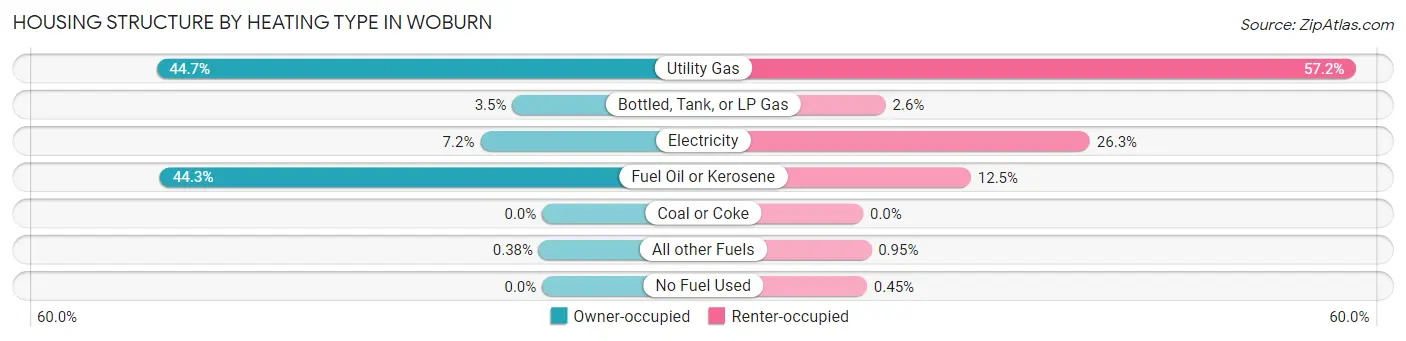
| Heating Type | Owner-occupied | Renter-occupied |
| Utility Gas | 4,238 (44.7%) | 3,795 (57.2%) |
| Bottled, Tank, or LP Gas | 328 (3.5%) | 174 (2.6%) |
| Electricity | 680 (7.2%) | 1,746 (26.3%) |
| Fuel Oil or Kerosene | 4,201 (44.3%) | 830 (12.5%) |
| Coal or Coke | 0 (0.0%) | 0 (0.0%) |
| All other Fuels | 36 (0.4%) | 63 (0.9%) |
| No Fuel Used | 0 (0.0%) | 30 (0.4%) |
| Total | 9,483 (100.0%) | 6,638 (100.0%) |
Household Vehicle Usage in Woburn
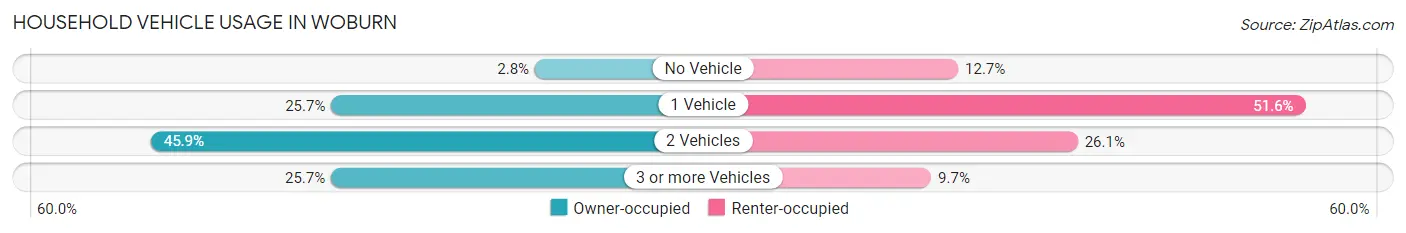
| Vehicles per Household | Owner-occupied | Renter-occupied |
| No Vehicle | 268 (2.8%) | 842 (12.7%) |
| 1 Vehicle | 2,432 (25.7%) | 3,424 (51.6%) |
| 2 Vehicles | 4,349 (45.9%) | 1,731 (26.1%) |
| 3 or more Vehicles | 2,434 (25.7%) | 641 (9.7%) |
| Total | 9,483 (100.0%) | 6,638 (100.0%) |
Real Estate & Mortgages in Woburn
Real Estate and Mortgage Overview in Woburn
| Characteristic | Without Mortgage | With Mortgage |
| Housing Units | 2,913 | 6,570 |
| Median Property Value | $542,100 | $632,100 |
| Median Household Income | $91,298 | $3,793 |
| Monthly Housing Costs | $880 | $2,190 |
| Real Estate Taxes | $4,858 | $45 |
Property Value by Mortgage Status in Woburn
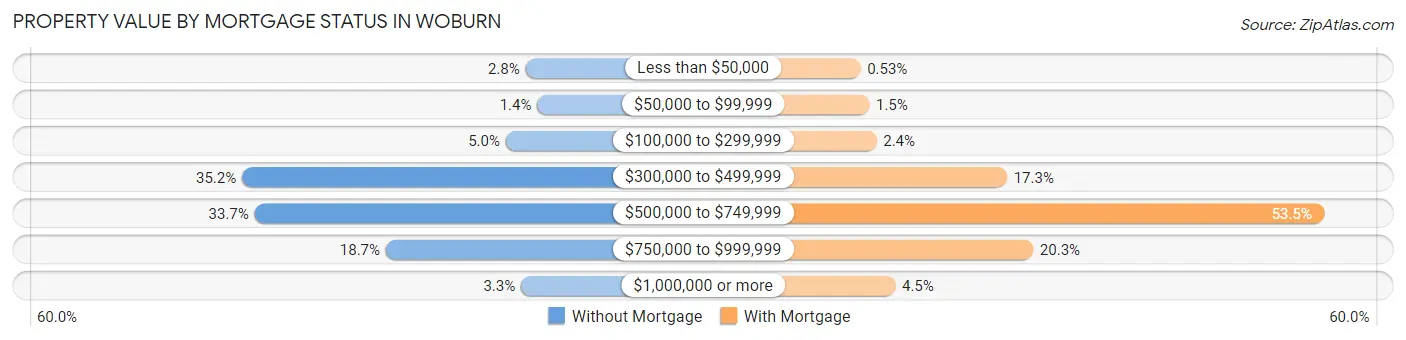
| Property Value | Without Mortgage | With Mortgage |
| Less than $50,000 | 80 (2.8%) | 35 (0.5%) |
| $50,000 to $99,999 | 41 (1.4%) | 101 (1.5%) |
| $100,000 to $299,999 | 146 (5.0%) | 156 (2.4%) |
| $300,000 to $499,999 | 1,024 (35.1%) | 1,135 (17.3%) |
| $500,000 to $749,999 | 982 (33.7%) | 3,515 (53.5%) |
| $750,000 to $999,999 | 545 (18.7%) | 1,332 (20.3%) |
| $1,000,000 or more | 95 (3.3%) | 296 (4.5%) |
| Total | 2,913 (100.0%) | 6,570 (100.0%) |
Household Income by Mortgage Status in Woburn
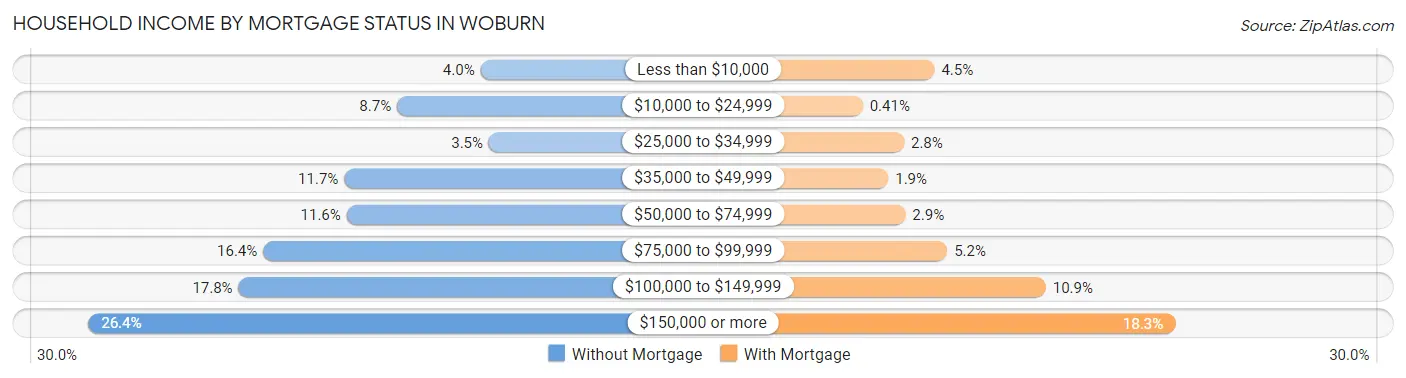
| Household Income | Without Mortgage | With Mortgage |
| Less than $10,000 | 115 (4.0%) | 296 (4.5%) |
| $10,000 to $24,999 | 254 (8.7%) | 27 (0.4%) |
| $25,000 to $34,999 | 101 (3.5%) | 182 (2.8%) |
| $35,000 to $49,999 | 342 (11.7%) | 123 (1.9%) |
| $50,000 to $74,999 | 338 (11.6%) | 187 (2.9%) |
| $75,000 to $99,999 | 477 (16.4%) | 344 (5.2%) |
| $100,000 to $149,999 | 518 (17.8%) | 714 (10.9%) |
| $150,000 or more | 768 (26.4%) | 1,200 (18.3%) |
| Total | 2,913 (100.0%) | 6,570 (100.0%) |
Property Value to Household Income Ratio in Woburn
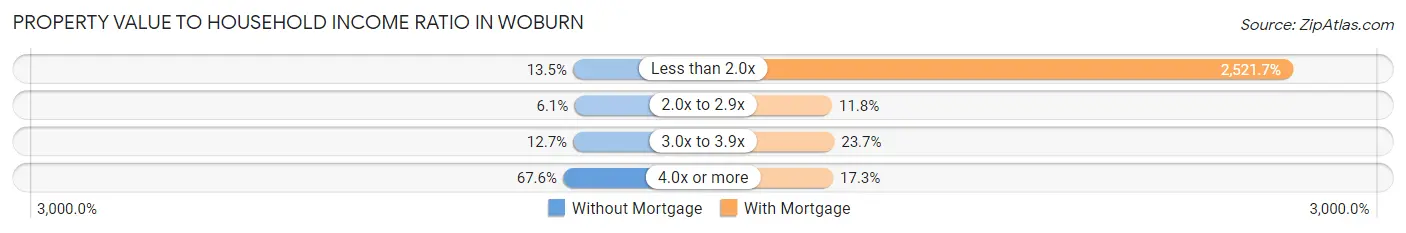
| Value-to-Income Ratio | Without Mortgage | With Mortgage |
| Less than 2.0x | 393 (13.5%) | 165,678 (2,521.7%) |
| 2.0x to 2.9x | 179 (6.1%) | 774 (11.8%) |
| 3.0x to 3.9x | 371 (12.7%) | 1,556 (23.7%) |
| 4.0x or more | 1,970 (67.6%) | 1,136 (17.3%) |
| Total | 2,913 (100.0%) | 6,570 (100.0%) |
Real Estate Taxes by Mortgage Status in Woburn
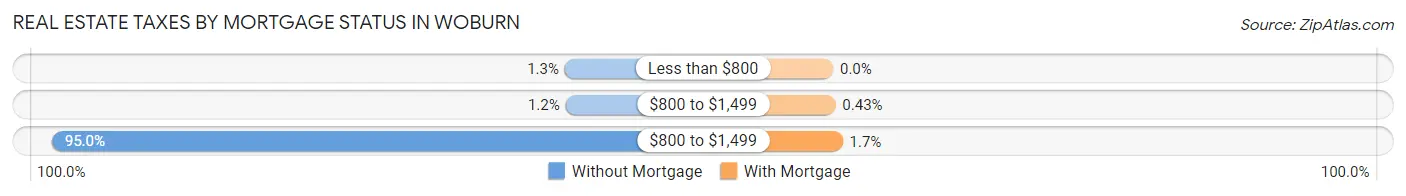
| Property Taxes | Without Mortgage | With Mortgage |
| Less than $800 | 39 (1.3%) | 0 (0.0%) |
| $800 to $1,499 | 35 (1.2%) | 28 (0.4%) |
| $800 to $1,499 | 2,768 (95.0%) | 114 (1.7%) |
| Total | 2,913 (100.0%) | 6,570 (100.0%) |
Health & Disability in Woburn
Health Insurance Coverage by Age in Woburn
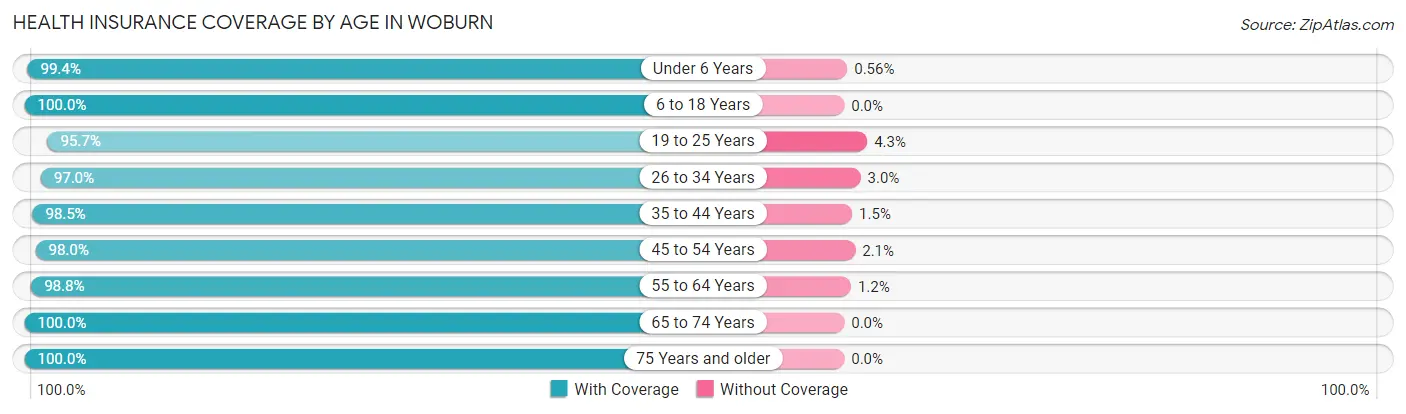
| Age Bracket | With Coverage | Without Coverage |
| Under 6 Years | 2,675 (99.4%) | 15 (0.6%) |
| 6 to 18 Years | 5,403 (100.0%) | 0 (0.0%) |
| 19 to 25 Years | 4,259 (95.7%) | 190 (4.3%) |
| 26 to 34 Years | 5,610 (97.0%) | 176 (3.0%) |
| 35 to 44 Years | 4,976 (98.5%) | 74 (1.5%) |
| 45 to 54 Years | 5,354 (98.0%) | 112 (2.1%) |
| 55 to 64 Years | 5,584 (98.8%) | 70 (1.2%) |
| 65 to 74 Years | 3,698 (100.0%) | 0 (0.0%) |
| 75 Years and older | 2,615 (100.0%) | 0 (0.0%) |
| Total | 40,174 (98.4%) | 637 (1.6%) |
Health Insurance Coverage by Citizenship Status in Woburn
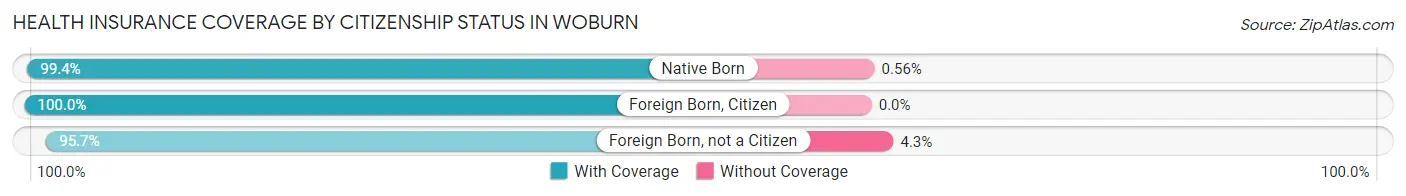
| Citizenship Status | With Coverage | Without Coverage |
| Native Born | 2,675 (99.4%) | 15 (0.6%) |
| Foreign Born, Citizen | 5,403 (100.0%) | 0 (0.0%) |
| Foreign Born, not a Citizen | 4,259 (95.7%) | 190 (4.3%) |
Health Insurance Coverage by Household Income in Woburn
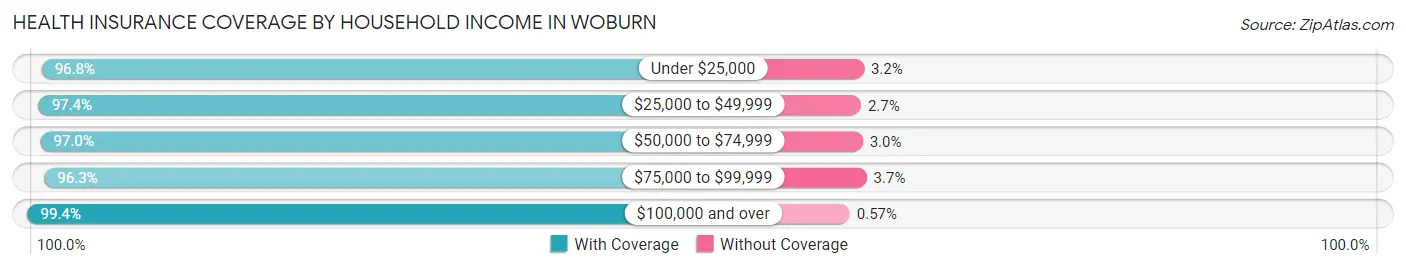
| Household Income | With Coverage | Without Coverage |
| Under $25,000 | 1,871 (96.8%) | 62 (3.2%) |
| $25,000 to $49,999 | 3,496 (97.4%) | 95 (2.6%) |
| $50,000 to $74,999 | 3,910 (97.0%) | 120 (3.0%) |
| $75,000 to $99,999 | 5,616 (96.3%) | 217 (3.7%) |
| $100,000 and over | 25,160 (99.4%) | 143 (0.6%) |
Public vs Private Health Insurance Coverage by Age in Woburn
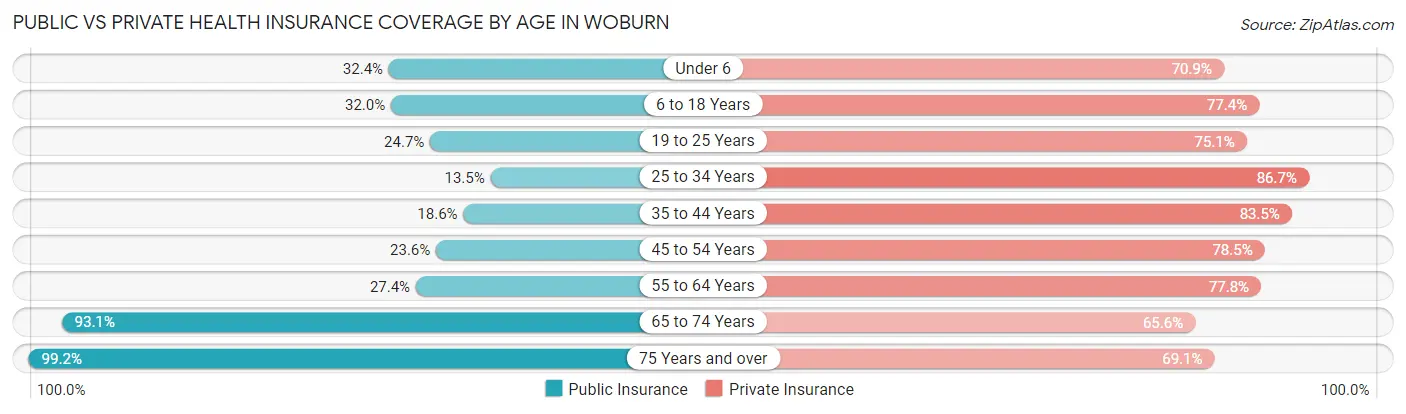
| Age Bracket | Public Insurance | Private Insurance |
| Under 6 | 871 (32.4%) | 1,907 (70.9%) |
| 6 to 18 Years | 1,728 (32.0%) | 4,184 (77.4%) |
| 19 to 25 Years | 1,100 (24.7%) | 3,343 (75.1%) |
| 25 to 34 Years | 782 (13.5%) | 5,014 (86.7%) |
| 35 to 44 Years | 937 (18.5%) | 4,217 (83.5%) |
| 45 to 54 Years | 1,291 (23.6%) | 4,288 (78.4%) |
| 55 to 64 Years | 1,547 (27.4%) | 4,398 (77.8%) |
| 65 to 74 Years | 3,444 (93.1%) | 2,424 (65.5%) |
| 75 Years and over | 2,595 (99.2%) | 1,808 (69.1%) |
| Total | 14,295 (35.0%) | 31,583 (77.4%) |
Disability Status by Sex by Age in Woburn
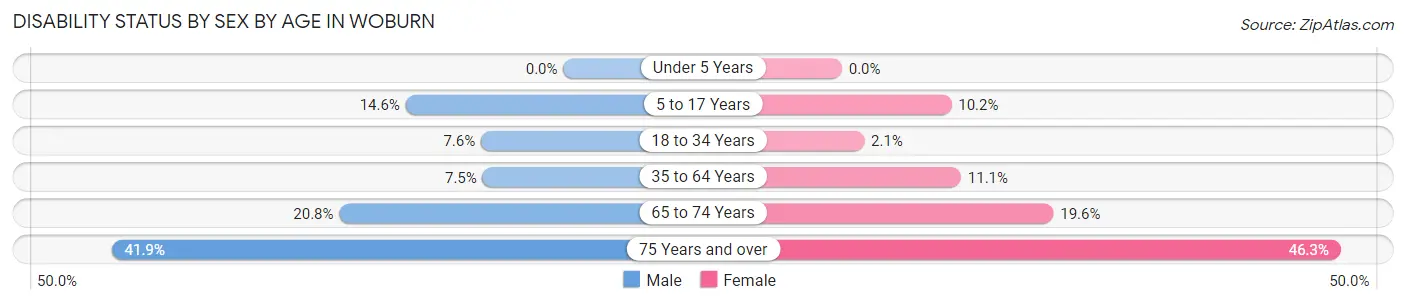
| Age Bracket | Male | Female |
| Under 5 Years | 0 (0.0%) | 0 (0.0%) |
| 5 to 17 Years | 364 (14.6%) | 259 (10.2%) |
| 18 to 34 Years | 441 (7.6%) | 107 (2.1%) |
| 35 to 64 Years | 587 (7.5%) | 921 (11.1%) |
| 65 to 74 Years | 360 (20.8%) | 386 (19.6%) |
| 75 Years and over | 353 (41.9%) | 821 (46.3%) |
Disability Class by Sex by Age in Woburn
Disability Class: Hearing Difficulty
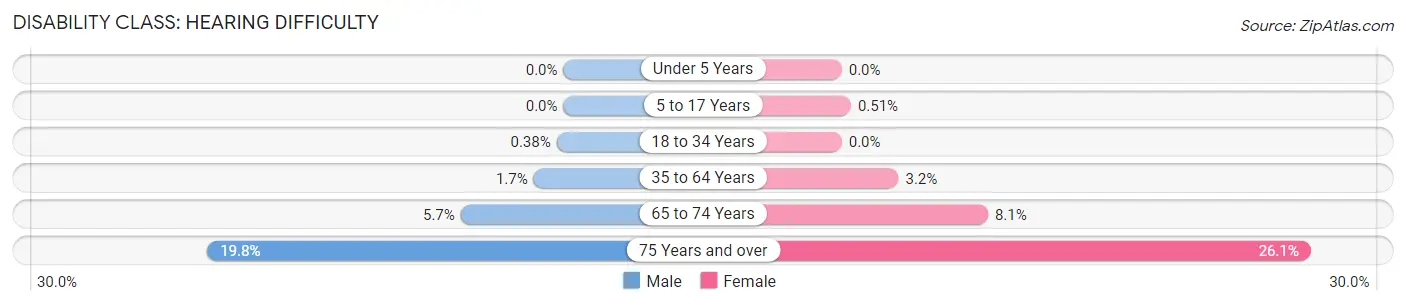
| Age Bracket | Male | Female |
| Under 5 Years | 0 (0.0%) | 0 (0.0%) |
| 5 to 17 Years | 0 (0.0%) | 13 (0.5%) |
| 18 to 34 Years | 22 (0.4%) | 0 (0.0%) |
| 35 to 64 Years | 130 (1.7%) | 263 (3.2%) |
| 65 to 74 Years | 99 (5.7%) | 160 (8.1%) |
| 75 Years and over | 167 (19.8%) | 463 (26.1%) |
Disability Class: Vision Difficulty
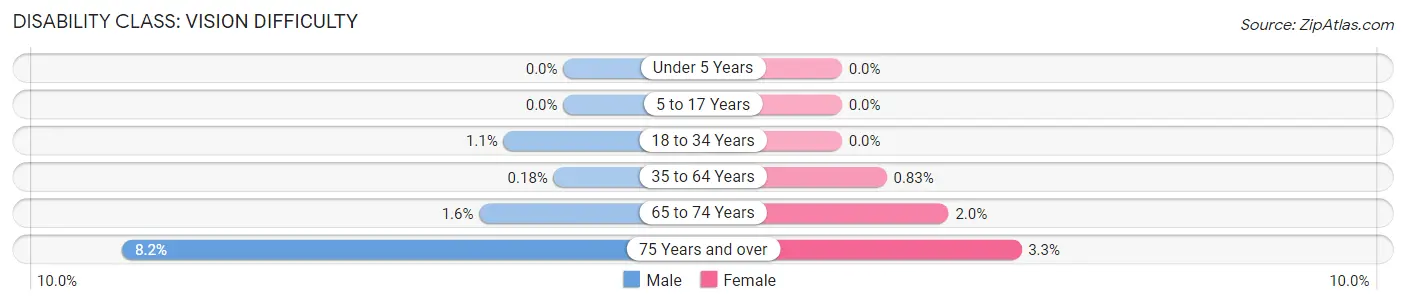
| Age Bracket | Male | Female |
| Under 5 Years | 0 (0.0%) | 0 (0.0%) |
| 5 to 17 Years | 0 (0.0%) | 0 (0.0%) |
| 18 to 34 Years | 64 (1.1%) | 0 (0.0%) |
| 35 to 64 Years | 14 (0.2%) | 69 (0.8%) |
| 65 to 74 Years | 27 (1.6%) | 39 (2.0%) |
| 75 Years and over | 69 (8.2%) | 59 (3.3%) |
Disability Class: Cognitive Difficulty
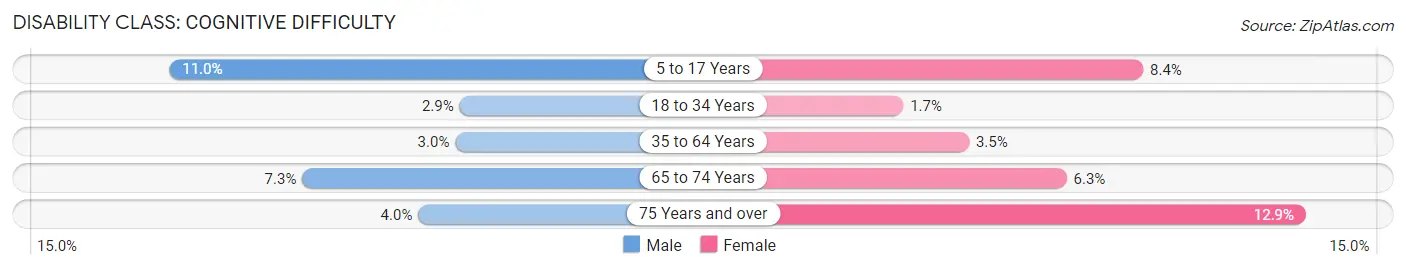
| Age Bracket | Male | Female |
| 5 to 17 Years | 273 (11.0%) | 214 (8.4%) |
| 18 to 34 Years | 167 (2.9%) | 88 (1.7%) |
| 35 to 64 Years | 236 (3.0%) | 295 (3.5%) |
| 65 to 74 Years | 126 (7.3%) | 123 (6.3%) |
| 75 Years and over | 34 (4.0%) | 229 (12.9%) |
Disability Class: Ambulatory Difficulty
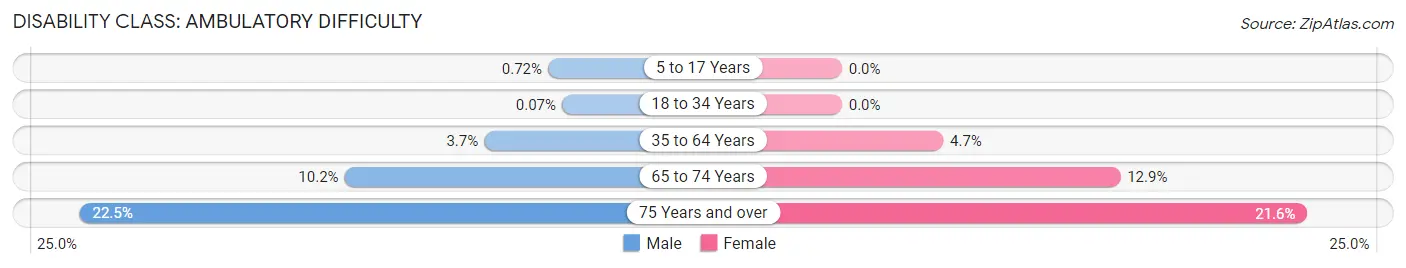
| Age Bracket | Male | Female |
| 5 to 17 Years | 18 (0.7%) | 0 (0.0%) |
| 18 to 34 Years | 4 (0.1%) | 0 (0.0%) |
| 35 to 64 Years | 288 (3.7%) | 392 (4.7%) |
| 65 to 74 Years | 176 (10.2%) | 254 (12.9%) |
| 75 Years and over | 189 (22.5%) | 383 (21.6%) |
Disability Class: Self-Care Difficulty
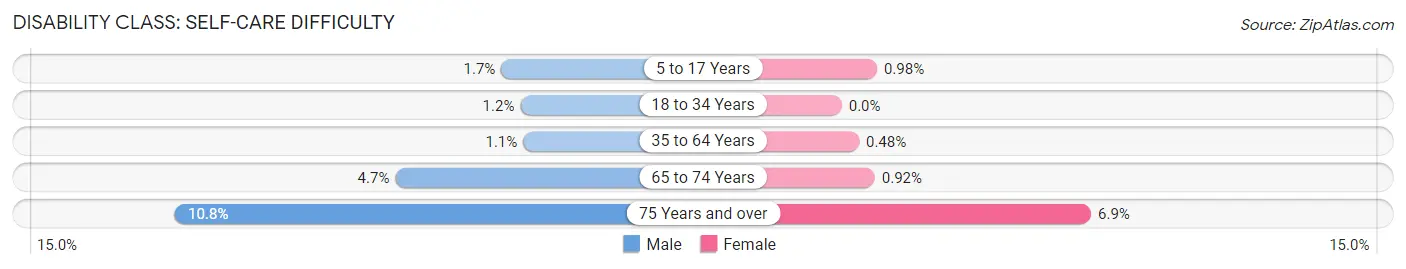
| Age Bracket | Male | Female |
| 5 to 17 Years | 43 (1.7%) | 25 (1.0%) |
| 18 to 34 Years | 69 (1.2%) | 0 (0.0%) |
| 35 to 64 Years | 88 (1.1%) | 40 (0.5%) |
| 65 to 74 Years | 81 (4.7%) | 18 (0.9%) |
| 75 Years and over | 91 (10.8%) | 123 (6.9%) |
Technology Access in Woburn
Computing Device Access in Woburn
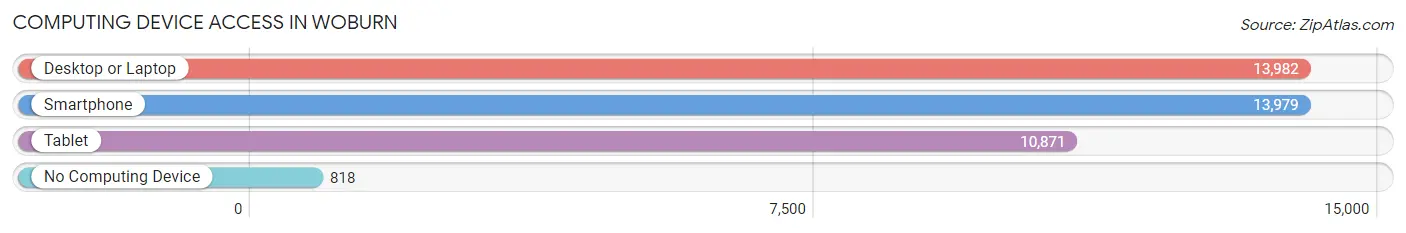
| Device Type | # Households | % Households |
| Desktop or Laptop | 13,982 | 86.7% |
| Smartphone | 13,979 | 86.7% |
| Tablet | 10,871 | 67.4% |
| No Computing Device | 818 | 5.1% |
| Total | 16,121 | 100.0% |
Internet Access in Woburn
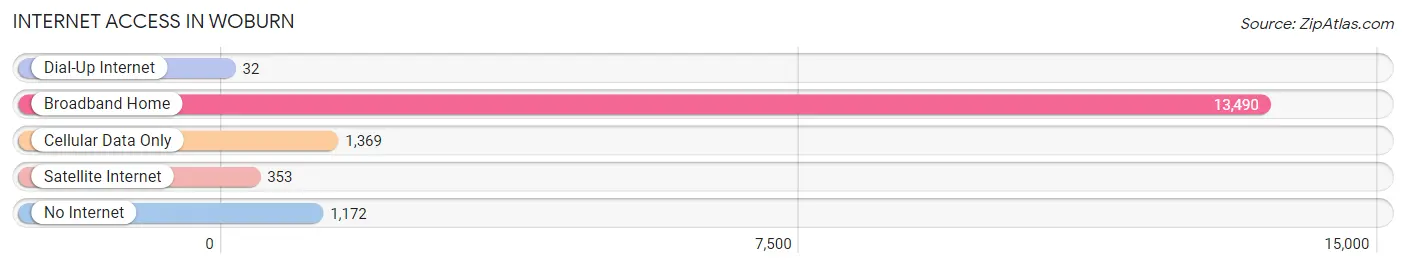
| Internet Type | # Households | % Households |
| Dial-Up Internet | 32 | 0.2% |
| Broadband Home | 13,490 | 83.7% |
| Cellular Data Only | 1,369 | 8.5% |
| Satellite Internet | 353 | 2.2% |
| No Internet | 1,172 | 7.3% |
| Total | 16,121 | 100.0% |
Woburn Summary
Woburn, Massachusetts is a city located in Middlesex County, approximately 10 miles northwest of Boston. It is bordered by the towns of Winchester, Burlington, Lexington, and Wilmington. The city has a population of 38,120, according to the 2010 census, and is part of the Greater Boston metropolitan area.
History
The area that is now Woburn was first settled in 1640 by settlers from the Massachusetts Bay Colony. The town was originally part of Charlestown, but was incorporated as its own town in 1642. The town was named after Woburn, Bedfordshire, England, the hometown of the first settlers.
In the 19th century, Woburn became an important industrial center, with several tanneries, shoe factories, and other industries. The city was also home to the first public water supply system in the United States, which was established in 1848.
Geography
Woburn is located in eastern Massachusetts, approximately 10 miles northwest of Boston. It is bordered by the towns of Winchester, Burlington, Lexington, and Wilmington. The city has a total area of 8.3 square miles, of which 8.2 square miles is land and 0.1 square miles is water.
The city is located in the Mystic River Valley, and is drained by the Aberjona River and its tributaries. The city is located on the edge of the Middlesex Fells Reservation, a 2,575-acre park that is managed by the Massachusetts Department of Conservation and Recreation.
Economy
Woburn is home to a variety of businesses and industries, including manufacturing, retail, healthcare, and technology. The city is home to several large companies, including Raytheon, EMC Corporation, and Boston Scientific.
The city is also home to several shopping centers, including the Woburn Mall, which is anchored by Macy's, Sears, and JCPenney. The city is also home to several restaurants, bars, and entertainment venues.
Demographics
As of the 2010 census, there were 38,120 people, 15,845 households, and 9,945 families residing in the city. The population density was 4,622.3 people per square mile. The racial makeup of the city was 87.2% White, 4.2% African American, 0.2% Native American, 5.2% Asian, 0.03% Pacific Islander, 1.3% from other races, and 2.1% from two or more races. Hispanic or Latino of any race were 4.3% of the population.
The median income for a household in the city was $63,837, and the median income for a family was $76,945. The per capita income for the city was $30,890. About 4.3% of families and 6.2% of the population were below the poverty line, including 8.2% of those under age 18 and 5.2% of those age 65 or over.
Common Questions
What is Per Capita Income in Woburn?
Per Capita income in Woburn is $54,578.
What is the Median Family Income in Woburn?
Median Family Income in Woburn is $127,328.
What is the Median Household income in Woburn?
Median Household Income in Woburn is $104,780.
What is Income or Wage Gap in Woburn?
Income or Wage Gap in Woburn is 38.7%.
Women in Woburn earn 61.3 cents for every dollar earned by a man.
What is Inequality or Gini Index in Woburn?
Inequality or Gini Index in Woburn is 0.43.
What is the Total Population of Woburn?
Total Population of Woburn is 40,992.
What is the Total Male Population of Woburn?
Total Male Population of Woburn is 20,032.
What is the Total Female Population of Woburn?
Total Female Population of Woburn is 20,960.
What is the Ratio of Males per 100 Females in Woburn?
There are 95.57 Males per 100 Females in Woburn.
What is the Ratio of Females per 100 Males in Woburn?
There are 104.63 Females per 100 Males in Woburn.
What is the Median Population Age in Woburn?
Median Population Age in Woburn is 39.2 Years.
What is the Average Family Size in Woburn
Average Family Size in Woburn is 3.1 People.
What is the Average Household Size in Woburn
Average Household Size in Woburn is 2.5 People.
How Large is the Labor Force in Woburn?
There are 24,895 People in the Labor Forcein in Woburn.
What is the Percentage of People in the Labor Force in Woburn?
72.2% of People are in the Labor Force in Woburn.
What is the Unemployment Rate in Woburn?
Unemployment Rate in Woburn is 7.4%.