Cities with the Highest Percentage of Self-Employed / Incorporated in Massachusetts
RELATED REPORTS & OPTIONS
Self-Employed / Incorporated
Massachusetts
Compare Cities
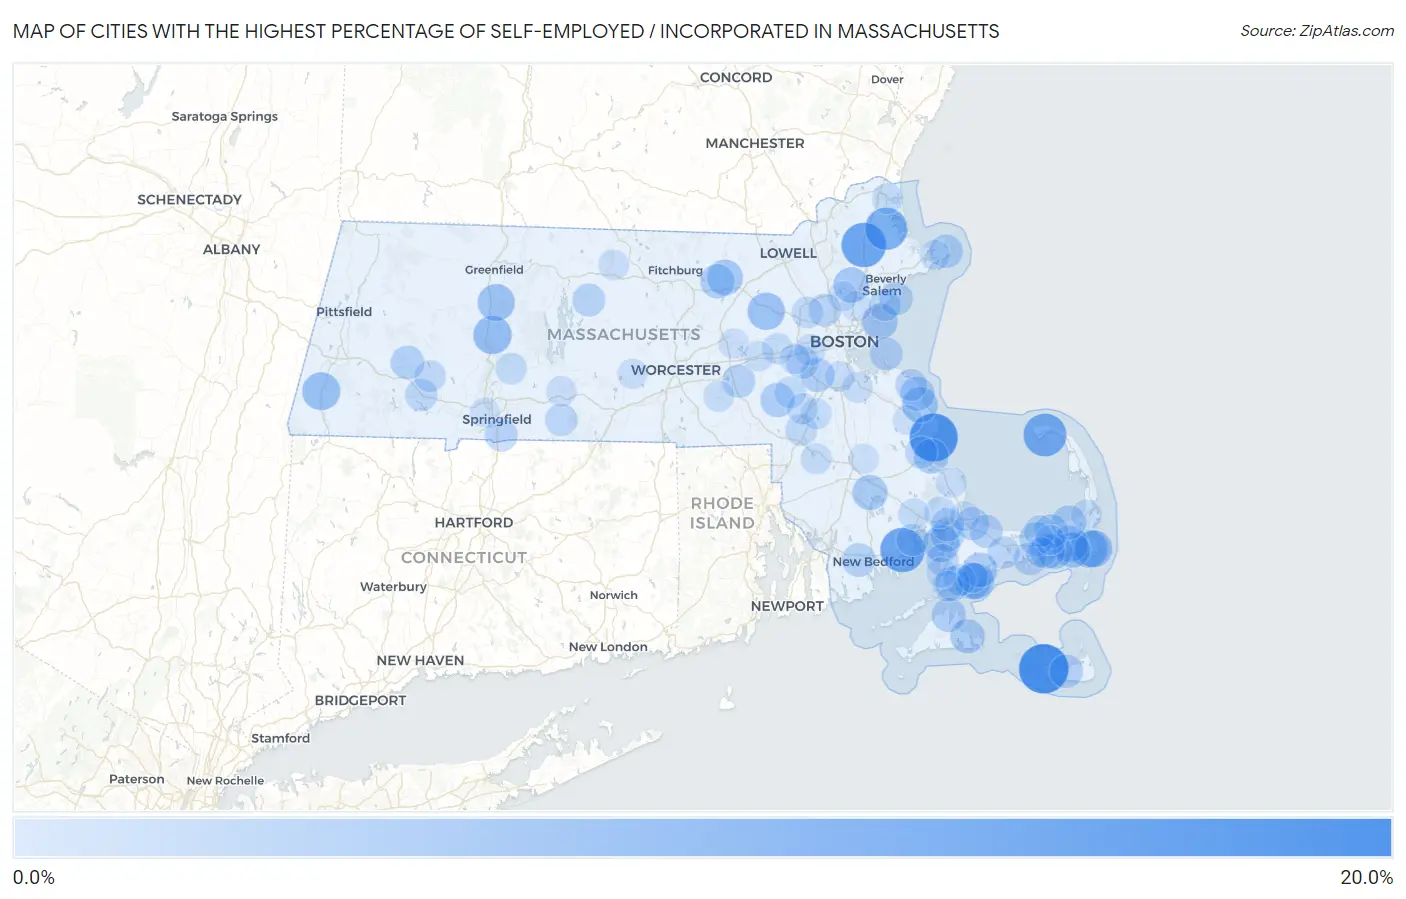
Map of Cities with the Highest Percentage of Self-Employed / Incorporated in Massachusetts
0.0%
20.0%
Cities with the Highest Percentage of Self-Employed / Incorporated in Massachusetts
| City | % Self-Employed / Incorporated | vs State | vs National | |
| 1. | Madaket | 19.9% | 3.2%(+16.7)#1 | 3.8%(+16.1)#634 |
| 2. | Duxbury | 18.7% | 3.2%(+15.5)#2 | 3.8%(+14.9)#720 |
| 3. | Boxford | 15.7% | 3.2%(+12.5)#3 | 3.8%(+11.9)#988 |
| 4. | Mattapoisett Center | 15.6% | 3.2%(+12.4)#4 | 3.8%(+11.7)#1,001 |
| 5. | Provincetown | 14.4% | 3.2%(+11.2)#5 | 3.8%(+10.6)#1,161 |
| 6. | Rowley | 13.9% | 3.2%(+10.6)#6 | 3.8%(+10.0)#1,259 |
| 7. | Oak Bluffs | 11.7% | 3.2%(+8.45)#7 | 3.8%(+7.85)#1,747 |
| 8. | Hatfield | 10.5% | 3.2%(+7.25)#8 | 3.8%(+6.64)#2,117 |
| 9. | West Chatham | 10.1% | 3.2%(+6.89)#9 | 3.8%(+6.29)#2,223 |
| 10. | Great Barrington | 10.1% | 3.2%(+6.89)#10 | 3.8%(+6.28)#2,224 |
| 11. | West Concord | 9.7% | 3.2%(+6.51)#11 | 3.8%(+5.90)#2,397 |
| 12. | Chatham | 9.6% | 3.2%(+6.42)#12 | 3.8%(+5.81)#2,435 |
| 13. | South Deerfield | 9.4% | 3.2%(+6.20)#13 | 3.8%(+5.60)#2,511 |
| 14. | Pocasset | 9.2% | 3.2%(+5.95)#14 | 3.8%(+5.34)#2,617 |
| 15. | Harwich Center | 8.8% | 3.2%(+5.63)#15 | 3.8%(+5.03)#2,796 |
| 16. | Monomoscoy Island | 8.8% | 3.2%(+5.61)#16 | 3.8%(+5.01)#2,810 |
| 17. | New Seabury | 8.5% | 3.2%(+5.29)#17 | 3.8%(+4.68)#2,988 |
| 18. | Ayer | 8.5% | 3.2%(+5.26)#18 | 3.8%(+4.66)#3,013 |
| 19. | Marshfield Hills | 8.4% | 3.2%(+5.17)#19 | 3.8%(+4.56)#3,060 |
| 20. | Nahant | 8.3% | 3.2%(+5.05)#20 | 3.8%(+4.45)#3,155 |
| 21. | Lynnfield | 8.3% | 3.2%(+5.04)#21 | 3.8%(+4.44)#3,168 |
| 22. | Cedar Crest | 8.2% | 3.2%(+4.97)#22 | 3.8%(+4.36)#3,224 |
| 23. | Harwich Port | 8.0% | 3.2%(+4.83)#23 | 3.8%(+4.23)#3,312 |
| 24. | North Lakeville | 7.9% | 3.2%(+4.72)#24 | 3.8%(+4.12)#3,390 |
| 25. | Dennis Port | 7.7% | 3.2%(+4.54)#25 | 3.8%(+3.93)#3,527 |
| 26. | North Plymouth | 7.7% | 3.2%(+4.44)#26 | 3.8%(+3.84)#3,614 |
| 27. | West Dennis | 7.6% | 3.2%(+4.41)#27 | 3.8%(+3.80)#3,650 |
| 28. | Mashpee Neck | 7.5% | 3.2%(+4.32)#28 | 3.8%(+3.71)#3,713 |
| 29. | Teaticket | 7.4% | 3.2%(+4.22)#29 | 3.8%(+3.61)#3,792 |
| 30. | Devens | 7.3% | 3.2%(+4.10)#30 | 3.8%(+3.49)#3,902 |
| 31. | Edgartown | 7.3% | 3.2%(+4.07)#31 | 3.8%(+3.47)#3,921 |
| 32. | Scituate | 7.3% | 3.2%(+4.06)#32 | 3.8%(+3.45)#3,944 |
| 33. | Brewster | 7.3% | 3.2%(+4.04)#33 | 3.8%(+3.44)#3,952 |
| 34. | Millis Clicquot | 7.2% | 3.2%(+4.02)#34 | 3.8%(+3.41)#3,977 |
| 35. | Vineyard Haven | 7.1% | 3.2%(+3.87)#35 | 3.8%(+3.27)#4,099 |
| 36. | East Dennis | 7.1% | 3.2%(+3.86)#36 | 3.8%(+3.25)#4,108 |
| 37. | Dedham | 6.9% | 3.2%(+3.74)#37 | 3.8%(+3.13)#4,215 |
| 38. | Yarmouth Port | 6.8% | 3.2%(+3.59)#38 | 3.8%(+2.99)#4,381 |
| 39. | Chester | 6.8% | 3.2%(+3.55)#39 | 3.8%(+2.94)#4,424 |
| 40. | Smith Mills | 6.7% | 3.2%(+3.49)#40 | 3.8%(+2.88)#4,494 |
| 41. | Rockport | 6.7% | 3.2%(+3.46)#41 | 3.8%(+2.85)#4,510 |
| 42. | Nantucket | 6.6% | 3.2%(+3.38)#42 | 3.8%(+2.77)#4,608 |
| 43. | Monument Beach | 6.5% | 3.2%(+3.31)#43 | 3.8%(+2.70)#4,673 |
| 44. | Marblehead | 6.5% | 3.2%(+3.27)#44 | 3.8%(+2.66)#4,714 |
| 45. | Sandwich | 6.4% | 3.2%(+3.17)#45 | 3.8%(+2.56)#4,809 |
| 46. | Hopkinton | 6.4% | 3.2%(+3.14)#46 | 3.8%(+2.54)#4,825 |
| 47. | East Sandwich | 6.3% | 3.2%(+3.11)#47 | 3.8%(+2.50)#4,882 |
| 48. | West Yarmouth | 6.3% | 3.2%(+3.08)#48 | 3.8%(+2.47)#4,908 |
| 49. | Petersham | 6.2% | 3.2%(+3.00)#49 | 3.8%(+2.39)#5,027 |
| 50. | Hull | 6.2% | 3.2%(+2.97)#50 | 3.8%(+2.36)#5,055 |
| 51. | Longmeadow | 6.1% | 3.2%(+2.91)#51 | 3.8%(+2.31)#5,117 |
| 52. | Winchester | 6.1% | 3.2%(+2.87)#52 | 3.8%(+2.26)#5,181 |
| 53. | Buzzards Bay | 6.0% | 3.2%(+2.84)#53 | 3.8%(+2.23)#5,227 |
| 54. | Needham | 6.0% | 3.2%(+2.82)#54 | 3.8%(+2.21)#5,255 |
| 55. | Blandford | 5.7% | 3.2%(+2.47)#55 | 3.8%(+1.86)#5,723 |
| 56. | Barnstable Town | 5.6% | 3.2%(+2.41)#56 | 3.8%(+1.80)#5,801 |
| 57. | Monson Center | 5.6% | 3.2%(+2.40)#57 | 3.8%(+1.79)#5,816 |
| 58. | Kingston | 5.5% | 3.2%(+2.28)#58 | 3.8%(+1.68)#5,986 |
| 59. | North Falmouth | 5.5% | 3.2%(+2.28)#59 | 3.8%(+1.67)#5,993 |
| 60. | Swampscott | 5.5% | 3.2%(+2.25)#60 | 3.8%(+1.65)#6,030 |
| 61. | Marion Center | 5.4% | 3.2%(+2.22)#61 | 3.8%(+1.61)#6,086 |
| 62. | North Scituate | 5.4% | 3.2%(+2.18)#62 | 3.8%(+1.57)#6,142 |
| 63. | East Falmouth | 5.3% | 3.2%(+2.05)#63 | 3.8%(+1.45)#6,335 |
| 64. | Dennis | 5.2% | 3.2%(+2.03)#64 | 3.8%(+1.43)#6,378 |
| 65. | Huntington | 5.2% | 3.2%(+1.99)#65 | 3.8%(+1.39)#6,435 |
| 66. | Foxborough | 5.2% | 3.2%(+1.99)#66 | 3.8%(+1.38)#6,441 |
| 67. | Lexington | 5.2% | 3.2%(+1.97)#67 | 3.8%(+1.36)#6,480 |
| 68. | Medfield | 5.0% | 3.2%(+1.84)#68 | 3.8%(+1.23)#6,691 |
| 69. | White Island Shores | 5.0% | 3.2%(+1.81)#69 | 3.8%(+1.20)#6,739 |
| 70. | Granby | 4.9% | 3.2%(+1.71)#70 | 3.8%(+1.11)#6,914 |
| 71. | Cochituate | 4.8% | 3.2%(+1.57)#71 | 3.8%(+0.966)#7,153 |
| 72. | Newton | 4.7% | 3.2%(+1.54)#72 | 3.8%(+0.932)#7,218 |
| 73. | West Wareham | 4.6% | 3.2%(+1.40)#73 | 3.8%(+0.795)#7,490 |
| 74. | Sharon | 4.6% | 3.2%(+1.39)#74 | 3.8%(+0.780)#7,521 |
| 75. | Norton Center | 4.6% | 3.2%(+1.38)#75 | 3.8%(+0.771)#7,531 |
| 76. | Walpole | 4.6% | 3.2%(+1.35)#76 | 3.8%(+0.745)#7,587 |
| 77. | Newburyport | 4.6% | 3.2%(+1.35)#77 | 3.8%(+0.740)#7,598 |
| 78. | The Pinehills | 4.5% | 3.2%(+1.28)#78 | 3.8%(+0.674)#7,744 |
| 79. | Falmouth | 4.5% | 3.2%(+1.26)#79 | 3.8%(+0.651)#7,806 |
| 80. | Upton | 4.5% | 3.2%(+1.25)#80 | 3.8%(+0.642)#7,821 |
| 81. | Orleans | 4.4% | 3.2%(+1.23)#81 | 3.8%(+0.624)#7,852 |
| 82. | Braintree Town | 4.4% | 3.2%(+1.23)#82 | 3.8%(+0.623)#7,854 |
| 83. | Gloucester | 4.4% | 3.2%(+1.17)#83 | 3.8%(+0.560)#7,977 |
| 84. | Seabrook | 4.2% | 3.2%(+1.04)#84 | 3.8%(+0.432)#8,289 |
| 85. | Wellesley | 4.2% | 3.2%(+1.03)#85 | 3.8%(+0.428)#8,297 |
| 86. | Baldwinville | 4.2% | 3.2%(+1.03)#86 | 3.8%(+0.426)#8,300 |
| 87. | Palmer Town | 4.2% | 3.2%(+1.01)#87 | 3.8%(+0.405)#8,339 |
| 88. | Marlborough | 4.2% | 3.2%(+0.962)#88 | 3.8%(+0.355)#8,460 |
| 89. | West Falmouth | 4.1% | 3.2%(+0.920)#89 | 3.8%(+0.313)#8,566 |
| 90. | Spencer | 4.1% | 3.2%(+0.906)#90 | 3.8%(+0.299)#8,596 |
| 91. | Framingham | 4.0% | 3.2%(+0.829)#91 | 3.8%(+0.222)#8,781 |
| 92. | Milton | 4.0% | 3.2%(+0.816)#92 | 3.8%(+0.209)#8,814 |
| 93. | South Yarmouth | 4.0% | 3.2%(+0.802)#93 | 3.8%(+0.195)#8,842 |
| 94. | North Pembroke | 4.0% | 3.2%(+0.768)#94 | 3.8%(+0.161)#8,947 |
| 95. | Saugus | 4.0% | 3.2%(+0.760)#95 | 3.8%(+0.154)#8,965 |
| 96. | Wakefield | 4.0% | 3.2%(+0.745)#96 | 3.8%(+0.139)#8,995 |
| 97. | West Springfield Town | 3.9% | 3.2%(+0.732)#97 | 3.8%(+0.125)#9,038 |
| 98. | Bridgewater Town | 3.9% | 3.2%(+0.731)#98 | 3.8%(+0.125)#9,039 |
| 99. | South Dennis | 3.9% | 3.2%(+0.725)#99 | 3.8%(+0.118)#9,054 |
| 100. | Sagamore | 3.9% | 3.2%(+0.649)#100 | 3.8%(+0.042)#9,239 |
Common Questions
What are the Top 10 Cities with the Highest Percentage of Self-Employed / Incorporated in Massachusetts?
Top 10 Cities with the Highest Percentage of Self-Employed / Incorporated in Massachusetts are:
#1
19.9%
#2
18.7%
#3
15.7%
#4
15.6%
#5
14.4%
#6
13.9%
#7
10.5%
#8
10.1%
#9
10.1%
#10
9.7%
What city has the Highest Percentage of Self-Employed / Incorporated in Massachusetts?
Madaket has the Highest Percentage of Self-Employed / Incorporated in Massachusetts with 19.9%.
What is the Percentage of Self-Employed / Incorporated in the State of Massachusetts?
Percentage of Self-Employed / Incorporated in Massachusetts is 3.2%.
What is the Percentage of Self-Employed / Incorporated in the United States?
Percentage of Self-Employed / Incorporated in the United States is 3.8%.