Cities with the Highest Female Poverty Level in Massachusetts
RELATED REPORTS & OPTIONS
Highest Poverty | Female
Massachusetts
Compare Cities
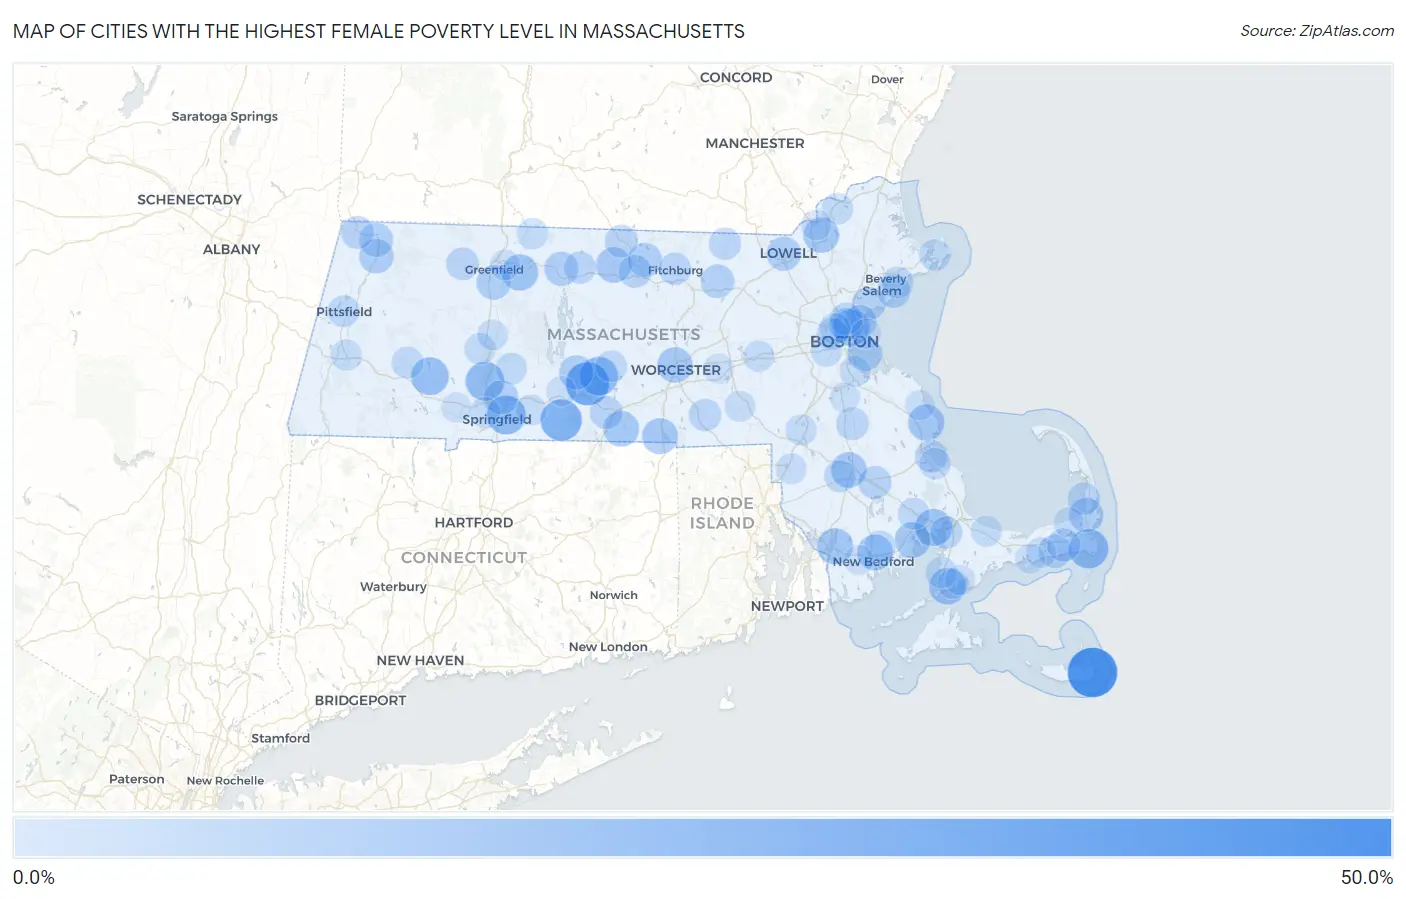
Map of Cities with the Highest Female Poverty Level in Massachusetts
0.0%
50.0%
Cities with the Highest Female Poverty Level in Massachusetts
| City | Female Poverty | vs State | vs National | |
| 1. | Siasconset | 50.0% | 10.8%(+39.2)#1 | 13.7%(+36.3)#1,162 |
| 2. | Warren | 36.3% | 10.8%(+25.5)#2 | 13.7%(+22.6)#2,665 |
| 3. | Monson Center | 32.5% | 10.8%(+21.7)#3 | 13.7%(+18.8)#3,477 |
| 4. | West Chatham | 28.5% | 10.8%(+17.7)#4 | 13.7%(+14.8)#4,617 |
| 5. | Springfield | 27.7% | 10.8%(+16.9)#5 | 13.7%(+14.0)#4,883 |
| 6. | Holyoke | 26.9% | 10.8%(+16.1)#6 | 13.7%(+13.2)#5,156 |
| 7. | West Brookfield | 26.8% | 10.8%(+16.0)#7 | 13.7%(+13.1)#5,190 |
| 8. | Huntington | 25.0% | 10.8%(+14.2)#8 | 13.7%(+11.3)#5,926 |
| 9. | Oak Bluffs | 24.4% | 10.8%(+13.6)#9 | 13.7%(+10.7)#6,273 |
| 10. | Onset | 23.4% | 10.8%(+12.6)#10 | 13.7%(+9.72)#6,737 |
| 11. | Chelsea | 23.1% | 10.8%(+12.3)#11 | 13.7%(+9.38)#6,925 |
| 12. | Falmouth | 22.8% | 10.8%(+12.0)#12 | 13.7%(+9.07)#7,087 |
| 13. | Millers Falls | 22.1% | 10.8%(+11.3)#13 | 13.7%(+8.38)#7,482 |
| 14. | Marshfield | 22.0% | 10.8%(+11.2)#14 | 13.7%(+8.27)#7,542 |
| 15. | Fall River | 21.4% | 10.8%(+10.6)#15 | 13.7%(+7.71)#7,848 |
| 16. | Amherst | 21.3% | 10.8%(+10.5)#16 | 13.7%(+7.62)#7,909 |
| 17. | Webster | 21.1% | 10.8%(+10.3)#17 | 13.7%(+7.43)#8,022 |
| 18. | Marion Center | 20.9% | 10.8%(+10.1)#18 | 13.7%(+7.25)#8,135 |
| 19. | Lawrence | 20.7% | 10.8%(+9.94)#19 | 13.7%(+7.03)#8,263 |
| 20. | New Bedford | 20.7% | 10.8%(+9.92)#20 | 13.7%(+7.02)#8,268 |
| 21. | Raynham Center | 20.7% | 10.8%(+9.90)#21 | 13.7%(+6.99)#8,277 |
| 22. | Southbridge Town | 20.6% | 10.8%(+9.84)#22 | 13.7%(+6.93)#8,322 |
| 23. | Baldwinville | 20.5% | 10.8%(+9.71)#23 | 13.7%(+6.81)#8,410 |
| 24. | Worcester | 20.4% | 10.8%(+9.61)#24 | 13.7%(+6.70)#8,482 |
| 25. | Boston | 18.5% | 10.8%(+7.72)#25 | 13.7%(+4.82)#9,841 |
| 26. | Deerfield | 18.3% | 10.8%(+7.48)#26 | 13.7%(+4.58)#10,006 |
| 27. | Orleans | 18.2% | 10.8%(+7.41)#27 | 13.7%(+4.51)#10,061 |
| 28. | Adams | 18.2% | 10.8%(+7.39)#28 | 13.7%(+4.49)#10,069 |
| 29. | Ware | 18.1% | 10.8%(+7.34)#29 | 13.7%(+4.44)#10,123 |
| 30. | Lowell | 17.7% | 10.8%(+6.91)#30 | 13.7%(+4.01)#10,423 |
| 31. | Orange | 17.7% | 10.8%(+6.88)#31 | 13.7%(+3.98)#10,435 |
| 32. | Greenfield | 17.6% | 10.8%(+6.85)#32 | 13.7%(+3.95)#10,452 |
| 33. | South Ashburnham | 17.4% | 10.8%(+6.61)#33 | 13.7%(+3.71)#10,653 |
| 34. | Chicopee | 17.4% | 10.8%(+6.58)#34 | 13.7%(+3.68)#10,676 |
| 35. | North Adams | 17.1% | 10.8%(+6.33)#35 | 13.7%(+3.42)#10,889 |
| 36. | Devens | 16.6% | 10.8%(+5.78)#36 | 13.7%(+2.87)#11,369 |
| 37. | Dennis Port | 16.3% | 10.8%(+5.46)#37 | 13.7%(+2.55)#11,637 |
| 38. | Everett | 16.2% | 10.8%(+5.36)#38 | 13.7%(+2.45)#11,733 |
| 39. | Lynn | 16.1% | 10.8%(+5.29)#39 | 13.7%(+2.38)#11,798 |
| 40. | Salem | 16.0% | 10.8%(+5.25)#40 | 13.7%(+2.34)#11,835 |
| 41. | Northwest Harwich | 15.5% | 10.8%(+4.74)#41 | 13.7%(+1.84)#12,244 |
| 42. | Gardner | 15.4% | 10.8%(+4.58)#42 | 13.7%(+1.67)#12,424 |
| 43. | Middleborough Center | 15.2% | 10.8%(+4.42)#43 | 13.7%(+1.52)#12,565 |
| 44. | Revere | 15.1% | 10.8%(+4.29)#44 | 13.7%(+1.39)#12,668 |
| 45. | Williamstown | 15.1% | 10.8%(+4.28)#45 | 13.7%(+1.38)#12,678 |
| 46. | Fiskdale | 14.8% | 10.8%(+3.99)#46 | 13.7%(+1.08)#12,943 |
| 47. | Shelburne Falls | 14.7% | 10.8%(+3.92)#47 | 13.7%(+1.02)#13,001 |
| 48. | Winchendon | 14.7% | 10.8%(+3.90)#48 | 13.7%(+0.999)#13,021 |
| 49. | North Plymouth | 14.6% | 10.8%(+3.80)#49 | 13.7%(+0.899)#13,095 |
| 50. | Brockton | 14.4% | 10.8%(+3.61)#50 | 13.7%(+0.702)#13,259 |
| 51. | North Eastham | 14.2% | 10.8%(+3.38)#51 | 13.7%(+0.476)#13,504 |
| 52. | Whitinsville | 14.0% | 10.8%(+3.24)#52 | 13.7%(+0.333)#13,618 |
| 53. | Fitchburg | 14.0% | 10.8%(+3.16)#53 | 13.7%(+0.256)#13,682 |
| 54. | Malden | 13.9% | 10.8%(+3.14)#54 | 13.7%(+0.238)#13,708 |
| 55. | Bourne | 13.8% | 10.8%(+3.00)#55 | 13.7%(+0.101)#13,842 |
| 56. | Pepperell | 13.8% | 10.8%(+2.99)#56 | 13.7%(+0.082)#13,859 |
| 57. | Athol | 13.8% | 10.8%(+2.98)#57 | 13.7%(+0.078)#13,861 |
| 58. | Green Harbor | 13.1% | 10.8%(+2.32)#58 | 13.7%(-0.581)#14,515 |
| 59. | West Wareham | 13.0% | 10.8%(+2.21)#59 | 13.7%(-0.692)#14,629 |
| 60. | Taunton | 13.0% | 10.8%(+2.16)#60 | 13.7%(-0.748)#14,697 |
| 61. | Beverly | 12.9% | 10.8%(+2.07)#61 | 13.7%(-0.832)#14,784 |
| 62. | Chester | 12.8% | 10.8%(+1.98)#62 | 13.7%(-0.929)#14,877 |
| 63. | Pittsfield | 12.8% | 10.8%(+1.96)#63 | 13.7%(-0.948)#14,898 |
| 64. | Cambridge | 12.7% | 10.8%(+1.93)#64 | 13.7%(-0.974)#14,921 |
| 65. | North Brookfield | 12.5% | 10.8%(+1.75)#65 | 13.7%(-1.15)#15,069 |
| 66. | Gloucester | 12.5% | 10.8%(+1.74)#66 | 13.7%(-1.16)#15,080 |
| 67. | Granby | 12.4% | 10.8%(+1.61)#67 | 13.7%(-1.30)#15,227 |
| 68. | West Warren | 12.4% | 10.8%(+1.58)#68 | 13.7%(-1.32)#15,265 |
| 69. | West Falmouth | 12.3% | 10.8%(+1.50)#69 | 13.7%(-1.40)#15,342 |
| 70. | Haverhill | 12.2% | 10.8%(+1.37)#70 | 13.7%(-1.54)#15,496 |
| 71. | Northampton | 12.0% | 10.8%(+1.22)#71 | 13.7%(-1.68)#15,642 |
| 72. | Acushnet Center | 12.0% | 10.8%(+1.16)#72 | 13.7%(-1.75)#15,723 |
| 73. | Northfield | 11.9% | 10.8%(+1.12)#73 | 13.7%(-1.79)#15,757 |
| 74. | Somerville | 11.9% | 10.8%(+1.11)#74 | 13.7%(-1.79)#15,763 |
| 75. | Plymouth | 11.9% | 10.8%(+1.08)#75 | 13.7%(-1.82)#15,798 |
| 76. | Framingham | 11.7% | 10.8%(+0.950)#76 | 13.7%(-1.95)#15,952 |
| 77. | Lee | 11.6% | 10.8%(+0.825)#77 | 13.7%(-2.08)#16,097 |
| 78. | Foxborough | 11.6% | 10.8%(+0.821)#78 | 13.7%(-2.08)#16,101 |
| 79. | East Sandwich | 11.3% | 10.8%(+0.529)#79 | 13.7%(-2.37)#16,410 |
| 80. | Quincy | 11.3% | 10.8%(+0.520)#80 | 13.7%(-2.38)#16,423 |
| 81. | Brookline | 11.2% | 10.8%(+0.410)#81 | 13.7%(-2.49)#16,544 |
| 82. | West Springfield Town | 11.2% | 10.8%(+0.371)#82 | 13.7%(-2.53)#16,592 |
| 83. | Wilbraham | 10.9% | 10.8%(+0.143)#83 | 13.7%(-2.76)#16,845 |
| 84. | Hatfield | 10.7% | 10.8%(-0.086)#84 | 13.7%(-2.99)#17,113 |
| 85. | Milford | 10.6% | 10.8%(-0.179)#85 | 13.7%(-3.08)#17,201 |
| 86. | Attleboro | 10.5% | 10.8%(-0.255)#86 | 13.7%(-3.16)#17,289 |
| 87. | South Yarmouth | 10.2% | 10.8%(-0.549)#87 | 13.7%(-3.45)#17,638 |
| 88. | Methuen Town | 10.2% | 10.8%(-0.561)#88 | 13.7%(-3.46)#17,654 |
| 89. | Brewster | 10.2% | 10.8%(-0.582)#89 | 13.7%(-3.49)#17,675 |
| 90. | Turners Falls | 10.1% | 10.8%(-0.733)#90 | 13.7%(-3.64)#17,833 |
| 91. | Teaticket | 10.0% | 10.8%(-0.759)#91 | 13.7%(-3.66)#17,857 |
| 92. | East Falmouth | 9.9% | 10.8%(-0.891)#92 | 13.7%(-3.79)#18,035 |
| 93. | Westfield | 9.7% | 10.8%(-1.09)#93 | 13.7%(-3.99)#18,259 |
| 94. | Marshfield Hills | 9.7% | 10.8%(-1.11)#94 | 13.7%(-4.02)#18,292 |
| 95. | Westborough | 9.6% | 10.8%(-1.18)#95 | 13.7%(-4.08)#18,367 |
| 96. | Randolph Town | 9.6% | 10.8%(-1.20)#96 | 13.7%(-4.11)#18,397 |
| 97. | Smith Mills | 9.5% | 10.8%(-1.26)#97 | 13.7%(-4.16)#18,465 |
| 98. | Winthrop Town | 9.5% | 10.8%(-1.27)#98 | 13.7%(-4.17)#18,479 |
| 99. | West Yarmouth | 9.5% | 10.8%(-1.34)#99 | 13.7%(-4.24)#18,571 |
| 100. | Palmer Town | 9.5% | 10.8%(-1.34)#100 | 13.7%(-4.25)#18,577 |
Common Questions
What are the Top 10 Cities with the Highest Female Poverty Level in Massachusetts?
Top 10 Cities with the Highest Female Poverty Level in Massachusetts are:
#1
50.0%
#2
36.3%
#3
32.5%
#4
28.5%
#5
27.7%
#6
26.9%
#7
26.8%
#8
25.0%
#9
23.4%
#10
23.1%
What city has the Highest Female Poverty Level in Massachusetts?
Siasconset has the Highest Female Poverty Level in Massachusetts with 50.0%.
What is the Poverty Level Among Females in the State of Massachusetts?
Poverty Level Among Females in Massachusetts is 10.8%.
What is the Poverty Level Among Females in the United States?
Poverty Level Among Females in the United States is 13.7%.