Cities with the Highest Percentage of Ecuadorian Population in Massachusetts
RELATED REPORTS & OPTIONS
Ecuadorian
Massachusetts
Compare Cities
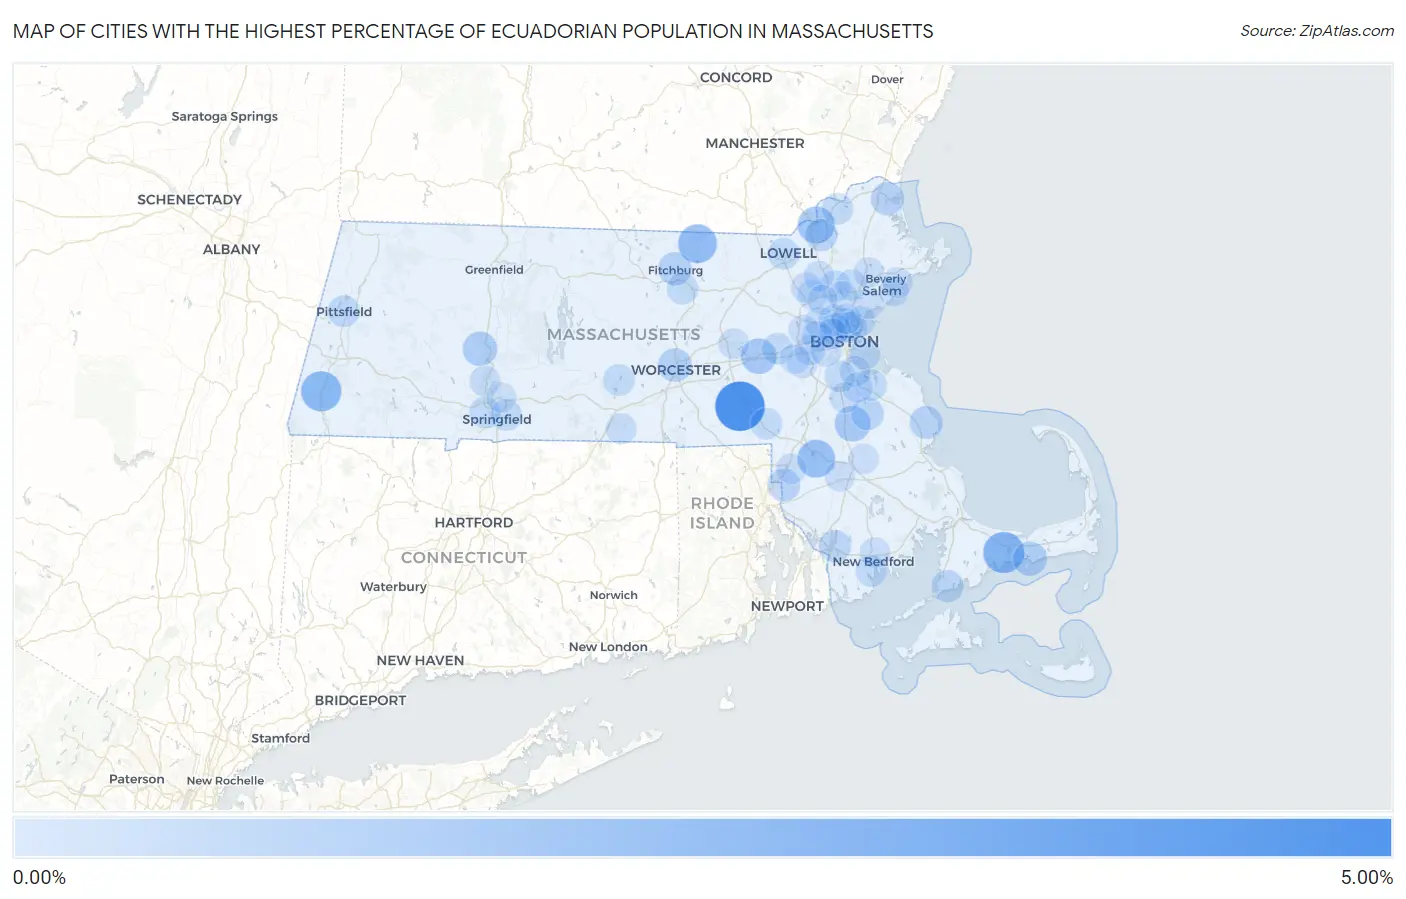
Map of Cities with the Highest Percentage of Ecuadorian Population in Massachusetts
0.00%
5.00%
Cities with the Highest Percentage of Ecuadorian Population in Massachusetts
| City | Ecuadorian | vs State | vs National | |
| 1. | Milford | 4.93% | 0.26%(+4.66)#1 | 0.24%(+4.68)#89 |
| 2. | Barnstable Town | 2.74% | 0.26%(+2.47)#2 | 0.24%(+2.49)#169 |
| 3. | Great Barrington | 2.49% | 0.26%(+2.22)#3 | 0.24%(+2.24)#197 |
| 4. | Townsend | 2.12% | 0.26%(+1.86)#4 | 0.24%(+1.88)#241 |
| 5. | Norton Center | 1.86% | 0.26%(+1.60)#5 | 0.24%(+1.62)#290 |
| 6. | Methuen Town | 1.69% | 0.26%(+1.43)#6 | 0.24%(+1.45)#321 |
| 7. | Brockton | 1.34% | 0.26%(+1.08)#7 | 0.24%(+1.10)#418 |
| 8. | Framingham | 1.31% | 0.26%(+1.04)#8 | 0.24%(+1.06)#430 |
| 9. | Northampton | 1.06% | 0.26%(+0.792)#9 | 0.24%(+0.812)#526 |
| 10. | West Yarmouth | 1.00% | 0.26%(+0.737)#10 | 0.24%(+0.758)#543 |
| 11. | Worcester | 0.85% | 0.26%(+0.583)#11 | 0.24%(+0.603)#626 |
| 12. | Fitchburg | 0.78% | 0.26%(+0.518)#12 | 0.24%(+0.538)#672 |
| 13. | Newburyport | 0.77% | 0.26%(+0.511)#13 | 0.24%(+0.531)#684 |
| 14. | Marshfield | 0.74% | 0.26%(+0.477)#14 | 0.24%(+0.497)#718 |
| 15. | Amherst | 0.70% | 0.26%(+0.438)#15 | 0.24%(+0.458)#757 |
| 16. | Everett | 0.70% | 0.26%(+0.438)#16 | 0.24%(+0.458)#758 |
| 17. | North Seekonk | 0.66% | 0.26%(+0.397)#17 | 0.24%(+0.418)#802 |
| 18. | Abington | 0.60% | 0.26%(+0.337)#18 | 0.24%(+0.357)#867 |
| 19. | Lawrence | 0.55% | 0.26%(+0.288)#19 | 0.24%(+0.308)#932 |
| 20. | Falmouth | 0.54% | 0.26%(+0.278)#20 | 0.24%(+0.298)#951 |
| 21. | Fall River | 0.52% | 0.26%(+0.261)#21 | 0.24%(+0.282)#970 |
| 22. | North Attleborough | 0.47% | 0.26%(+0.212)#22 | 0.24%(+0.232)#1,035 |
| 23. | Pittsfield | 0.40% | 0.26%(+0.135)#23 | 0.24%(+0.155)#1,154 |
| 24. | East Brookfield | 0.37% | 0.26%(+0.109)#24 | 0.24%(+0.129)#1,200 |
| 25. | Leominster | 0.37% | 0.26%(+0.104)#25 | 0.24%(+0.124)#1,213 |
| 26. | Franklin Town | 0.37% | 0.26%(+0.103)#26 | 0.24%(+0.123)#1,215 |
| 27. | Haverhill | 0.36% | 0.26%(+0.101)#27 | 0.24%(+0.121)#1,219 |
| 28. | Reading | 0.35% | 0.26%(+0.083)#28 | 0.24%(+0.103)#1,263 |
| 29. | Lowell | 0.34% | 0.26%(+0.076)#29 | 0.24%(+0.096)#1,272 |
| 30. | Springfield | 0.33% | 0.26%(+0.062)#30 | 0.24%(+0.082)#1,302 |
| 31. | Chelsea | 0.32% | 0.26%(+0.060)#31 | 0.24%(+0.081)#1,307 |
| 32. | West Springfield Town | 0.32% | 0.26%(+0.054)#32 | 0.24%(+0.074)#1,321 |
| 33. | Bliss Corner | 0.30% | 0.26%(+0.041)#33 | 0.24%(+0.061)#1,353 |
| 34. | Weymouth Town | 0.30% | 0.26%(+0.041)#34 | 0.24%(+0.061)#1,354 |
| 35. | Cochituate | 0.30% | 0.26%(+0.040)#35 | 0.24%(+0.060)#1,359 |
| 36. | Boston | 0.27% | 0.26%(+0.008)#36 | 0.24%(+0.028)#1,441 |
| 37. | Milton | 0.27% | 0.26%(+0.004)#37 | 0.24%(+0.024)#1,454 |
| 38. | Medford | 0.22% | 0.26%(-0.039)#38 | 0.24%(-0.019)#1,590 |
| 39. | Somerville | 0.21% | 0.26%(-0.054)#39 | 0.24%(-0.034)#1,655 |
| 40. | Needham | 0.20% | 0.26%(-0.066)#40 | 0.24%(-0.046)#1,705 |
| 41. | Revere | 0.19% | 0.26%(-0.075)#41 | 0.24%(-0.055)#1,737 |
| 42. | Holyoke | 0.19% | 0.26%(-0.077)#42 | 0.24%(-0.057)#1,753 |
| 43. | Southbridge Town | 0.17% | 0.26%(-0.093)#43 | 0.24%(-0.073)#1,815 |
| 44. | Brookline | 0.17% | 0.26%(-0.095)#44 | 0.24%(-0.075)#1,825 |
| 45. | Marlborough | 0.15% | 0.26%(-0.108)#45 | 0.24%(-0.088)#1,886 |
| 46. | Quincy | 0.14% | 0.26%(-0.120)#46 | 0.24%(-0.100)#1,960 |
| 47. | Arlington | 0.14% | 0.26%(-0.121)#47 | 0.24%(-0.101)#1,966 |
| 48. | Lynnfield | 0.14% | 0.26%(-0.124)#48 | 0.24%(-0.104)#1,981 |
| 49. | Randolph Town | 0.14% | 0.26%(-0.127)#49 | 0.24%(-0.107)#2,000 |
| 50. | Newton | 0.12% | 0.26%(-0.141)#50 | 0.24%(-0.121)#2,074 |
| 51. | New Bedford | 0.12% | 0.26%(-0.145)#51 | 0.24%(-0.125)#2,105 |
| 52. | Beverly | 0.11% | 0.26%(-0.150)#52 | 0.24%(-0.130)#2,151 |
| 53. | Burlington | 0.11% | 0.26%(-0.152)#53 | 0.24%(-0.132)#2,162 |
| 54. | Pinehurst | 0.11% | 0.26%(-0.154)#54 | 0.24%(-0.134)#2,173 |
| 55. | Cambridge | 0.11% | 0.26%(-0.154)#55 | 0.24%(-0.134)#2,178 |
| 56. | Watertown Town | 0.11% | 0.26%(-0.155)#56 | 0.24%(-0.135)#2,183 |
| 57. | Danvers | 0.11% | 0.26%(-0.155)#57 | 0.24%(-0.135)#2,187 |
| 58. | Waltham | 0.10% | 0.26%(-0.161)#58 | 0.24%(-0.141)#2,219 |
| 59. | Braintree Town | 0.090% | 0.26%(-0.173)#59 | 0.24%(-0.152)#2,293 |
| 60. | Attleboro | 0.086% | 0.26%(-0.177)#60 | 0.24%(-0.157)#2,333 |
| 61. | Taunton | 0.084% | 0.26%(-0.179)#61 | 0.24%(-0.159)#2,347 |
| 62. | Salem | 0.076% | 0.26%(-0.187)#62 | 0.24%(-0.166)#2,406 |
| 63. | Wilmington | 0.073% | 0.26%(-0.190)#63 | 0.24%(-0.169)#2,438 |
| 64. | Malden | 0.058% | 0.26%(-0.205)#64 | 0.24%(-0.185)#2,564 |
| 65. | Wellesley | 0.057% | 0.26%(-0.206)#65 | 0.24%(-0.186)#2,570 |
| 66. | Lynn | 0.057% | 0.26%(-0.206)#66 | 0.24%(-0.186)#2,573 |
| 67. | Woburn | 0.051% | 0.26%(-0.212)#67 | 0.24%(-0.192)#2,633 |
| 68. | Bridgewater Town | 0.046% | 0.26%(-0.217)#68 | 0.24%(-0.197)#2,686 |
| 69. | Wakefield | 0.018% | 0.26%(-0.244)#69 | 0.24%(-0.224)#2,938 |
| 70. | Chicopee | 0.016% | 0.26%(-0.247)#70 | 0.24%(-0.227)#2,960 |
Common Questions
What are the Top 10 Cities with the Highest Percentage of Ecuadorian Population in Massachusetts?
Top 10 Cities with the Highest Percentage of Ecuadorian Population in Massachusetts are:
#1
4.93%
#2
2.74%
#3
2.49%
#4
2.12%
#5
1.86%
#6
1.69%
#7
1.34%
#8
1.31%
#9
1.06%
#10
1.00%
What city has the Highest Percentage of Ecuadorian Population in Massachusetts?
Milford has the Highest Percentage of Ecuadorian Population in Massachusetts with 4.93%.
What is the Percentage of Ecuadorian Population in the State of Massachusetts?
Percentage of Ecuadorian Population in Massachusetts is 0.26%.
What is the Percentage of Ecuadorian Population in the United States?
Percentage of Ecuadorian Population in the United States is 0.24%.