Popponesset, MA Map & Demographics
Popponesset Map
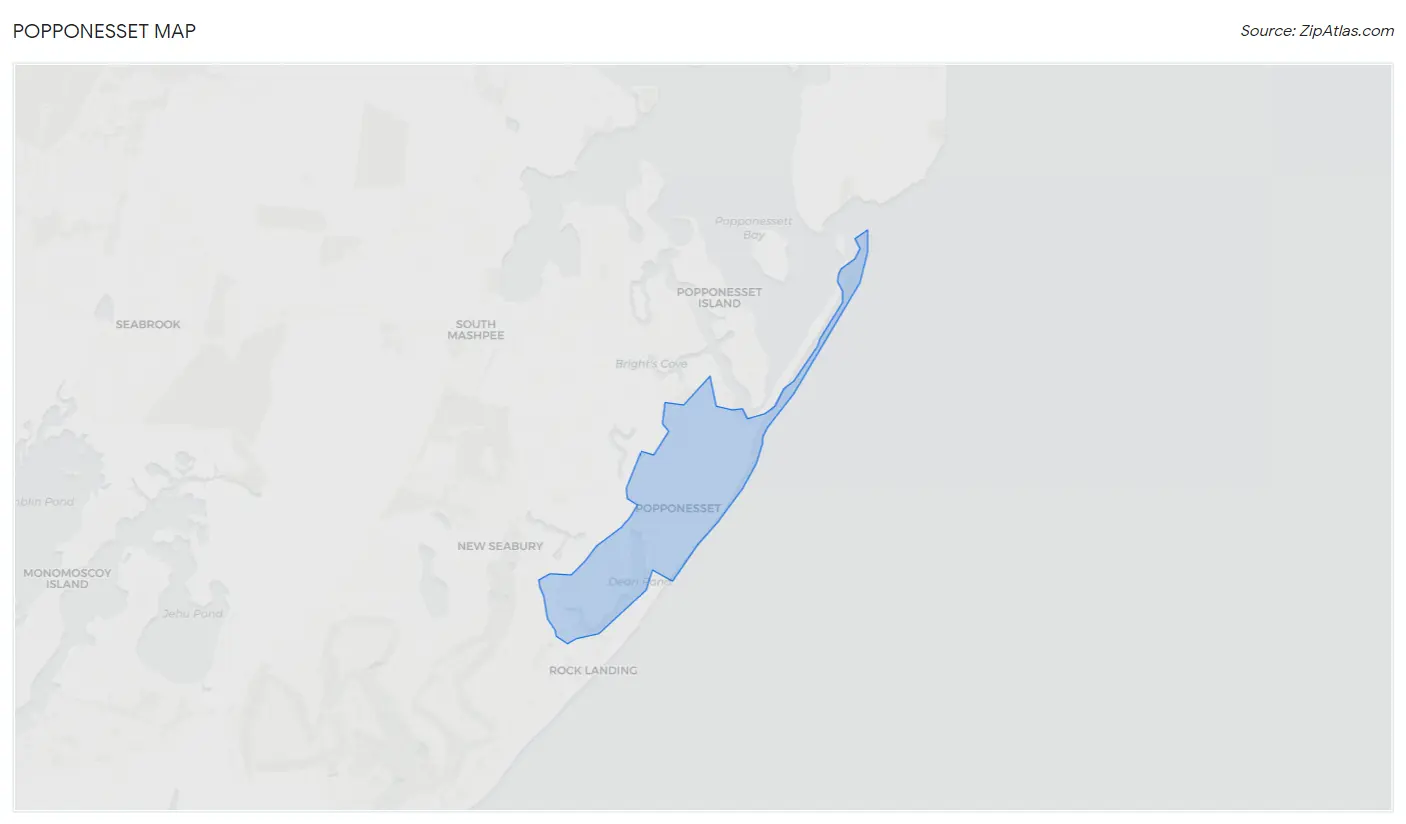
Popponesset Overview
$107,889
PER CAPITA INCOME
$250,001
AVG FAMILY INCOME
0.58
INEQUALITY / GINI INDEX
366
TOTAL POPULATION
129
MALE POPULATION
237
FEMALE POPULATION
54.43
MALES / 100 FEMALES
183.72
FEMALES / 100 MALES
34.6
MEDIAN AGE
2.4
AVG FAMILY SIZE
2.1
AVG HOUSEHOLD SIZE
260
LABOR FORCE [ PEOPLE ]
79.0%
PERCENT IN LABOR FORCE
14.2%
UNEMPLOYMENT RATE
Income in Popponesset
Income Overview in Popponesset
| Characteristic | Number | Measure |
| Per Capita Income | 366 | $107,889 |
| Median Family Income | 104 | $250,001 |
| Mean Family Income | 104 | $343,191 |
| Median Household Income | 177 | $0 |
| Mean Household Income | 177 | $222,231 |
| Income Deficit | 104 | $0 |
| Wage / Income Gap (%) | 366 | 0.00% |
| Wage / Income Gap ($) | 366 | 100.00¢ per $1 |
| Gini / Inequality Index | 366 | 0.58 |
Earnings by Sex in Popponesset
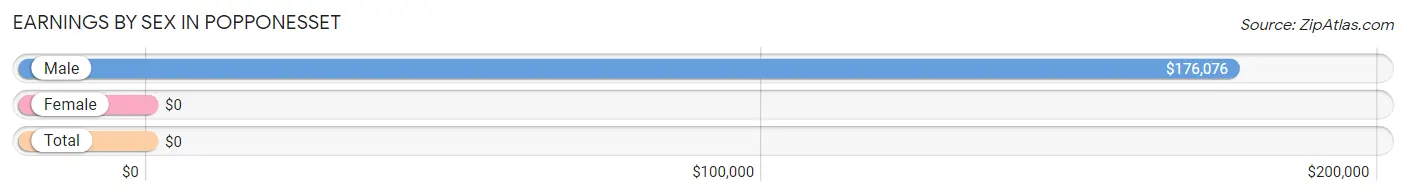
| Sex | Number | Average Earnings |
| Male | 65 (27.7%) | $176,076 |
| Female | 170 (72.3%) | $0 |
| Total | 235 (100.0%) | $0 |
Earnings by Sex by Income Bracket in Popponesset
The most common earnings brackets in Popponesset are $100,000+ for men (48 | 73.9%) and $100,000+ for women (60 | 35.3%).
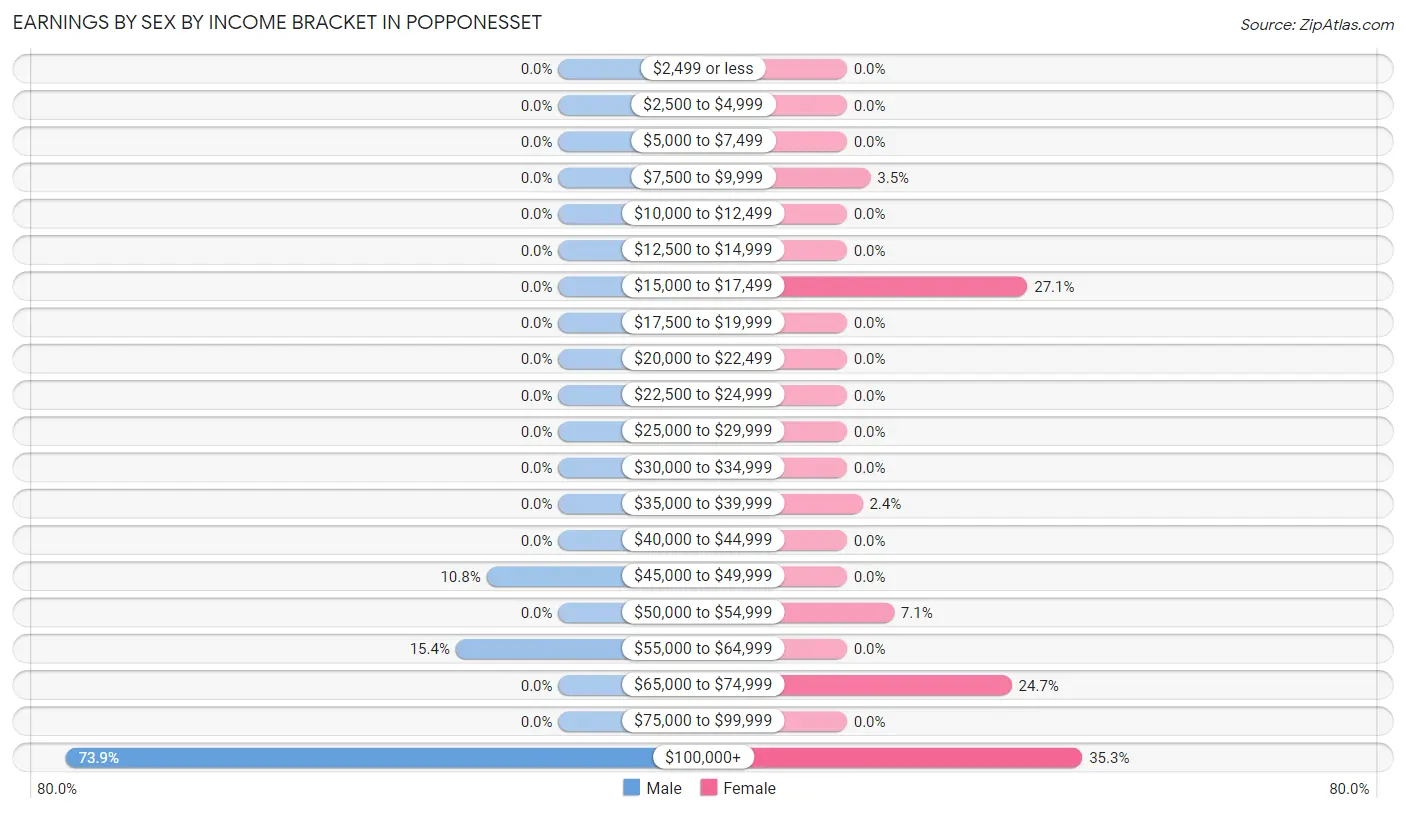
| Income | Male | Female |
| $2,499 or less | 0 (0.0%) | 0 (0.0%) |
| $2,500 to $4,999 | 0 (0.0%) | 0 (0.0%) |
| $5,000 to $7,499 | 0 (0.0%) | 0 (0.0%) |
| $7,500 to $9,999 | 0 (0.0%) | 6 (3.5%) |
| $10,000 to $12,499 | 0 (0.0%) | 0 (0.0%) |
| $12,500 to $14,999 | 0 (0.0%) | 0 (0.0%) |
| $15,000 to $17,499 | 0 (0.0%) | 46 (27.1%) |
| $17,500 to $19,999 | 0 (0.0%) | 0 (0.0%) |
| $20,000 to $22,499 | 0 (0.0%) | 0 (0.0%) |
| $22,500 to $24,999 | 0 (0.0%) | 0 (0.0%) |
| $25,000 to $29,999 | 0 (0.0%) | 0 (0.0%) |
| $30,000 to $34,999 | 0 (0.0%) | 0 (0.0%) |
| $35,000 to $39,999 | 0 (0.0%) | 4 (2.4%) |
| $40,000 to $44,999 | 0 (0.0%) | 0 (0.0%) |
| $45,000 to $49,999 | 7 (10.8%) | 0 (0.0%) |
| $50,000 to $54,999 | 0 (0.0%) | 12 (7.1%) |
| $55,000 to $64,999 | 10 (15.4%) | 0 (0.0%) |
| $65,000 to $74,999 | 0 (0.0%) | 42 (24.7%) |
| $75,000 to $99,999 | 0 (0.0%) | 0 (0.0%) |
| $100,000+ | 48 (73.9%) | 60 (35.3%) |
| Total | 65 (100.0%) | 170 (100.0%) |
Earnings by Sex by Educational Attainment in Popponesset
| Educational Attainment | Male Income | Female Income |
| Less than High School | - | - |
| High School Diploma | - | - |
| College or Associate's Degree | - | - |
| Bachelor's Degree | - | - |
| Graduate Degree | - | - |
| Total | $176,076 | $187,950 |
Family Income in Popponesset
Family Income Brackets in Popponesset
According to the Popponesset family income data, there are 60 families falling into the $200,000+ income range, which is the most common income bracket and makes up 57.7% of all families.
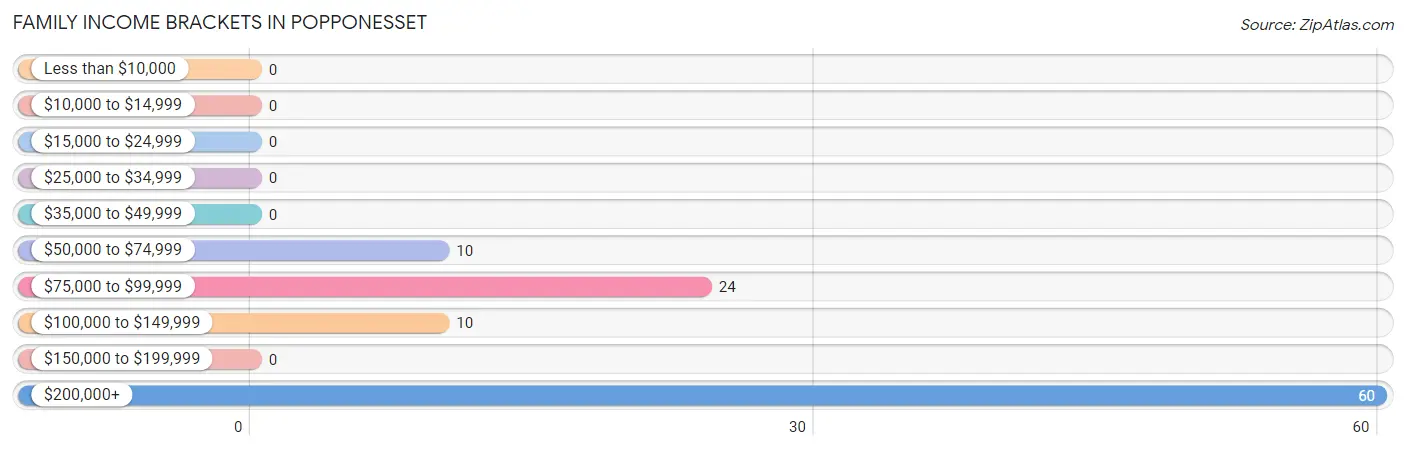
| Income Bracket | # Families | % Families |
| Less than $10,000 | 0 | 0.0% |
| $10,000 to $14,999 | 0 | 0.0% |
| $15,000 to $24,999 | 0 | 0.0% |
| $25,000 to $34,999 | 0 | 0.0% |
| $35,000 to $49,999 | 0 | 0.0% |
| $50,000 to $74,999 | 10 | 9.6% |
| $75,000 to $99,999 | 24 | 23.1% |
| $100,000 to $149,999 | 10 | 9.6% |
| $150,000 to $199,999 | 0 | 0.0% |
| $200,000+ | 60 | 57.7% |
Family Income by Famaliy Size in Popponesset
2-person families (87 | 83.7%) account for the highest median family income in Popponesset with $250,001 per family, while 2-person families (87 | 83.7%) have the highest median income of $125,000 per family member.
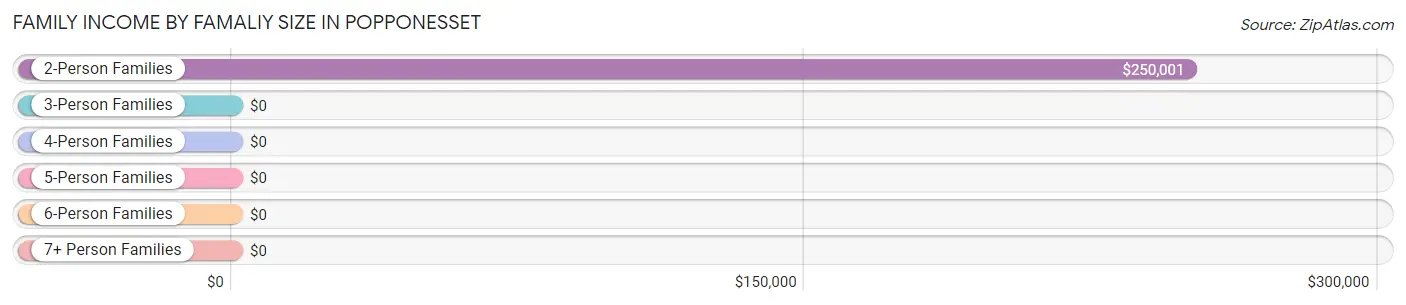
| Income Bracket | # Families | Median Income |
| 2-Person Families | 87 (83.7%) | $250,001 |
| 3-Person Families | 0 (0.0%) | $0 |
| 4-Person Families | 10 (9.6%) | $0 |
| 5-Person Families | 7 (6.7%) | $0 |
| 6-Person Families | 0 (0.0%) | $0 |
| 7+ Person Families | 0 (0.0%) | $0 |
| Total | 104 (100.0%) | $250,001 |
Family Income by Number of Earners in Popponesset
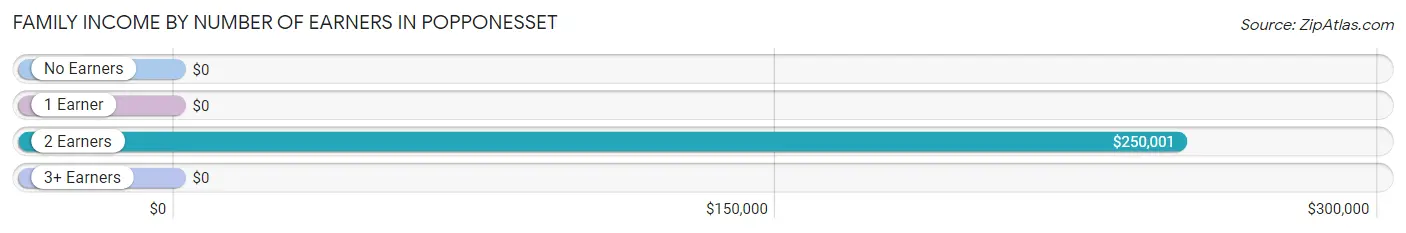
| Number of Earners | # Families | Median Income |
| No Earners | 17 (16.4%) | $0 |
| 1 Earner | 20 (19.2%) | $0 |
| 2 Earners | 67 (64.4%) | $250,001 |
| 3+ Earners | 0 (0.0%) | $0 |
| Total | 104 (100.0%) | $250,001 |
Household Income in Popponesset
Household Income Brackets in Popponesset
With 66 households falling in the category, the $75,000 to $99,999 income range is the most frequent in Popponesset, accounting for 37.3% of all households.
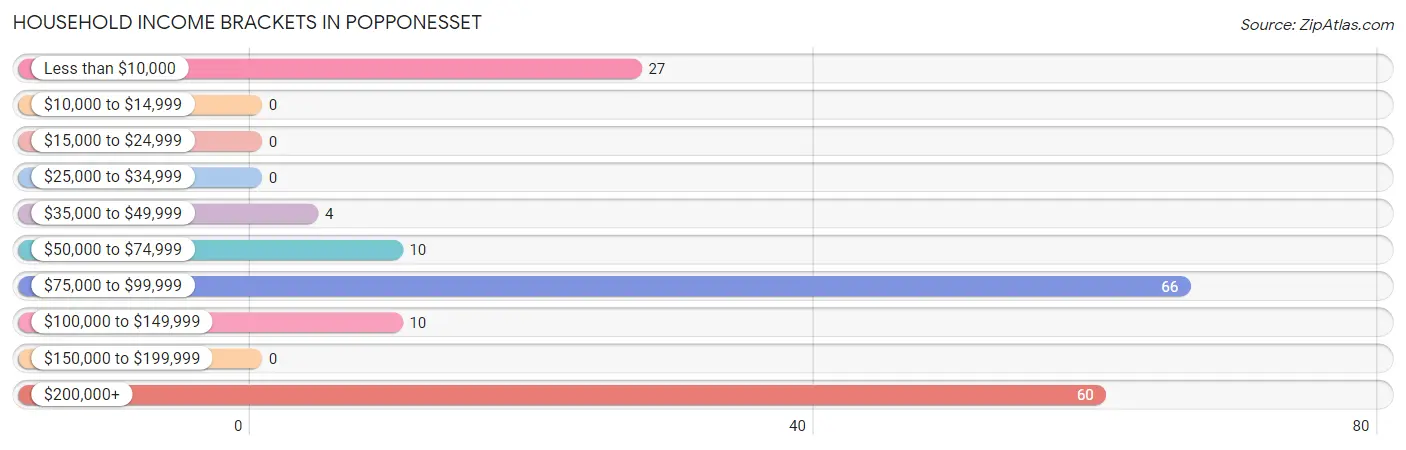
| Income Bracket | # Households | % Households |
| Less than $10,000 | 27 | 15.3% |
| $10,000 to $14,999 | 0 | 0.0% |
| $15,000 to $24,999 | 0 | 0.0% |
| $25,000 to $34,999 | 0 | 0.0% |
| $35,000 to $49,999 | 4 | 2.3% |
| $50,000 to $74,999 | 10 | 5.6% |
| $75,000 to $99,999 | 66 | 37.3% |
| $100,000 to $149,999 | 10 | 5.6% |
| $150,000 to $199,999 | 0 | 0.0% |
| $200,000+ | 60 | 33.9% |
Household Income by Householder Age in Popponesset
The median household income in Popponesset is $0, with the highest median household income of $88,833 found in the 65+ years age bracket for the primary householder. A total of 34 households (19.2%) fall into this category. Meanwhile, the 15 to 24 years age bracket for the primary householder has the lowest median household income of $0, with 42 households (23.7%) in this group.
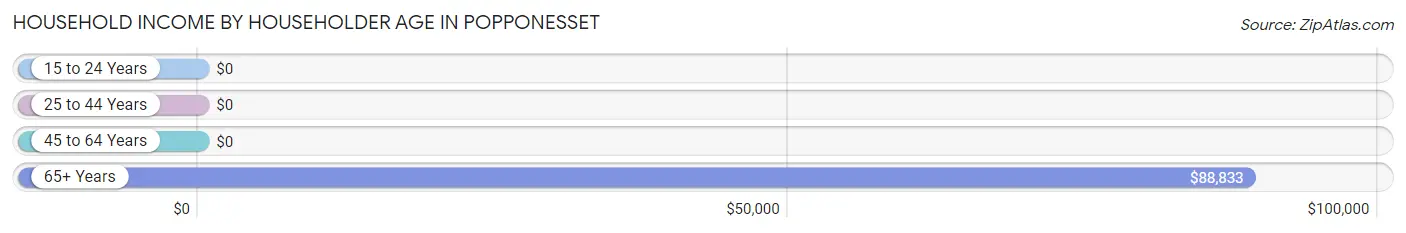
| Income Bracket | # Households | Median Income |
| 15 to 24 Years | 42 (23.7%) | $0 |
| 25 to 44 Years | 77 (43.5%) | $0 |
| 45 to 64 Years | 24 (13.6%) | $0 |
| 65+ Years | 34 (19.2%) | $88,833 |
| Total | 177 (100.0%) | $0 |
Poverty in Popponesset
Income Below Poverty by Sex and Age in Popponesset
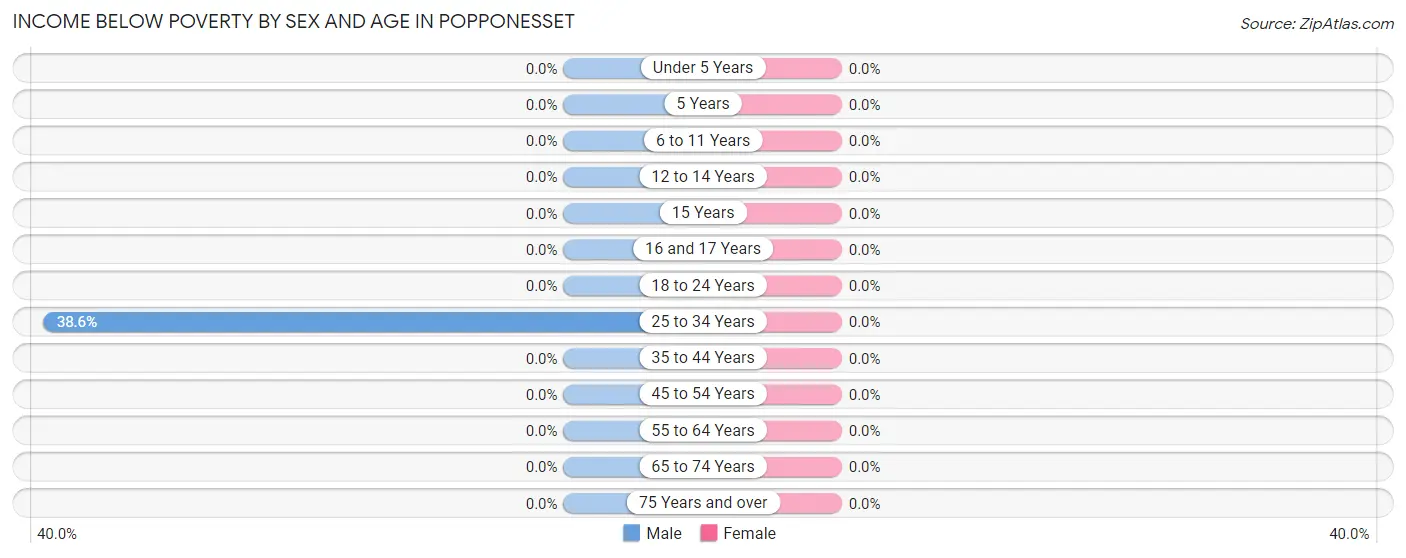
| Age Bracket | Male | Female |
| Under 5 Years | 0 (0.0%) | 0 (0.0%) |
| 5 Years | 0 (0.0%) | 0 (0.0%) |
| 6 to 11 Years | 0 (0.0%) | 0 (0.0%) |
| 12 to 14 Years | 0 (0.0%) | 0 (0.0%) |
| 15 Years | 0 (0.0%) | 0 (0.0%) |
| 16 and 17 Years | 0 (0.0%) | 0 (0.0%) |
| 18 to 24 Years | 0 (0.0%) | 0 (0.0%) |
| 25 to 34 Years | 27 (38.6%) | 0 (0.0%) |
| 35 to 44 Years | 0 (0.0%) | 0 (0.0%) |
| 45 to 54 Years | 0 (0.0%) | 0 (0.0%) |
| 55 to 64 Years | 0 (0.0%) | 0 (0.0%) |
| 65 to 74 Years | 0 (0.0%) | 0 (0.0%) |
| 75 Years and over | 0 (0.0%) | 0 (0.0%) |
| Total | 27 (20.9%) | 0 (0.0%) |
Income Above Poverty by Sex and Age in Popponesset
According to the poverty statistics in Popponesset, males aged 12 to 14 years and females aged under 5 years are the age groups that are most secure financially, with 100.0% of males and 100.0% of females in these age groups living above the poverty line.
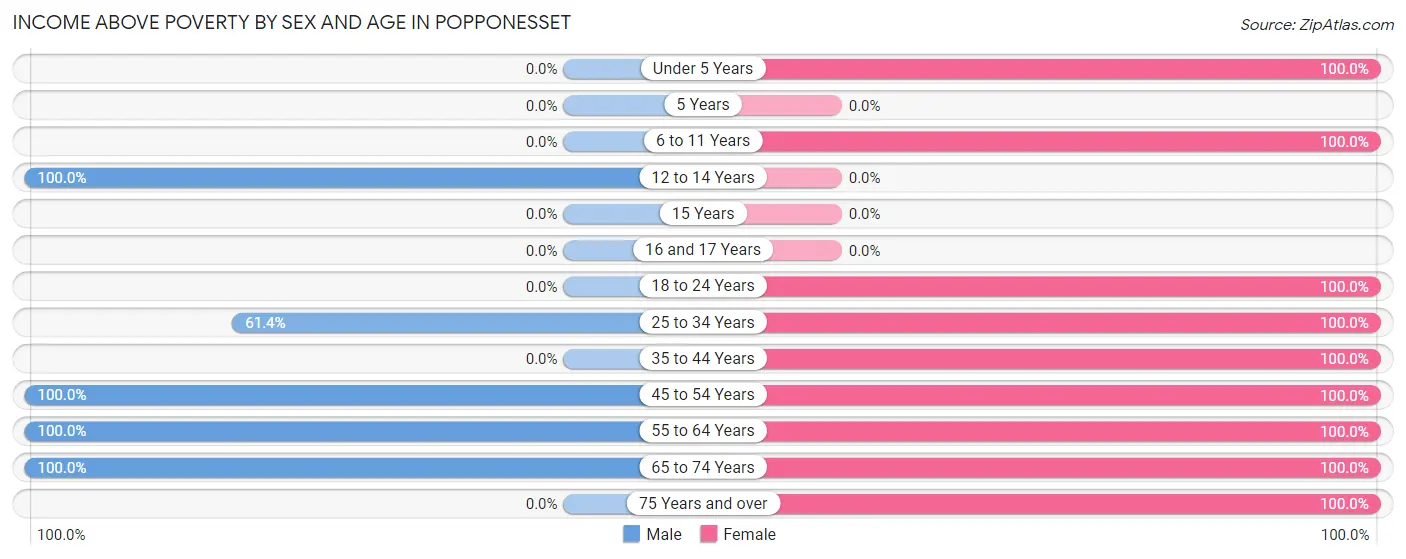
| Age Bracket | Male | Female |
| Under 5 Years | 0 (0.0%) | 15 (100.0%) |
| 5 Years | 0 (0.0%) | 0 (0.0%) |
| 6 to 11 Years | 0 (0.0%) | 11 (100.0%) |
| 12 to 14 Years | 11 (100.0%) | 0 (0.0%) |
| 15 Years | 0 (0.0%) | 0 (0.0%) |
| 16 and 17 Years | 0 (0.0%) | 0 (0.0%) |
| 18 to 24 Years | 0 (0.0%) | 88 (100.0%) |
| 25 to 34 Years | 43 (61.4%) | 6 (100.0%) |
| 35 to 44 Years | 0 (0.0%) | 50 (100.0%) |
| 45 to 54 Years | 10 (100.0%) | 16 (100.0%) |
| 55 to 64 Years | 12 (100.0%) | 17 (100.0%) |
| 65 to 74 Years | 26 (100.0%) | 27 (100.0%) |
| 75 Years and over | 0 (0.0%) | 7 (100.0%) |
| Total | 102 (79.1%) | 237 (100.0%) |
Income Below Poverty Among Married-Couple Families in Popponesset
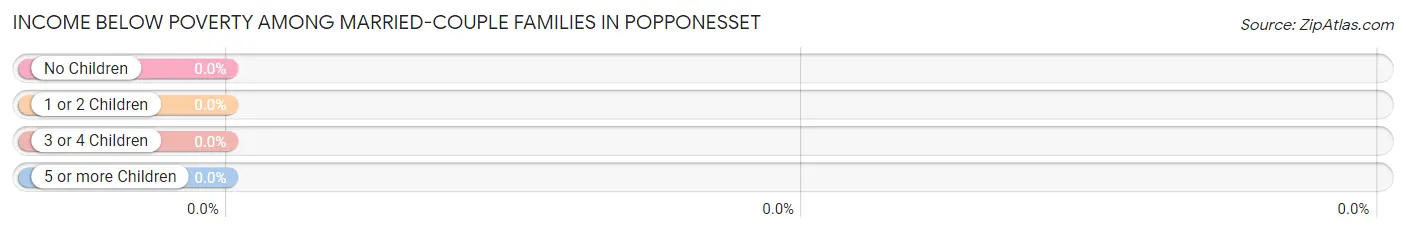
| Children | Above Poverty | Below Poverty |
| No Children | 77 (100.0%) | 0 (0.0%) |
| 1 or 2 Children | 10 (100.0%) | 0 (0.0%) |
| 3 or 4 Children | 0 (0.0%) | 0 (0.0%) |
| 5 or more Children | 0 (0.0%) | 0 (0.0%) |
| Total | 87 (100.0%) | 0 (0.0%) |
Income Below Poverty Among Single-Parent Households in Popponesset
| Children | Single Father | Single Mother |
| No Children | 0 (0.0%) | 0 (0.0%) |
| 1 or 2 Children | 0 (0.0%) | 0 (0.0%) |
| 3 or 4 Children | 0 (0.0%) | 0 (0.0%) |
| 5 or more Children | 0 (0.0%) | 0 (0.0%) |
| Total | 0 (0.0%) | 0 (0.0%) |
Income Below Poverty Among Married-Couple vs Single-Parent Households in Popponesset
| Children | Married-Couple Families | Single-Parent Households |
| No Children | 0 (0.0%) | 0 (0.0%) |
| 1 or 2 Children | 0 (0.0%) | 0 (0.0%) |
| 3 or 4 Children | 0 (0.0%) | 0 (0.0%) |
| 5 or more Children | 0 (0.0%) | 0 (0.0%) |
| Total | 0 (0.0%) | 0 (0.0%) |
Race in Popponesset
The most populous races in Popponesset are White / Caucasian (338 | 92.3%), Two or more Races (22 | 6.0%), and Asian (6 | 1.6%).
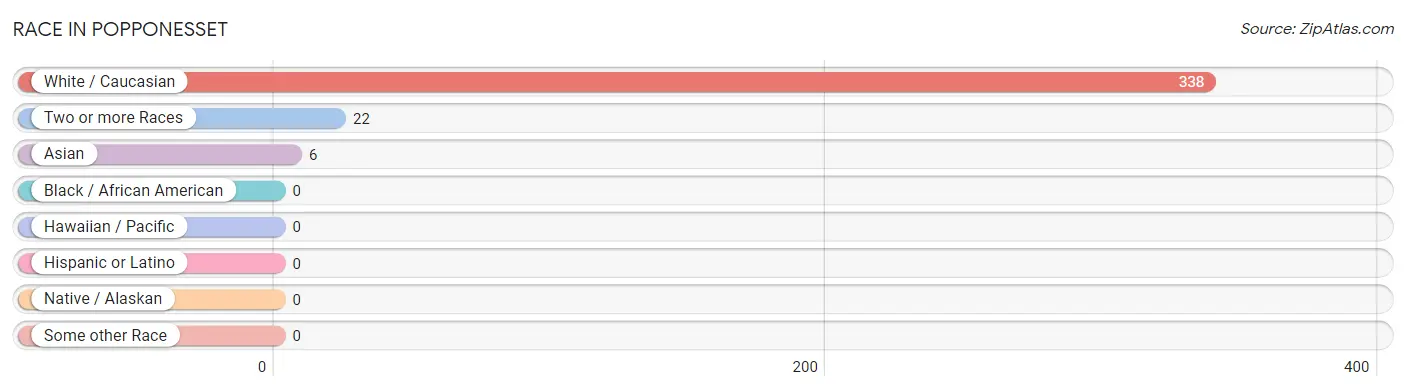
| Race | # Population | % Population |
| Asian | 6 | 1.6% |
| Black / African American | 0 | 0.0% |
| Hawaiian / Pacific | 0 | 0.0% |
| Hispanic or Latino | 0 | 0.0% |
| Native / Alaskan | 0 | 0.0% |
| White / Caucasian | 338 | 92.3% |
| Two or more Races | 22 | 6.0% |
| Some other Race | 0 | 0.0% |
| Total | 366 | 100.0% |
Ancestry in Popponesset
The most populous ancestries reported in Popponesset are Irish (123 | 33.6%), Italian (94 | 25.7%), German (55 | 15.0%), Eastern European (50 | 13.7%), and French (46 | 12.6%), together accounting for 100.5% of all Popponesset residents.
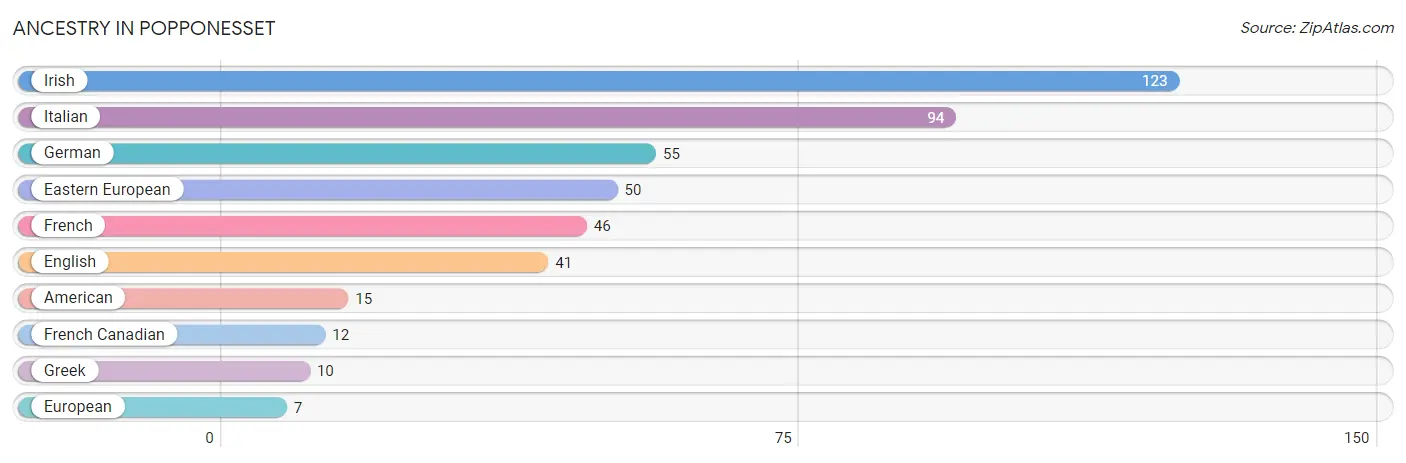
| Ancestry | # Population | % Population |
| American | 15 | 4.1% |
| Eastern European | 50 | 13.7% |
| English | 41 | 11.2% |
| European | 7 | 1.9% |
| French | 46 | 12.6% |
| French Canadian | 12 | 3.3% |
| German | 55 | 15.0% |
| Greek | 10 | 2.7% |
| Irish | 123 | 33.6% |
| Italian | 94 | 25.7% | View All 10 Rows |
Immigrants in Popponesset
The most numerous immigrant groups reported in Popponesset came from Eastern Europe (50 | 13.7%), Europe (50 | 13.7%), Moldova (50 | 13.7%), Asia (6 | 1.6%), and South Central Asia (6 | 1.6%), together accounting for 44.3% of all Popponesset residents.
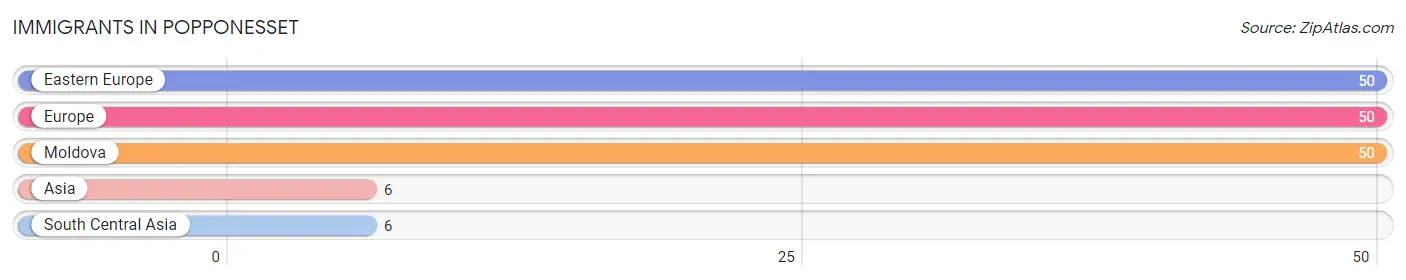
| Immigration Origin | # Population | % Population |
| Asia | 6 | 1.6% |
| Eastern Europe | 50 | 13.7% |
| Europe | 50 | 13.7% |
| Moldova | 50 | 13.7% |
| South Central Asia | 6 | 1.6% | View All 5 Rows |
Sex and Age in Popponesset
Sex and Age in Popponesset
The most populous age groups in Popponesset are 30 to 34 Years (43 | 33.3%) for men and 20 to 24 Years (88 | 37.1%) for women.
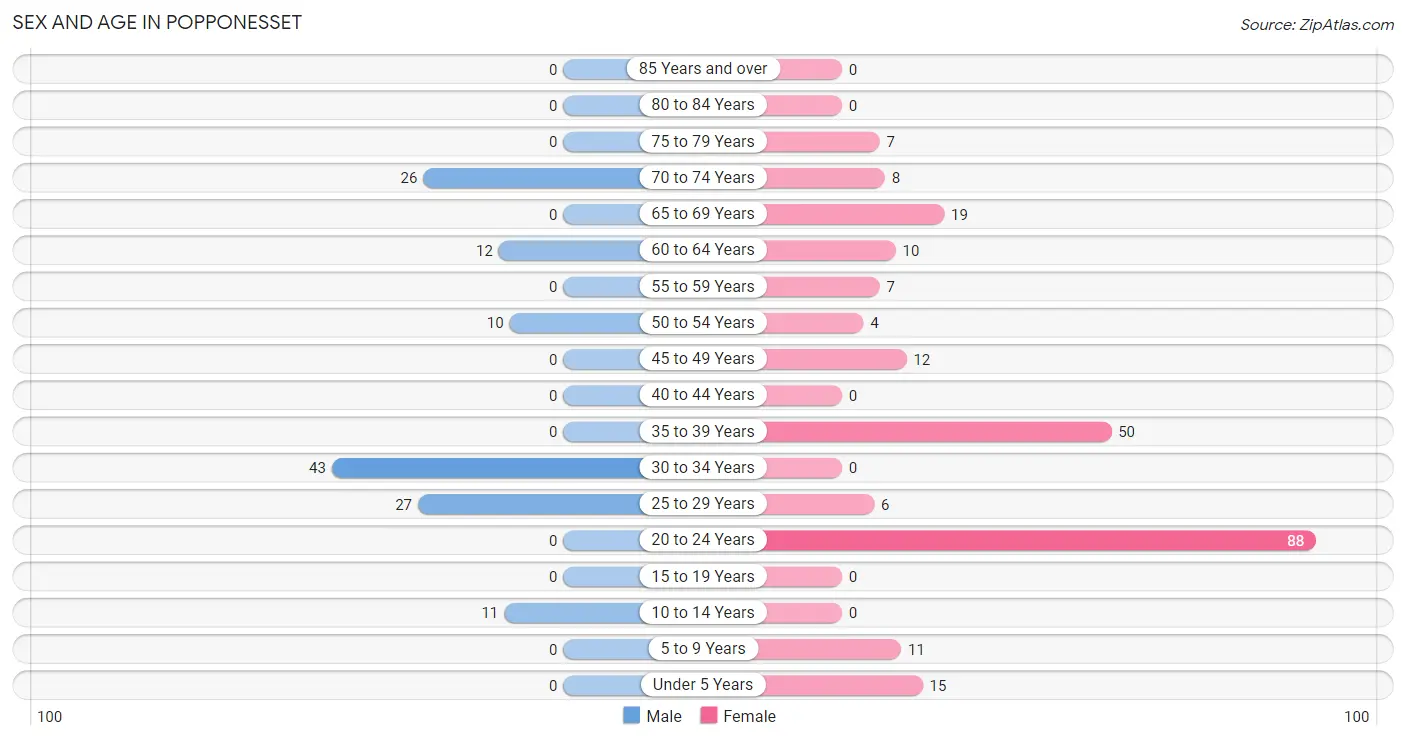
| Age Bracket | Male | Female |
| Under 5 Years | 0 (0.0%) | 15 (6.3%) |
| 5 to 9 Years | 0 (0.0%) | 11 (4.6%) |
| 10 to 14 Years | 11 (8.5%) | 0 (0.0%) |
| 15 to 19 Years | 0 (0.0%) | 0 (0.0%) |
| 20 to 24 Years | 0 (0.0%) | 88 (37.1%) |
| 25 to 29 Years | 27 (20.9%) | 6 (2.5%) |
| 30 to 34 Years | 43 (33.3%) | 0 (0.0%) |
| 35 to 39 Years | 0 (0.0%) | 50 (21.1%) |
| 40 to 44 Years | 0 (0.0%) | 0 (0.0%) |
| 45 to 49 Years | 0 (0.0%) | 12 (5.1%) |
| 50 to 54 Years | 10 (7.7%) | 4 (1.7%) |
| 55 to 59 Years | 0 (0.0%) | 7 (2.9%) |
| 60 to 64 Years | 12 (9.3%) | 10 (4.2%) |
| 65 to 69 Years | 0 (0.0%) | 19 (8.0%) |
| 70 to 74 Years | 26 (20.2%) | 8 (3.4%) |
| 75 to 79 Years | 0 (0.0%) | 7 (2.9%) |
| 80 to 84 Years | 0 (0.0%) | 0 (0.0%) |
| 85 Years and over | 0 (0.0%) | 0 (0.0%) |
| Total | 129 (100.0%) | 237 (100.0%) |
Families and Households in Popponesset
Median Family Size in Popponesset
The median family size in Popponesset is 2.38 persons per family, with single female/mother families (7 | 6.7%) accounting for the largest median family size of 6 persons per family. On the other hand, single male/father families (10 | 9.6%) represent the smallest median family size with 2.10 persons per family.
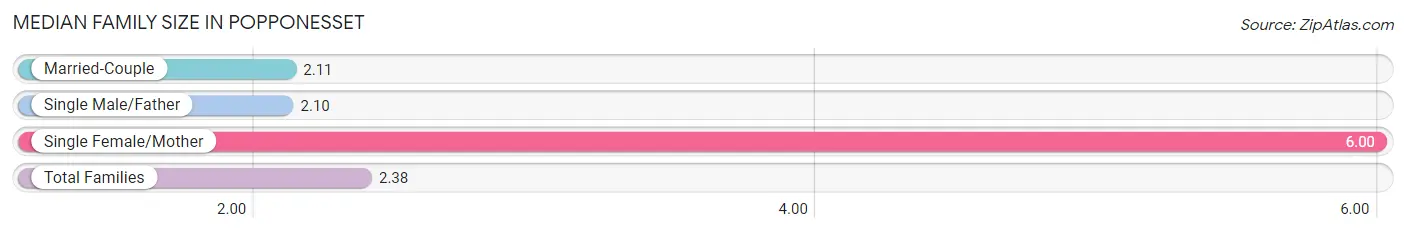
| Family Type | # Families | Family Size |
| Married-Couple | 87 (83.7%) | 2.11 |
| Single Male/Father | 10 (9.6%) | 2.10 |
| Single Female/Mother | 7 (6.7%) | 6.00 |
| Total Families | 104 (100.0%) | 2.38 |
Median Household Size in Popponesset
The median household size in Popponesset is 2.07 persons per household, with single female/mother households (7 | 4.0%) accounting for the largest median household size of 6 persons per household. non-family households (73 | 41.2%) represent the smallest median household size with 1.63 persons per household.
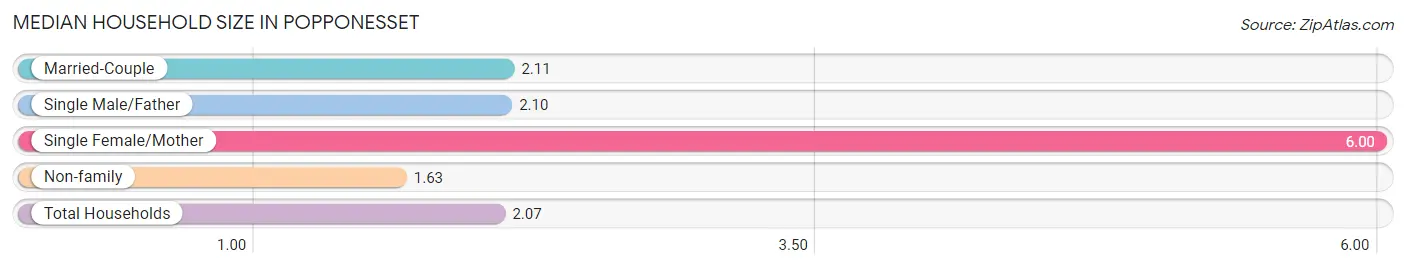
| Household Type | # Households | Household Size |
| Married-Couple | 87 (49.1%) | 2.11 |
| Single Male/Father | 10 (5.7%) | 2.10 |
| Single Female/Mother | 7 (4.0%) | 6.00 |
| Non-family | 73 (41.2%) | 1.63 |
| Total Households | 177 (100.0%) | 2.07 |
Household Size by Marriage Status in Popponesset
Out of a total of 177 households in Popponesset, 104 (58.8%) are family households, while 73 (41.2%) are nonfamily households. The most numerous type of family households are 2-person households, comprising 87, and the most common type of nonfamily households are 2-person households, comprising 42.
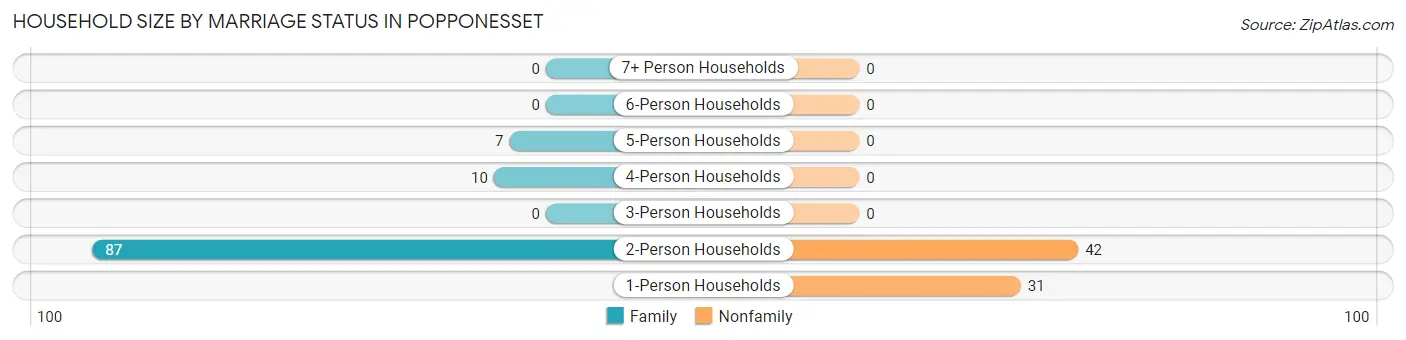
| Household Size | Family Households | Nonfamily Households |
| 1-Person Households | - | 31 (17.5%) |
| 2-Person Households | 87 (49.1%) | 42 (23.7%) |
| 3-Person Households | 0 (0.0%) | 0 (0.0%) |
| 4-Person Households | 10 (5.7%) | 0 (0.0%) |
| 5-Person Households | 7 (4.0%) | 0 (0.0%) |
| 6-Person Households | 0 (0.0%) | 0 (0.0%) |
| 7+ Person Households | 0 (0.0%) | 0 (0.0%) |
| Total | 104 (58.8%) | 73 (41.2%) |
Female Fertility in Popponesset
Fertility by Age in Popponesset
| Age Bracket | Women with Births | Births / 1,000 Women |
| 15 to 19 years | 0 (0.0%) | 0.0 |
| 20 to 34 years | 0 (0.0%) | 0.0 |
| 35 to 50 years | 0 (0.0%) | 0.0 |
| Total | 0 (0.0%) | 0.0 |
Fertility by Age by Marriage Status in Popponesset
| Age Bracket | Married | Unmarried |
| 15 to 19 years | 0 (0.0%) | 0 (0.0%) |
| 20 to 34 years | 0 (0.0%) | 0 (0.0%) |
| 35 to 50 years | 0 (0.0%) | 0 (0.0%) |
| Total | 0 (0.0%) | 0 (0.0%) |
Fertility by Education in Popponesset
| Educational Attainment | Women with Births | Births / 1,000 Women |
| Less than High School | 0 (0.0%) | 0.0 |
| High School Diploma | 0 (0.0%) | 0.0 |
| College or Associate's Degree | 0 (0.0%) | 0.0 |
| Bachelor's Degree | 0 (0.0%) | 0.0 |
| Graduate Degree | 0 (0.0%) | 0.0 |
| Total | 0 (0.0%) | 0.0 |
Fertility by Education by Marriage Status in Popponesset
| Educational Attainment | Married | Unmarried |
| Less than High School | 0 (0.0%) | 0 (0.0%) |
| High School Diploma | 0 (0.0%) | 0 (0.0%) |
| College or Associate's Degree | 0 (0.0%) | 0 (0.0%) |
| Bachelor's Degree | 0 (0.0%) | 0 (0.0%) |
| Graduate Degree | 0 (0.0%) | 0 (0.0%) |
| Total | 0 (0.0%) | 0 (0.0%) |
Employment Characteristics in Popponesset
Employment by Class of Employer in Popponesset
Among the 223 employed individuals in Popponesset, private company employees (206 | 92.4%), and not-for-profit organizations (17 | 7.6%) make up the most common classes of employment.
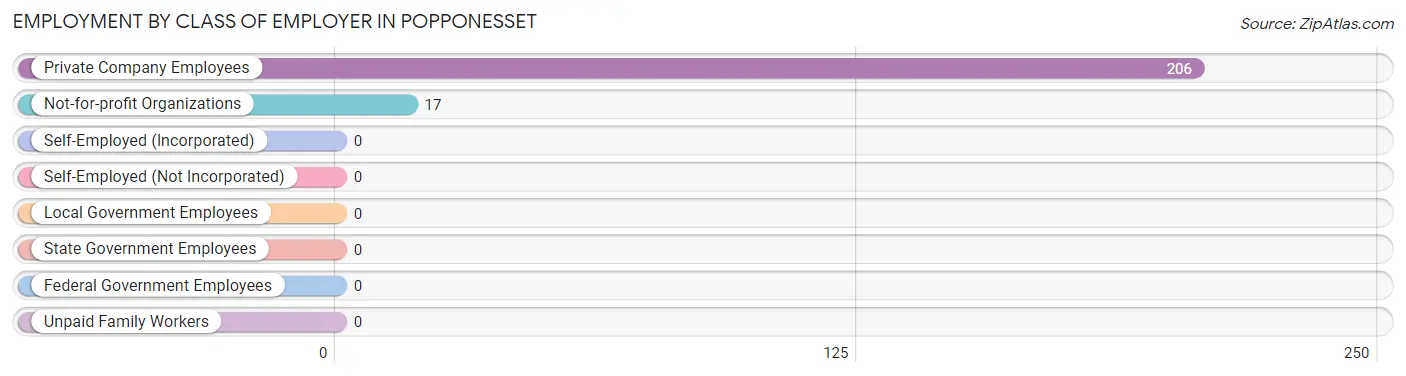
| Employer Class | # Employees | % Employees |
| Private Company Employees | 206 | 92.4% |
| Self-Employed (Incorporated) | 0 | 0.0% |
| Self-Employed (Not Incorporated) | 0 | 0.0% |
| Not-for-profit Organizations | 17 | 7.6% |
| Local Government Employees | 0 | 0.0% |
| State Government Employees | 0 | 0.0% |
| Federal Government Employees | 0 | 0.0% |
| Unpaid Family Workers | 0 | 0.0% |
| Total | 223 | 100.0% |
Employment Status by Age in Popponesset
According to the labor force statistics for Popponesset, out of the total population over 16 years of age (329), 79.0% or 260 individuals are in the labor force, with 14.2% or 37 of them unemployed. The age group with the highest labor force participation rate is 20 to 24 years, with 100.0% or 88 individuals in the labor force. Within the labor force, the 65 to 74 years age range has the highest percentage of unemployed individuals, with 100.0% or 10 of them being unemployed.
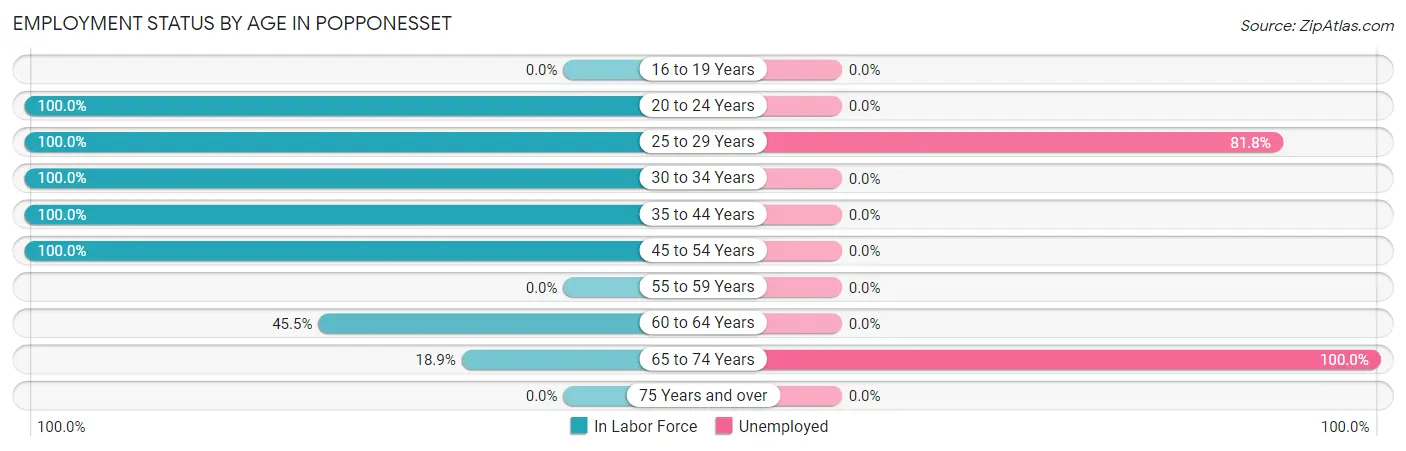
| Age Bracket | In Labor Force | Unemployed |
| 16 to 19 Years | 0 (0.0%) | 0 (0.0%) |
| 20 to 24 Years | 88 (100.0%) | 0 (0.0%) |
| 25 to 29 Years | 33 (100.0%) | 27 (81.8%) |
| 30 to 34 Years | 43 (100.0%) | 0 (0.0%) |
| 35 to 44 Years | 50 (100.0%) | 0 (0.0%) |
| 45 to 54 Years | 26 (100.0%) | 0 (0.0%) |
| 55 to 59 Years | 0 (0.0%) | 0 (0.0%) |
| 60 to 64 Years | 10 (45.5%) | 0 (0.0%) |
| 65 to 74 Years | 10 (18.9%) | 10 (100.0%) |
| 75 Years and over | 0 (0.0%) | 0 (0.0%) |
| Total | 260 (79.0%) | 37 (14.2%) |
Employment Status by Educational Attainment in Popponesset
According to labor force statistics for Popponesset, 89.5% of individuals (162) out of the total population between 25 and 64 years of age (181) are in the labor force, with 16.7% or 27 of them being unemployed. The group with the highest labor force participation rate are those with the educational attainment of college / associate degree, with 100.0% or 7 individuals in the labor force. Within the labor force, individuals with bachelor's degree or higher education have the highest percentage of unemployment, with 19.4% or 27 of them being unemployed.
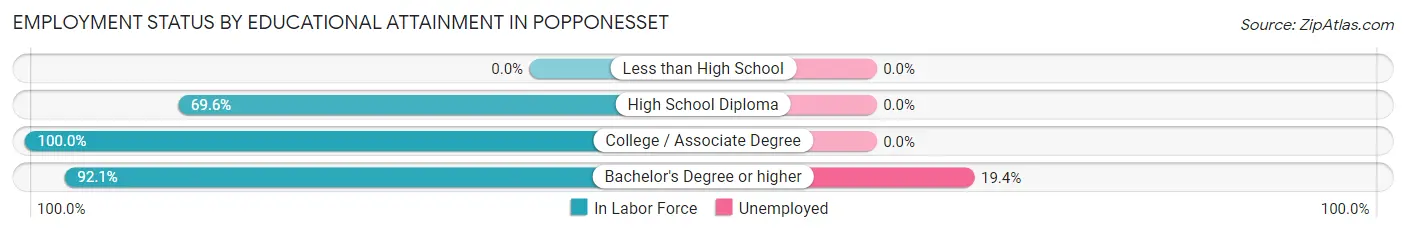
| Educational Attainment | In Labor Force | Unemployed |
| Less than High School | 0 (0.0%) | 0 (0.0%) |
| High School Diploma | 16 (69.6%) | 0 (0.0%) |
| College / Associate Degree | 7 (100.0%) | 0 (0.0%) |
| Bachelor's Degree or higher | 139 (92.1%) | 29 (19.4%) |
| Total | 162 (89.5%) | 30 (16.7%) |
Employment Occupations by Sex in Popponesset
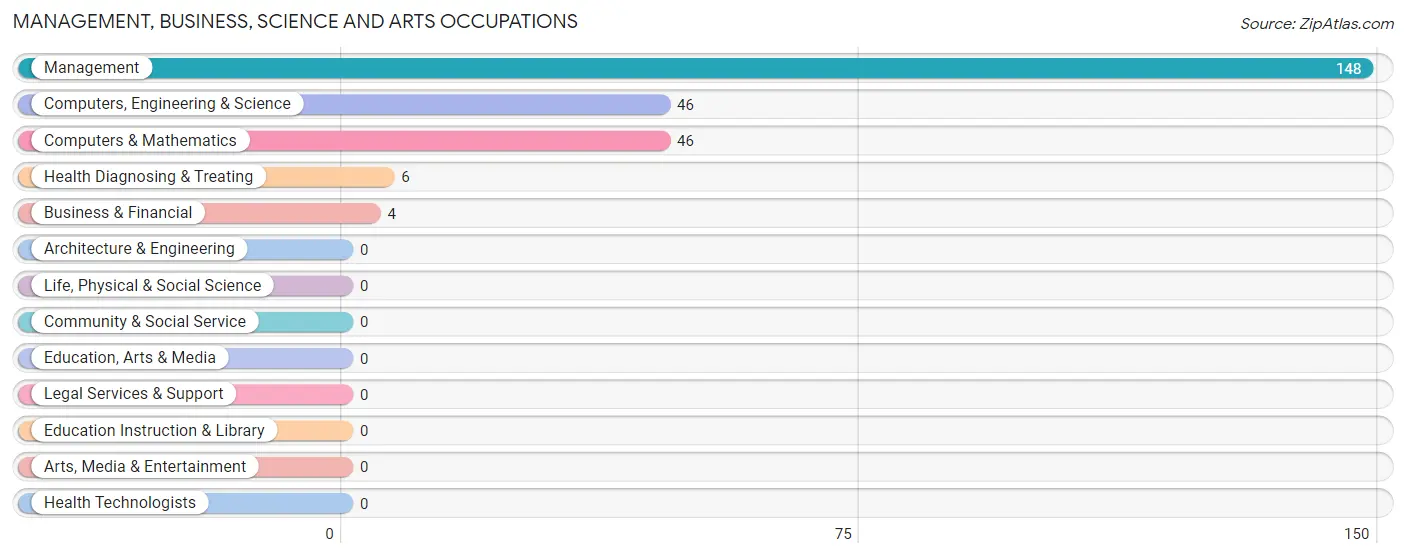
Management, Business, Science and Arts Occupations
The most common Management, Business, Science and Arts occupations in Popponesset are Management (148 | 66.4%), Computers, Engineering & Science (46 | 20.6%), Computers & Mathematics (46 | 20.6%), Health Diagnosing & Treating (6 | 2.7%), and Business & Financial (4 | 1.8%).
Management, Business, Science and Arts Occupations by Sex
Within the Management, Business, Science and Arts occupations in Popponesset, the most male-oriented occupations are Computers, Engineering & Science (100.0%), and Computers & Mathematics (100.0%), while the most female-oriented occupations are Management (100.0%), Business & Financial (100.0%), and Health Diagnosing & Treating (100.0%).
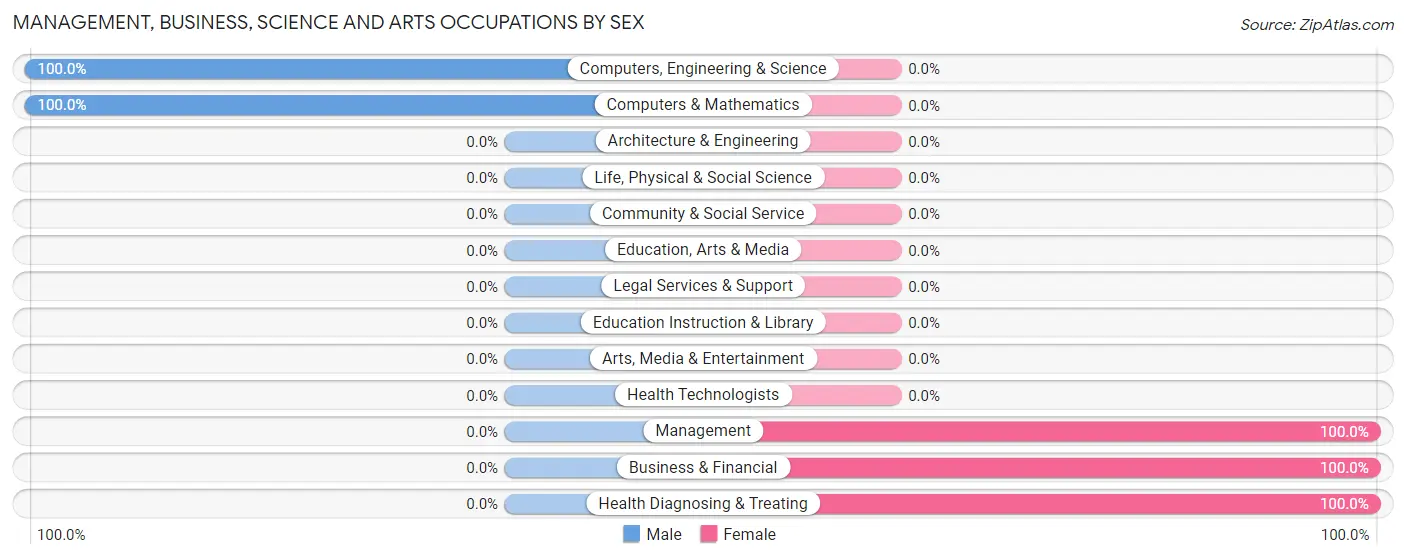
| Occupation | Male | Female |
| Management | 0 (0.0%) | 148 (100.0%) |
| Business & Financial | 0 (0.0%) | 4 (100.0%) |
| Computers, Engineering & Science | 46 (100.0%) | 0 (0.0%) |
| Computers & Mathematics | 46 (100.0%) | 0 (0.0%) |
| Architecture & Engineering | 0 (0.0%) | 0 (0.0%) |
| Life, Physical & Social Science | 0 (0.0%) | 0 (0.0%) |
| Community & Social Service | 0 (0.0%) | 0 (0.0%) |
| Education, Arts & Media | 0 (0.0%) | 0 (0.0%) |
| Legal Services & Support | 0 (0.0%) | 0 (0.0%) |
| Education Instruction & Library | 0 (0.0%) | 0 (0.0%) |
| Arts, Media & Entertainment | 0 (0.0%) | 0 (0.0%) |
| Health Diagnosing & Treating | 0 (0.0%) | 6 (100.0%) |
| Health Technologists | 0 (0.0%) | 0 (0.0%) |
| Total (Category) | 46 (22.6%) | 158 (77.4%) |
| Total (Overall) | 53 (23.8%) | 170 (76.2%) |
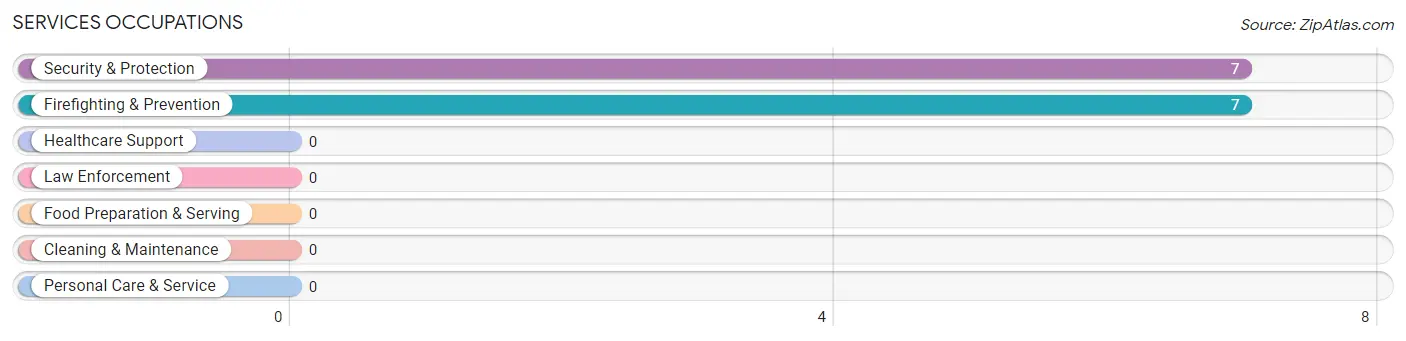
Services Occupations
The most common Services occupations in Popponesset are Security & Protection (7 | 3.1%), and Firefighting & Prevention (7 | 3.1%).
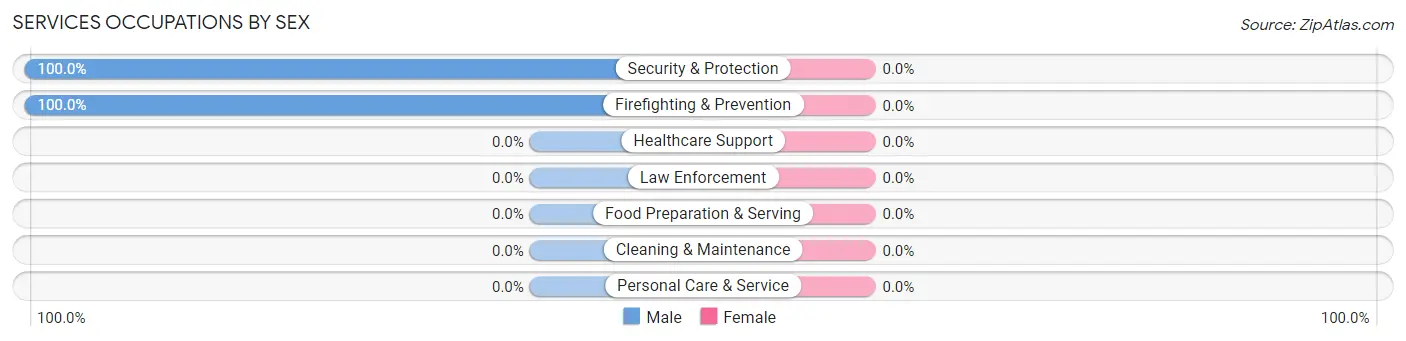
Services Occupations by Sex
| Occupation | Male | Female |
| Healthcare Support | 0 (0.0%) | 0 (0.0%) |
| Security & Protection | 7 (100.0%) | 0 (0.0%) |
| Firefighting & Prevention | 7 (100.0%) | 0 (0.0%) |
| Law Enforcement | 0 (0.0%) | 0 (0.0%) |
| Food Preparation & Serving | 0 (0.0%) | 0 (0.0%) |
| Cleaning & Maintenance | 0 (0.0%) | 0 (0.0%) |
| Personal Care & Service | 0 (0.0%) | 0 (0.0%) |
| Total (Category) | 7 (100.0%) | 0 (0.0%) |
| Total (Overall) | 53 (23.8%) | 170 (76.2%) |
Sales and Office Occupations
The most common Sales and Office occupations in Popponesset are , and Office & Administration (12 | 5.4%).

Sales and Office Occupations by Sex
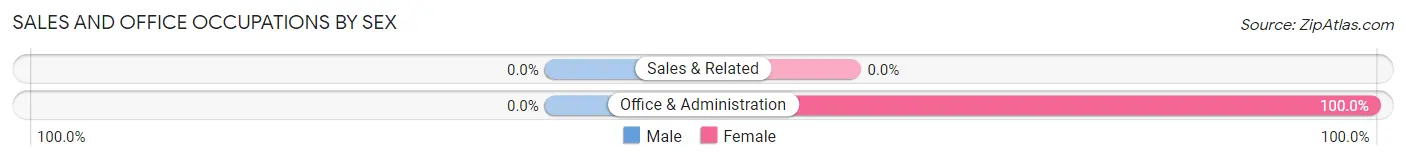
| Occupation | Male | Female |
| Sales & Related | 0 (0.0%) | 0 (0.0%) |
| Office & Administration | 0 (0.0%) | 12 (100.0%) |
| Total (Category) | 0 (0.0%) | 12 (100.0%) |
| Total (Overall) | 53 (23.8%) | 170 (76.2%) |
Natural Resources, Construction and Maintenance Occupations
Natural Resources, Construction and Maintenance Occupations by Sex
| Occupation | Male | Female |
| Farming, Fishing & Forestry | 0 (0.0%) | 0 (0.0%) |
| Construction & Extraction | 0 (0.0%) | 0 (0.0%) |
| Installation, Maintenance & Repair | 0 (0.0%) | 0 (0.0%) |
| Total (Category) | 0 (0.0%) | 0 (0.0%) |
| Total (Overall) | 53 (23.8%) | 170 (76.2%) |
Production, Transportation and Moving Occupations
Production, Transportation and Moving Occupations by Sex
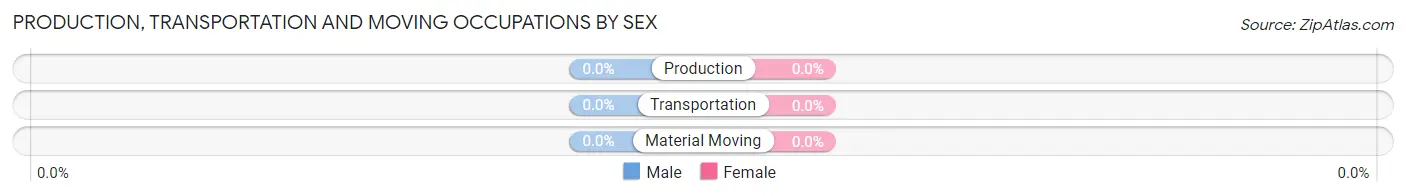
| Occupation | Male | Female |
| Production | 0 (0.0%) | 0 (0.0%) |
| Transportation | 0 (0.0%) | 0 (0.0%) |
| Material Moving | 0 (0.0%) | 0 (0.0%) |
| Total (Category) | 0 (0.0%) | 0 (0.0%) |
| Total (Overall) | 53 (23.8%) | 170 (76.2%) |
Employment Industries by Sex in Popponesset
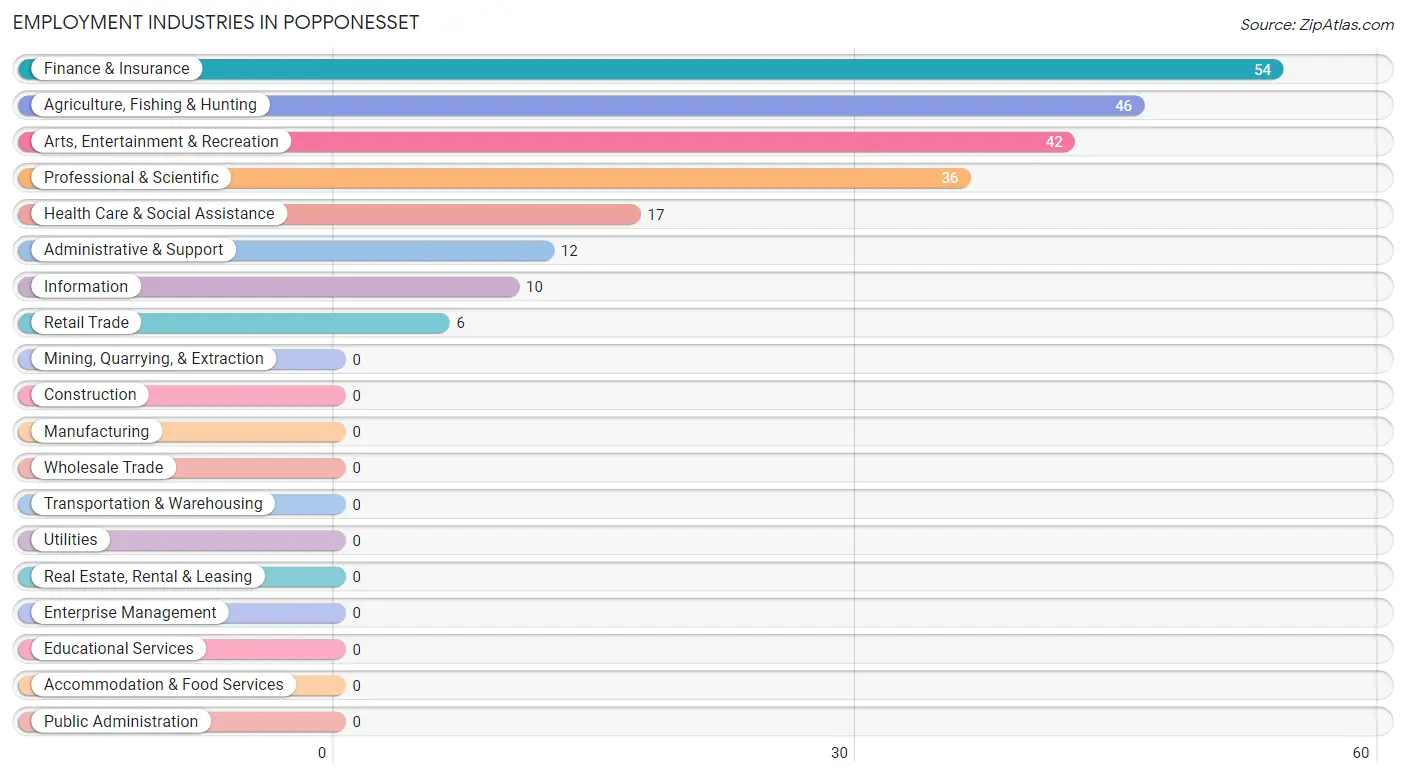
Employment Industries in Popponesset
The major employment industries in Popponesset include Finance & Insurance (54 | 24.2%), Agriculture, Fishing & Hunting (46 | 20.6%), Arts, Entertainment & Recreation (42 | 18.8%), Professional & Scientific (36 | 16.1%), and Health Care & Social Assistance (17 | 7.6%).
Employment Industries by Sex in Popponesset
The Popponesset industries that see more men than women are Information (100.0%), Professional & Scientific (100.0%), and Health Care & Social Assistance (41.2%), whereas the industries that tend to have a higher number of women are Agriculture, Fishing & Hunting (100.0%), Retail Trade (100.0%), and Finance & Insurance (100.0%).
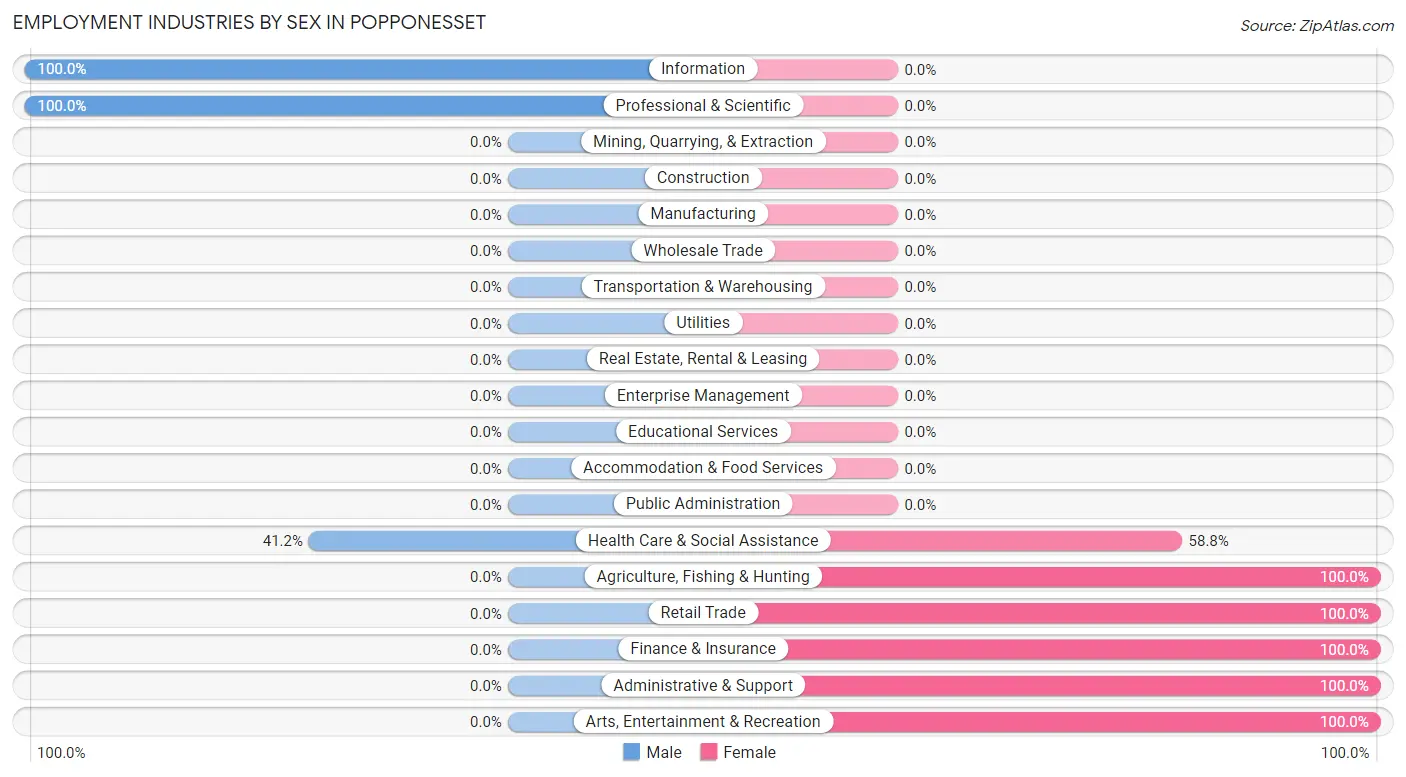
| Industry | Male | Female |
| Agriculture, Fishing & Hunting | 0 (0.0%) | 46 (100.0%) |
| Mining, Quarrying, & Extraction | 0 (0.0%) | 0 (0.0%) |
| Construction | 0 (0.0%) | 0 (0.0%) |
| Manufacturing | 0 (0.0%) | 0 (0.0%) |
| Wholesale Trade | 0 (0.0%) | 0 (0.0%) |
| Retail Trade | 0 (0.0%) | 6 (100.0%) |
| Transportation & Warehousing | 0 (0.0%) | 0 (0.0%) |
| Utilities | 0 (0.0%) | 0 (0.0%) |
| Information | 10 (100.0%) | 0 (0.0%) |
| Finance & Insurance | 0 (0.0%) | 54 (100.0%) |
| Real Estate, Rental & Leasing | 0 (0.0%) | 0 (0.0%) |
| Professional & Scientific | 36 (100.0%) | 0 (0.0%) |
| Enterprise Management | 0 (0.0%) | 0 (0.0%) |
| Administrative & Support | 0 (0.0%) | 12 (100.0%) |
| Educational Services | 0 (0.0%) | 0 (0.0%) |
| Health Care & Social Assistance | 7 (41.2%) | 10 (58.8%) |
| Arts, Entertainment & Recreation | 0 (0.0%) | 42 (100.0%) |
| Accommodation & Food Services | 0 (0.0%) | 0 (0.0%) |
| Public Administration | 0 (0.0%) | 0 (0.0%) |
| Total | 53 (23.8%) | 170 (76.2%) |
Education in Popponesset
School Enrollment in Popponesset
The most common levels of schooling among the 28 students in Popponesset are elementary school (11 | 39.3%), middle school (11 | 39.3%), and graduate / professional (6 | 21.4%).
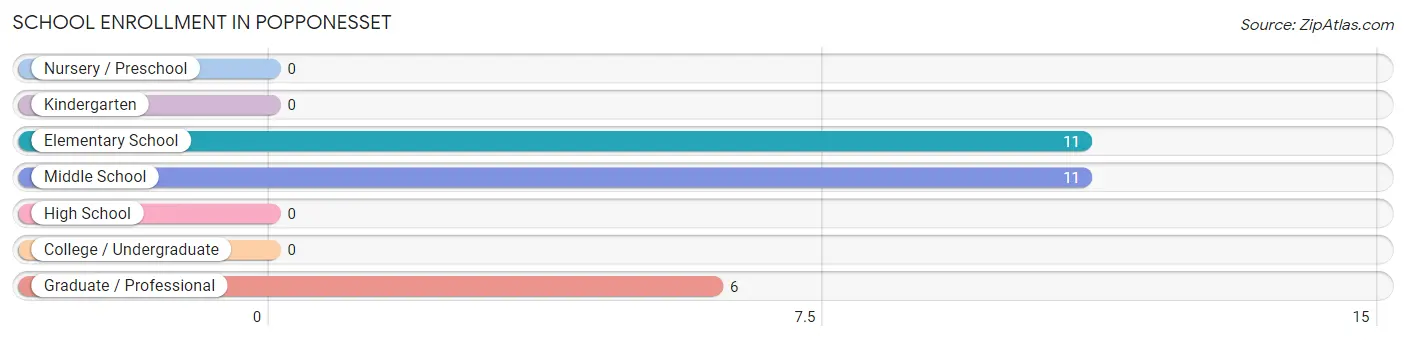
| School Level | # Students | % Students |
| Nursery / Preschool | 0 | 0.0% |
| Kindergarten | 0 | 0.0% |
| Elementary School | 11 | 39.3% |
| Middle School | 11 | 39.3% |
| High School | 0 | 0.0% |
| College / Undergraduate | 0 | 0.0% |
| Graduate / Professional | 6 | 21.4% |
| Total | 28 | 100.0% |
School Enrollment by Age by Funding Source in Popponesset
Out of a total of 28 students who are enrolled in schools in Popponesset, 6 (21.4%) attend a private institution, while the remaining 22 (78.6%) are enrolled in public schools. The age group of 25 to 34 year olds has the highest likelihood of being enrolled in private schools, with 6 (100.0% in the age bracket) enrolled. Conversely, the age group of 5 to 9 year old has the lowest likelihood of being enrolled in a private school, with 11 (100.0% in the age bracket) attending a public institution.
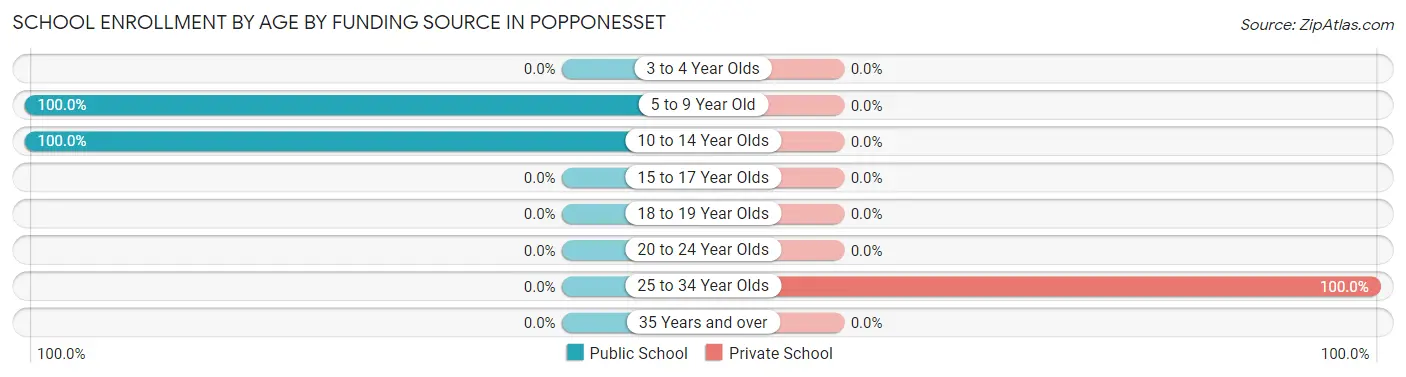
| Age Bracket | Public School | Private School |
| 3 to 4 Year Olds | 0 (0.0%) | 0 (0.0%) |
| 5 to 9 Year Old | 11 (100.0%) | 0 (0.0%) |
| 10 to 14 Year Olds | 11 (100.0%) | 0 (0.0%) |
| 15 to 17 Year Olds | 0 (0.0%) | 0 (0.0%) |
| 18 to 19 Year Olds | 0 (0.0%) | 0 (0.0%) |
| 20 to 24 Year Olds | 0 (0.0%) | 0 (0.0%) |
| 25 to 34 Year Olds | 0 (0.0%) | 6 (100.0%) |
| 35 Years and over | 0 (0.0%) | 0 (0.0%) |
| Total | 22 (78.6%) | 6 (21.4%) |
Educational Attainment by Field of Study in Popponesset
Computers & mathematics (86 | 38.2%), social sciences (60 | 26.7%), business (59 | 26.2%), arts & humanities (14 | 6.2%), and science & technology (6 | 2.7%) are the most common fields of study among 225 individuals in Popponesset who have obtained a bachelor's degree or higher.
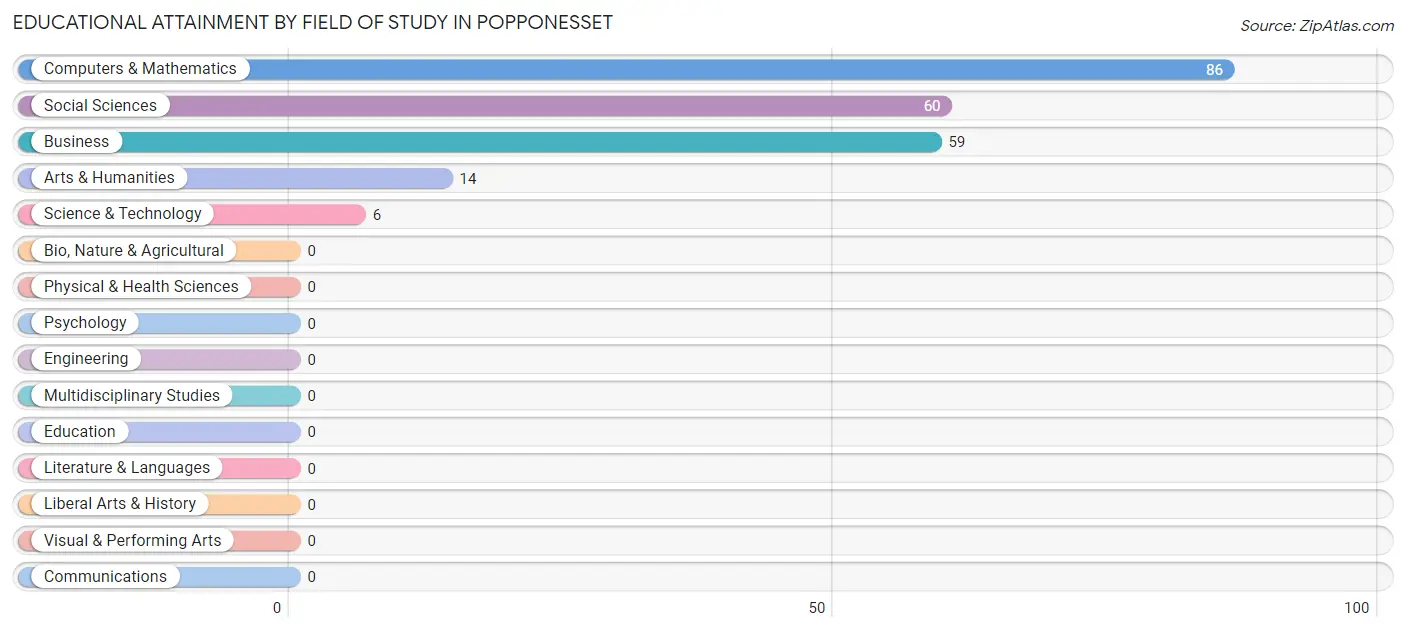
| Field of Study | # Graduates | % Graduates |
| Computers & Mathematics | 86 | 38.2% |
| Bio, Nature & Agricultural | 0 | 0.0% |
| Physical & Health Sciences | 0 | 0.0% |
| Psychology | 0 | 0.0% |
| Social Sciences | 60 | 26.7% |
| Engineering | 0 | 0.0% |
| Multidisciplinary Studies | 0 | 0.0% |
| Science & Technology | 6 | 2.7% |
| Business | 59 | 26.2% |
| Education | 0 | 0.0% |
| Literature & Languages | 0 | 0.0% |
| Liberal Arts & History | 0 | 0.0% |
| Visual & Performing Arts | 0 | 0.0% |
| Communications | 0 | 0.0% |
| Arts & Humanities | 14 | 6.2% |
| Total | 225 | 100.0% |
Transportation & Commute in Popponesset
Vehicle Availability by Sex in Popponesset
The most prevalent vehicle ownership categories in Popponesset are males with 1 vehicle (46, accounting for 86.8%) and females with 1 vehicle (50, making up 27.1%).
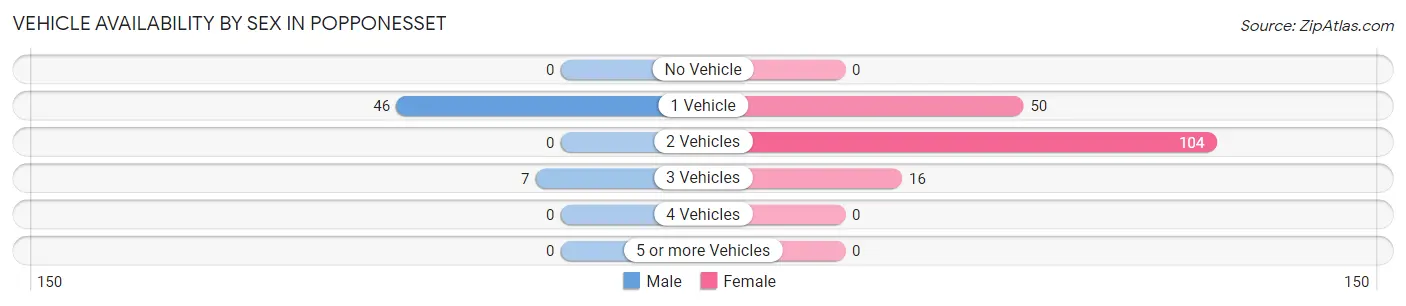
| Vehicles Available | Male | Female |
| No Vehicle | 0 (0.0%) | 0 (0.0%) |
| 1 Vehicle | 46 (86.8%) | 50 (29.4%) |
| 2 Vehicles | 0 (0.0%) | 104 (61.2%) |
| 3 Vehicles | 7 (13.2%) | 16 (9.4%) |
| 4 Vehicles | 0 (0.0%) | 0 (0.0%) |
| 5 or more Vehicles | 0 (0.0%) | 0 (0.0%) |
| Total | 53 (100.0%) | 170 (100.0%) |
Commute Time in Popponesset
The most frequently occuring commute durations in Popponesset are 10 to 14 minutes (94 commuters, 76.4%), 20 to 24 minutes (12 commuters, 9.8%), and 30 to 34 minutes (10 commuters, 8.1%).
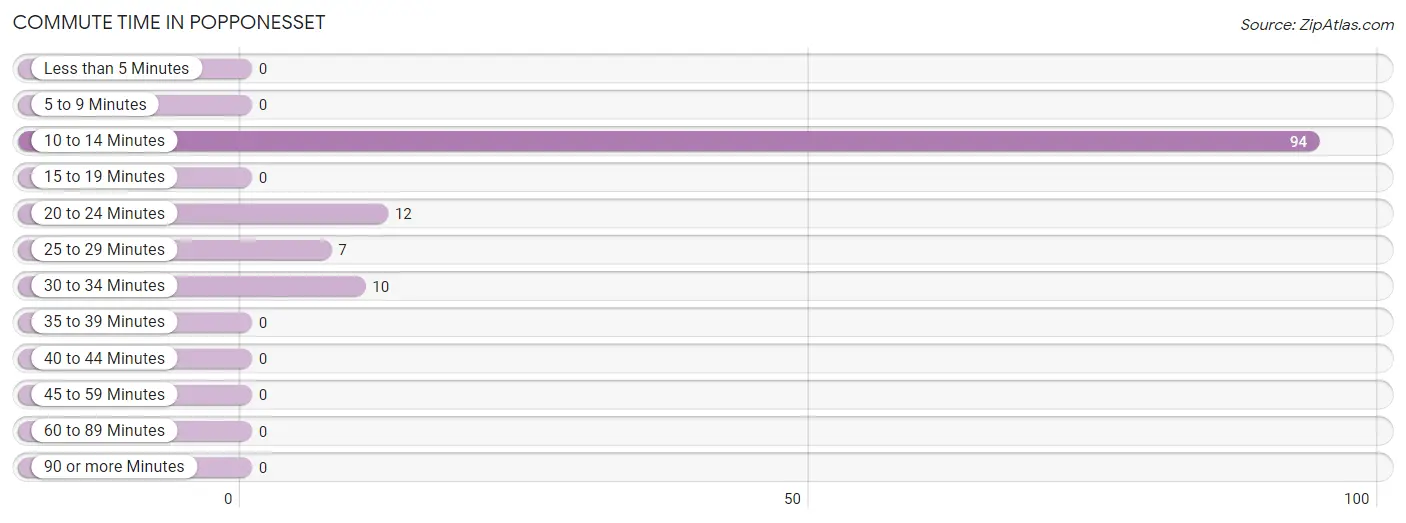
| Commute Time | # Commuters | % Commuters |
| Less than 5 Minutes | 0 | 0.0% |
| 5 to 9 Minutes | 0 | 0.0% |
| 10 to 14 Minutes | 94 | 76.4% |
| 15 to 19 Minutes | 0 | 0.0% |
| 20 to 24 Minutes | 12 | 9.8% |
| 25 to 29 Minutes | 7 | 5.7% |
| 30 to 34 Minutes | 10 | 8.1% |
| 35 to 39 Minutes | 0 | 0.0% |
| 40 to 44 Minutes | 0 | 0.0% |
| 45 to 59 Minutes | 0 | 0.0% |
| 60 to 89 Minutes | 0 | 0.0% |
| 90 or more Minutes | 0 | 0.0% |
Commute Time by Sex in Popponesset
The most common commute times in Popponesset are 30 to 34 minutes (10 commuters, 58.8%) for males and 10 to 14 minutes (94 commuters, 88.7%) for females.
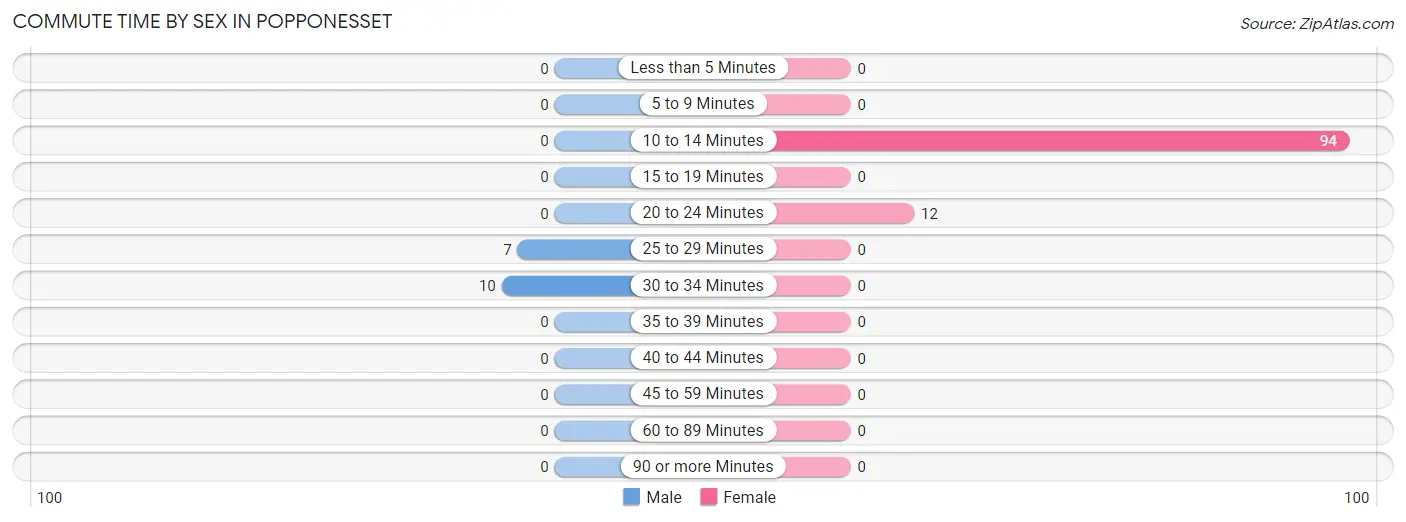
| Commute Time | Male | Female |
| Less than 5 Minutes | 0 (0.0%) | 0 (0.0%) |
| 5 to 9 Minutes | 0 (0.0%) | 0 (0.0%) |
| 10 to 14 Minutes | 0 (0.0%) | 94 (88.7%) |
| 15 to 19 Minutes | 0 (0.0%) | 0 (0.0%) |
| 20 to 24 Minutes | 0 (0.0%) | 12 (11.3%) |
| 25 to 29 Minutes | 7 (41.2%) | 0 (0.0%) |
| 30 to 34 Minutes | 10 (58.8%) | 0 (0.0%) |
| 35 to 39 Minutes | 0 (0.0%) | 0 (0.0%) |
| 40 to 44 Minutes | 0 (0.0%) | 0 (0.0%) |
| 45 to 59 Minutes | 0 (0.0%) | 0 (0.0%) |
| 60 to 89 Minutes | 0 (0.0%) | 0 (0.0%) |
| 90 or more Minutes | 0 (0.0%) | 0 (0.0%) |
Time of Departure to Work by Sex in Popponesset
The most frequent times of departure to work in Popponesset are 6:00 AM to 6:29 AM (10, 58.8%) for males and 7:30 AM to 7:59 AM (54, 50.9%) for females.
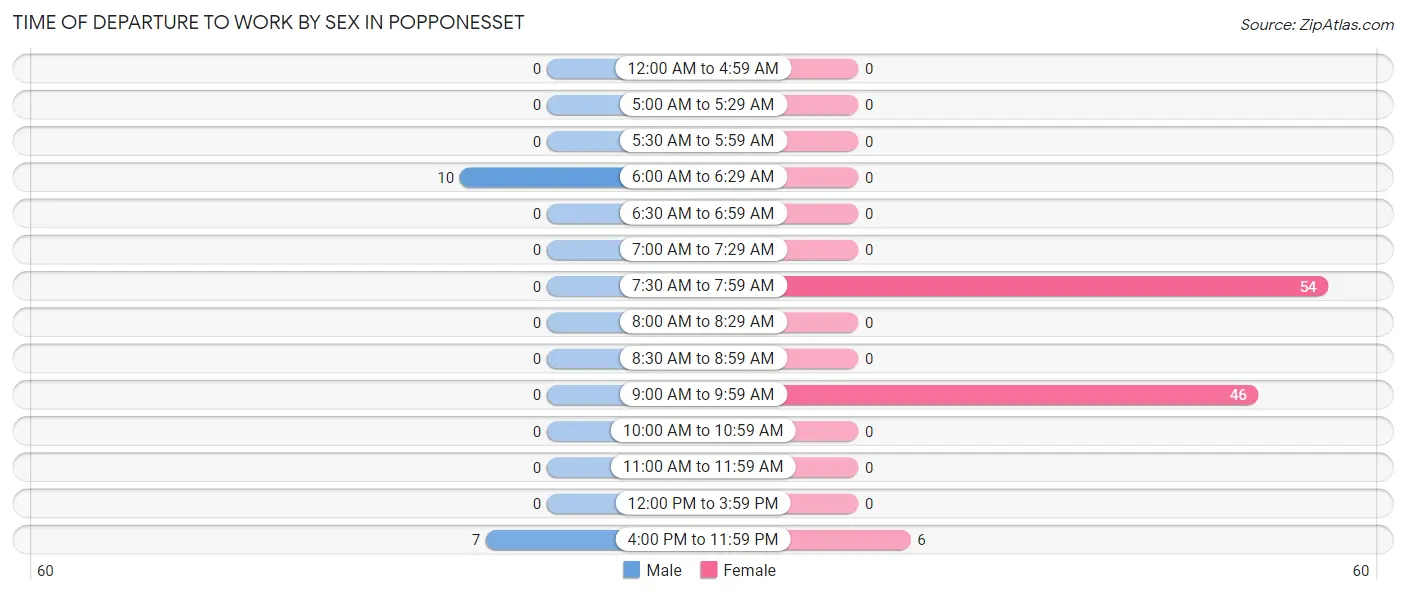
| Time of Departure | Male | Female |
| 12:00 AM to 4:59 AM | 0 (0.0%) | 0 (0.0%) |
| 5:00 AM to 5:29 AM | 0 (0.0%) | 0 (0.0%) |
| 5:30 AM to 5:59 AM | 0 (0.0%) | 0 (0.0%) |
| 6:00 AM to 6:29 AM | 10 (58.8%) | 0 (0.0%) |
| 6:30 AM to 6:59 AM | 0 (0.0%) | 0 (0.0%) |
| 7:00 AM to 7:29 AM | 0 (0.0%) | 0 (0.0%) |
| 7:30 AM to 7:59 AM | 0 (0.0%) | 54 (50.9%) |
| 8:00 AM to 8:29 AM | 0 (0.0%) | 0 (0.0%) |
| 8:30 AM to 8:59 AM | 0 (0.0%) | 0 (0.0%) |
| 9:00 AM to 9:59 AM | 0 (0.0%) | 46 (43.4%) |
| 10:00 AM to 10:59 AM | 0 (0.0%) | 0 (0.0%) |
| 11:00 AM to 11:59 AM | 0 (0.0%) | 0 (0.0%) |
| 12:00 PM to 3:59 PM | 0 (0.0%) | 0 (0.0%) |
| 4:00 PM to 11:59 PM | 7 (41.2%) | 6 (5.7%) |
| Total | 17 (100.0%) | 106 (100.0%) |
Housing Occupancy in Popponesset
Occupancy by Ownership in Popponesset
Of the total 177 dwellings in Popponesset, owner-occupied units account for 125 (70.6%), while renter-occupied units make up 52 (29.4%).
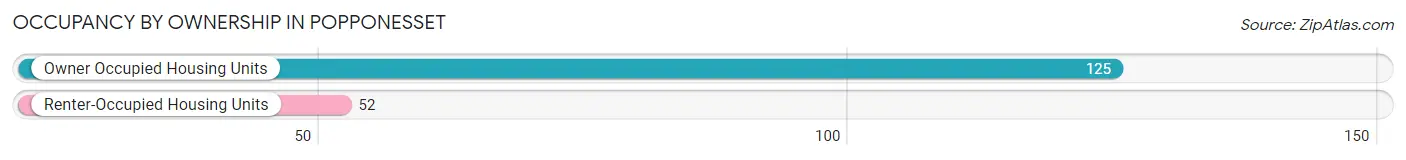
| Occupancy | # Housing Units | % Housing Units |
| Owner Occupied Housing Units | 125 | 70.6% |
| Renter-Occupied Housing Units | 52 | 29.4% |
| Total Occupied Housing Units | 177 | 100.0% |
Occupancy by Household Size in Popponesset
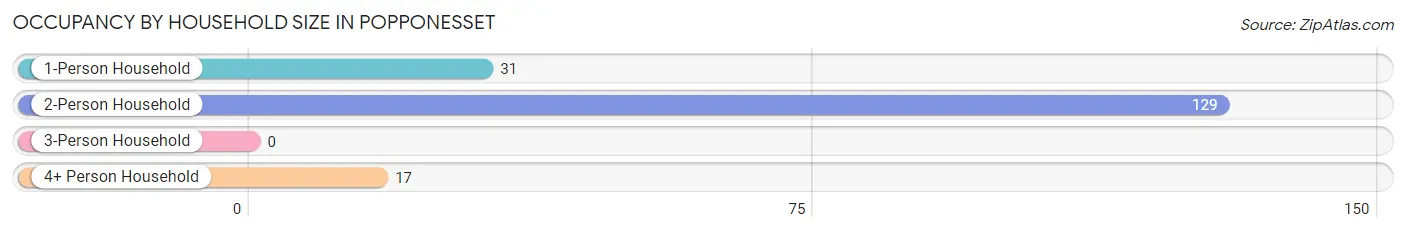
| Household Size | # Housing Units | % Housing Units |
| 1-Person Household | 31 | 17.5% |
| 2-Person Household | 129 | 72.9% |
| 3-Person Household | 0 | 0.0% |
| 4+ Person Household | 17 | 9.6% |
| Total Housing Units | 177 | 100.0% |
Occupancy by Ownership by Household Size in Popponesset
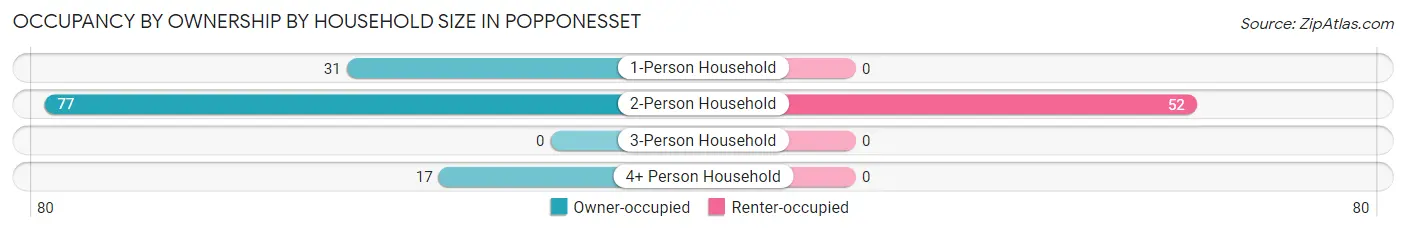
| Household Size | Owner-occupied | Renter-occupied |
| 1-Person Household | 31 (100.0%) | 0 (0.0%) |
| 2-Person Household | 77 (59.7%) | 52 (40.3%) |
| 3-Person Household | 0 (0.0%) | 0 (0.0%) |
| 4+ Person Household | 17 (100.0%) | 0 (0.0%) |
| Total Housing Units | 125 (70.6%) | 52 (29.4%) |
Occupancy by Educational Attainment in Popponesset
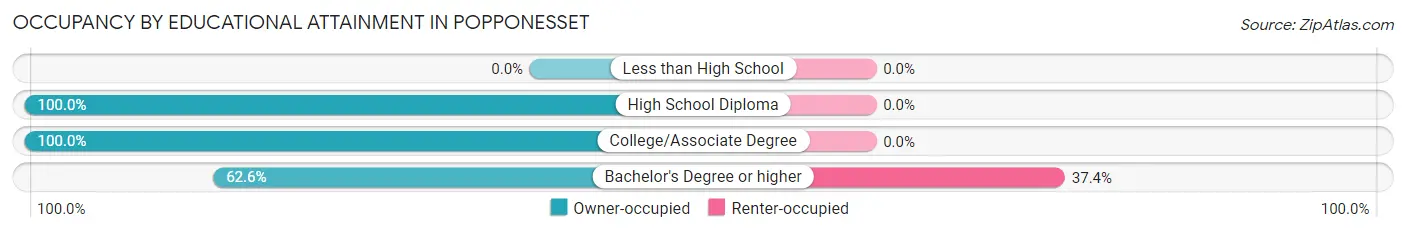
| Household Size | Owner-occupied | Renter-occupied |
| Less than High School | 0 (0.0%) | 0 (0.0%) |
| High School Diploma | 29 (100.0%) | 0 (0.0%) |
| College/Associate Degree | 9 (100.0%) | 0 (0.0%) |
| Bachelor's Degree or higher | 87 (62.6%) | 52 (37.4%) |
Occupancy by Age of Householder in Popponesset
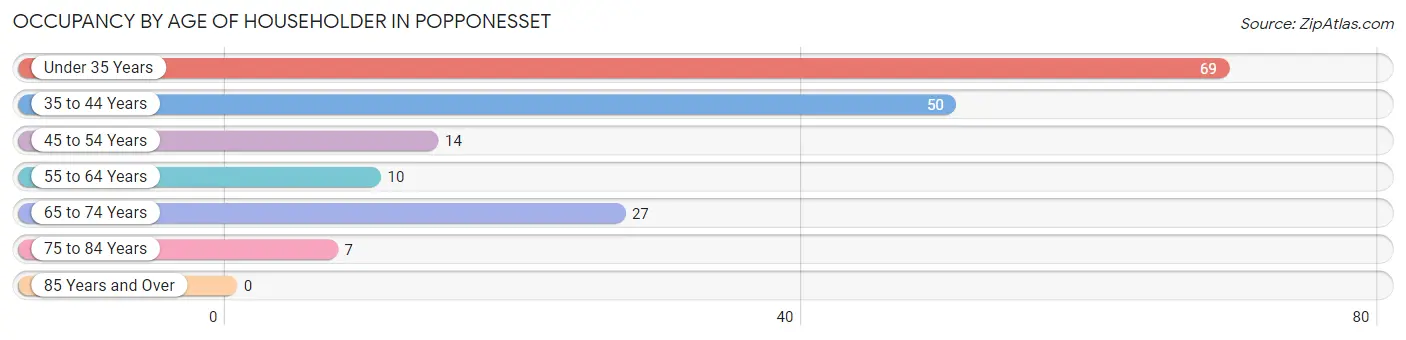
| Age Bracket | # Households | % Households |
| Under 35 Years | 69 | 39.0% |
| 35 to 44 Years | 50 | 28.2% |
| 45 to 54 Years | 14 | 7.9% |
| 55 to 64 Years | 10 | 5.7% |
| 65 to 74 Years | 27 | 15.2% |
| 75 to 84 Years | 7 | 4.0% |
| 85 Years and Over | 0 | 0.0% |
| Total | 177 | 100.0% |
Housing Finances in Popponesset
Median Income by Occupancy in Popponesset
| Occupancy Type | # Households | Median Income |
| Owner-Occupied | 125 (70.6%) | $0 |
| Renter-Occupied | 52 (29.4%) | $0 |
| Average | 177 (100.0%) | $0 |
Occupancy by Householder Income Bracket in Popponesset
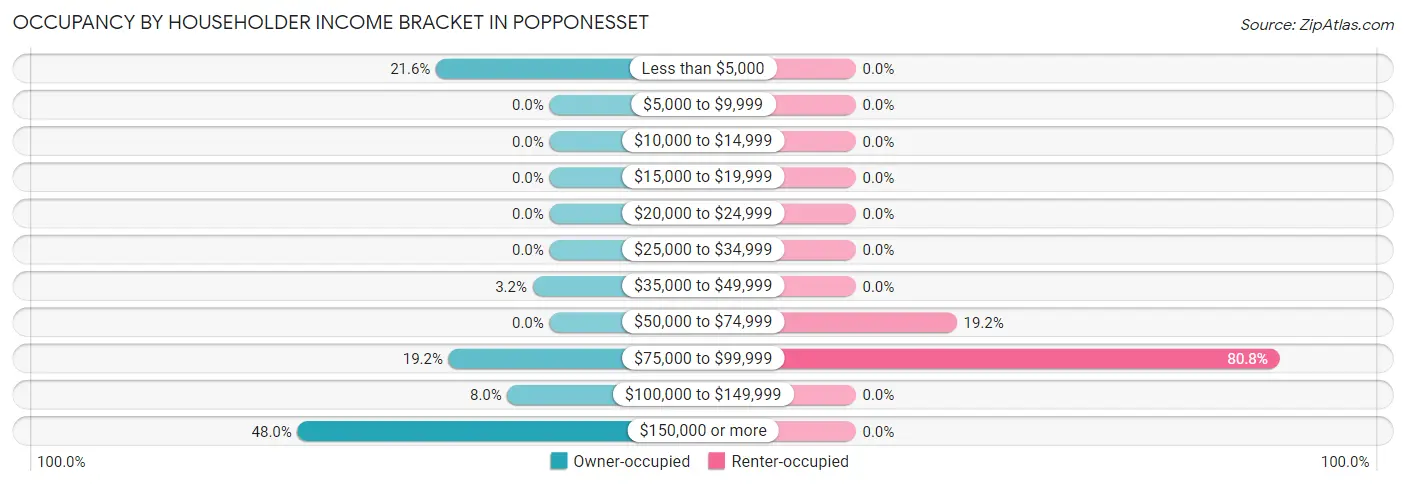
| Income Bracket | Owner-occupied | Renter-occupied |
| Less than $5,000 | 27 (21.6%) | 0 (0.0%) |
| $5,000 to $9,999 | 0 (0.0%) | 0 (0.0%) |
| $10,000 to $14,999 | 0 (0.0%) | 0 (0.0%) |
| $15,000 to $19,999 | 0 (0.0%) | 0 (0.0%) |
| $20,000 to $24,999 | 0 (0.0%) | 0 (0.0%) |
| $25,000 to $34,999 | 0 (0.0%) | 0 (0.0%) |
| $35,000 to $49,999 | 4 (3.2%) | 0 (0.0%) |
| $50,000 to $74,999 | 0 (0.0%) | 10 (19.2%) |
| $75,000 to $99,999 | 24 (19.2%) | 42 (80.8%) |
| $100,000 to $149,999 | 10 (8.0%) | 0 (0.0%) |
| $150,000 or more | 60 (48.0%) | 0 (0.0%) |
| Total | 125 (100.0%) | 52 (100.0%) |
Monthly Housing Cost Tiers in Popponesset
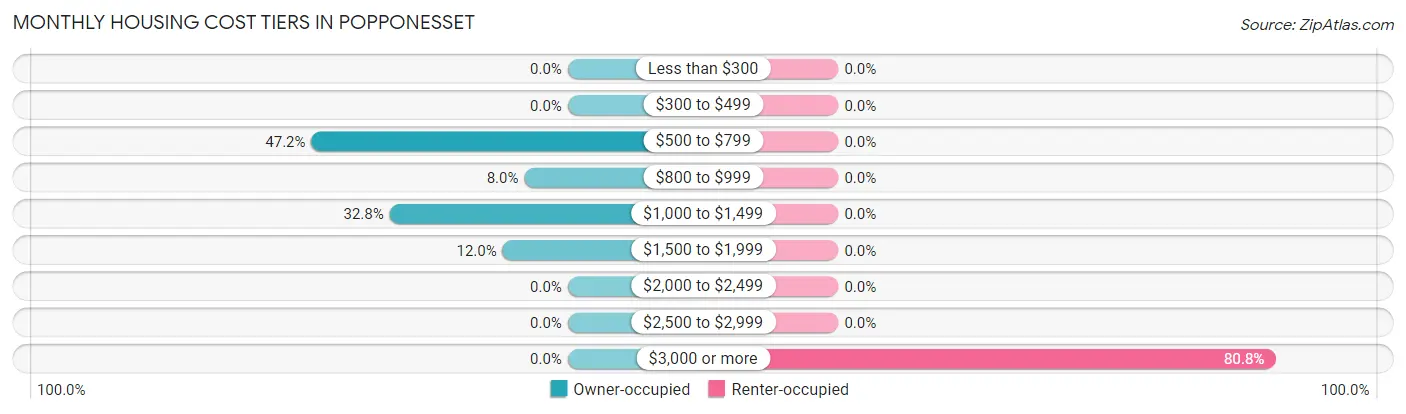
| Monthly Cost | Owner-occupied | Renter-occupied |
| Less than $300 | 0 (0.0%) | 0 (0.0%) |
| $300 to $499 | 0 (0.0%) | 0 (0.0%) |
| $500 to $799 | 59 (47.2%) | 0 (0.0%) |
| $800 to $999 | 10 (8.0%) | 0 (0.0%) |
| $1,000 to $1,499 | 41 (32.8%) | 0 (0.0%) |
| $1,500 to $1,999 | 15 (12.0%) | 0 (0.0%) |
| $2,000 to $2,499 | 0 (0.0%) | 0 (0.0%) |
| $2,500 to $2,999 | 0 (0.0%) | 0 (0.0%) |
| $3,000 or more | 0 (0.0%) | 42 (80.8%) |
| Total | 125 (100.0%) | 52 (100.0%) |
Physical Housing Characteristics in Popponesset
Housing Structures in Popponesset
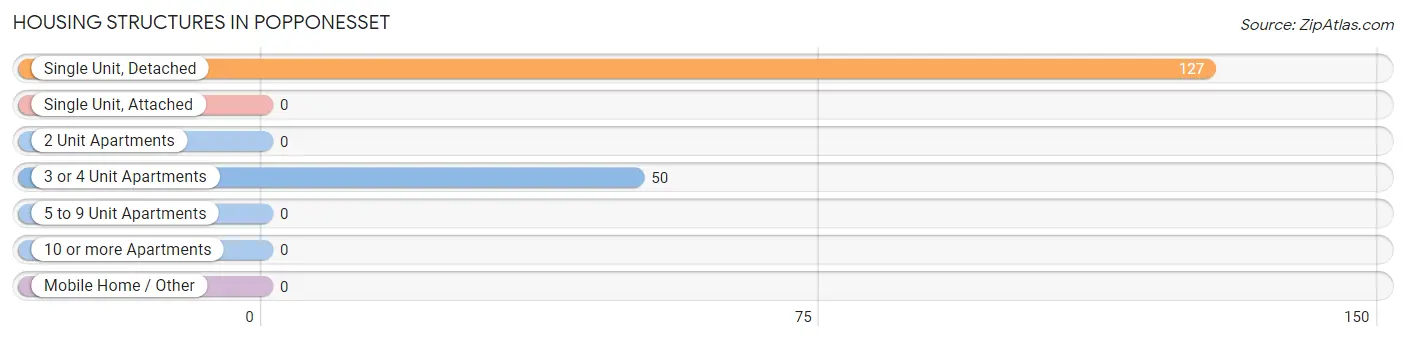
| Structure Type | # Housing Units | % Housing Units |
| Single Unit, Detached | 127 | 71.8% |
| Single Unit, Attached | 0 | 0.0% |
| 2 Unit Apartments | 0 | 0.0% |
| 3 or 4 Unit Apartments | 50 | 28.2% |
| 5 to 9 Unit Apartments | 0 | 0.0% |
| 10 or more Apartments | 0 | 0.0% |
| Mobile Home / Other | 0 | 0.0% |
| Total | 177 | 100.0% |
Housing Structures by Occupancy in Popponesset
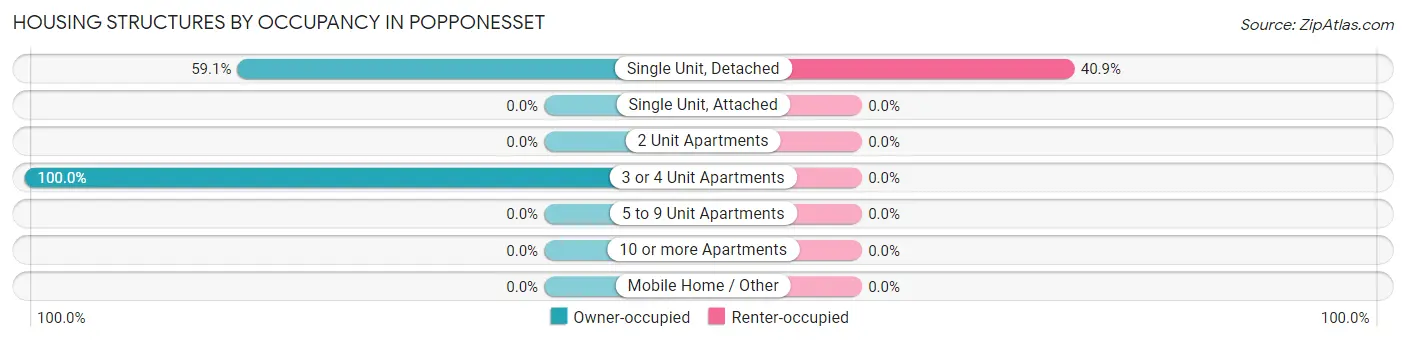
| Structure Type | Owner-occupied | Renter-occupied |
| Single Unit, Detached | 75 (59.1%) | 52 (40.9%) |
| Single Unit, Attached | 0 (0.0%) | 0 (0.0%) |
| 2 Unit Apartments | 0 (0.0%) | 0 (0.0%) |
| 3 or 4 Unit Apartments | 50 (100.0%) | 0 (0.0%) |
| 5 to 9 Unit Apartments | 0 (0.0%) | 0 (0.0%) |
| 10 or more Apartments | 0 (0.0%) | 0 (0.0%) |
| Mobile Home / Other | 0 (0.0%) | 0 (0.0%) |
| Total | 125 (70.6%) | 52 (29.4%) |
Housing Structures by Number of Rooms in Popponesset
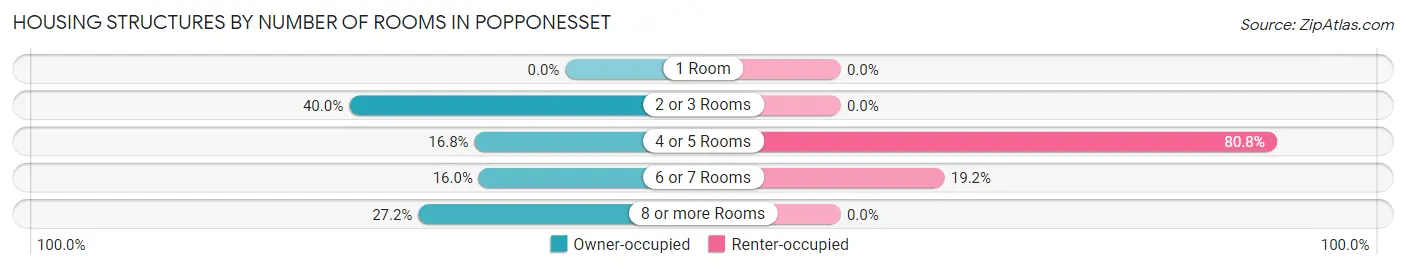
| Number of Rooms | Owner-occupied | Renter-occupied |
| 1 Room | 0 (0.0%) | 0 (0.0%) |
| 2 or 3 Rooms | 50 (40.0%) | 0 (0.0%) |
| 4 or 5 Rooms | 21 (16.8%) | 42 (80.8%) |
| 6 or 7 Rooms | 20 (16.0%) | 10 (19.2%) |
| 8 or more Rooms | 34 (27.2%) | 0 (0.0%) |
| Total | 125 (100.0%) | 52 (100.0%) |
Housing Structure by Heating Type in Popponesset
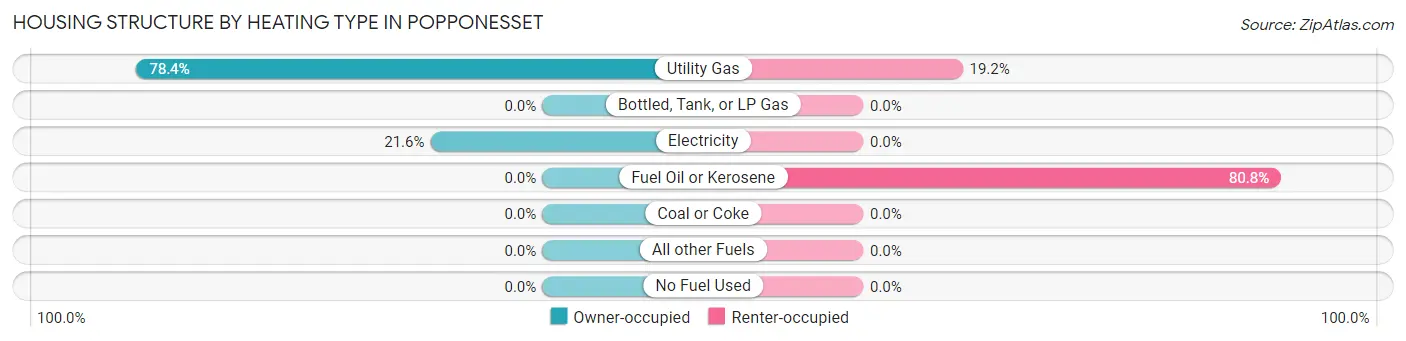
| Heating Type | Owner-occupied | Renter-occupied |
| Utility Gas | 98 (78.4%) | 10 (19.2%) |
| Bottled, Tank, or LP Gas | 0 (0.0%) | 0 (0.0%) |
| Electricity | 27 (21.6%) | 0 (0.0%) |
| Fuel Oil or Kerosene | 0 (0.0%) | 42 (80.8%) |
| Coal or Coke | 0 (0.0%) | 0 (0.0%) |
| All other Fuels | 0 (0.0%) | 0 (0.0%) |
| No Fuel Used | 0 (0.0%) | 0 (0.0%) |
| Total | 125 (100.0%) | 52 (100.0%) |
Household Vehicle Usage in Popponesset
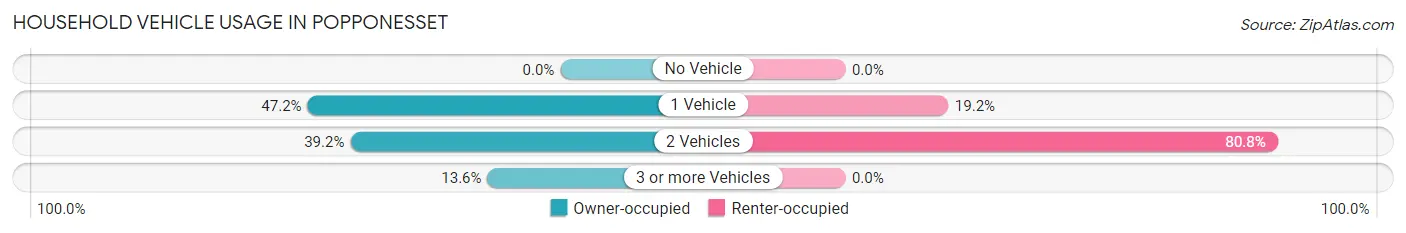
| Vehicles per Household | Owner-occupied | Renter-occupied |
| No Vehicle | 0 (0.0%) | 0 (0.0%) |
| 1 Vehicle | 59 (47.2%) | 10 (19.2%) |
| 2 Vehicles | 49 (39.2%) | 42 (80.8%) |
| 3 or more Vehicles | 17 (13.6%) | 0 (0.0%) |
| Total | 125 (100.0%) | 52 (100.0%) |
Real Estate & Mortgages in Popponesset
Real Estate and Mortgage Overview in Popponesset
| Characteristic | Without Mortgage | With Mortgage |
| Housing Units | 110 | 15 |
| Median Property Value | $527,200 | $0 |
| Median Household Income | $250,001 | $0 |
| Monthly Housing Costs | $793 | $0 |
| Real Estate Taxes | $3,185 | $0 |
Property Value by Mortgage Status in Popponesset
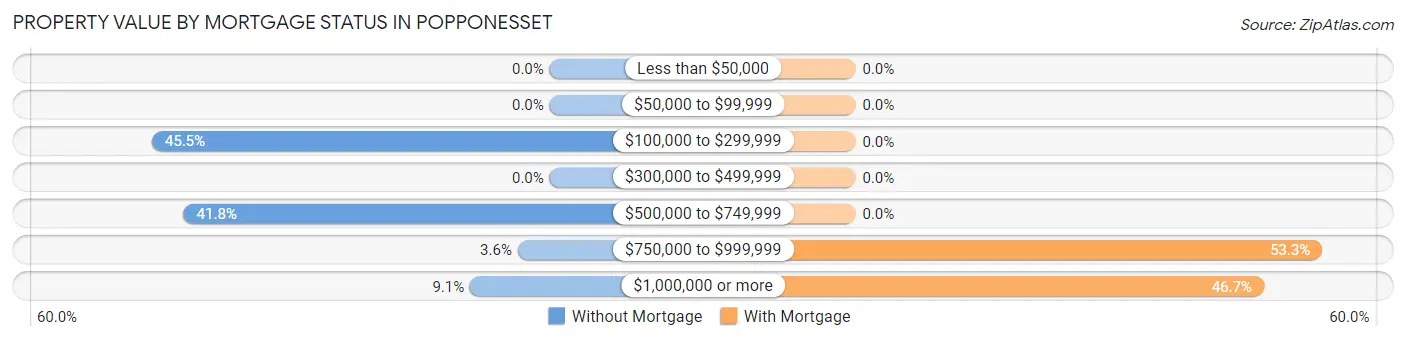
| Property Value | Without Mortgage | With Mortgage |
| Less than $50,000 | 0 (0.0%) | 0 (0.0%) |
| $50,000 to $99,999 | 0 (0.0%) | 0 (0.0%) |
| $100,000 to $299,999 | 50 (45.5%) | 0 (0.0%) |
| $300,000 to $499,999 | 0 (0.0%) | 0 (0.0%) |
| $500,000 to $749,999 | 46 (41.8%) | 0 (0.0%) |
| $750,000 to $999,999 | 4 (3.6%) | 8 (53.3%) |
| $1,000,000 or more | 10 (9.1%) | 7 (46.7%) |
| Total | 110 (100.0%) | 15 (100.0%) |
Household Income by Mortgage Status in Popponesset
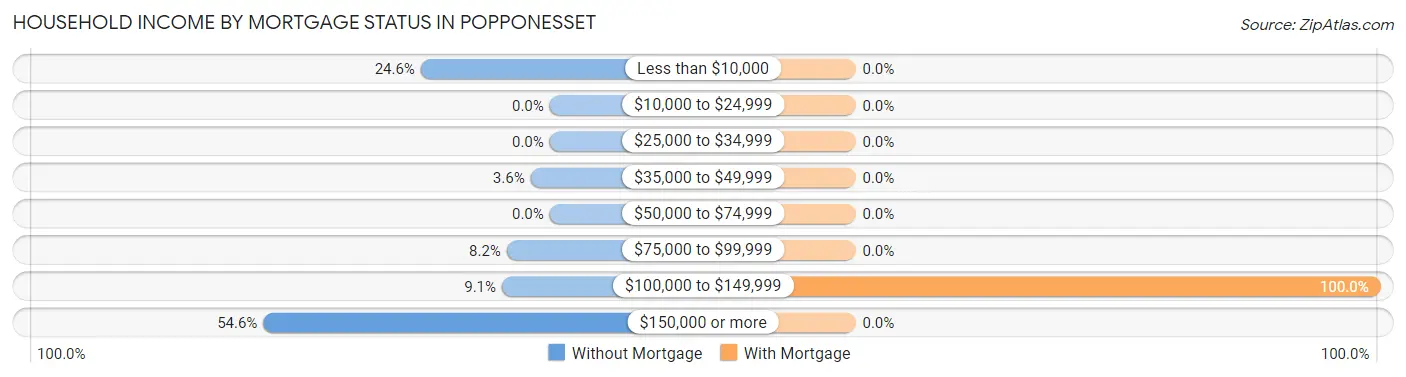
| Household Income | Without Mortgage | With Mortgage |
| Less than $10,000 | 27 (24.5%) | 0 (0.0%) |
| $10,000 to $24,999 | 0 (0.0%) | 0 (0.0%) |
| $25,000 to $34,999 | 0 (0.0%) | 0 (0.0%) |
| $35,000 to $49,999 | 4 (3.6%) | 0 (0.0%) |
| $50,000 to $74,999 | 0 (0.0%) | 0 (0.0%) |
| $75,000 to $99,999 | 9 (8.2%) | 0 (0.0%) |
| $100,000 to $149,999 | 10 (9.1%) | 15 (100.0%) |
| $150,000 or more | 60 (54.5%) | 0 (0.0%) |
| Total | 110 (100.0%) | 15 (100.0%) |
Property Value to Household Income Ratio in Popponesset
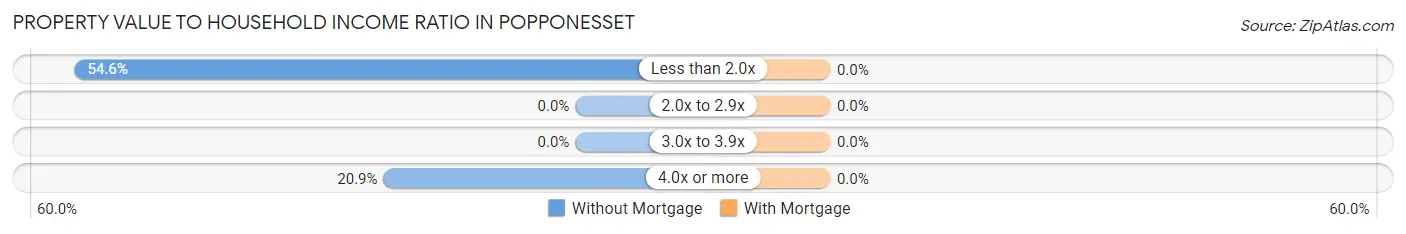
| Value-to-Income Ratio | Without Mortgage | With Mortgage |
| Less than 2.0x | 60 (54.5%) | 0 (0.0%) |
| 2.0x to 2.9x | 0 (0.0%) | 0 (0.0%) |
| 3.0x to 3.9x | 0 (0.0%) | 0 (0.0%) |
| 4.0x or more | 23 (20.9%) | 0 (0.0%) |
| Total | 110 (100.0%) | 15 (100.0%) |
Real Estate Taxes by Mortgage Status in Popponesset
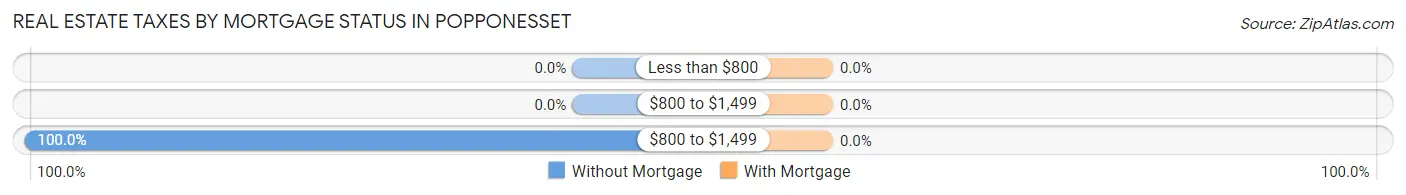
| Property Taxes | Without Mortgage | With Mortgage |
| Less than $800 | 0 (0.0%) | 0 (0.0%) |
| $800 to $1,499 | 0 (0.0%) | 0 (0.0%) |
| $800 to $1,499 | 110 (100.0%) | 0 (0.0%) |
| Total | 110 (100.0%) | 15 (100.0%) |
Health & Disability in Popponesset
Health Insurance Coverage by Age in Popponesset
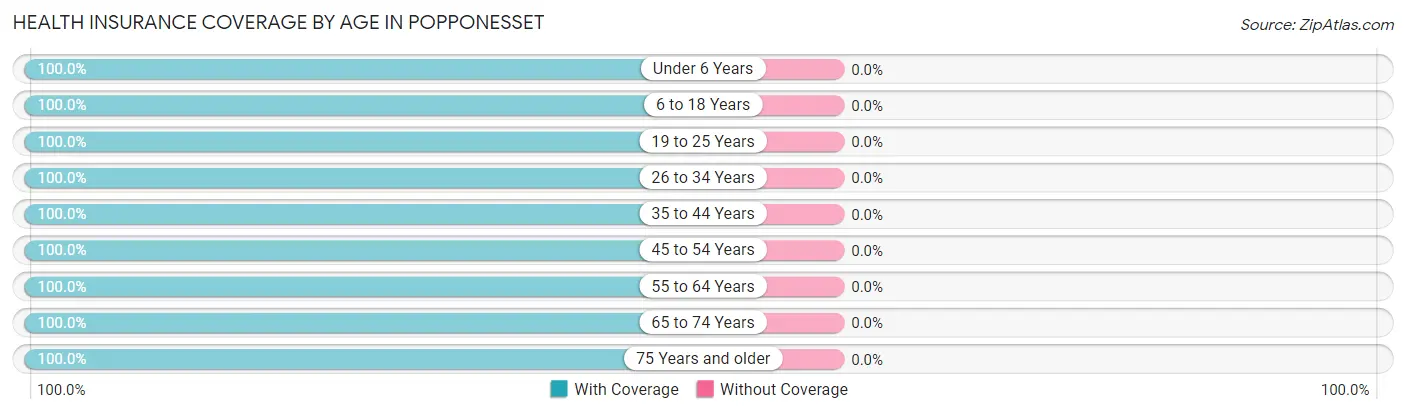
| Age Bracket | With Coverage | Without Coverage |
| Under 6 Years | 15 (100.0%) | 0 (0.0%) |
| 6 to 18 Years | 22 (100.0%) | 0 (0.0%) |
| 19 to 25 Years | 115 (100.0%) | 0 (0.0%) |
| 26 to 34 Years | 49 (100.0%) | 0 (0.0%) |
| 35 to 44 Years | 50 (100.0%) | 0 (0.0%) |
| 45 to 54 Years | 26 (100.0%) | 0 (0.0%) |
| 55 to 64 Years | 29 (100.0%) | 0 (0.0%) |
| 65 to 74 Years | 53 (100.0%) | 0 (0.0%) |
| 75 Years and older | 7 (100.0%) | 0 (0.0%) |
| Total | 366 (100.0%) | 0 (0.0%) |
Health Insurance Coverage by Citizenship Status in Popponesset
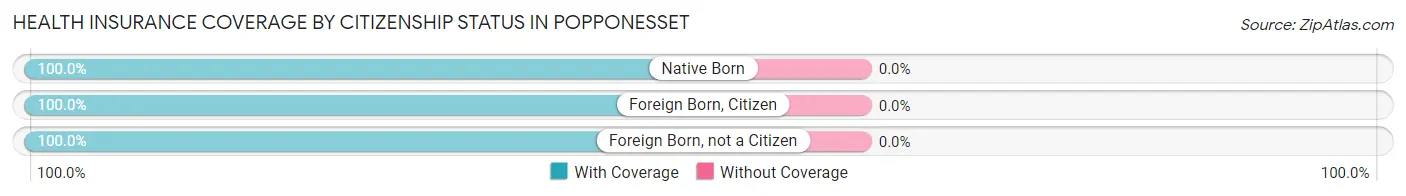
| Citizenship Status | With Coverage | Without Coverage |
| Native Born | 15 (100.0%) | 0 (0.0%) |
| Foreign Born, Citizen | 22 (100.0%) | 0 (0.0%) |
| Foreign Born, not a Citizen | 115 (100.0%) | 0 (0.0%) |
Health Insurance Coverage by Household Income in Popponesset
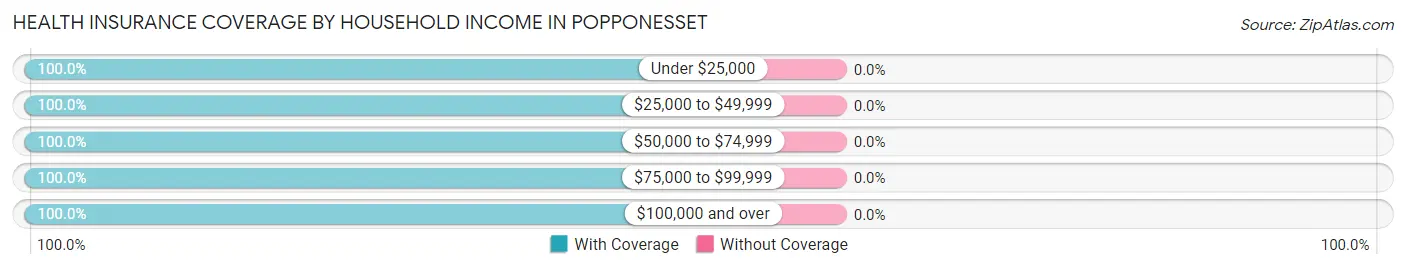
| Household Income | With Coverage | Without Coverage |
| Under $25,000 | 27 (100.0%) | 0 (0.0%) |
| $25,000 to $49,999 | 4 (100.0%) | 0 (0.0%) |
| $50,000 to $74,999 | 21 (100.0%) | 0 (0.0%) |
| $75,000 to $99,999 | 163 (100.0%) | 0 (0.0%) |
| $100,000 and over | 151 (100.0%) | 0 (0.0%) |
Public vs Private Health Insurance Coverage by Age in Popponesset
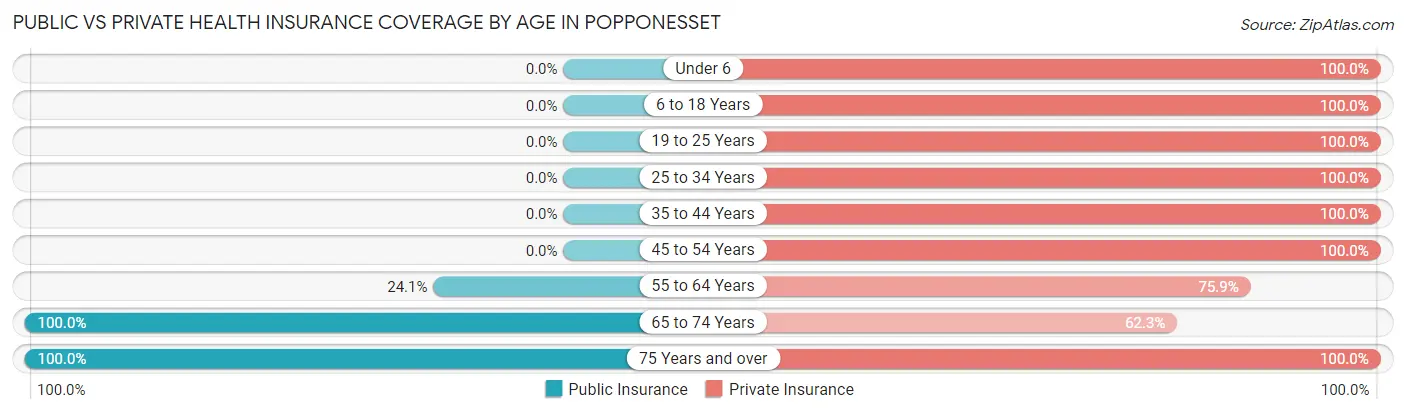
| Age Bracket | Public Insurance | Private Insurance |
| Under 6 | 0 (0.0%) | 15 (100.0%) |
| 6 to 18 Years | 0 (0.0%) | 22 (100.0%) |
| 19 to 25 Years | 0 (0.0%) | 115 (100.0%) |
| 25 to 34 Years | 0 (0.0%) | 49 (100.0%) |
| 35 to 44 Years | 0 (0.0%) | 50 (100.0%) |
| 45 to 54 Years | 0 (0.0%) | 26 (100.0%) |
| 55 to 64 Years | 7 (24.1%) | 22 (75.9%) |
| 65 to 74 Years | 53 (100.0%) | 33 (62.3%) |
| 75 Years and over | 7 (100.0%) | 7 (100.0%) |
| Total | 67 (18.3%) | 339 (92.6%) |
Disability Status by Sex by Age in Popponesset
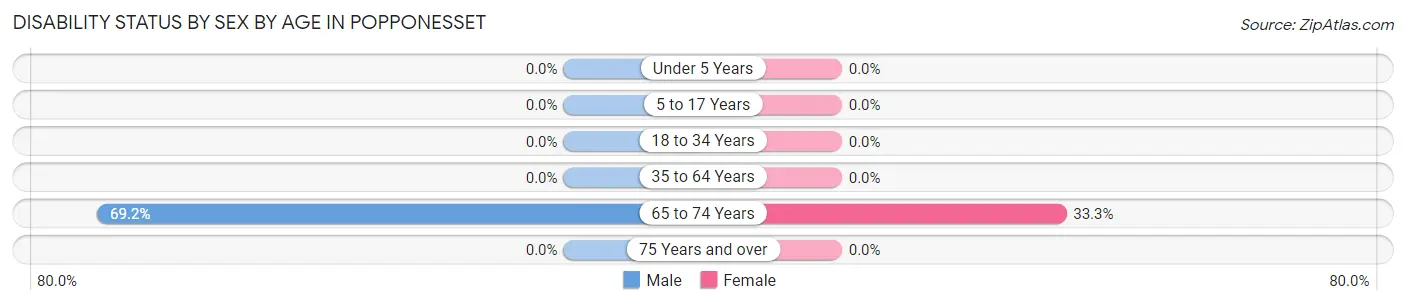
| Age Bracket | Male | Female |
| Under 5 Years | 0 (0.0%) | 0 (0.0%) |
| 5 to 17 Years | 0 (0.0%) | 0 (0.0%) |
| 18 to 34 Years | 0 (0.0%) | 0 (0.0%) |
| 35 to 64 Years | 0 (0.0%) | 0 (0.0%) |
| 65 to 74 Years | 18 (69.2%) | 9 (33.3%) |
| 75 Years and over | 0 (0.0%) | 0 (0.0%) |
Disability Class by Sex by Age in Popponesset
Disability Class: Hearing Difficulty
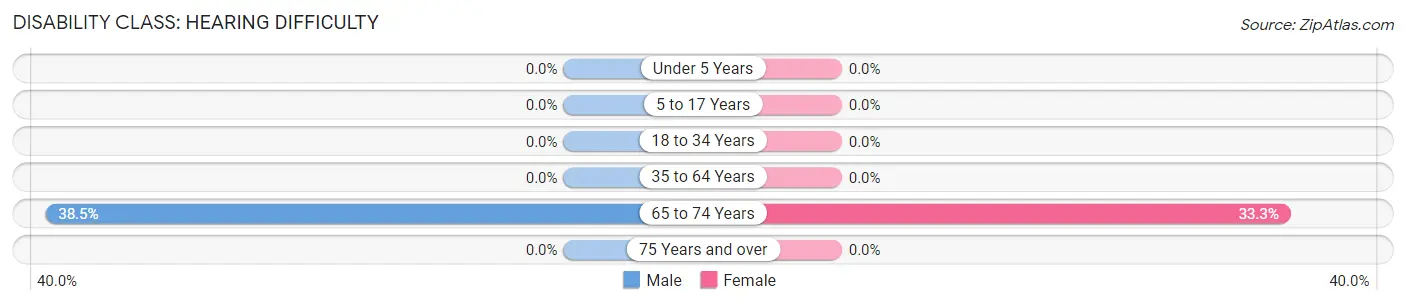
| Age Bracket | Male | Female |
| Under 5 Years | 0 (0.0%) | 0 (0.0%) |
| 5 to 17 Years | 0 (0.0%) | 0 (0.0%) |
| 18 to 34 Years | 0 (0.0%) | 0 (0.0%) |
| 35 to 64 Years | 0 (0.0%) | 0 (0.0%) |
| 65 to 74 Years | 10 (38.5%) | 9 (33.3%) |
| 75 Years and over | 0 (0.0%) | 0 (0.0%) |
Disability Class: Vision Difficulty
| Age Bracket | Male | Female |
| Under 5 Years | 0 (0.0%) | 0 (0.0%) |
| 5 to 17 Years | 0 (0.0%) | 0 (0.0%) |
| 18 to 34 Years | 0 (0.0%) | 0 (0.0%) |
| 35 to 64 Years | 0 (0.0%) | 0 (0.0%) |
| 65 to 74 Years | 0 (0.0%) | 0 (0.0%) |
| 75 Years and over | 0 (0.0%) | 0 (0.0%) |
Disability Class: Cognitive Difficulty
| Age Bracket | Male | Female |
| 5 to 17 Years | 0 (0.0%) | 0 (0.0%) |
| 18 to 34 Years | 0 (0.0%) | 0 (0.0%) |
| 35 to 64 Years | 0 (0.0%) | 0 (0.0%) |
| 65 to 74 Years | 0 (0.0%) | 0 (0.0%) |
| 75 Years and over | 0 (0.0%) | 0 (0.0%) |
Disability Class: Ambulatory Difficulty
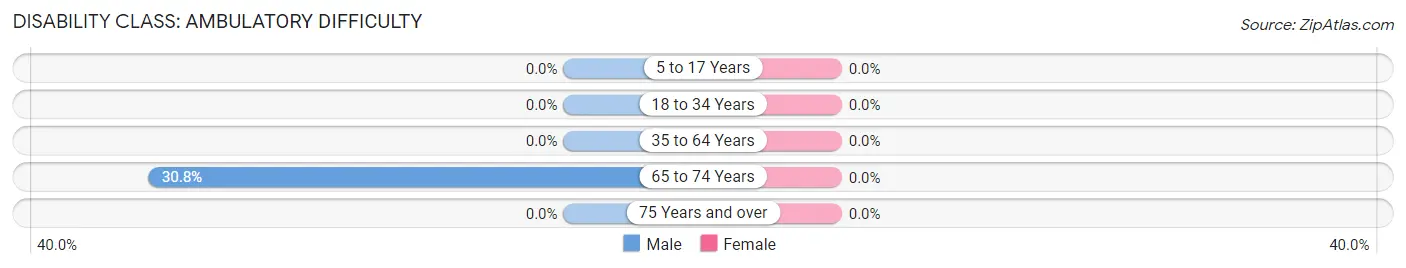
| Age Bracket | Male | Female |
| 5 to 17 Years | 0 (0.0%) | 0 (0.0%) |
| 18 to 34 Years | 0 (0.0%) | 0 (0.0%) |
| 35 to 64 Years | 0 (0.0%) | 0 (0.0%) |
| 65 to 74 Years | 8 (30.8%) | 0 (0.0%) |
| 75 Years and over | 0 (0.0%) | 0 (0.0%) |
Disability Class: Self-Care Difficulty

| Age Bracket | Male | Female |
| 5 to 17 Years | 0 (0.0%) | 0 (0.0%) |
| 18 to 34 Years | 0 (0.0%) | 0 (0.0%) |
| 35 to 64 Years | 0 (0.0%) | 0 (0.0%) |
| 65 to 74 Years | 0 (0.0%) | 0 (0.0%) |
| 75 Years and over | 0 (0.0%) | 0 (0.0%) |
Technology Access in Popponesset
Computing Device Access in Popponesset
| Device Type | # Households | % Households |
| Desktop or Laptop | 177 | 100.0% |
| Smartphone | 177 | 100.0% |
| Tablet | 125 | 70.6% |
| No Computing Device | 0 | 0.0% |
| Total | 177 | 100.0% |
Internet Access in Popponesset
| Internet Type | # Households | % Households |
| Dial-Up Internet | 0 | 0.0% |
| Broadband Home | 177 | 100.0% |
| Cellular Data Only | 0 | 0.0% |
| Satellite Internet | 10 | 5.7% |
| No Internet | 0 | 0.0% |
| Total | 177 | 100.0% |
Popponesset Summary
Popponesset is a small village located in the town of Mashpee, Massachusetts, on the south shore of Cape Cod. It is a popular summer destination for tourists and locals alike, and is known for its beautiful beaches, quaint shops, and vibrant nightlife.
History
Popponesset was originally inhabited by the Wampanoag tribe, who lived in the area for centuries before the arrival of European settlers. The first Europeans to settle in the area were the English, who arrived in 1658. They named the area Popponesset, after the Wampanoag chief, Popponesset. The English settlers established a trading post in the area, and the Wampanoag tribe continued to live in the area until the mid-1800s.
In the late 1800s, Popponesset began to attract tourists from all over the country. The area was known for its beautiful beaches, and many people came to enjoy the sun and sand. In the early 1900s, the area began to develop into a resort town, with hotels, restaurants, and other businesses popping up to cater to the influx of tourists.
Geography
Popponesset is located on the south shore of Cape Cod, in the town of Mashpee. It is bordered by the towns of Falmouth, Sandwich, and Barnstable. The village is situated on a peninsula, with Popponesset Bay to the east and Nantucket Sound to the west. The area is known for its beautiful beaches, which are popular with tourists and locals alike.
Economy
Popponesset’s economy is largely based on tourism. The area is known for its beautiful beaches, and many people come to the area to enjoy the sun and sand. The village also has a number of restaurants, shops, and other businesses that cater to tourists. In addition, the area is home to a number of marinas, which provide services to boaters and fishermen.
Demographics
As of the 2010 census, the population of Popponesset was 1,845. The population is largely white (94.3%), with a small percentage of African Americans (2.2%) and Hispanics (2.5%). The median household income in the village is $68,750, and the median home value is $521,000. The village is served by the Mashpee Public Schools, and the nearest college is Cape Cod Community College, located in nearby Barnstable.
Common Questions
What is Per Capita Income in Popponesset?
Per Capita income in Popponesset is $107,889.
What is the Median Family Income in Popponesset?
Median Family Income in Popponesset is $250,001.
What is Inequality or Gini Index in Popponesset?
Inequality or Gini Index in Popponesset is 0.58.
What is the Total Population of Popponesset?
Total Population of Popponesset is 366.
What is the Total Male Population of Popponesset?
Total Male Population of Popponesset is 129.
What is the Total Female Population of Popponesset?
Total Female Population of Popponesset is 237.
What is the Ratio of Males per 100 Females in Popponesset?
There are 54.43 Males per 100 Females in Popponesset.
What is the Ratio of Females per 100 Males in Popponesset?
There are 183.72 Females per 100 Males in Popponesset.
What is the Median Population Age in Popponesset?
Median Population Age in Popponesset is 34.6 Years.
What is the Average Family Size in Popponesset
Average Family Size in Popponesset is 2.4 People.
What is the Average Household Size in Popponesset
Average Household Size in Popponesset is 2.1 People.
How Large is the Labor Force in Popponesset?
There are 260 People in the Labor Forcein in Popponesset.
What is the Percentage of People in the Labor Force in Popponesset?
79.0% of People are in the Labor Force in Popponesset.
What is the Unemployment Rate in Popponesset?
Unemployment Rate in Popponesset is 14.2%.