Orange, MA Map & Demographics
Orange Map
Orange Overview
$28,526
PER CAPITA INCOME
$71,985
AVG FAMILY INCOME
$55,558
AVG HOUSEHOLD INCOME
3.3%
WAGE / INCOME GAP [ % ]
96.7¢/ $1
WAGE / INCOME GAP [ $ ]
$11,452
FAMILY INCOME DEFICIT
0.38
INEQUALITY / GINI INDEX
3,731
TOTAL POPULATION
1,830
MALE POPULATION
1,901
FEMALE POPULATION
96.27
MALES / 100 FEMALES
103.88
FEMALES / 100 MALES
41.2
MEDIAN AGE
3.3
AVG FAMILY SIZE
2.5
AVG HOUSEHOLD SIZE
1,828
LABOR FORCE [ PEOPLE ]
59.4%
PERCENT IN LABOR FORCE
13.0%
UNEMPLOYMENT RATE
Orange Zip Codes
Orange Area Codes
Income in Orange
Income Overview in Orange
Per Capita Income in Orange is $28,526, while median incomes of families and households are $71,985 and $55,558 respectively.
| Characteristic | Number | Measure |
| Per Capita Income | 3,731 | $28,526 |
| Median Family Income | 885 | $71,985 |
| Mean Family Income | 885 | $79,613 |
| Median Household Income | 1,465 | $55,558 |
| Mean Household Income | 1,465 | $68,729 |
| Income Deficit | 885 | $11,452 |
| Wage / Income Gap (%) | 3,731 | 3.33% |
| Wage / Income Gap ($) | 3,731 | 96.67¢ per $1 |
| Gini / Inequality Index | 3,731 | 0.38 |
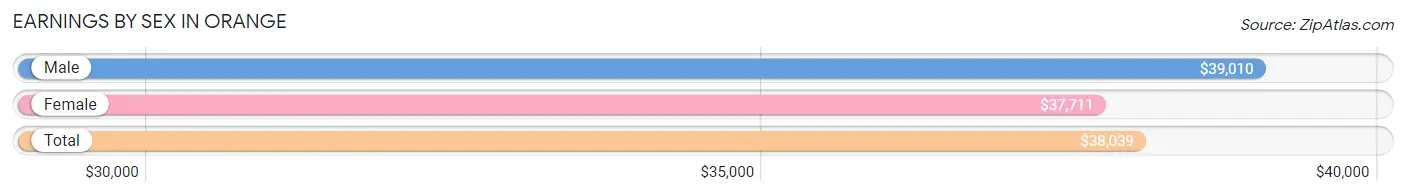
Earnings by Sex in Orange
Average Earnings in Orange are $38,039, $39,010 for men and $37,711 for women, a difference of 3.3%.
| Sex | Number | Average Earnings |
| Male | 907 (48.5%) | $39,010 |
| Female | 964 (51.5%) | $37,711 |
| Total | 1,871 (100.0%) | $38,039 |
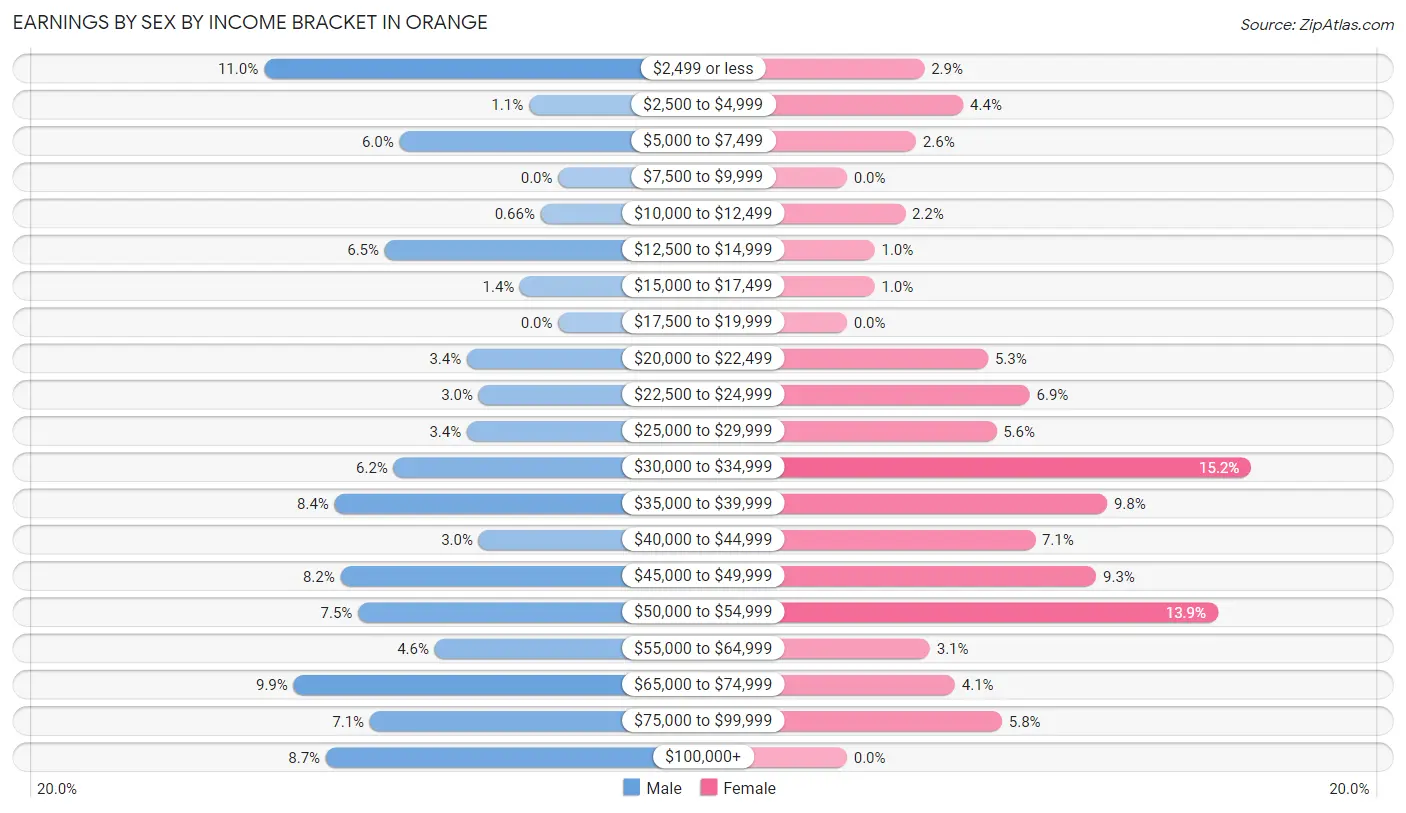
Earnings by Sex by Income Bracket in Orange
The most common earnings brackets in Orange are $2,499 or less for men (100 | 11.0%) and $30,000 to $34,999 for women (146 | 15.1%).
| Income | Male | Female |
| $2,499 or less | 100 (11.0%) | 28 (2.9%) |
| $2,500 to $4,999 | 10 (1.1%) | 42 (4.4%) |
| $5,000 to $7,499 | 54 (5.9%) | 25 (2.6%) |
| $7,500 to $9,999 | 0 (0.0%) | 0 (0.0%) |
| $10,000 to $12,499 | 6 (0.7%) | 21 (2.2%) |
| $12,500 to $14,999 | 59 (6.5%) | 10 (1.0%) |
| $15,000 to $17,499 | 13 (1.4%) | 10 (1.0%) |
| $17,500 to $19,999 | 0 (0.0%) | 0 (0.0%) |
| $20,000 to $22,499 | 31 (3.4%) | 51 (5.3%) |
| $22,500 to $24,999 | 27 (3.0%) | 66 (6.9%) |
| $25,000 to $29,999 | 31 (3.4%) | 54 (5.6%) |
| $30,000 to $34,999 | 56 (6.2%) | 146 (15.1%) |
| $35,000 to $39,999 | 76 (8.4%) | 94 (9.8%) |
| $40,000 to $44,999 | 27 (3.0%) | 68 (7.0%) |
| $45,000 to $49,999 | 74 (8.2%) | 90 (9.3%) |
| $50,000 to $54,999 | 68 (7.5%) | 134 (13.9%) |
| $55,000 to $64,999 | 42 (4.6%) | 30 (3.1%) |
| $65,000 to $74,999 | 90 (9.9%) | 39 (4.1%) |
| $75,000 to $99,999 | 64 (7.1%) | 56 (5.8%) |
| $100,000+ | 79 (8.7%) | 0 (0.0%) |
| Total | 907 (100.0%) | 964 (100.0%) |
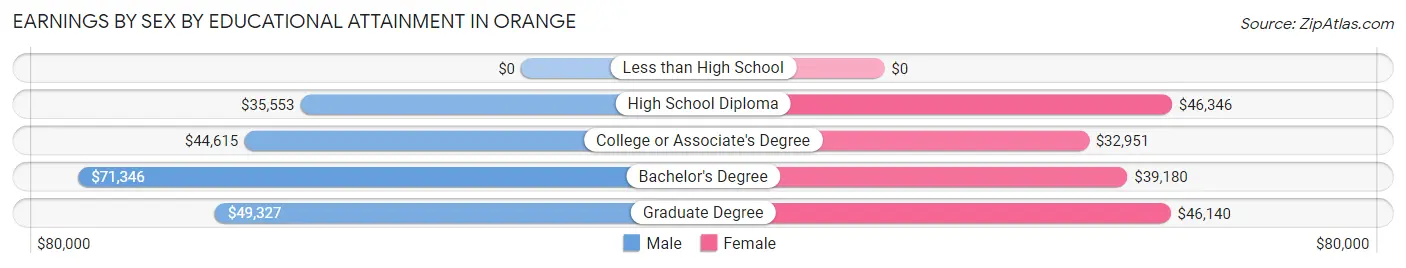
Earnings by Sex by Educational Attainment in Orange
Average earnings in Orange are $40,536 for men and $39,049 for women, a difference of 3.7%. Men with an educational attainment of bachelor's degree enjoy the highest average annual earnings of $71,346, while those with high school diploma education earn the least with $35,553. Women with an educational attainment of high school diploma earn the most with the average annual earnings of $46,346, while those with college or associate's degree education have the smallest earnings of $32,951.
| Educational Attainment | Male Income | Female Income |
| Less than High School | - | - |
| High School Diploma | $35,553 | $46,346 |
| College or Associate's Degree | $44,615 | $32,951 |
| Bachelor's Degree | $71,346 | $39,180 |
| Graduate Degree | $49,327 | $46,140 |
| Total | $40,536 | $39,049 |
Family Income in Orange
Family Income Brackets in Orange
According to the Orange family income data, there are 238 families falling into the $100,000 to $149,999 income range, which is the most common income bracket and makes up 26.9% of all families.
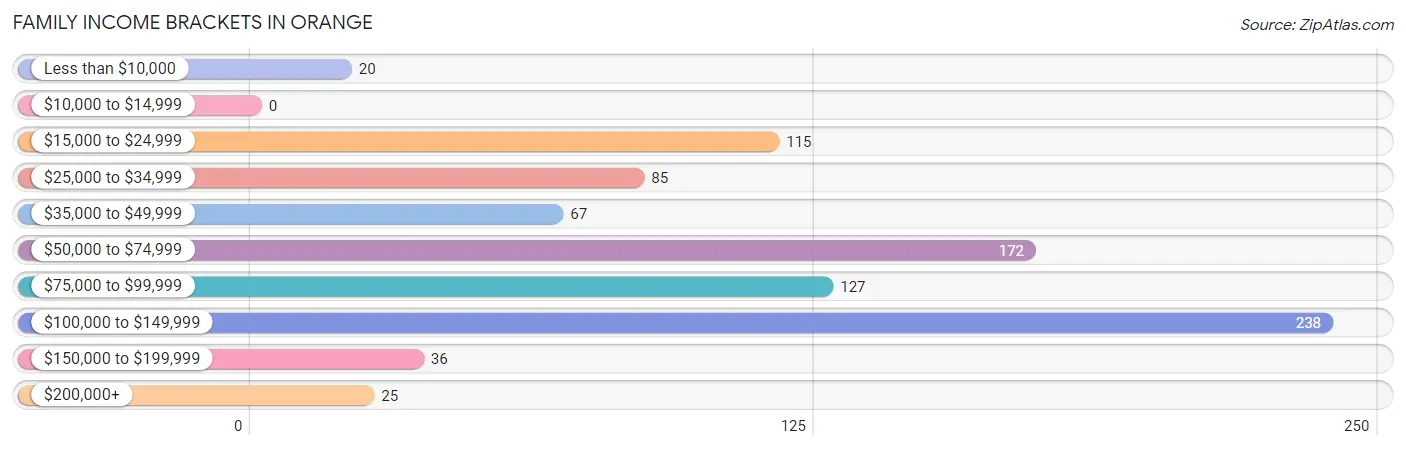
| Income Bracket | # Families | % Families |
| Less than $10,000 | 20 | 2.3% |
| $10,000 to $14,999 | 0 | 0.0% |
| $15,000 to $24,999 | 115 | 13.0% |
| $25,000 to $34,999 | 85 | 9.6% |
| $35,000 to $49,999 | 67 | 7.6% |
| $50,000 to $74,999 | 172 | 19.4% |
| $75,000 to $99,999 | 127 | 14.4% |
| $100,000 to $149,999 | 238 | 26.9% |
| $150,000 to $199,999 | 36 | 4.1% |
| $200,000+ | 25 | 2.8% |
Family Income by Famaliy Size in Orange
5-person families (51 | 5.8%) account for the highest median family income in Orange with $106,719 per family, while 2-person families (346 | 39.1%) have the highest median income of $35,294 per family member.
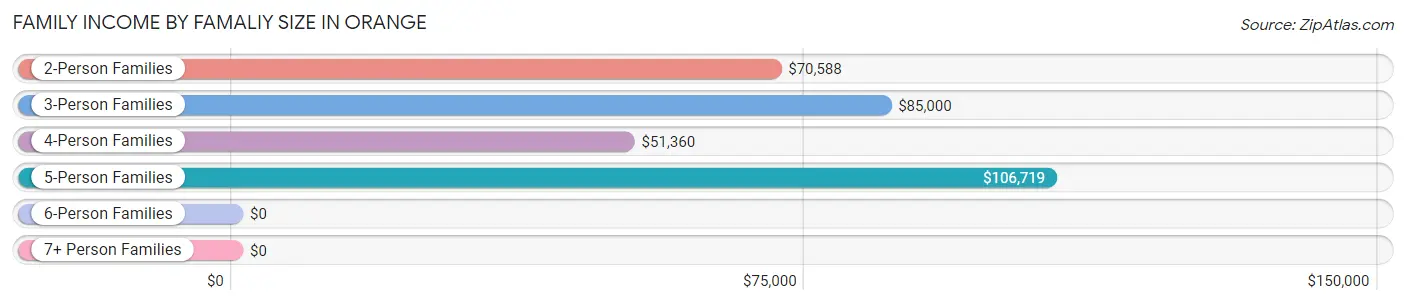
| Income Bracket | # Families | Median Income |
| 2-Person Families | 346 (39.1%) | $70,588 |
| 3-Person Families | 280 (31.6%) | $85,000 |
| 4-Person Families | 153 (17.3%) | $51,360 |
| 5-Person Families | 51 (5.8%) | $106,719 |
| 6-Person Families | 31 (3.5%) | $0 |
| 7+ Person Families | 24 (2.7%) | $0 |
| Total | 885 (100.0%) | $71,985 |
Family Income by Number of Earners in Orange
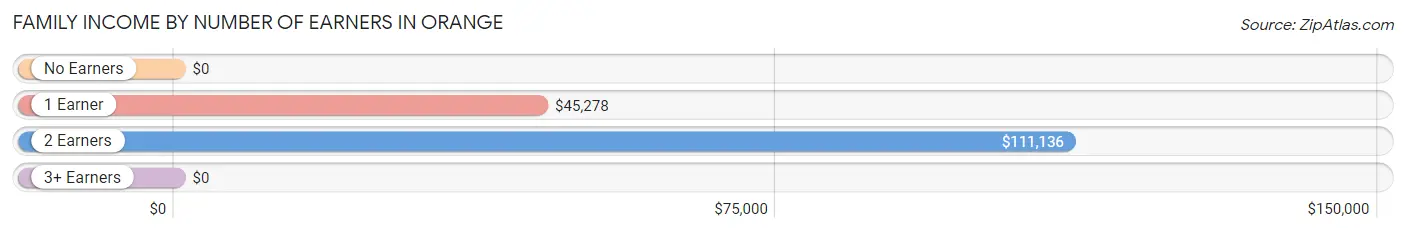
| Number of Earners | # Families | Median Income |
| No Earners | 162 (18.3%) | $0 |
| 1 Earner | 214 (24.2%) | $45,278 |
| 2 Earners | 418 (47.2%) | $111,136 |
| 3+ Earners | 91 (10.3%) | $0 |
| Total | 885 (100.0%) | $71,985 |
Household Income in Orange
Household Income Brackets in Orange
With 319 households falling in the category, the $50,000 to $74,999 income range is the most frequent in Orange, accounting for 21.8% of all households. In contrast, only 23 households (1.6%) fall into the less than $10,000 income bracket, making it the least populous group.
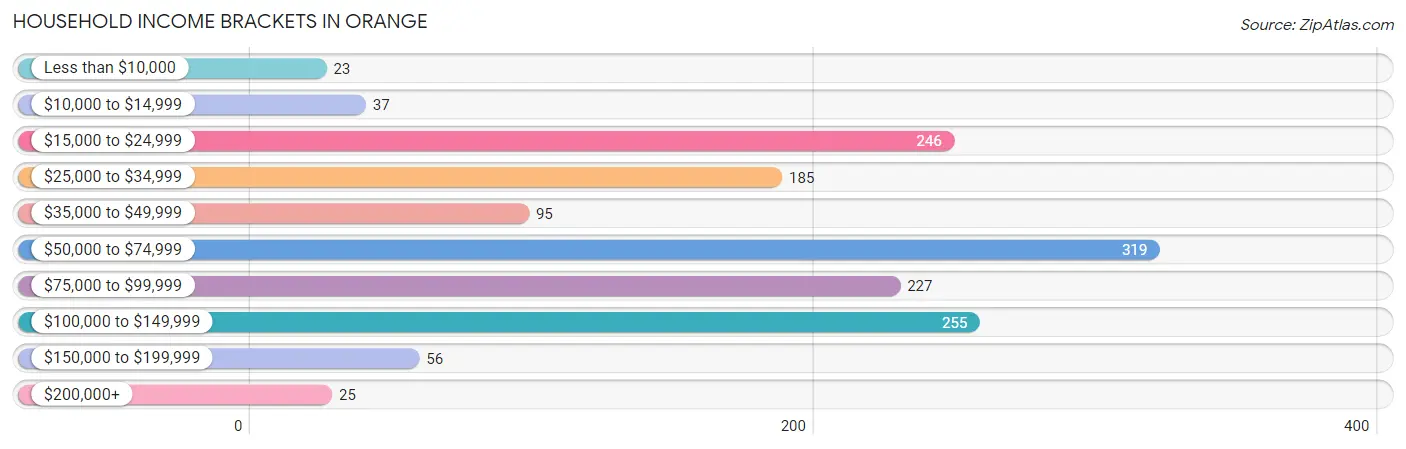
| Income Bracket | # Households | % Households |
| Less than $10,000 | 23 | 1.6% |
| $10,000 to $14,999 | 37 | 2.5% |
| $15,000 to $24,999 | 246 | 16.8% |
| $25,000 to $34,999 | 185 | 12.6% |
| $35,000 to $49,999 | 95 | 6.5% |
| $50,000 to $74,999 | 319 | 21.8% |
| $75,000 to $99,999 | 227 | 15.5% |
| $100,000 to $149,999 | 255 | 17.4% |
| $150,000 to $199,999 | 56 | 3.8% |
| $200,000+ | 25 | 1.7% |
Household Income by Householder Age in Orange
The median household income in Orange is $55,558, with the highest median household income of $65,313 found in the 25 to 44 years age bracket for the primary householder. A total of 363 households (24.8%) fall into this category. Meanwhile, the 15 to 24 years age bracket for the primary householder has the lowest median household income of $0, with 83 households (5.7%) in this group.
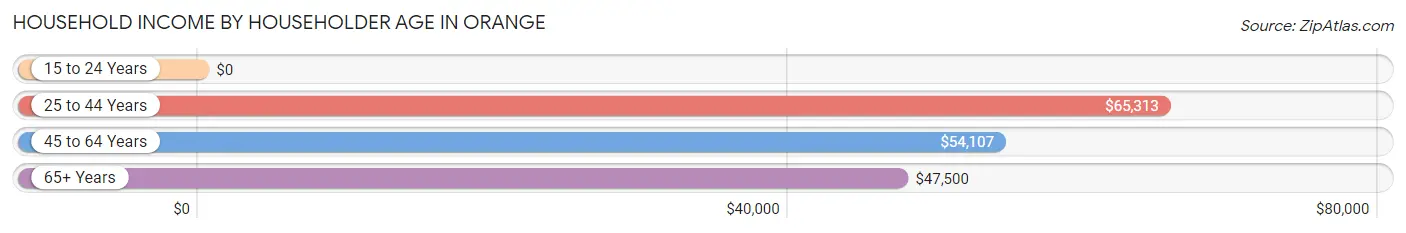
| Income Bracket | # Households | Median Income |
| 15 to 24 Years | 83 (5.7%) | $0 |
| 25 to 44 Years | 363 (24.8%) | $65,313 |
| 45 to 64 Years | 561 (38.3%) | $54,107 |
| 65+ Years | 458 (31.3%) | $47,500 |
| Total | 1,465 (100.0%) | $55,558 |
Poverty in Orange
Income Below Poverty by Sex and Age in Orange
With 19.1% poverty level for males and 17.7% for females among the residents of Orange, 15 year old males and 6 to 11 year old females are the most vulnerable to poverty, with 28 males (100.0%) and 73 females (57.5%) in their respective age groups living below the poverty level.
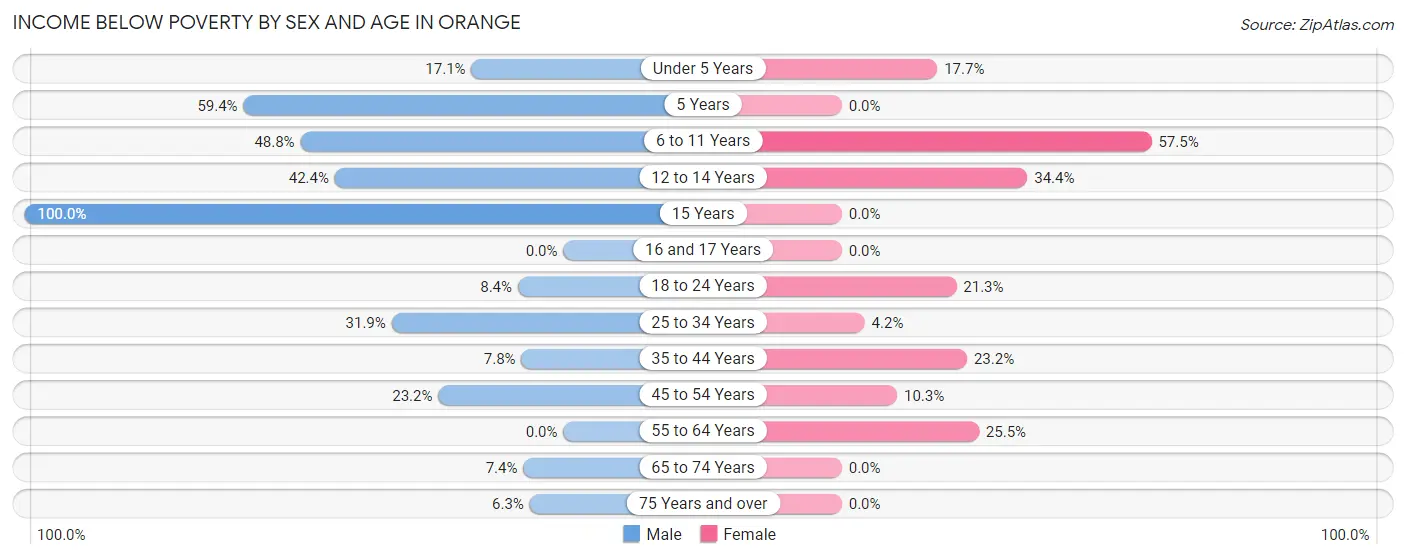
| Age Bracket | Male | Female |
| Under 5 Years | 14 (17.1%) | 17 (17.7%) |
| 5 Years | 19 (59.4%) | 0 (0.0%) |
| 6 to 11 Years | 61 (48.8%) | 73 (57.5%) |
| 12 to 14 Years | 14 (42.4%) | 42 (34.4%) |
| 15 Years | 28 (100.0%) | 0 (0.0%) |
| 16 and 17 Years | 0 (0.0%) | 0 (0.0%) |
| 18 to 24 Years | 13 (8.4%) | 27 (21.3%) |
| 25 to 34 Years | 95 (31.9%) | 12 (4.2%) |
| 35 to 44 Years | 13 (7.8%) | 56 (23.2%) |
| 45 to 54 Years | 68 (23.2%) | 24 (10.3%) |
| 55 to 64 Years | 0 (0.0%) | 85 (25.5%) |
| 65 to 74 Years | 20 (7.4%) | 0 (0.0%) |
| 75 Years and over | 4 (6.2%) | 0 (0.0%) |
| Total | 349 (19.1%) | 336 (17.7%) |
Income Above Poverty by Sex and Age in Orange
According to the poverty statistics in Orange, males aged 16 and 17 years and females aged 15 years are the age groups that are most secure financially, with 100.0% of males and 100.0% of females in these age groups living above the poverty line.
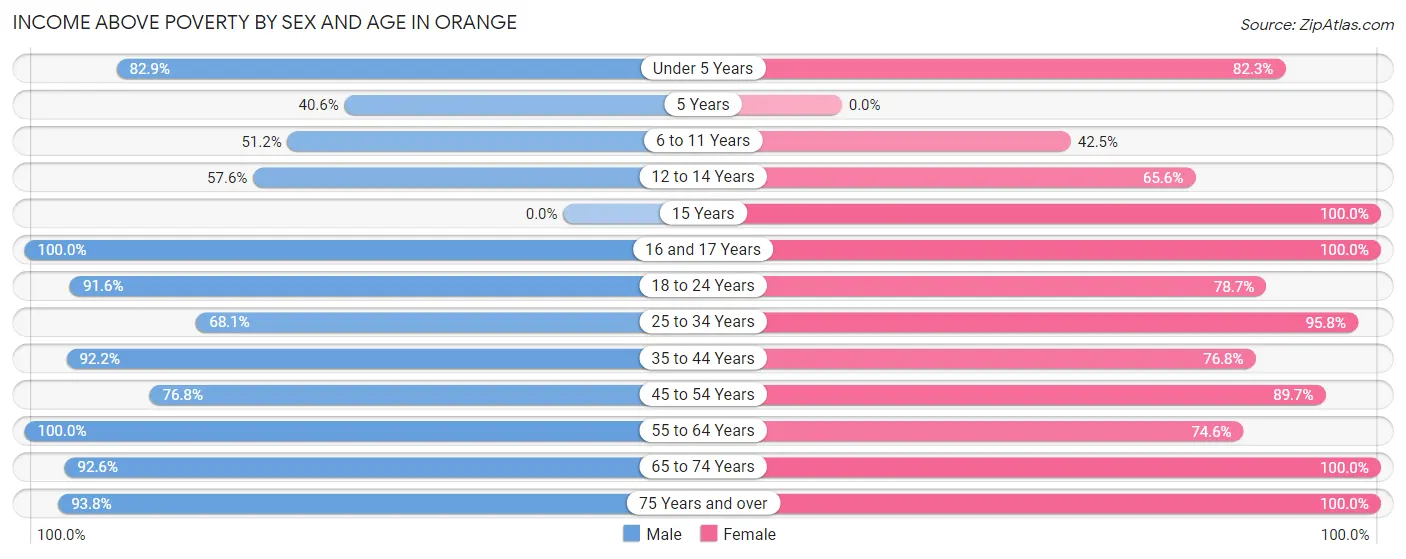
| Age Bracket | Male | Female |
| Under 5 Years | 68 (82.9%) | 79 (82.3%) |
| 5 Years | 13 (40.6%) | 0 (0.0%) |
| 6 to 11 Years | 64 (51.2%) | 54 (42.5%) |
| 12 to 14 Years | 19 (57.6%) | 80 (65.6%) |
| 15 Years | 0 (0.0%) | 8 (100.0%) |
| 16 and 17 Years | 70 (100.0%) | 34 (100.0%) |
| 18 to 24 Years | 141 (91.6%) | 100 (78.7%) |
| 25 to 34 Years | 203 (68.1%) | 271 (95.8%) |
| 35 to 44 Years | 154 (92.2%) | 185 (76.8%) |
| 45 to 54 Years | 225 (76.8%) | 210 (89.7%) |
| 55 to 64 Years | 214 (100.0%) | 249 (74.6%) |
| 65 to 74 Years | 249 (92.6%) | 213 (100.0%) |
| 75 Years and over | 60 (93.8%) | 82 (100.0%) |
| Total | 1,480 (80.9%) | 1,565 (82.3%) |
Income Below Poverty Among Married-Couple Families in Orange
The poverty statistics for married-couple families in Orange show that 13.4% or 89 of the total 664 families live below the poverty line. Families with 5 or more children have the highest poverty rate of 100.0%, comprising of 24 families. On the other hand, families with 3 or 4 children have the lowest poverty rate of 0.0%, which includes 0 families.
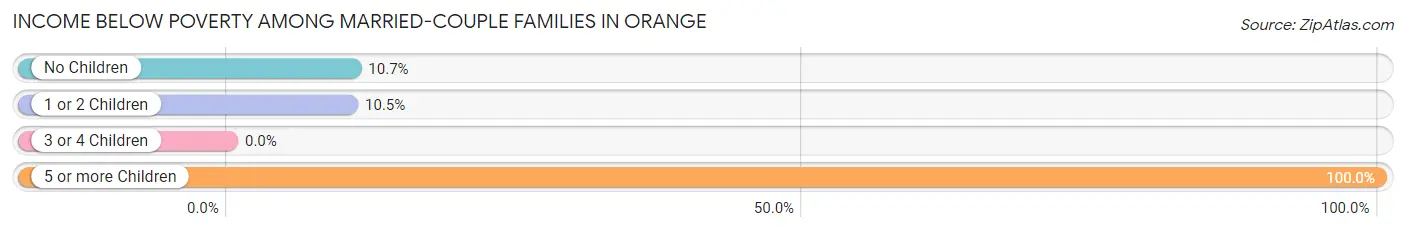
| Children | Above Poverty | Below Poverty |
| No Children | 291 (89.3%) | 35 (10.7%) |
| 1 or 2 Children | 257 (89.5%) | 30 (10.4%) |
| 3 or 4 Children | 27 (100.0%) | 0 (0.0%) |
| 5 or more Children | 0 (0.0%) | 24 (100.0%) |
| Total | 575 (86.6%) | 89 (13.4%) |
Income Below Poverty Among Single-Parent Households in Orange
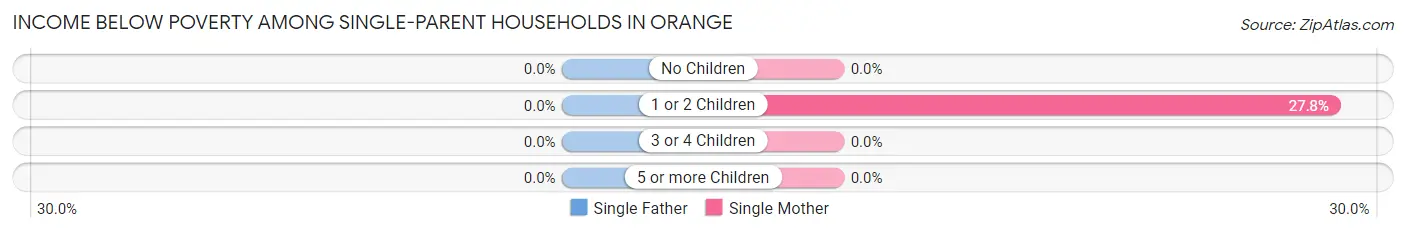
| Children | Single Father | Single Mother |
| No Children | 0 (0.0%) | 0 (0.0%) |
| 1 or 2 Children | 0 (0.0%) | 35 (27.8%) |
| 3 or 4 Children | 0 (0.0%) | 0 (0.0%) |
| 5 or more Children | 0 (0.0%) | 0 (0.0%) |
| Total | 0 (0.0%) | 35 (18.9%) |
Income Below Poverty Among Married-Couple vs Single-Parent Households in Orange
The poverty data for Orange shows that 89 of the married-couple family households (13.4%) and 35 of the single-parent households (15.8%) are living below the poverty level. Within the married-couple family households, those with 5 or more children have the highest poverty rate, with 24 households (100.0%) falling below the poverty line. Among the single-parent households, those with 1 or 2 children have the highest poverty rate, with 35 household (25.6%) living below poverty.
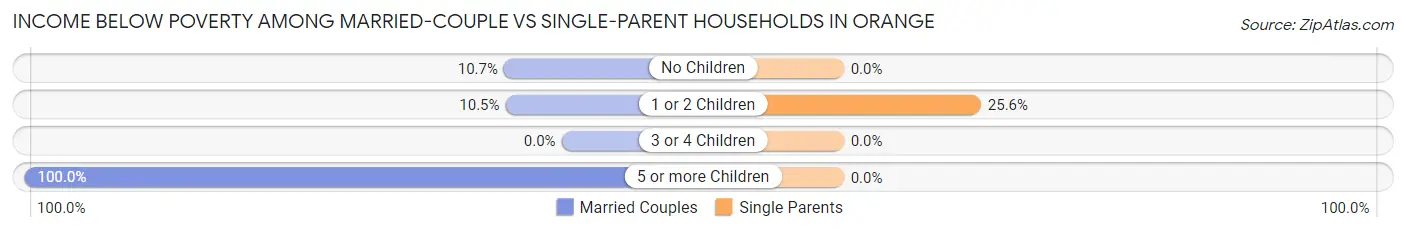
| Children | Married-Couple Families | Single-Parent Households |
| No Children | 35 (10.7%) | 0 (0.0%) |
| 1 or 2 Children | 30 (10.4%) | 35 (25.6%) |
| 3 or 4 Children | 0 (0.0%) | 0 (0.0%) |
| 5 or more Children | 24 (100.0%) | 0 (0.0%) |
| Total | 89 (13.4%) | 35 (15.8%) |
Race in Orange
The most populous races in Orange are White / Caucasian (3,407 | 91.3%), Two or more Races (257 | 6.9%), and Hispanic or Latino (206 | 5.5%).
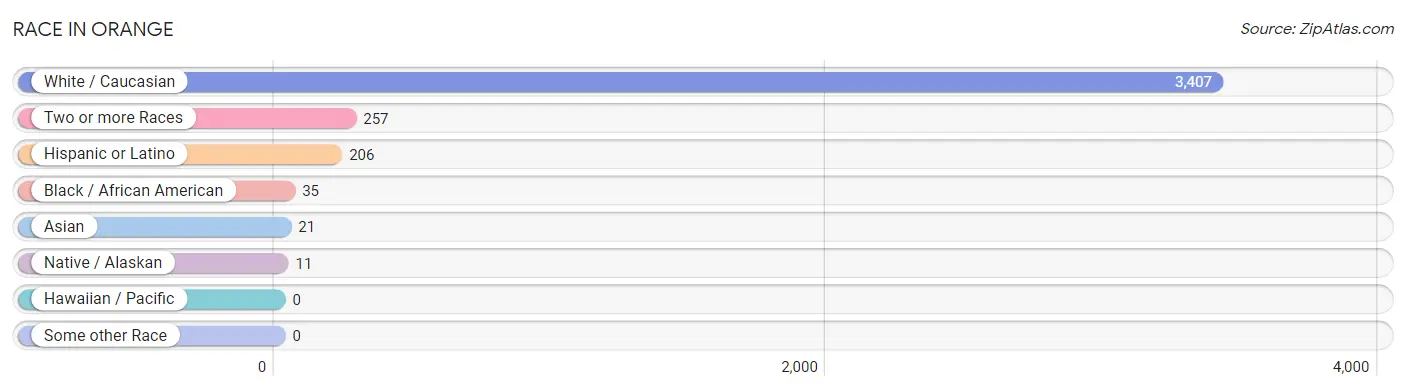
| Race | # Population | % Population |
| Asian | 21 | 0.6% |
| Black / African American | 35 | 0.9% |
| Hawaiian / Pacific | 0 | 0.0% |
| Hispanic or Latino | 206 | 5.5% |
| Native / Alaskan | 11 | 0.3% |
| White / Caucasian | 3,407 | 91.3% |
| Two or more Races | 257 | 6.9% |
| Some other Race | 0 | 0.0% |
| Total | 3,731 | 100.0% |
Ancestry in Orange
The most populous ancestries reported in Orange are Irish (531 | 14.2%), French Canadian (430 | 11.5%), English (406 | 10.9%), American (308 | 8.3%), and Italian (289 | 7.7%), together accounting for 52.6% of all Orange residents.
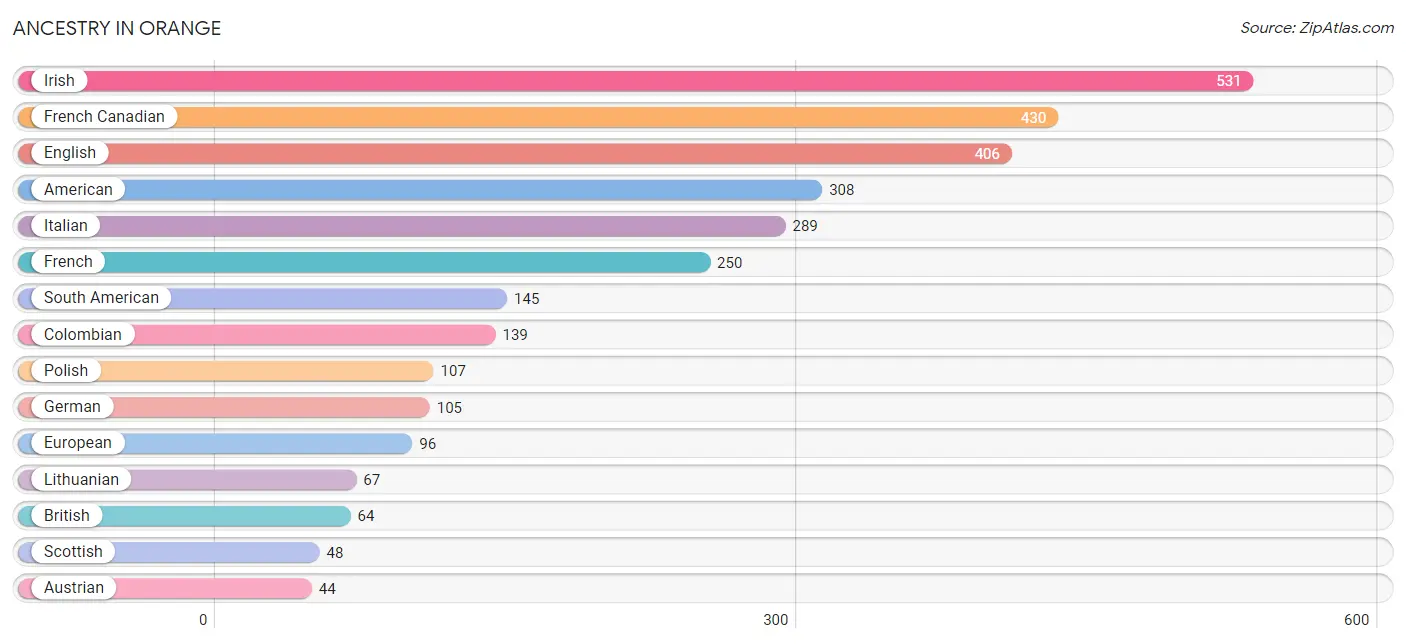
| Ancestry | # Population | % Population |
| African | 30 | 0.8% |
| American | 308 | 8.3% |
| Armenian | 14 | 0.4% |
| Austrian | 44 | 1.2% |
| British | 64 | 1.7% |
| Cherokee | 8 | 0.2% |
| Colombian | 139 | 3.7% |
| Dutch | 41 | 1.1% |
| English | 406 | 10.9% |
| European | 96 | 2.6% |
| Finnish | 21 | 0.6% |
| French | 250 | 6.7% |
| French American Indian | 2 | 0.1% |
| French Canadian | 430 | 11.5% |
| German | 105 | 2.8% |
| Greek | 13 | 0.4% |
| Irish | 531 | 14.2% |
| Italian | 289 | 7.7% |
| Lithuanian | 67 | 1.8% |
| Mexican | 14 | 0.4% |
| Norwegian | 35 | 0.9% |
| Polish | 107 | 2.9% |
| Portuguese | 5 | 0.1% |
| Puerto Rican | 21 | 0.6% |
| Russian | 14 | 0.4% |
| Scotch-Irish | 34 | 0.9% |
| Scottish | 48 | 1.3% |
| South American | 145 | 3.9% |
| Spaniard | 26 | 0.7% |
| Sri Lankan | 21 | 0.6% |
| Subsaharan African | 30 | 0.8% |
| Swedish | 24 | 0.6% |
| Swiss | 10 | 0.3% |
| Thai | 23 | 0.6% |
| Turkish | 14 | 0.4% |
| U.S. Virgin Islander | 10 | 0.3% |
| Ukrainian | 17 | 0.5% |
| Venezuelan | 6 | 0.2% | View All 38 Rows |
Immigrants in Orange
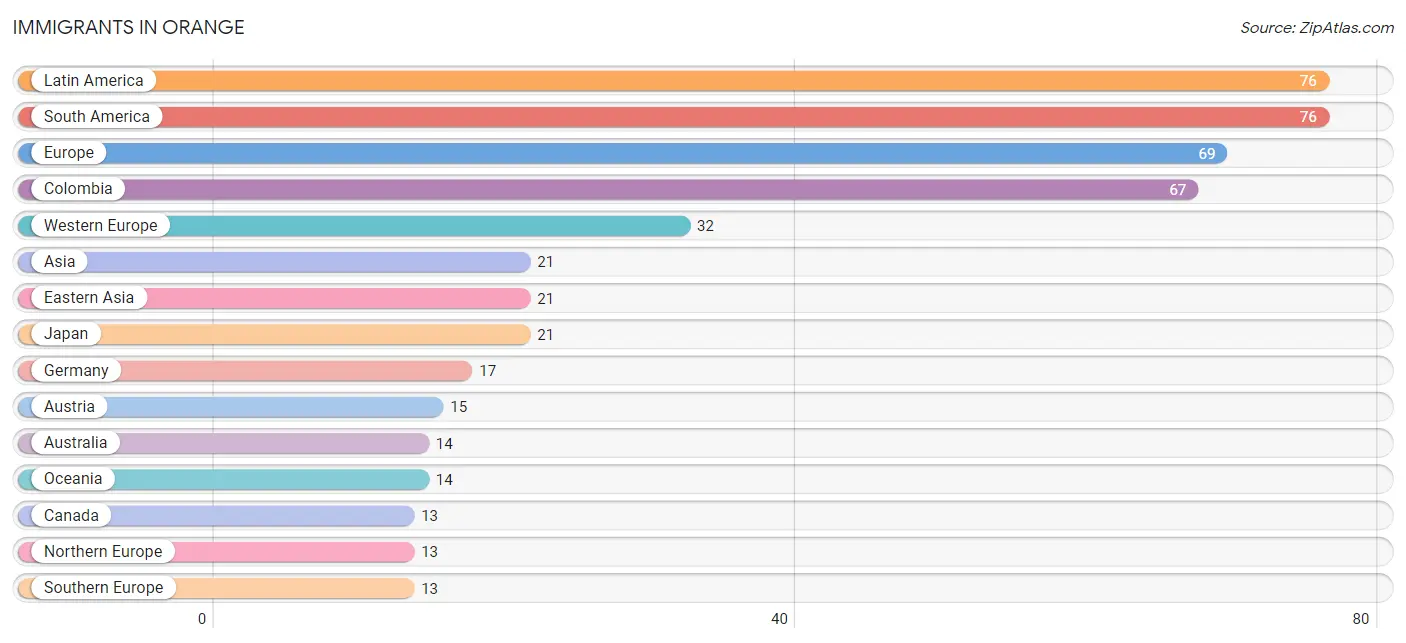
The most numerous immigrant groups reported in Orange came from Latin America (76 | 2.0%), South America (76 | 2.0%), Europe (69 | 1.8%), Colombia (67 | 1.8%), and Western Europe (32 | 0.9%), together accounting for 8.6% of all Orange residents.
| Immigration Origin | # Population | % Population |
| Africa | 5 | 0.1% |
| Asia | 21 | 0.6% |
| Australia | 14 | 0.4% |
| Austria | 15 | 0.4% |
| Brazil | 9 | 0.2% |
| Canada | 13 | 0.4% |
| Colombia | 67 | 1.8% |
| Czechoslovakia | 11 | 0.3% |
| Eastern Asia | 21 | 0.6% |
| Eastern Europe | 11 | 0.3% |
| Europe | 69 | 1.8% |
| Germany | 17 | 0.5% |
| Ghana | 5 | 0.1% |
| Japan | 21 | 0.6% |
| Latin America | 76 | 2.0% |
| Northern Europe | 13 | 0.4% |
| Oceania | 14 | 0.4% |
| South America | 76 | 2.0% |
| Southern Europe | 13 | 0.4% |
| Spain | 13 | 0.4% |
| Western Africa | 5 | 0.1% |
| Western Europe | 32 | 0.9% | View All 22 Rows |
Sex and Age in Orange
Sex and Age in Orange
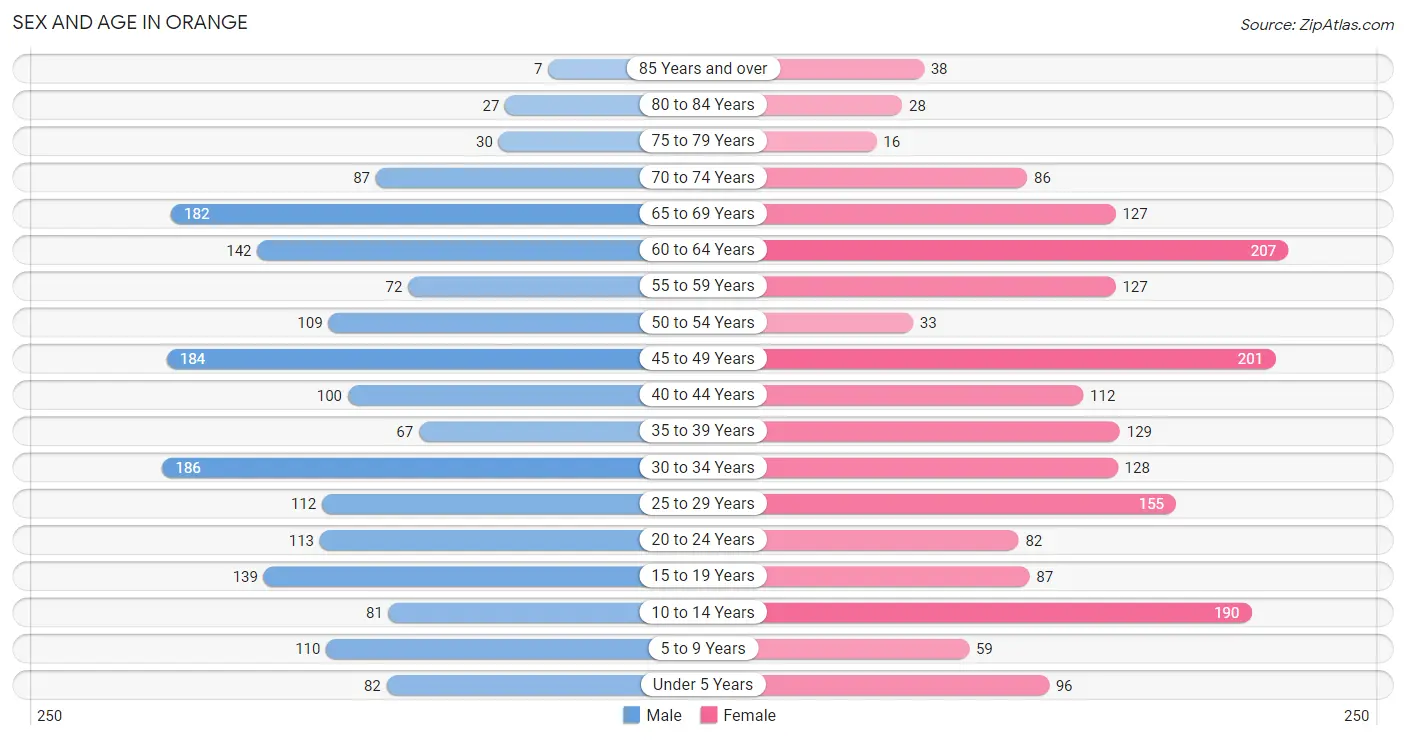
The most populous age groups in Orange are 30 to 34 Years (186 | 10.2%) for men and 60 to 64 Years (207 | 10.9%) for women.
| Age Bracket | Male | Female |
| Under 5 Years | 82 (4.5%) | 96 (5.1%) |
| 5 to 9 Years | 110 (6.0%) | 59 (3.1%) |
| 10 to 14 Years | 81 (4.4%) | 190 (10.0%) |
| 15 to 19 Years | 139 (7.6%) | 87 (4.6%) |
| 20 to 24 Years | 113 (6.2%) | 82 (4.3%) |
| 25 to 29 Years | 112 (6.1%) | 155 (8.2%) |
| 30 to 34 Years | 186 (10.2%) | 128 (6.7%) |
| 35 to 39 Years | 67 (3.7%) | 129 (6.8%) |
| 40 to 44 Years | 100 (5.5%) | 112 (5.9%) |
| 45 to 49 Years | 184 (10.1%) | 201 (10.6%) |
| 50 to 54 Years | 109 (6.0%) | 33 (1.7%) |
| 55 to 59 Years | 72 (3.9%) | 127 (6.7%) |
| 60 to 64 Years | 142 (7.8%) | 207 (10.9%) |
| 65 to 69 Years | 182 (10.0%) | 127 (6.7%) |
| 70 to 74 Years | 87 (4.8%) | 86 (4.5%) |
| 75 to 79 Years | 30 (1.6%) | 16 (0.8%) |
| 80 to 84 Years | 27 (1.5%) | 28 (1.5%) |
| 85 Years and over | 7 (0.4%) | 38 (2.0%) |
| Total | 1,830 (100.0%) | 1,901 (100.0%) |
Families and Households in Orange
Median Family Size in Orange
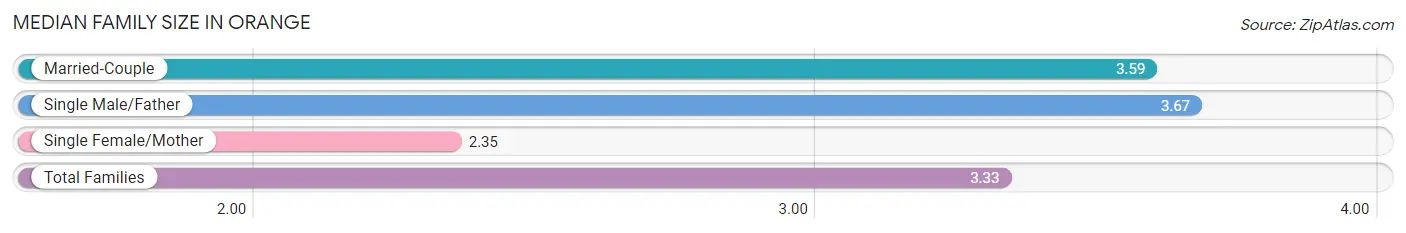
The median family size in Orange is 3.33 persons per family, with single male/father families (36 | 4.1%) accounting for the largest median family size of 3.67 persons per family. On the other hand, single female/mother families (185 | 20.9%) represent the smallest median family size with 2.35 persons per family.
| Family Type | # Families | Family Size |
| Married-Couple | 664 (75.0%) | 3.59 |
| Single Male/Father | 36 (4.1%) | 3.67 |
| Single Female/Mother | 185 (20.9%) | 2.35 |
| Total Families | 885 (100.0%) | 3.33 |
Median Household Size in Orange
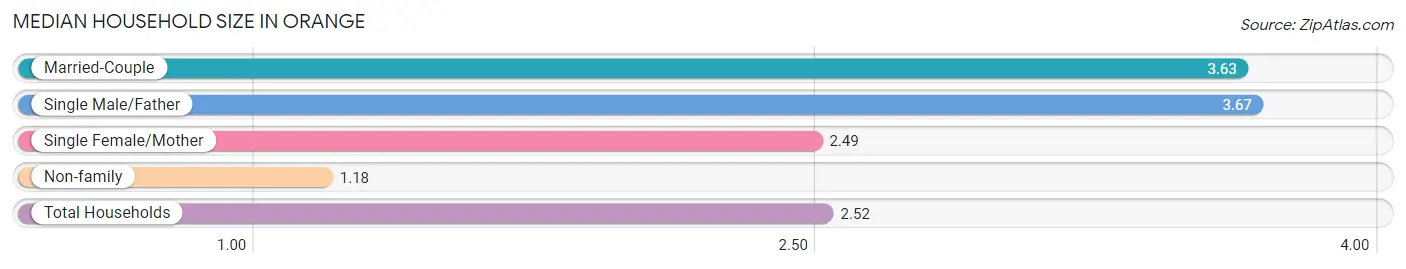
The median household size in Orange is 2.52 persons per household, with single male/father households (36 | 2.5%) accounting for the largest median household size of 3.67 persons per household. non-family households (580 | 39.6%) represent the smallest median household size with 1.18 persons per household.
| Household Type | # Households | Household Size |
| Married-Couple | 664 (45.3%) | 3.63 |
| Single Male/Father | 36 (2.5%) | 3.67 |
| Single Female/Mother | 185 (12.6%) | 2.49 |
| Non-family | 580 (39.6%) | 1.18 |
| Total Households | 1,465 (100.0%) | 2.52 |
Household Size by Marriage Status in Orange
Out of a total of 1,465 households in Orange, 885 (60.4%) are family households, while 580 (39.6%) are nonfamily households. The most numerous type of family households are 2-person households, comprising 317, and the most common type of nonfamily households are 1-person households, comprising 481.
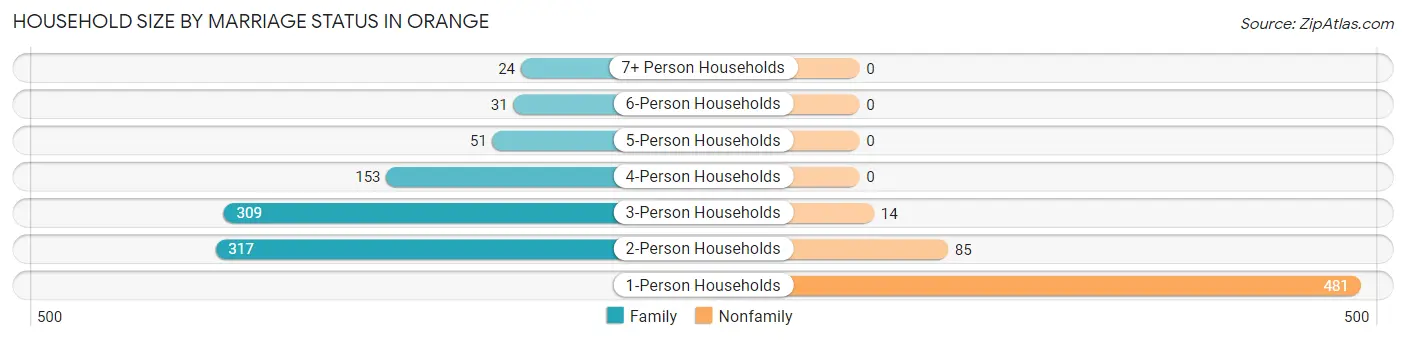
| Household Size | Family Households | Nonfamily Households |
| 1-Person Households | - | 481 (32.8%) |
| 2-Person Households | 317 (21.6%) | 85 (5.8%) |
| 3-Person Households | 309 (21.1%) | 14 (1.0%) |
| 4-Person Households | 153 (10.4%) | 0 (0.0%) |
| 5-Person Households | 51 (3.5%) | 0 (0.0%) |
| 6-Person Households | 31 (2.1%) | 0 (0.0%) |
| 7+ Person Households | 24 (1.6%) | 0 (0.0%) |
| Total | 885 (60.4%) | 580 (39.6%) |
Female Fertility in Orange
Fertility by Age in Orange
Average fertility rate in Orange is 121.0 births per 1,000 women. Women in the age bracket of 20 to 34 years have the highest fertility rate with 296.0 births per 1,000 women. Women in the age bracket of 20 to 34 years acount for 100.0% of all women with births.
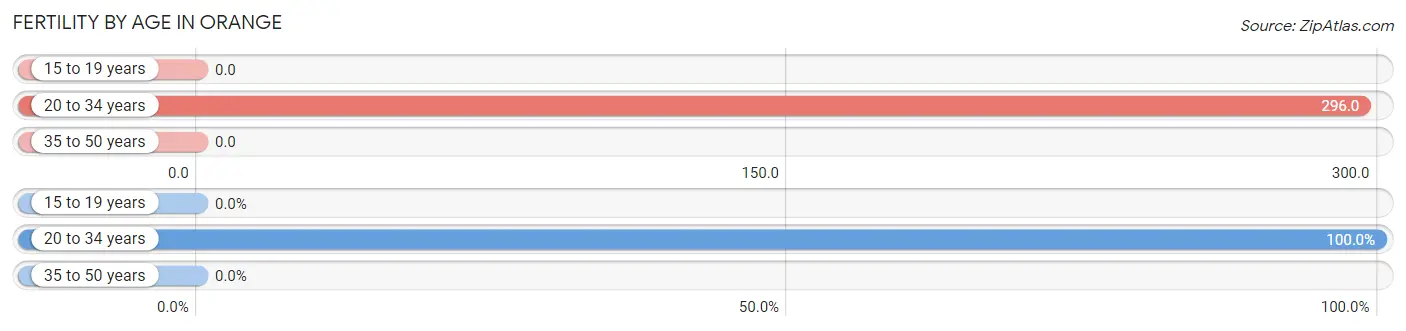
| Age Bracket | Women with Births | Births / 1,000 Women |
| 15 to 19 years | 0 (0.0%) | 0.0 |
| 20 to 34 years | 108 (100.0%) | 296.0 |
| 35 to 50 years | 0 (0.0%) | 0.0 |
| Total | 108 (100.0%) | 121.0 |
Fertility by Age by Marriage Status in Orange
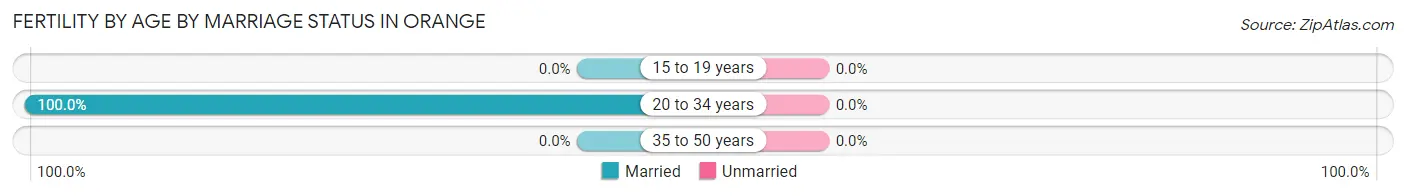
| Age Bracket | Married | Unmarried |
| 15 to 19 years | 0 (0.0%) | 0 (0.0%) |
| 20 to 34 years | 108 (100.0%) | 0 (0.0%) |
| 35 to 50 years | 0 (0.0%) | 0 (0.0%) |
| Total | 108 (100.0%) | 0 (0.0%) |
Fertility by Education in Orange
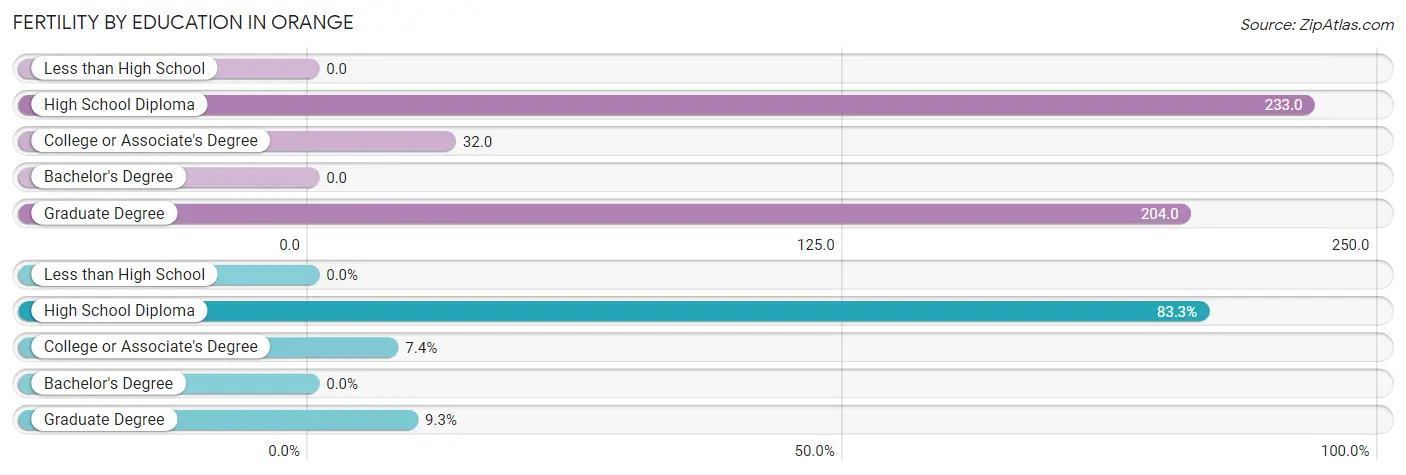
| Educational Attainment | Women with Births | Births / 1,000 Women |
| Less than High School | 0 (0.0%) | 0.0 |
| High School Diploma | 90 (83.3%) | 233.0 |
| College or Associate's Degree | 8 (7.4%) | 32.0 |
| Bachelor's Degree | 0 (0.0%) | 0.0 |
| Graduate Degree | 10 (9.3%) | 204.0 |
| Total | 108 (100.0%) | 121.0 |
Fertility by Education by Marriage Status in Orange
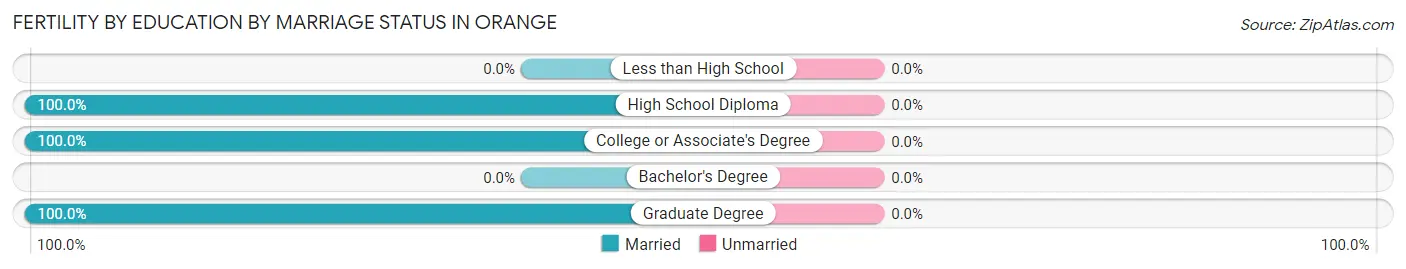
| Educational Attainment | Married | Unmarried |
| Less than High School | 0 (0.0%) | 0 (0.0%) |
| High School Diploma | 90 (100.0%) | 0 (0.0%) |
| College or Associate's Degree | 8 (100.0%) | 0 (0.0%) |
| Bachelor's Degree | 0 (0.0%) | 0 (0.0%) |
| Graduate Degree | 10 (100.0%) | 0 (0.0%) |
| Total | 108 (100.0%) | 0 (0.0%) |
Employment Characteristics in Orange
Employment by Class of Employer in Orange
Among the 1,592 employed individuals in Orange, private company employees (982 | 61.7%), state government employees (198 | 12.4%), and self-employed (not incorporated) (144 | 9.0%) make up the most common classes of employment.
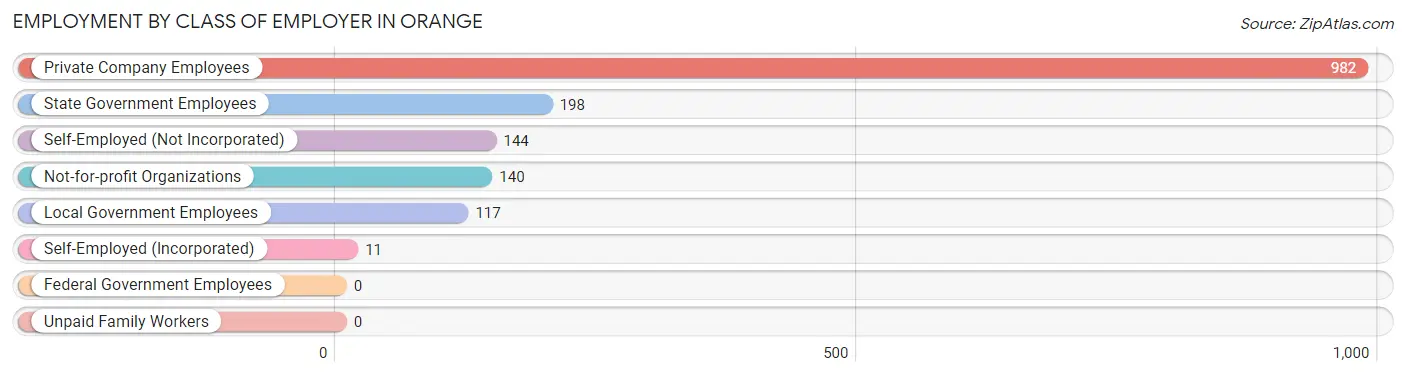
| Employer Class | # Employees | % Employees |
| Private Company Employees | 982 | 61.7% |
| Self-Employed (Incorporated) | 11 | 0.7% |
| Self-Employed (Not Incorporated) | 144 | 9.0% |
| Not-for-profit Organizations | 140 | 8.8% |
| Local Government Employees | 117 | 7.3% |
| State Government Employees | 198 | 12.4% |
| Federal Government Employees | 0 | 0.0% |
| Unpaid Family Workers | 0 | 0.0% |
| Total | 1,592 | 100.0% |
Employment Status by Age in Orange
According to the labor force statistics for Orange, out of the total population over 16 years of age (3,077), 59.4% or 1,828 individuals are in the labor force, with 13.0% or 238 of them unemployed. The age group with the highest labor force participation rate is 25 to 29 years, with 91.8% or 245 individuals in the labor force. Within the labor force, the 25 to 29 years age range has the highest percentage of unemployed individuals, with 36.7% or 90 of them being unemployed.
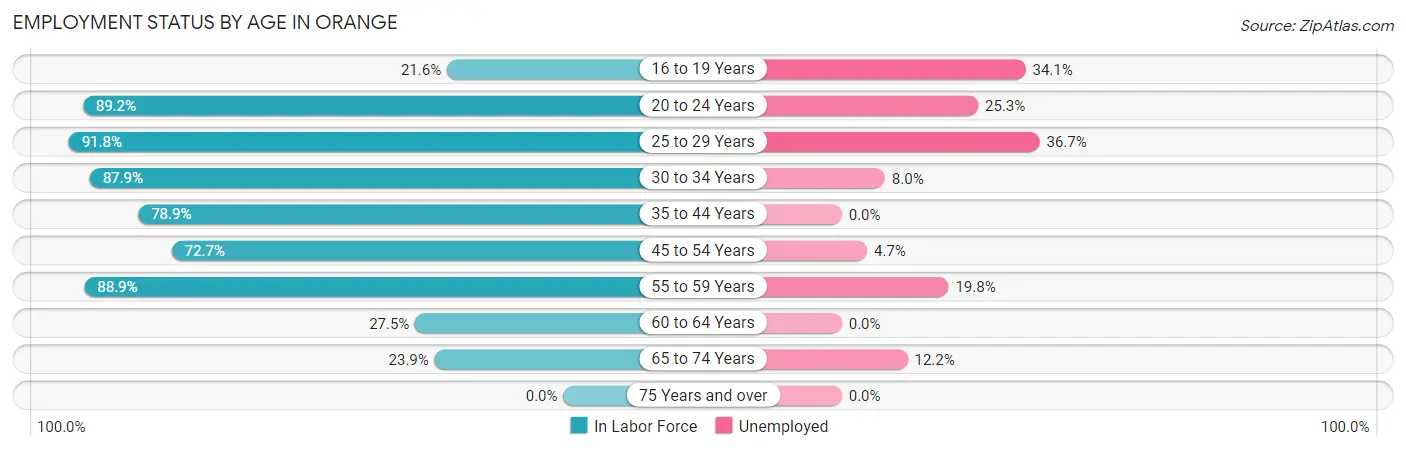
| Age Bracket | In Labor Force | Unemployed |
| 16 to 19 Years | 41 (21.6%) | 14 (34.1%) |
| 20 to 24 Years | 174 (89.2%) | 44 (25.3%) |
| 25 to 29 Years | 245 (91.8%) | 90 (36.7%) |
| 30 to 34 Years | 276 (87.9%) | 22 (8.0%) |
| 35 to 44 Years | 322 (78.9%) | 0 (0.0%) |
| 45 to 54 Years | 383 (72.7%) | 18 (4.7%) |
| 55 to 59 Years | 177 (88.9%) | 35 (19.8%) |
| 60 to 64 Years | 96 (27.5%) | 0 (0.0%) |
| 65 to 74 Years | 115 (23.9%) | 14 (12.2%) |
| 75 Years and over | 0 (0.0%) | 0 (0.0%) |
| Total | 1,828 (59.4%) | 238 (13.0%) |
Employment Status by Educational Attainment in Orange
According to labor force statistics for Orange, 72.6% of individuals (1,498) out of the total population between 25 and 64 years of age (2,064) are in the labor force, with 11.0% or 165 of them being unemployed. The group with the highest labor force participation rate are those with the educational attainment of bachelor's degree or higher, with 94.6% or 283 individuals in the labor force. Within the labor force, individuals with college / associate degree education have the highest percentage of unemployment, with 13.9% or 75 of them being unemployed.
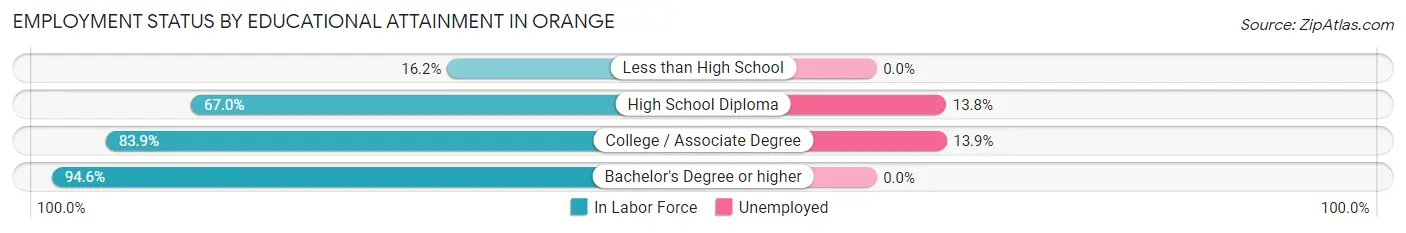
| Educational Attainment | In Labor Force | Unemployed |
| Less than High School | 24 (16.2%) | 0 (0.0%) |
| High School Diploma | 651 (67.0%) | 134 (13.8%) |
| College / Associate Degree | 541 (83.9%) | 90 (13.9%) |
| Bachelor's Degree or higher | 283 (94.6%) | 0 (0.0%) |
| Total | 1,498 (72.6%) | 227 (11.0%) |
Employment Occupations by Sex in Orange
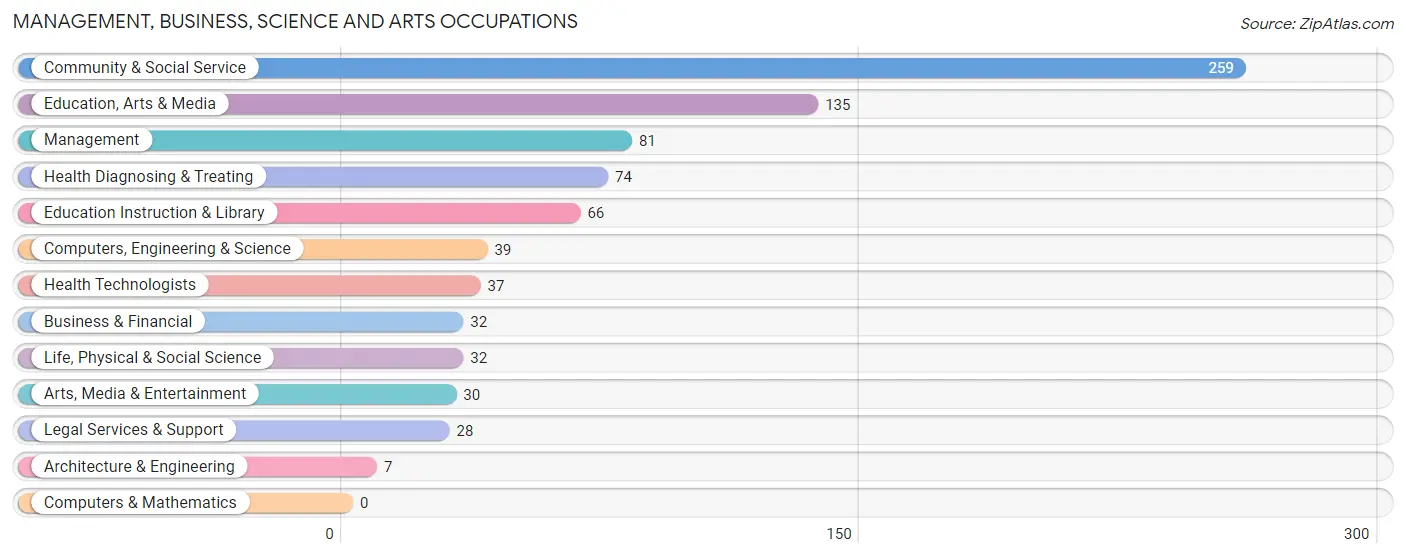
Management, Business, Science and Arts Occupations
The most common Management, Business, Science and Arts occupations in Orange are Community & Social Service (259 | 16.3%), Education, Arts & Media (135 | 8.5%), Management (81 | 5.1%), Health Diagnosing & Treating (74 | 4.6%), and Education Instruction & Library (66 | 4.2%).
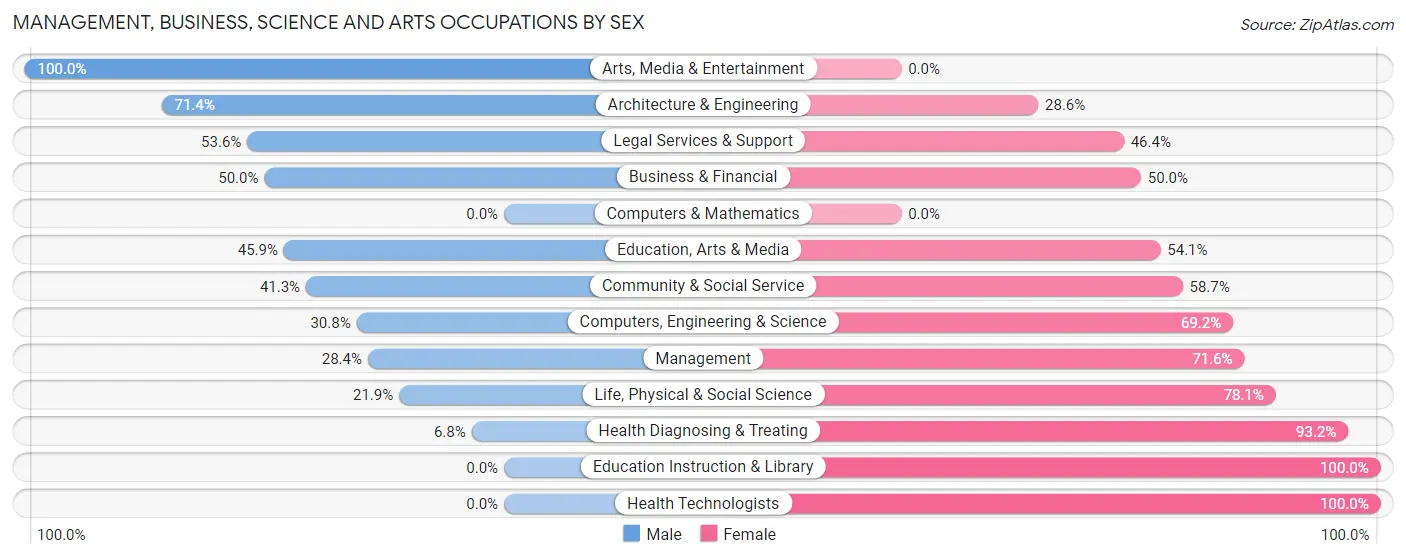
Management, Business, Science and Arts Occupations by Sex
Within the Management, Business, Science and Arts occupations in Orange, the most male-oriented occupations are Arts, Media & Entertainment (100.0%), Architecture & Engineering (71.4%), and Legal Services & Support (53.6%), while the most female-oriented occupations are Education Instruction & Library (100.0%), Health Technologists (100.0%), and Health Diagnosing & Treating (93.2%).
| Occupation | Male | Female |
| Management | 23 (28.4%) | 58 (71.6%) |
| Business & Financial | 16 (50.0%) | 16 (50.0%) |
| Computers, Engineering & Science | 12 (30.8%) | 27 (69.2%) |
| Computers & Mathematics | 0 (0.0%) | 0 (0.0%) |
| Architecture & Engineering | 5 (71.4%) | 2 (28.6%) |
| Life, Physical & Social Science | 7 (21.9%) | 25 (78.1%) |
| Community & Social Service | 107 (41.3%) | 152 (58.7%) |
| Education, Arts & Media | 62 (45.9%) | 73 (54.1%) |
| Legal Services & Support | 15 (53.6%) | 13 (46.4%) |
| Education Instruction & Library | 0 (0.0%) | 66 (100.0%) |
| Arts, Media & Entertainment | 30 (100.0%) | 0 (0.0%) |
| Health Diagnosing & Treating | 5 (6.8%) | 69 (93.2%) |
| Health Technologists | 0 (0.0%) | 37 (100.0%) |
| Total (Category) | 163 (33.6%) | 322 (66.4%) |
| Total (Overall) | 792 (49.7%) | 800 (50.2%) |
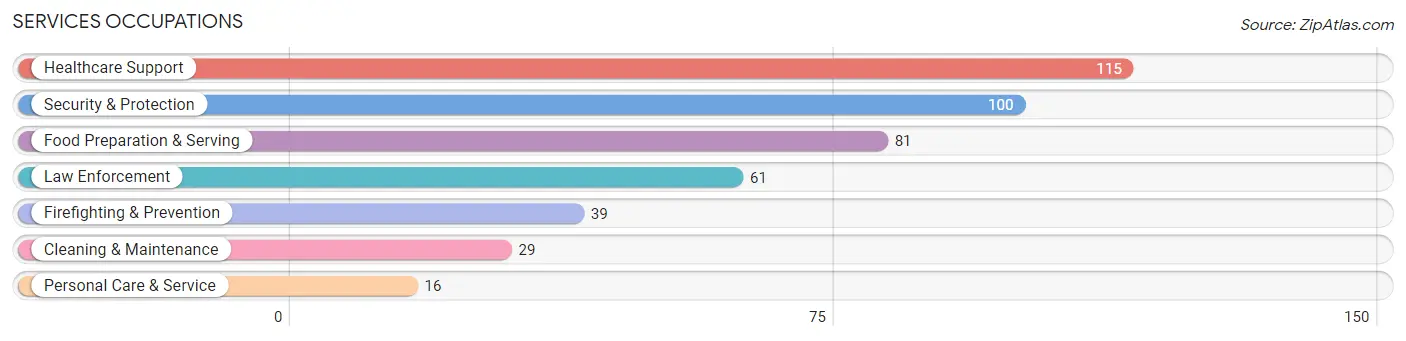
Services Occupations
The most common Services occupations in Orange are Healthcare Support (115 | 7.2%), Security & Protection (100 | 6.3%), Food Preparation & Serving (81 | 5.1%), Law Enforcement (61 | 3.8%), and Firefighting & Prevention (39 | 2.5%).
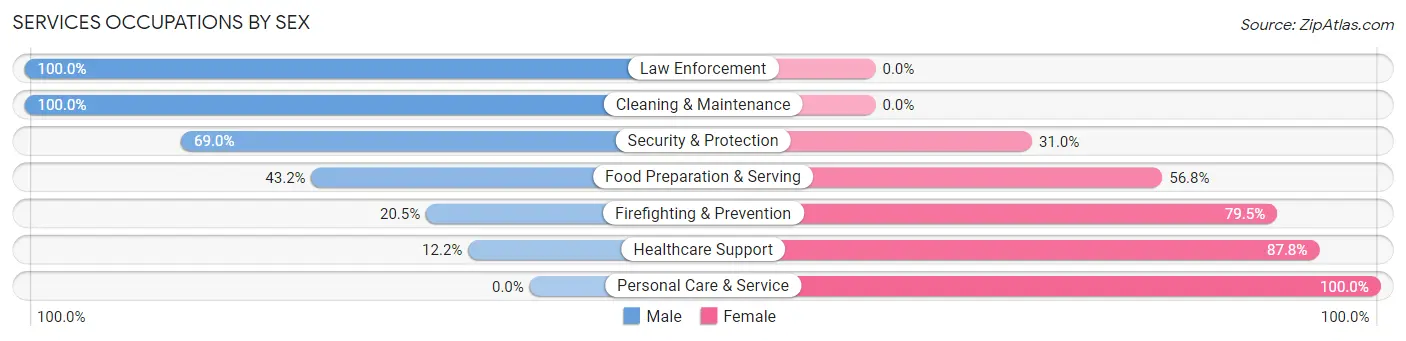
Services Occupations by Sex
Within the Services occupations in Orange, the most male-oriented occupations are Law Enforcement (100.0%), Cleaning & Maintenance (100.0%), and Security & Protection (69.0%), while the most female-oriented occupations are Personal Care & Service (100.0%), Healthcare Support (87.8%), and Firefighting & Prevention (79.5%).
| Occupation | Male | Female |
| Healthcare Support | 14 (12.2%) | 101 (87.8%) |
| Security & Protection | 69 (69.0%) | 31 (31.0%) |
| Firefighting & Prevention | 8 (20.5%) | 31 (79.5%) |
| Law Enforcement | 61 (100.0%) | 0 (0.0%) |
| Food Preparation & Serving | 35 (43.2%) | 46 (56.8%) |
| Cleaning & Maintenance | 29 (100.0%) | 0 (0.0%) |
| Personal Care & Service | 0 (0.0%) | 16 (100.0%) |
| Total (Category) | 147 (43.1%) | 194 (56.9%) |
| Total (Overall) | 792 (49.7%) | 800 (50.2%) |
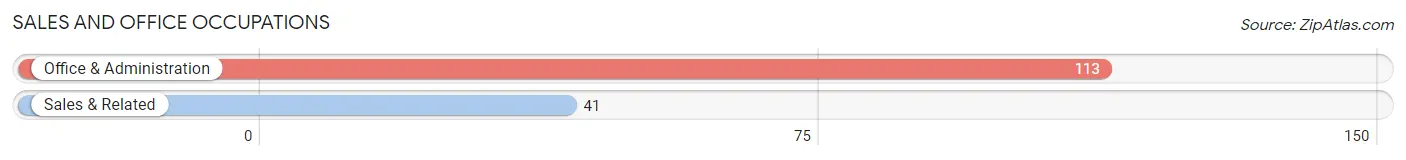
Sales and Office Occupations
The most common Sales and Office occupations in Orange are Office & Administration (113 | 7.1%), and Sales & Related (41 | 2.6%).
Sales and Office Occupations by Sex
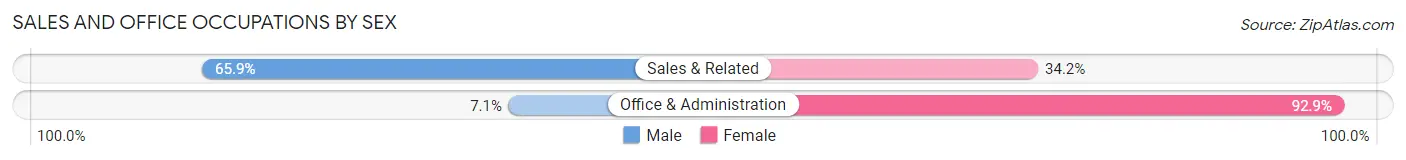
| Occupation | Male | Female |
| Sales & Related | 27 (65.8%) | 14 (34.2%) |
| Office & Administration | 8 (7.1%) | 105 (92.9%) |
| Total (Category) | 35 (22.7%) | 119 (77.3%) |
| Total (Overall) | 792 (49.7%) | 800 (50.2%) |
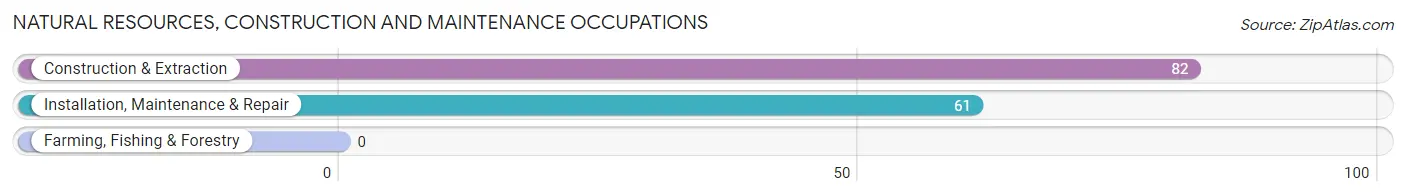
Natural Resources, Construction and Maintenance Occupations
The most common Natural Resources, Construction and Maintenance occupations in Orange are Construction & Extraction (82 | 5.1%), and Installation, Maintenance & Repair (61 | 3.8%).
Natural Resources, Construction and Maintenance Occupations by Sex
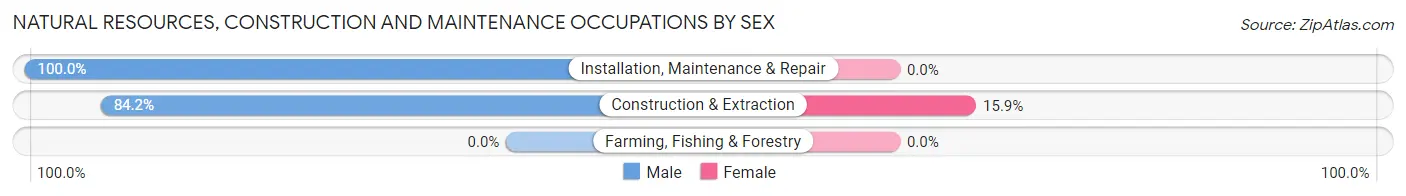
| Occupation | Male | Female |
| Farming, Fishing & Forestry | 0 (0.0%) | 0 (0.0%) |
| Construction & Extraction | 69 (84.2%) | 13 (15.9%) |
| Installation, Maintenance & Repair | 61 (100.0%) | 0 (0.0%) |
| Total (Category) | 130 (90.9%) | 13 (9.1%) |
| Total (Overall) | 792 (49.7%) | 800 (50.2%) |
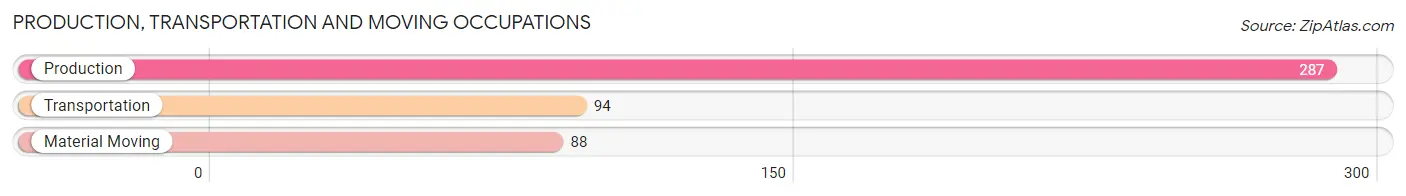
Production, Transportation and Moving Occupations
The most common Production, Transportation and Moving occupations in Orange are Production (287 | 18.0%), Transportation (94 | 5.9%), and Material Moving (88 | 5.5%).
Production, Transportation and Moving Occupations by Sex
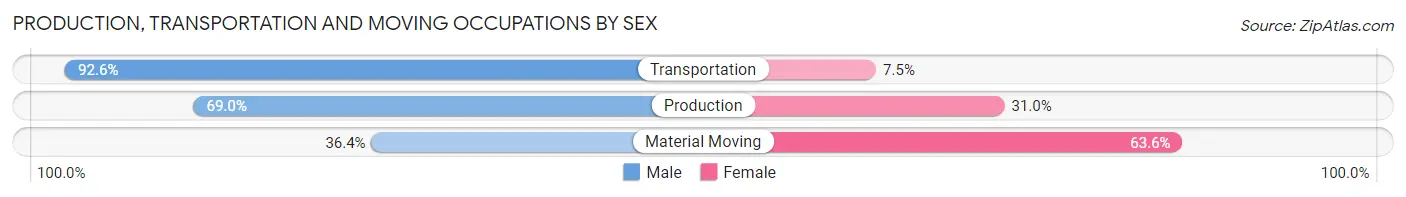
| Occupation | Male | Female |
| Production | 198 (69.0%) | 89 (31.0%) |
| Transportation | 87 (92.5%) | 7 (7.4%) |
| Material Moving | 32 (36.4%) | 56 (63.6%) |
| Total (Category) | 317 (67.6%) | 152 (32.4%) |
| Total (Overall) | 792 (49.7%) | 800 (50.2%) |
Employment Industries by Sex in Orange
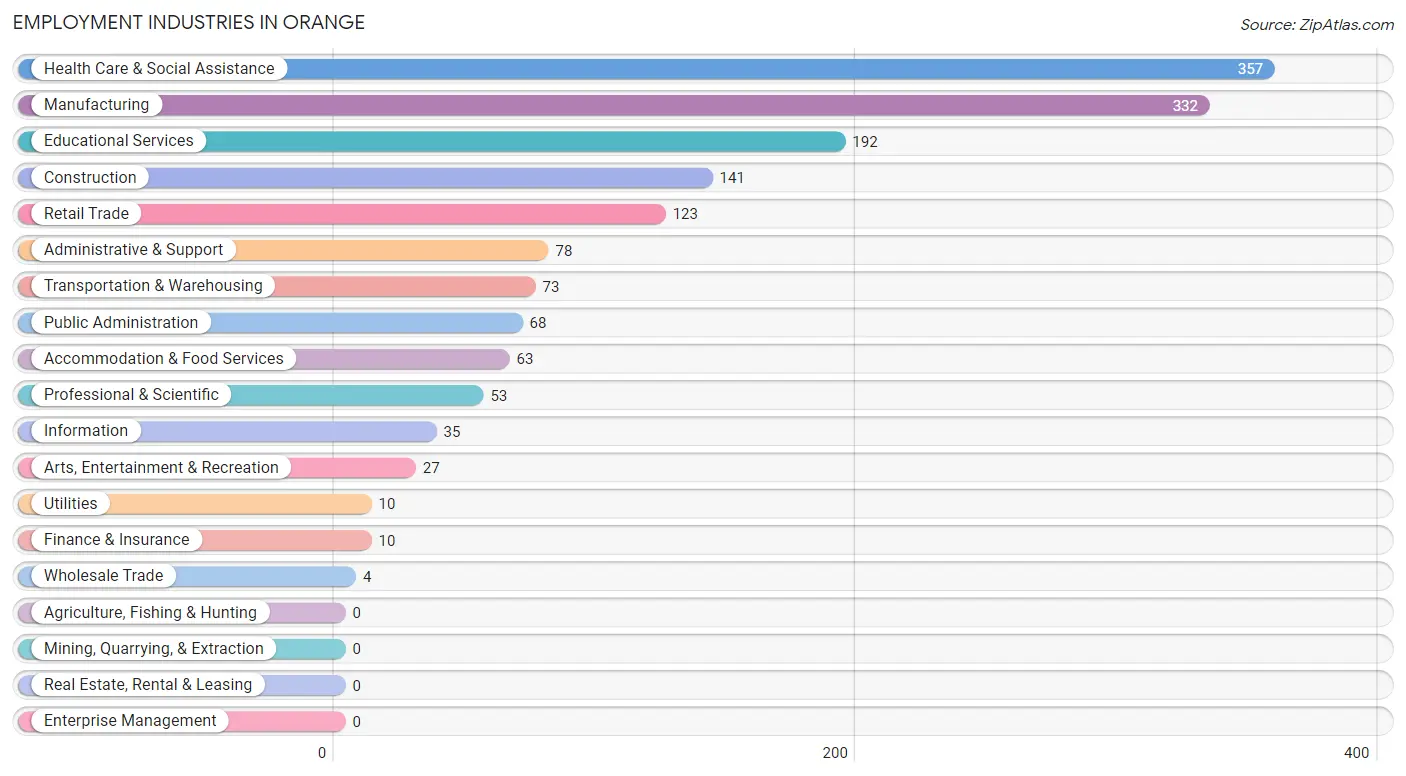
Employment Industries in Orange
The major employment industries in Orange include Health Care & Social Assistance (357 | 22.4%), Manufacturing (332 | 20.8%), Educational Services (192 | 12.1%), Construction (141 | 8.9%), and Retail Trade (123 | 7.7%).
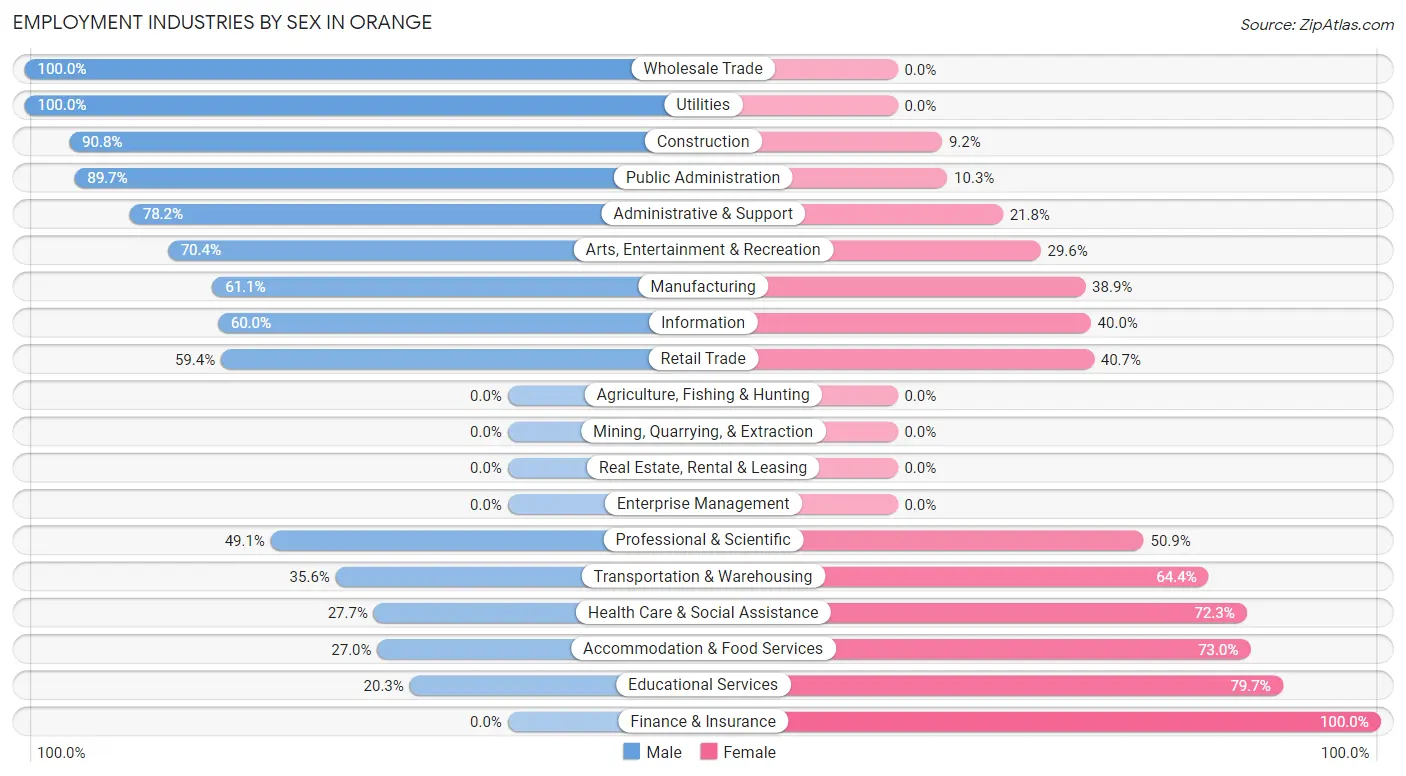
Employment Industries by Sex in Orange
The Orange industries that see more men than women are Wholesale Trade (100.0%), Utilities (100.0%), and Construction (90.8%), whereas the industries that tend to have a higher number of women are Finance & Insurance (100.0%), Educational Services (79.7%), and Accommodation & Food Services (73.0%).
| Industry | Male | Female |
| Agriculture, Fishing & Hunting | 0 (0.0%) | 0 (0.0%) |
| Mining, Quarrying, & Extraction | 0 (0.0%) | 0 (0.0%) |
| Construction | 128 (90.8%) | 13 (9.2%) |
| Manufacturing | 203 (61.1%) | 129 (38.9%) |
| Wholesale Trade | 4 (100.0%) | 0 (0.0%) |
| Retail Trade | 73 (59.4%) | 50 (40.6%) |
| Transportation & Warehousing | 26 (35.6%) | 47 (64.4%) |
| Utilities | 10 (100.0%) | 0 (0.0%) |
| Information | 21 (60.0%) | 14 (40.0%) |
| Finance & Insurance | 0 (0.0%) | 10 (100.0%) |
| Real Estate, Rental & Leasing | 0 (0.0%) | 0 (0.0%) |
| Professional & Scientific | 26 (49.1%) | 27 (50.9%) |
| Enterprise Management | 0 (0.0%) | 0 (0.0%) |
| Administrative & Support | 61 (78.2%) | 17 (21.8%) |
| Educational Services | 39 (20.3%) | 153 (79.7%) |
| Health Care & Social Assistance | 99 (27.7%) | 258 (72.3%) |
| Arts, Entertainment & Recreation | 19 (70.4%) | 8 (29.6%) |
| Accommodation & Food Services | 17 (27.0%) | 46 (73.0%) |
| Public Administration | 61 (89.7%) | 7 (10.3%) |
| Total | 792 (49.7%) | 800 (50.2%) |
Education in Orange
School Enrollment in Orange
The most common levels of schooling among the 683 students in Orange are middle school (216 | 31.6%), high school (136 | 19.9%), and college / undergraduate (112 | 16.4%).
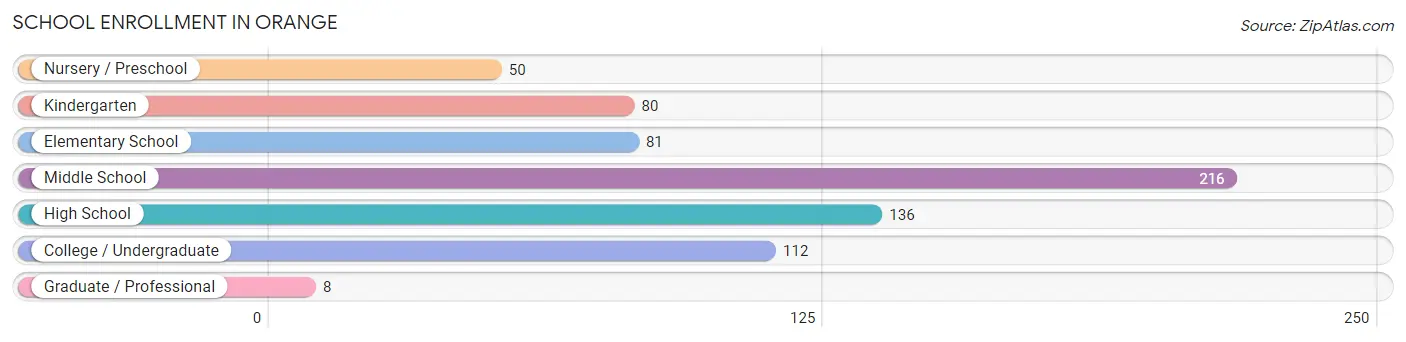
| School Level | # Students | % Students |
| Nursery / Preschool | 50 | 7.3% |
| Kindergarten | 80 | 11.7% |
| Elementary School | 81 | 11.9% |
| Middle School | 216 | 31.6% |
| High School | 136 | 19.9% |
| College / Undergraduate | 112 | 16.4% |
| Graduate / Professional | 8 | 1.2% |
| Total | 683 | 100.0% |
School Enrollment by Age by Funding Source in Orange
Out of a total of 683 students who are enrolled in schools in Orange, 106 (15.5%) attend a private institution, while the remaining 577 (84.5%) are enrolled in public schools. The age group of 3 to 4 year olds has the highest likelihood of being enrolled in private schools, with 25 (67.6% in the age bracket) enrolled. Conversely, the age group of 20 to 24 year olds has the lowest likelihood of being enrolled in a private school, with 18 (100.0% in the age bracket) attending a public institution.
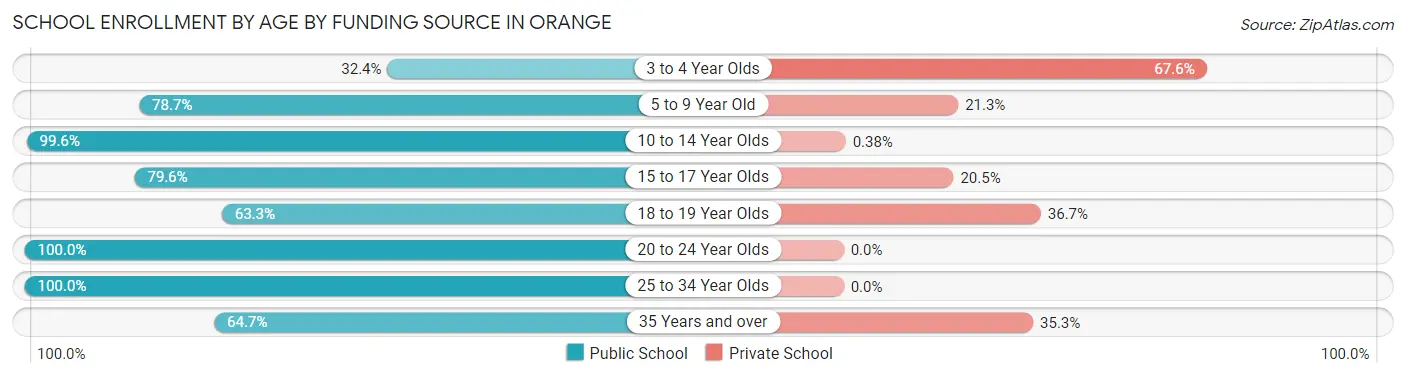
| Age Bracket | Public School | Private School |
| 3 to 4 Year Olds | 12 (32.4%) | 25 (67.6%) |
| 5 to 9 Year Old | 118 (78.7%) | 32 (21.3%) |
| 10 to 14 Year Olds | 259 (99.6%) | 1 (0.4%) |
| 15 to 17 Year Olds | 70 (79.5%) | 18 (20.4%) |
| 18 to 19 Year Olds | 31 (63.3%) | 18 (36.7%) |
| 20 to 24 Year Olds | 18 (100.0%) | 0 (0.0%) |
| 25 to 34 Year Olds | 47 (100.0%) | 0 (0.0%) |
| 35 Years and over | 22 (64.7%) | 12 (35.3%) |
| Total | 577 (84.5%) | 106 (15.5%) |
Educational Attainment by Field of Study in Orange
Arts & humanities (66 | 14.3%), business (62 | 13.4%), social sciences (59 | 12.8%), education (56 | 12.1%), and psychology (55 | 11.9%) are the most common fields of study among 462 individuals in Orange who have obtained a bachelor's degree or higher.
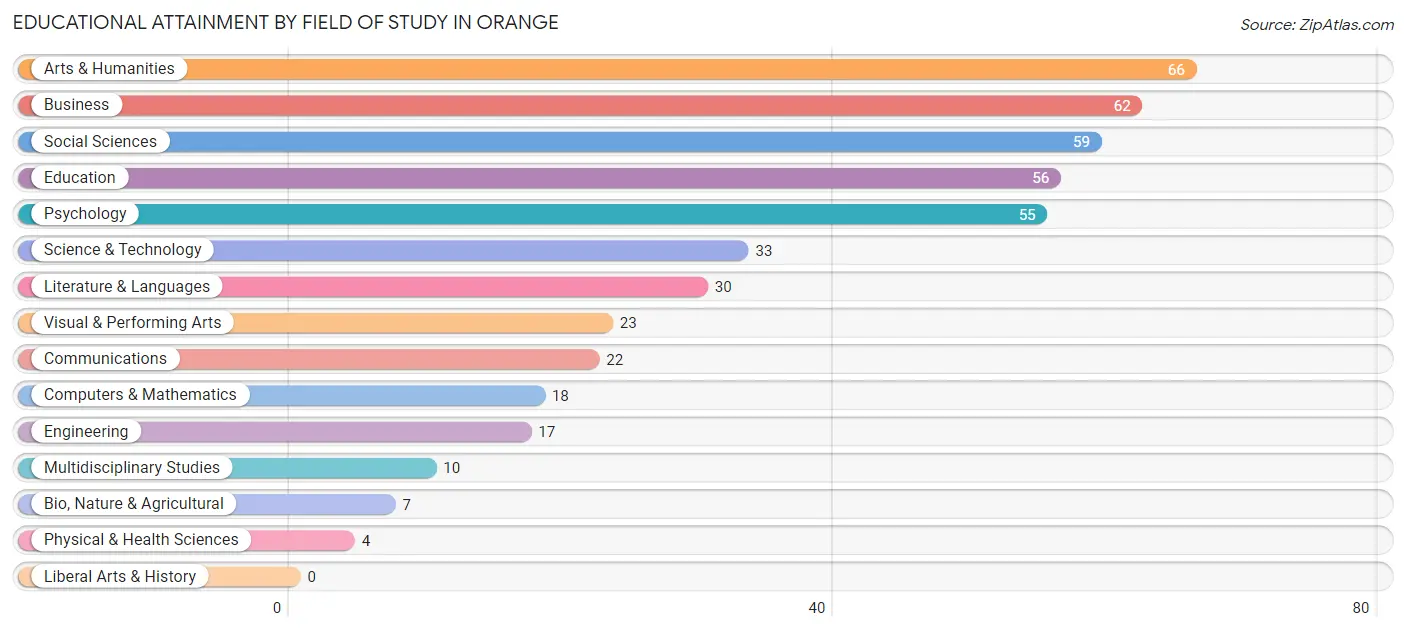
| Field of Study | # Graduates | % Graduates |
| Computers & Mathematics | 18 | 3.9% |
| Bio, Nature & Agricultural | 7 | 1.5% |
| Physical & Health Sciences | 4 | 0.9% |
| Psychology | 55 | 11.9% |
| Social Sciences | 59 | 12.8% |
| Engineering | 17 | 3.7% |
| Multidisciplinary Studies | 10 | 2.2% |
| Science & Technology | 33 | 7.1% |
| Business | 62 | 13.4% |
| Education | 56 | 12.1% |
| Literature & Languages | 30 | 6.5% |
| Liberal Arts & History | 0 | 0.0% |
| Visual & Performing Arts | 23 | 5.0% |
| Communications | 22 | 4.8% |
| Arts & Humanities | 66 | 14.3% |
| Total | 462 | 100.0% |
Transportation & Commute in Orange
Vehicle Availability by Sex in Orange
The most prevalent vehicle ownership categories in Orange are males with 2 vehicles (350, accounting for 44.2%) and females with 2 vehicles (448, making up 43.8%).
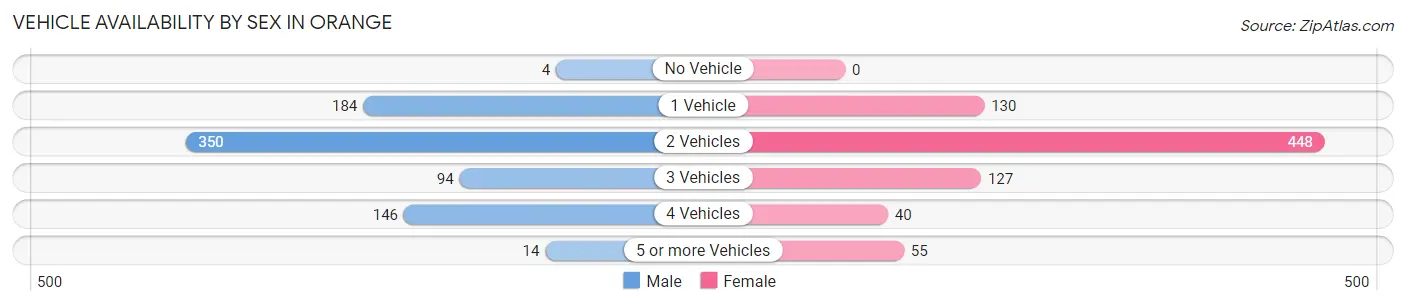
| Vehicles Available | Male | Female |
| No Vehicle | 4 (0.5%) | 0 (0.0%) |
| 1 Vehicle | 184 (23.2%) | 130 (16.3%) |
| 2 Vehicles | 350 (44.2%) | 448 (56.0%) |
| 3 Vehicles | 94 (11.9%) | 127 (15.9%) |
| 4 Vehicles | 146 (18.4%) | 40 (5.0%) |
| 5 or more Vehicles | 14 (1.8%) | 55 (6.9%) |
| Total | 792 (100.0%) | 800 (100.0%) |
Commute Time in Orange
The most frequently occuring commute durations in Orange are 5 to 9 minutes (235 commuters, 15.3%), 30 to 34 minutes (203 commuters, 13.3%), and 15 to 19 minutes (186 commuters, 12.1%).
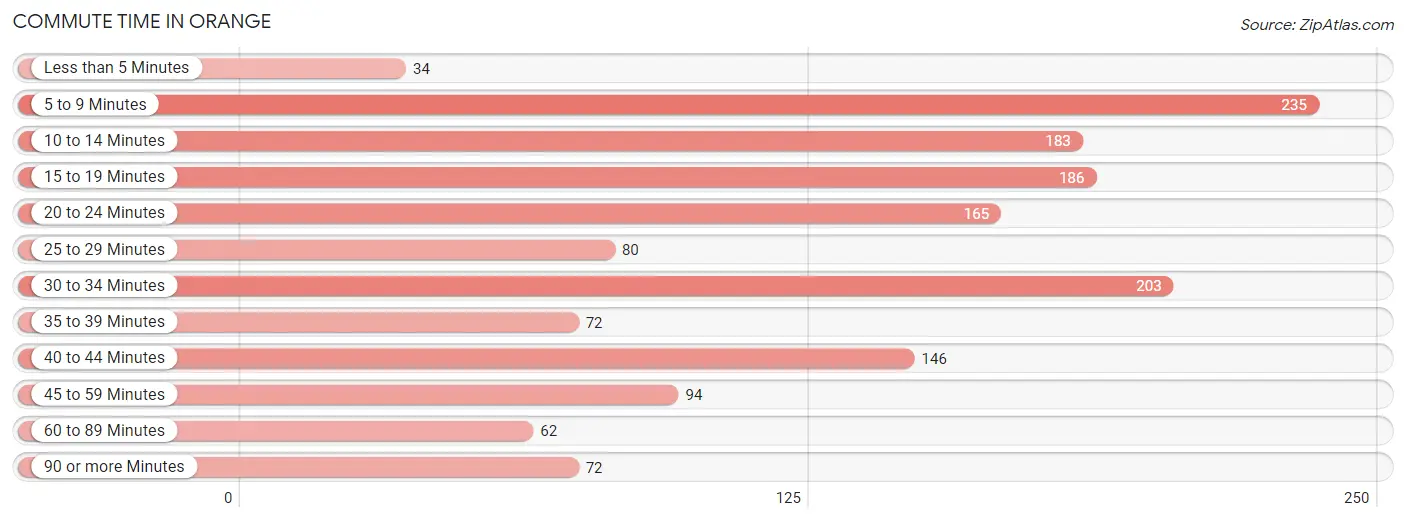
| Commute Time | # Commuters | % Commuters |
| Less than 5 Minutes | 34 | 2.2% |
| 5 to 9 Minutes | 235 | 15.3% |
| 10 to 14 Minutes | 183 | 11.9% |
| 15 to 19 Minutes | 186 | 12.1% |
| 20 to 24 Minutes | 165 | 10.8% |
| 25 to 29 Minutes | 80 | 5.2% |
| 30 to 34 Minutes | 203 | 13.3% |
| 35 to 39 Minutes | 72 | 4.7% |
| 40 to 44 Minutes | 146 | 9.5% |
| 45 to 59 Minutes | 94 | 6.1% |
| 60 to 89 Minutes | 62 | 4.1% |
| 90 or more Minutes | 72 | 4.7% |
Commute Time by Sex in Orange
The most common commute times in Orange are 5 to 9 minutes (113 commuters, 14.4%) for males and 15 to 19 minutes (144 commuters, 19.3%) for females.
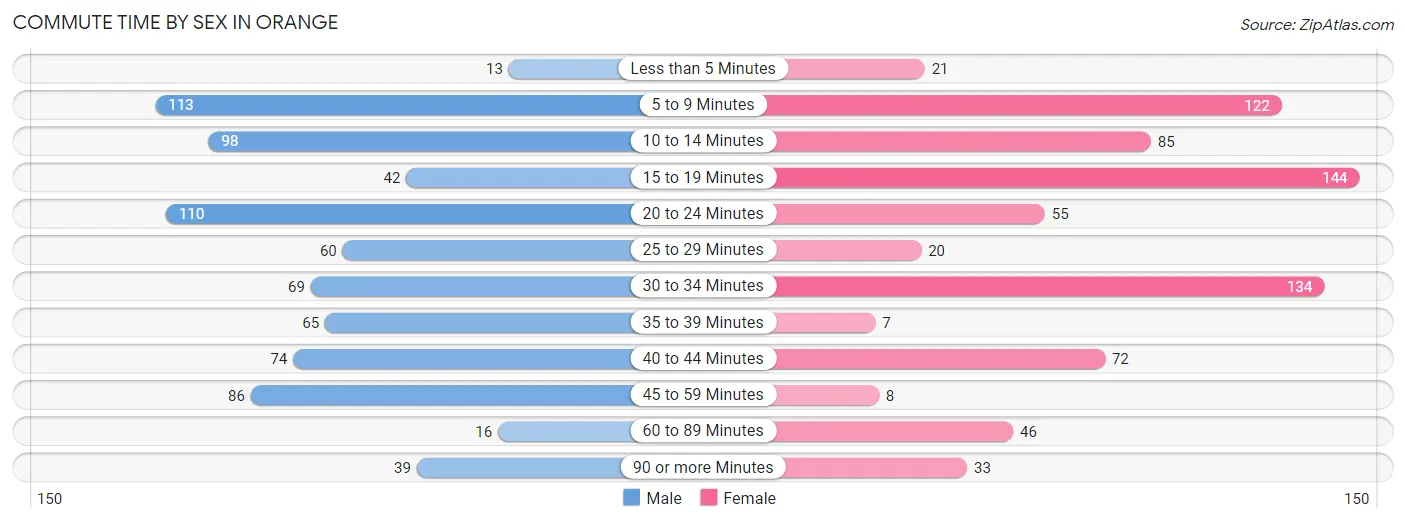
| Commute Time | Male | Female |
| Less than 5 Minutes | 13 (1.7%) | 21 (2.8%) |
| 5 to 9 Minutes | 113 (14.4%) | 122 (16.3%) |
| 10 to 14 Minutes | 98 (12.5%) | 85 (11.4%) |
| 15 to 19 Minutes | 42 (5.3%) | 144 (19.3%) |
| 20 to 24 Minutes | 110 (14.0%) | 55 (7.4%) |
| 25 to 29 Minutes | 60 (7.6%) | 20 (2.7%) |
| 30 to 34 Minutes | 69 (8.8%) | 134 (17.9%) |
| 35 to 39 Minutes | 65 (8.3%) | 7 (0.9%) |
| 40 to 44 Minutes | 74 (9.4%) | 72 (9.6%) |
| 45 to 59 Minutes | 86 (11.0%) | 8 (1.1%) |
| 60 to 89 Minutes | 16 (2.0%) | 46 (6.2%) |
| 90 or more Minutes | 39 (5.0%) | 33 (4.4%) |
Time of Departure to Work by Sex in Orange
The most frequent times of departure to work in Orange are 12:00 PM to 3:59 PM (150, 19.1%) for males and 8:00 AM to 8:29 AM (190, 25.4%) for females.
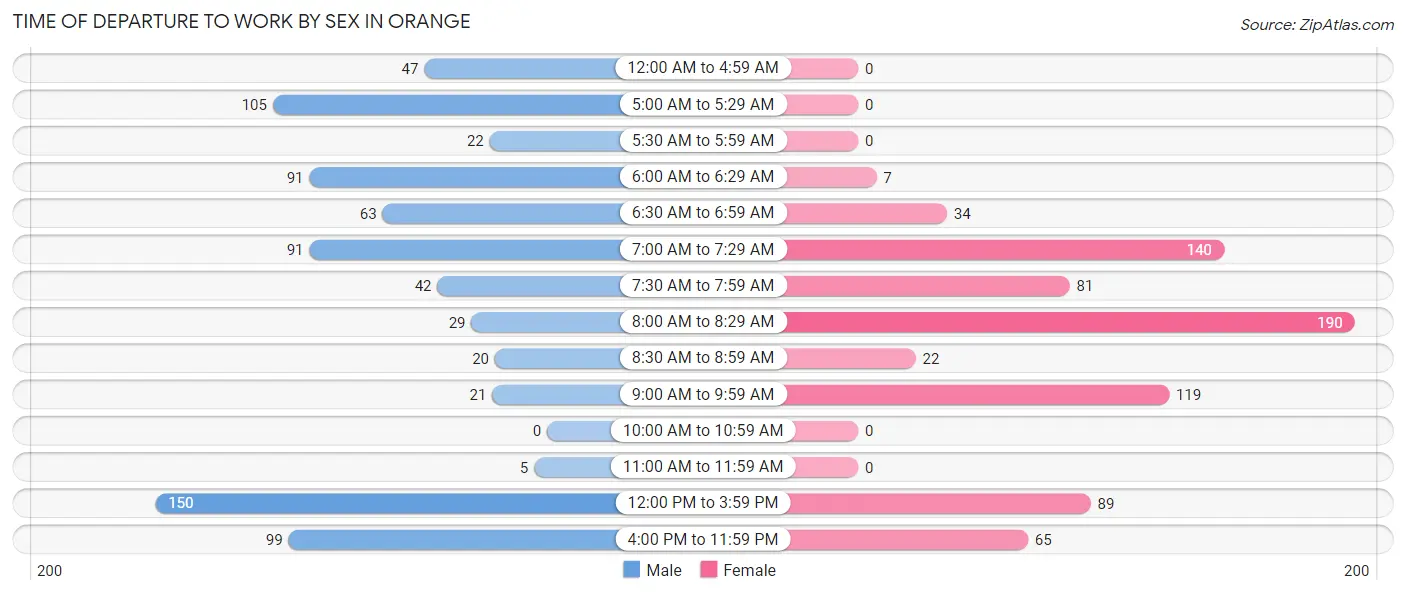
| Time of Departure | Male | Female |
| 12:00 AM to 4:59 AM | 47 (6.0%) | 0 (0.0%) |
| 5:00 AM to 5:29 AM | 105 (13.4%) | 0 (0.0%) |
| 5:30 AM to 5:59 AM | 22 (2.8%) | 0 (0.0%) |
| 6:00 AM to 6:29 AM | 91 (11.6%) | 7 (0.9%) |
| 6:30 AM to 6:59 AM | 63 (8.0%) | 34 (4.5%) |
| 7:00 AM to 7:29 AM | 91 (11.6%) | 140 (18.7%) |
| 7:30 AM to 7:59 AM | 42 (5.3%) | 81 (10.8%) |
| 8:00 AM to 8:29 AM | 29 (3.7%) | 190 (25.4%) |
| 8:30 AM to 8:59 AM | 20 (2.5%) | 22 (2.9%) |
| 9:00 AM to 9:59 AM | 21 (2.7%) | 119 (15.9%) |
| 10:00 AM to 10:59 AM | 0 (0.0%) | 0 (0.0%) |
| 11:00 AM to 11:59 AM | 5 (0.6%) | 0 (0.0%) |
| 12:00 PM to 3:59 PM | 150 (19.1%) | 89 (11.9%) |
| 4:00 PM to 11:59 PM | 99 (12.6%) | 65 (8.7%) |
| Total | 785 (100.0%) | 747 (100.0%) |
Housing Occupancy in Orange
Occupancy by Ownership in Orange
Of the total 1,465 dwellings in Orange, owner-occupied units account for 1,010 (68.9%), while renter-occupied units make up 455 (31.1%).
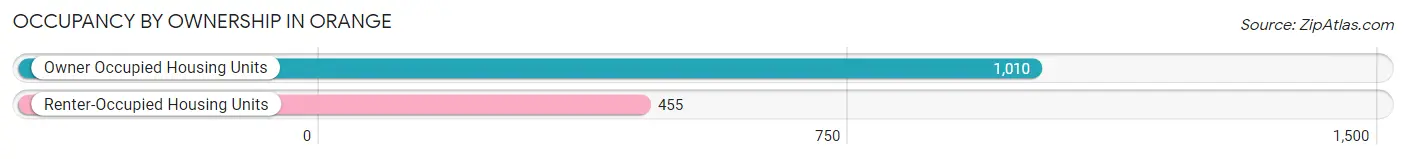
| Occupancy | # Housing Units | % Housing Units |
| Owner Occupied Housing Units | 1,010 | 68.9% |
| Renter-Occupied Housing Units | 455 | 31.1% |
| Total Occupied Housing Units | 1,465 | 100.0% |
Occupancy by Household Size in Orange
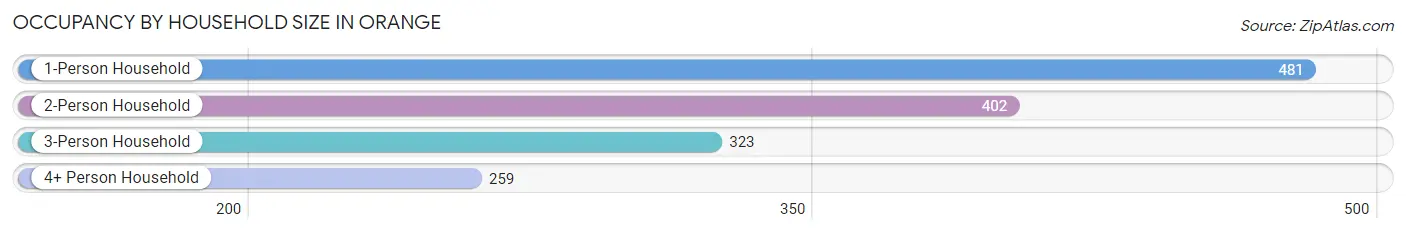
| Household Size | # Housing Units | % Housing Units |
| 1-Person Household | 481 | 32.8% |
| 2-Person Household | 402 | 27.4% |
| 3-Person Household | 323 | 22.1% |
| 4+ Person Household | 259 | 17.7% |
| Total Housing Units | 1,465 | 100.0% |
Occupancy by Ownership by Household Size in Orange
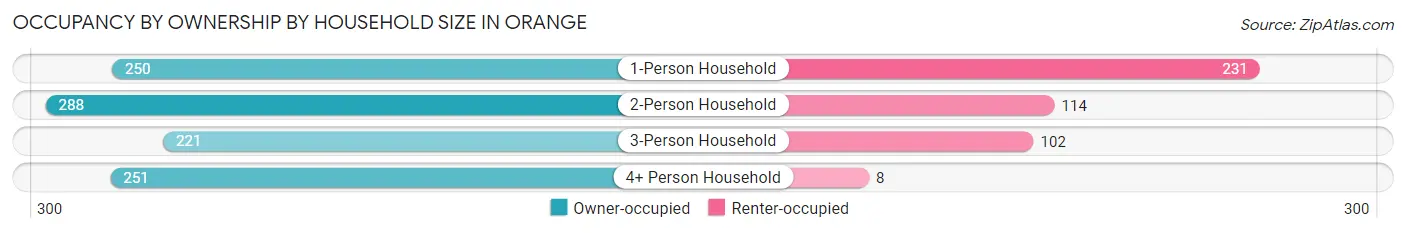
| Household Size | Owner-occupied | Renter-occupied |
| 1-Person Household | 250 (52.0%) | 231 (48.0%) |
| 2-Person Household | 288 (71.6%) | 114 (28.4%) |
| 3-Person Household | 221 (68.4%) | 102 (31.6%) |
| 4+ Person Household | 251 (96.9%) | 8 (3.1%) |
| Total Housing Units | 1,010 (68.9%) | 455 (31.1%) |
Occupancy by Educational Attainment in Orange
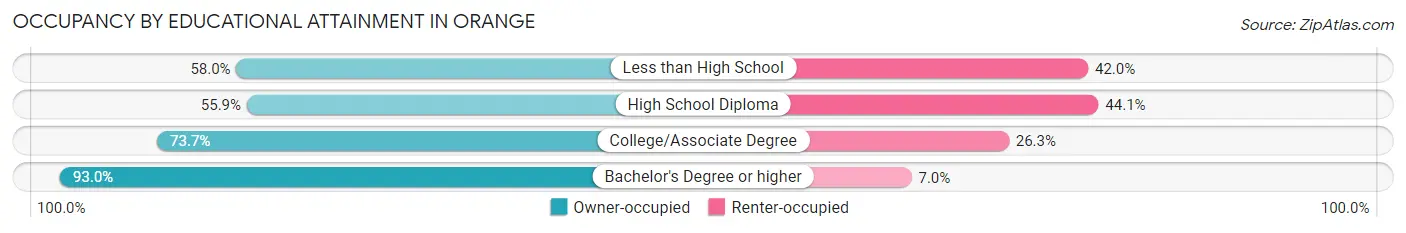
| Household Size | Owner-occupied | Renter-occupied |
| Less than High School | 29 (58.0%) | 21 (42.0%) |
| High School Diploma | 325 (55.9%) | 256 (44.1%) |
| College/Associate Degree | 457 (73.7%) | 163 (26.3%) |
| Bachelor's Degree or higher | 199 (93.0%) | 15 (7.0%) |
Occupancy by Age of Householder in Orange
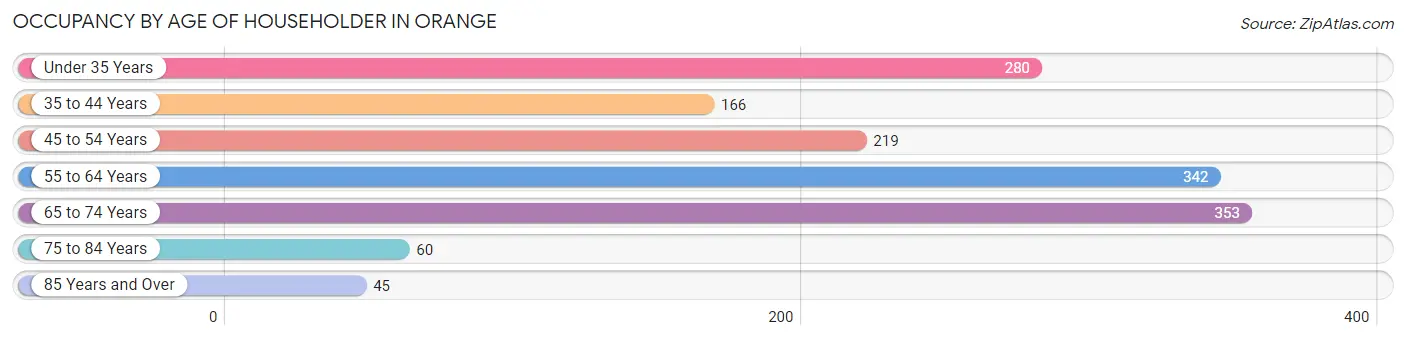
| Age Bracket | # Households | % Households |
| Under 35 Years | 280 | 19.1% |
| 35 to 44 Years | 166 | 11.3% |
| 45 to 54 Years | 219 | 14.9% |
| 55 to 64 Years | 342 | 23.3% |
| 65 to 74 Years | 353 | 24.1% |
| 75 to 84 Years | 60 | 4.1% |
| 85 Years and Over | 45 | 3.1% |
| Total | 1,465 | 100.0% |
Housing Finances in Orange
Median Income by Occupancy in Orange
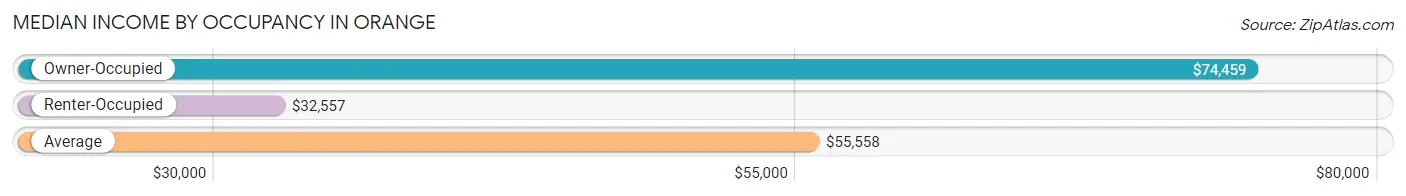
| Occupancy Type | # Households | Median Income |
| Owner-Occupied | 1,010 (68.9%) | $74,459 |
| Renter-Occupied | 455 (31.1%) | $32,557 |
| Average | 1,465 (100.0%) | $55,558 |
Occupancy by Householder Income Bracket in Orange
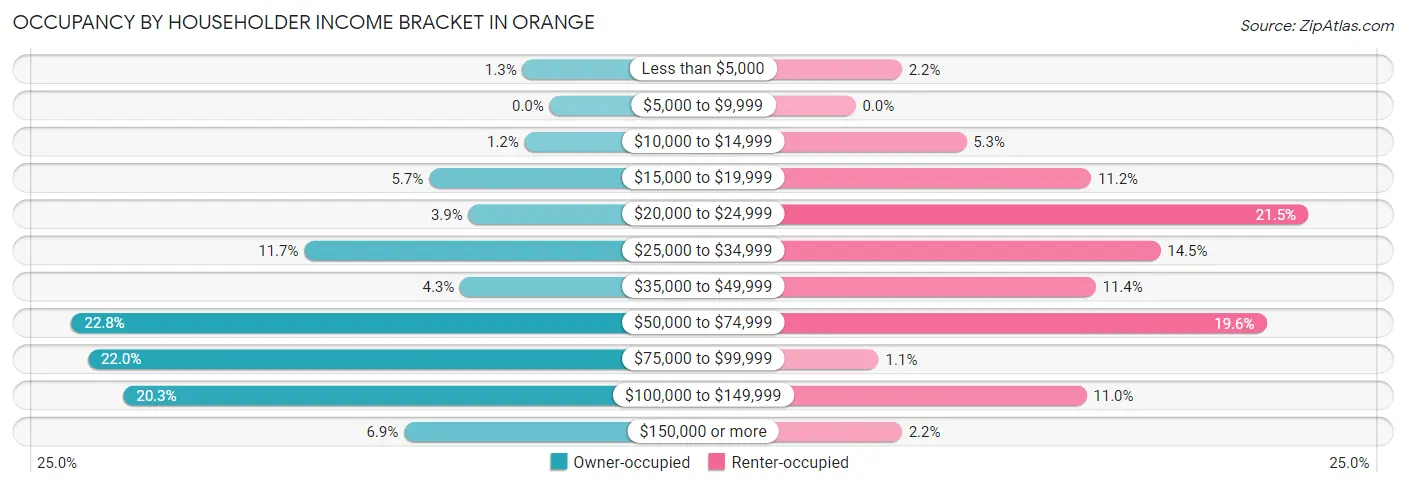
| Income Bracket | Owner-occupied | Renter-occupied |
| Less than $5,000 | 13 (1.3%) | 10 (2.2%) |
| $5,000 to $9,999 | 0 (0.0%) | 0 (0.0%) |
| $10,000 to $14,999 | 12 (1.2%) | 24 (5.3%) |
| $15,000 to $19,999 | 58 (5.7%) | 51 (11.2%) |
| $20,000 to $24,999 | 39 (3.9%) | 98 (21.5%) |
| $25,000 to $34,999 | 118 (11.7%) | 66 (14.5%) |
| $35,000 to $49,999 | 43 (4.3%) | 52 (11.4%) |
| $50,000 to $74,999 | 230 (22.8%) | 89 (19.6%) |
| $75,000 to $99,999 | 222 (22.0%) | 5 (1.1%) |
| $100,000 to $149,999 | 205 (20.3%) | 50 (11.0%) |
| $150,000 or more | 70 (6.9%) | 10 (2.2%) |
| Total | 1,010 (100.0%) | 455 (100.0%) |
Monthly Housing Cost Tiers in Orange
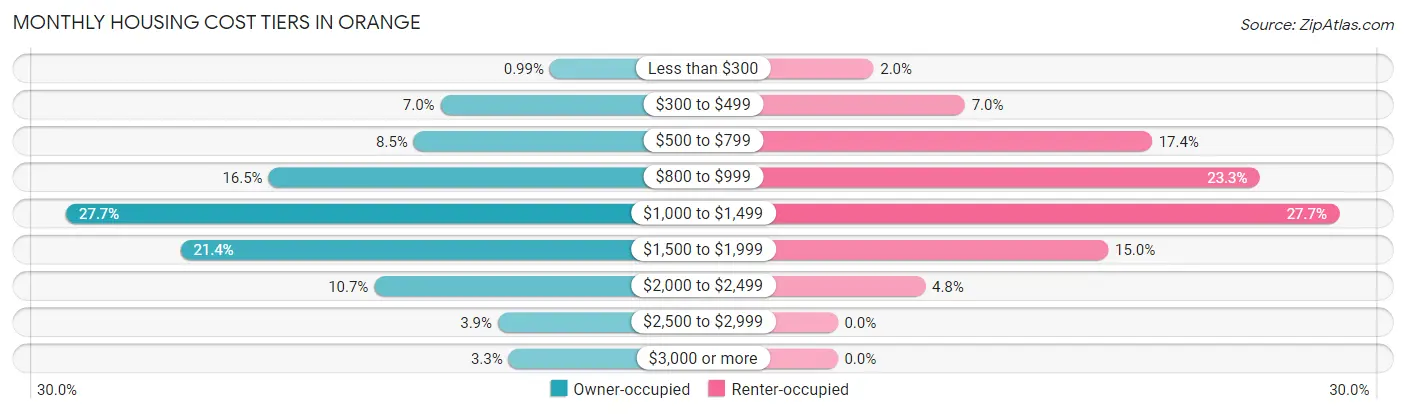
| Monthly Cost | Owner-occupied | Renter-occupied |
| Less than $300 | 10 (1.0%) | 9 (2.0%) |
| $300 to $499 | 71 (7.0%) | 32 (7.0%) |
| $500 to $799 | 86 (8.5%) | 79 (17.4%) |
| $800 to $999 | 167 (16.5%) | 106 (23.3%) |
| $1,000 to $1,499 | 280 (27.7%) | 126 (27.7%) |
| $1,500 to $1,999 | 216 (21.4%) | 68 (14.9%) |
| $2,000 to $2,499 | 108 (10.7%) | 22 (4.8%) |
| $2,500 to $2,999 | 39 (3.9%) | 0 (0.0%) |
| $3,000 or more | 33 (3.3%) | 0 (0.0%) |
| Total | 1,010 (100.0%) | 455 (100.0%) |
Physical Housing Characteristics in Orange
Housing Structures in Orange
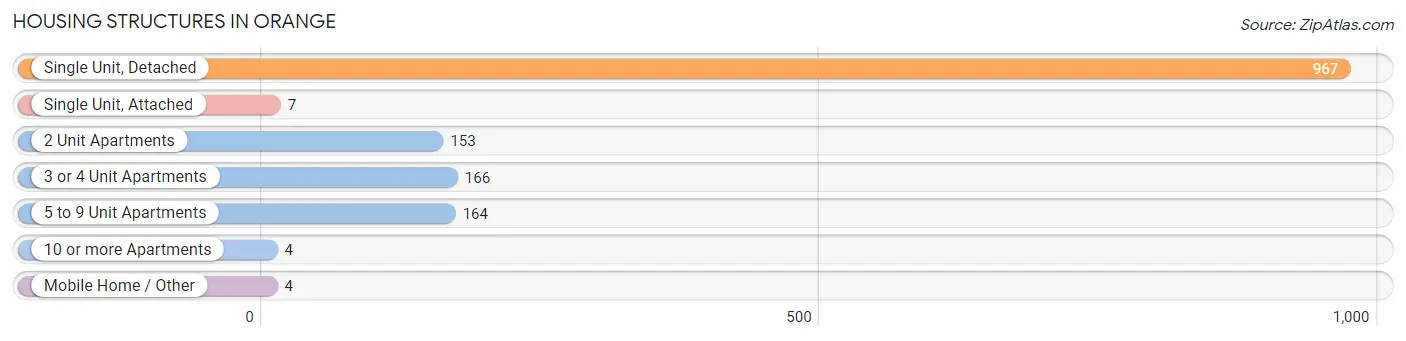
| Structure Type | # Housing Units | % Housing Units |
| Single Unit, Detached | 967 | 66.0% |
| Single Unit, Attached | 7 | 0.5% |
| 2 Unit Apartments | 153 | 10.4% |
| 3 or 4 Unit Apartments | 166 | 11.3% |
| 5 to 9 Unit Apartments | 164 | 11.2% |
| 10 or more Apartments | 4 | 0.3% |
| Mobile Home / Other | 4 | 0.3% |
| Total | 1,465 | 100.0% |
Housing Structures by Occupancy in Orange
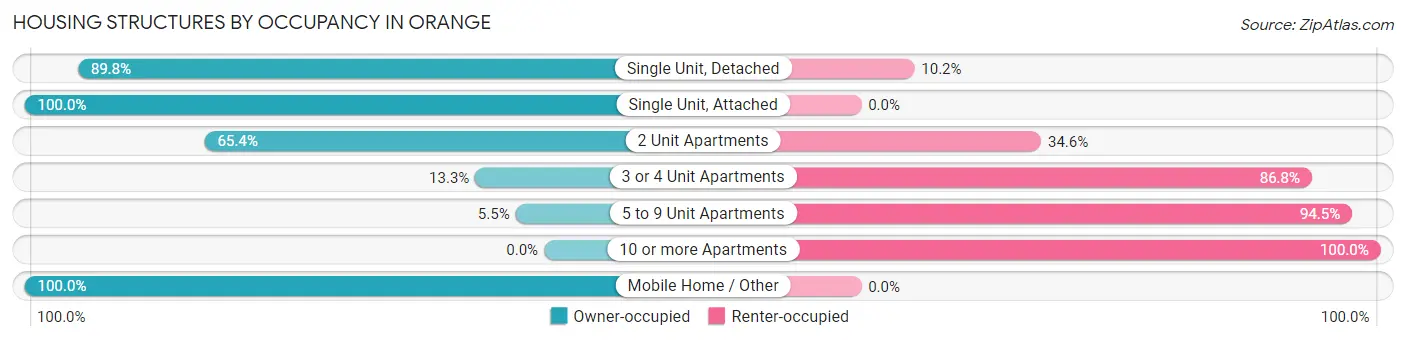
| Structure Type | Owner-occupied | Renter-occupied |
| Single Unit, Detached | 868 (89.8%) | 99 (10.2%) |
| Single Unit, Attached | 7 (100.0%) | 0 (0.0%) |
| 2 Unit Apartments | 100 (65.4%) | 53 (34.6%) |
| 3 or 4 Unit Apartments | 22 (13.3%) | 144 (86.8%) |
| 5 to 9 Unit Apartments | 9 (5.5%) | 155 (94.5%) |
| 10 or more Apartments | 0 (0.0%) | 4 (100.0%) |
| Mobile Home / Other | 4 (100.0%) | 0 (0.0%) |
| Total | 1,010 (68.9%) | 455 (31.1%) |
Housing Structures by Number of Rooms in Orange
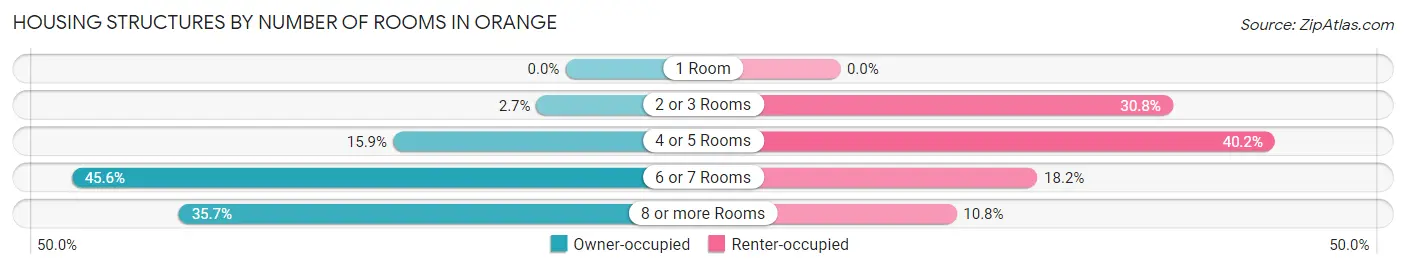
| Number of Rooms | Owner-occupied | Renter-occupied |
| 1 Room | 0 (0.0%) | 0 (0.0%) |
| 2 or 3 Rooms | 27 (2.7%) | 140 (30.8%) |
| 4 or 5 Rooms | 161 (15.9%) | 183 (40.2%) |
| 6 or 7 Rooms | 461 (45.6%) | 83 (18.2%) |
| 8 or more Rooms | 361 (35.7%) | 49 (10.8%) |
| Total | 1,010 (100.0%) | 455 (100.0%) |
Housing Structure by Heating Type in Orange
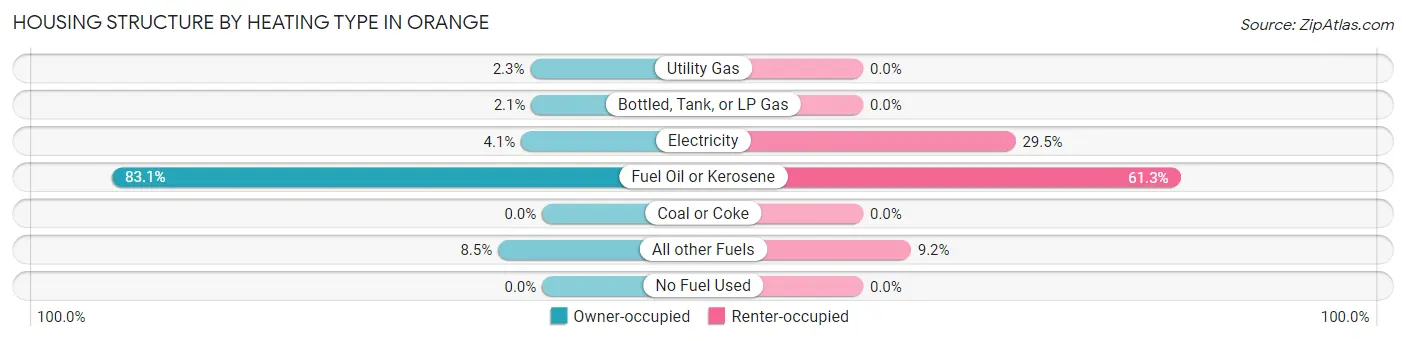
| Heating Type | Owner-occupied | Renter-occupied |
| Utility Gas | 23 (2.3%) | 0 (0.0%) |
| Bottled, Tank, or LP Gas | 21 (2.1%) | 0 (0.0%) |
| Electricity | 41 (4.1%) | 134 (29.4%) |
| Fuel Oil or Kerosene | 839 (83.1%) | 279 (61.3%) |
| Coal or Coke | 0 (0.0%) | 0 (0.0%) |
| All other Fuels | 86 (8.5%) | 42 (9.2%) |
| No Fuel Used | 0 (0.0%) | 0 (0.0%) |
| Total | 1,010 (100.0%) | 455 (100.0%) |
Household Vehicle Usage in Orange
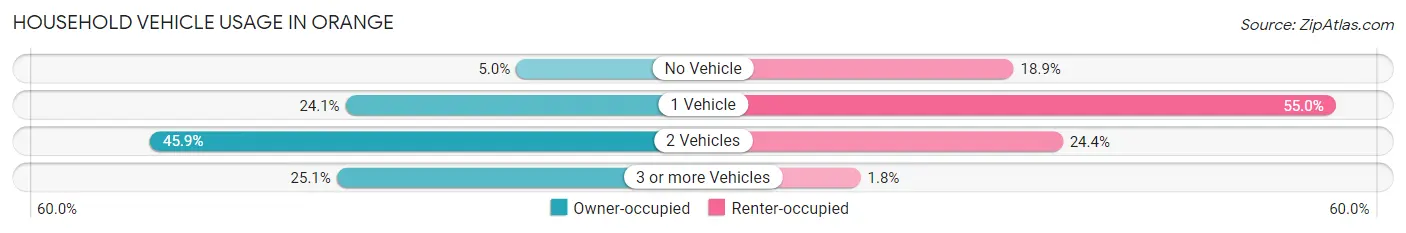
| Vehicles per Household | Owner-occupied | Renter-occupied |
| No Vehicle | 50 (5.0%) | 86 (18.9%) |
| 1 Vehicle | 243 (24.1%) | 250 (54.9%) |
| 2 Vehicles | 464 (45.9%) | 111 (24.4%) |
| 3 or more Vehicles | 253 (25.1%) | 8 (1.8%) |
| Total | 1,010 (100.0%) | 455 (100.0%) |
Real Estate & Mortgages in Orange
Real Estate and Mortgage Overview in Orange
| Characteristic | Without Mortgage | With Mortgage |
| Housing Units | 273 | 737 |
| Median Property Value | $172,800 | $208,800 |
| Median Household Income | $56,708 | $51 |
| Monthly Housing Costs | $677 | $33 |
| Real Estate Taxes | $3,186 | $20 |
Property Value by Mortgage Status in Orange
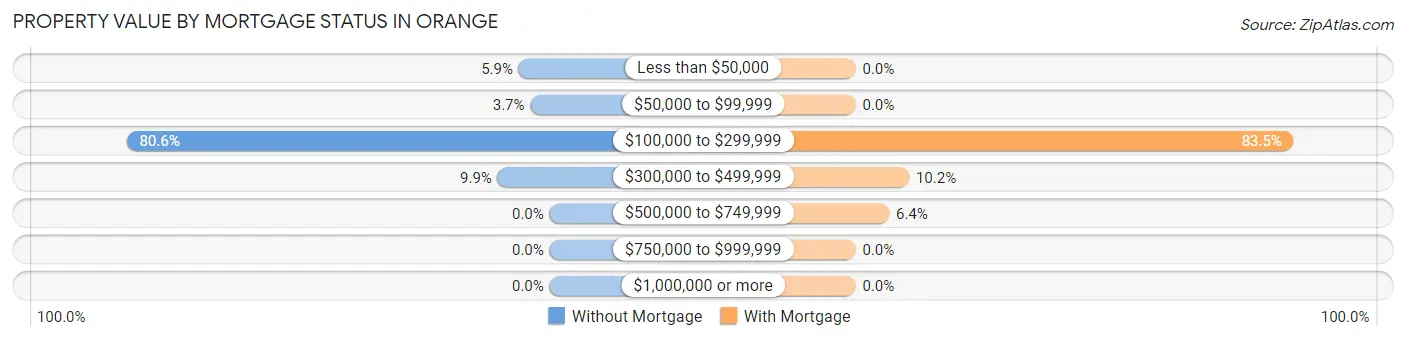
| Property Value | Without Mortgage | With Mortgage |
| Less than $50,000 | 16 (5.9%) | 0 (0.0%) |
| $50,000 to $99,999 | 10 (3.7%) | 0 (0.0%) |
| $100,000 to $299,999 | 220 (80.6%) | 615 (83.5%) |
| $300,000 to $499,999 | 27 (9.9%) | 75 (10.2%) |
| $500,000 to $749,999 | 0 (0.0%) | 47 (6.4%) |
| $750,000 to $999,999 | 0 (0.0%) | 0 (0.0%) |
| $1,000,000 or more | 0 (0.0%) | 0 (0.0%) |
| Total | 273 (100.0%) | 737 (100.0%) |
Household Income by Mortgage Status in Orange
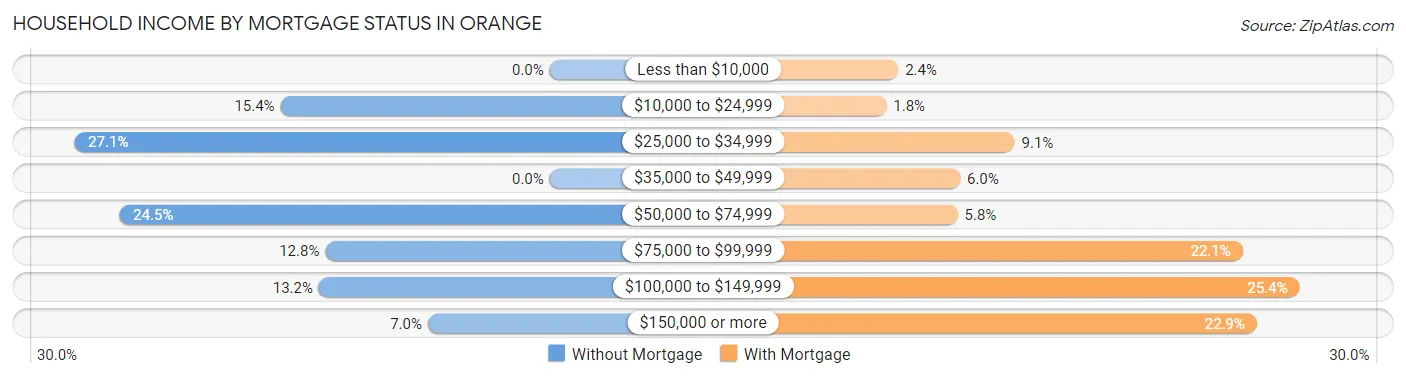
| Household Income | Without Mortgage | With Mortgage |
| Less than $10,000 | 0 (0.0%) | 18 (2.4%) |
| $10,000 to $24,999 | 42 (15.4%) | 13 (1.8%) |
| $25,000 to $34,999 | 74 (27.1%) | 67 (9.1%) |
| $35,000 to $49,999 | 0 (0.0%) | 44 (6.0%) |
| $50,000 to $74,999 | 67 (24.5%) | 43 (5.8%) |
| $75,000 to $99,999 | 35 (12.8%) | 163 (22.1%) |
| $100,000 to $149,999 | 36 (13.2%) | 187 (25.4%) |
| $150,000 or more | 19 (7.0%) | 169 (22.9%) |
| Total | 273 (100.0%) | 737 (100.0%) |
Property Value to Household Income Ratio in Orange
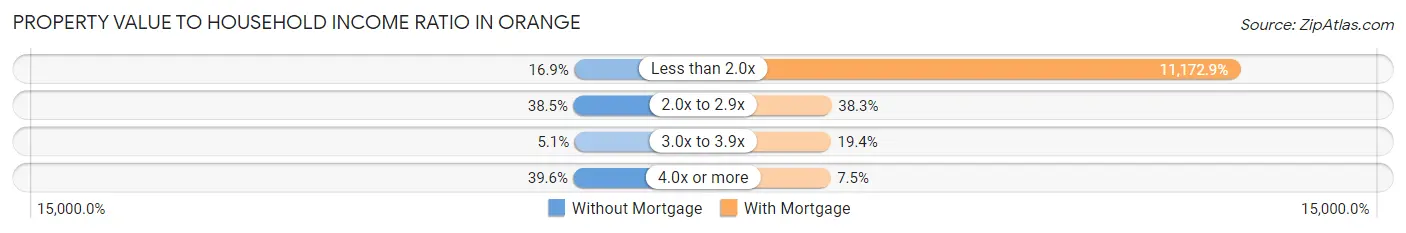
| Value-to-Income Ratio | Without Mortgage | With Mortgage |
| Less than 2.0x | 46 (16.9%) | 82,344 (11,172.9%) |
| 2.0x to 2.9x | 105 (38.5%) | 282 (38.3%) |
| 3.0x to 3.9x | 14 (5.1%) | 143 (19.4%) |
| 4.0x or more | 108 (39.6%) | 55 (7.5%) |
| Total | 273 (100.0%) | 737 (100.0%) |
Real Estate Taxes by Mortgage Status in Orange
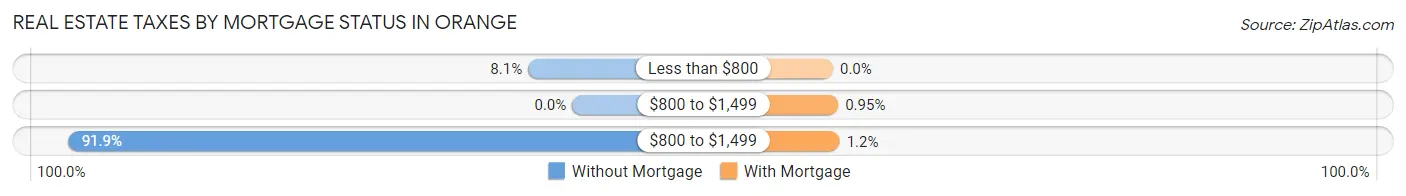
| Property Taxes | Without Mortgage | With Mortgage |
| Less than $800 | 22 (8.1%) | 0 (0.0%) |
| $800 to $1,499 | 0 (0.0%) | 7 (0.9%) |
| $800 to $1,499 | 251 (91.9%) | 9 (1.2%) |
| Total | 273 (100.0%) | 737 (100.0%) |
Health & Disability in Orange
Health Insurance Coverage by Age in Orange
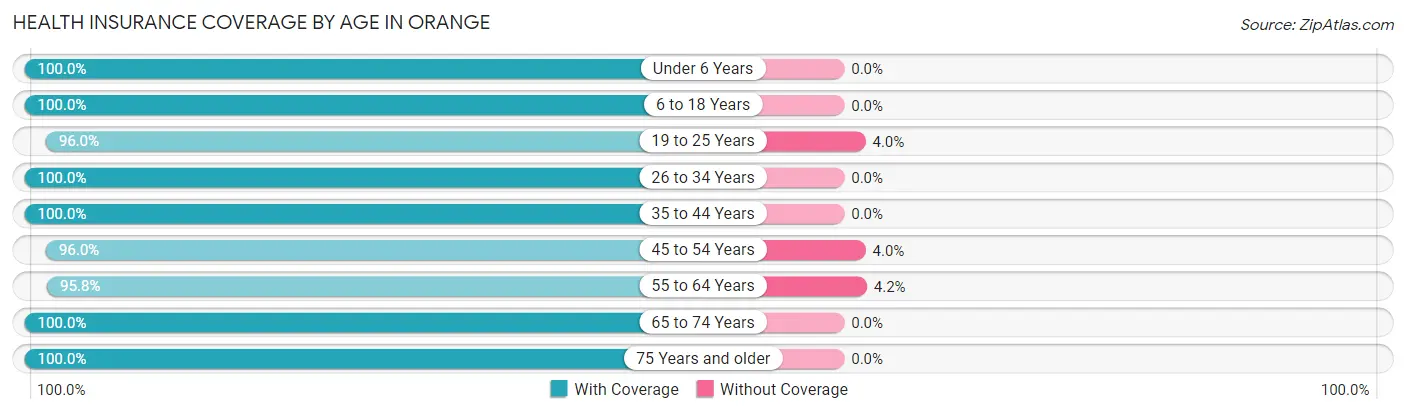
| Age Bracket | With Coverage | Without Coverage |
| Under 6 Years | 210 (100.0%) | 0 (0.0%) |
| 6 to 18 Years | 557 (100.0%) | 0 (0.0%) |
| 19 to 25 Years | 315 (96.0%) | 13 (4.0%) |
| 26 to 34 Years | 524 (100.0%) | 0 (0.0%) |
| 35 to 44 Years | 408 (100.0%) | 0 (0.0%) |
| 45 to 54 Years | 506 (96.0%) | 21 (4.0%) |
| 55 to 64 Years | 525 (95.8%) | 23 (4.2%) |
| 65 to 74 Years | 482 (100.0%) | 0 (0.0%) |
| 75 Years and older | 146 (100.0%) | 0 (0.0%) |
| Total | 3,673 (98.5%) | 57 (1.5%) |
Health Insurance Coverage by Citizenship Status in Orange
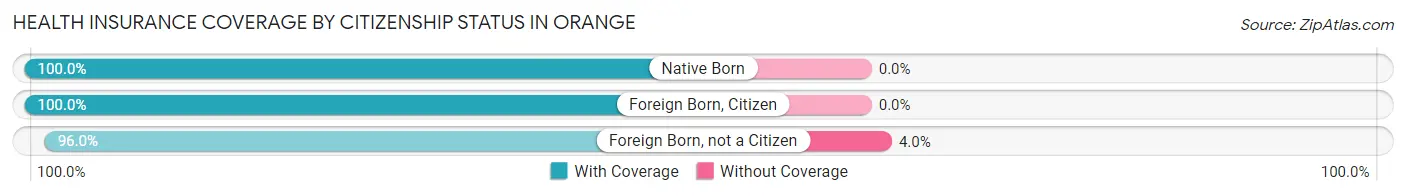
| Citizenship Status | With Coverage | Without Coverage |
| Native Born | 210 (100.0%) | 0 (0.0%) |
| Foreign Born, Citizen | 557 (100.0%) | 0 (0.0%) |
| Foreign Born, not a Citizen | 315 (96.0%) | 13 (4.0%) |
Health Insurance Coverage by Household Income in Orange
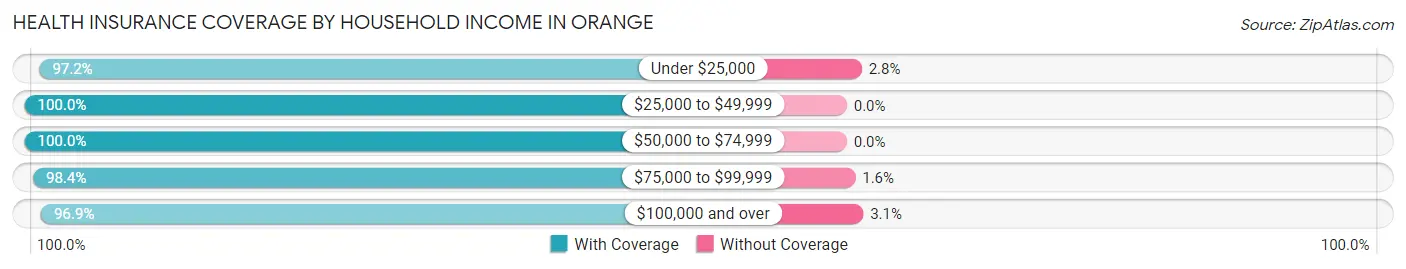
| Household Income | With Coverage | Without Coverage |
| Under $25,000 | 523 (97.2%) | 15 (2.8%) |
| $25,000 to $49,999 | 571 (100.0%) | 0 (0.0%) |
| $50,000 to $74,999 | 975 (100.0%) | 0 (0.0%) |
| $75,000 to $99,999 | 495 (98.4%) | 8 (1.6%) |
| $100,000 and over | 1,071 (96.9%) | 34 (3.1%) |
Public vs Private Health Insurance Coverage by Age in Orange
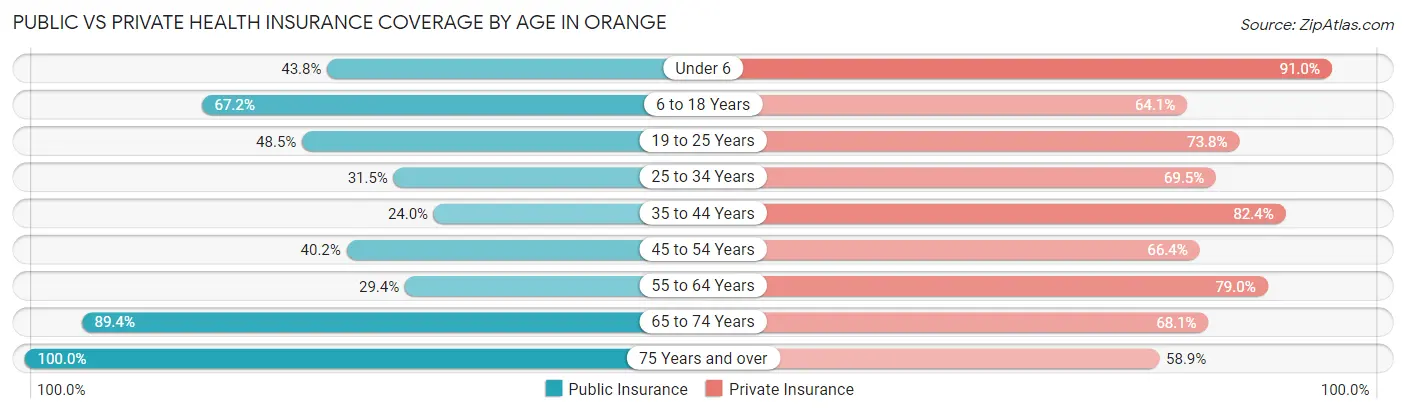
| Age Bracket | Public Insurance | Private Insurance |
| Under 6 | 92 (43.8%) | 191 (90.9%) |
| 6 to 18 Years | 374 (67.1%) | 357 (64.1%) |
| 19 to 25 Years | 159 (48.5%) | 242 (73.8%) |
| 25 to 34 Years | 165 (31.5%) | 364 (69.5%) |
| 35 to 44 Years | 98 (24.0%) | 336 (82.4%) |
| 45 to 54 Years | 212 (40.2%) | 350 (66.4%) |
| 55 to 64 Years | 161 (29.4%) | 433 (79.0%) |
| 65 to 74 Years | 431 (89.4%) | 328 (68.0%) |
| 75 Years and over | 146 (100.0%) | 86 (58.9%) |
| Total | 1,838 (49.3%) | 2,687 (72.0%) |
Disability Status by Sex by Age in Orange
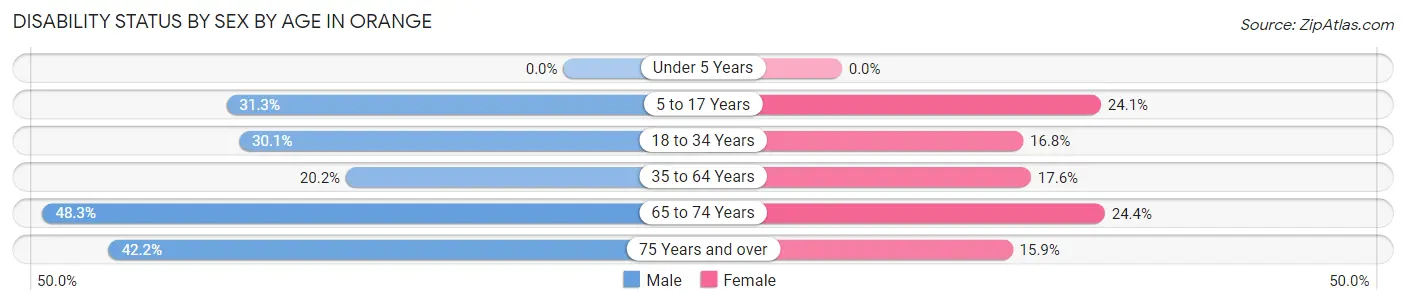
| Age Bracket | Male | Female |
| Under 5 Years | 0 (0.0%) | 0 (0.0%) |
| 5 to 17 Years | 90 (31.2%) | 70 (24.0%) |
| 18 to 34 Years | 136 (30.1%) | 69 (16.8%) |
| 35 to 64 Years | 136 (20.2%) | 142 (17.5%) |
| 65 to 74 Years | 130 (48.3%) | 52 (24.4%) |
| 75 Years and over | 27 (42.2%) | 13 (15.9%) |
Disability Class by Sex by Age in Orange
Disability Class: Hearing Difficulty
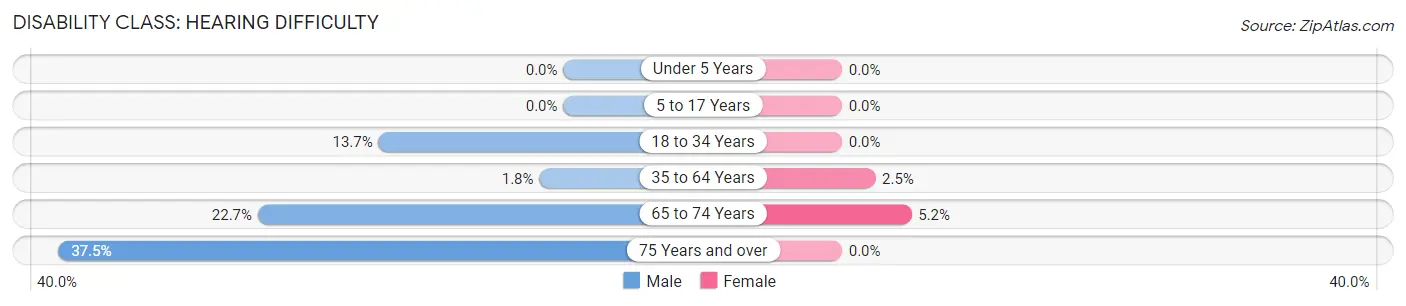
| Age Bracket | Male | Female |
| Under 5 Years | 0 (0.0%) | 0 (0.0%) |
| 5 to 17 Years | 0 (0.0%) | 0 (0.0%) |
| 18 to 34 Years | 62 (13.7%) | 0 (0.0%) |
| 35 to 64 Years | 12 (1.8%) | 20 (2.5%) |
| 65 to 74 Years | 61 (22.7%) | 11 (5.2%) |
| 75 Years and over | 24 (37.5%) | 0 (0.0%) |
Disability Class: Vision Difficulty
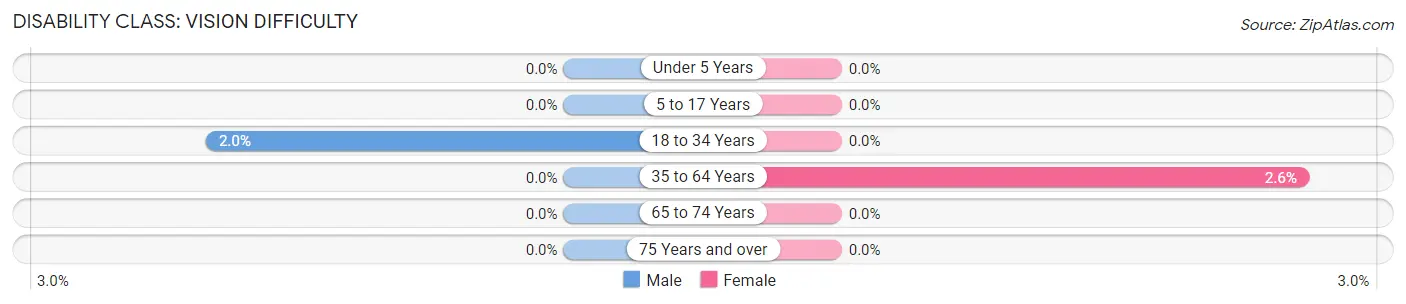
| Age Bracket | Male | Female |
| Under 5 Years | 0 (0.0%) | 0 (0.0%) |
| 5 to 17 Years | 0 (0.0%) | 0 (0.0%) |
| 18 to 34 Years | 9 (2.0%) | 0 (0.0%) |
| 35 to 64 Years | 0 (0.0%) | 21 (2.6%) |
| 65 to 74 Years | 0 (0.0%) | 0 (0.0%) |
| 75 Years and over | 0 (0.0%) | 0 (0.0%) |
Disability Class: Cognitive Difficulty
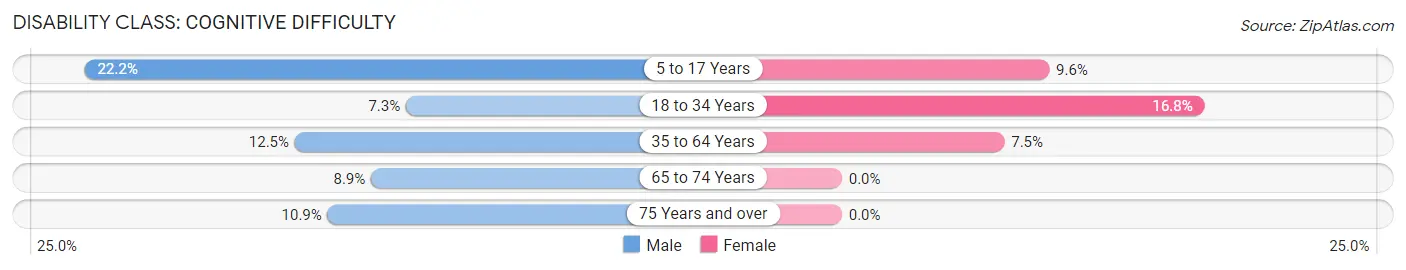
| Age Bracket | Male | Female |
| 5 to 17 Years | 64 (22.2%) | 28 (9.6%) |
| 18 to 34 Years | 33 (7.3%) | 69 (16.8%) |
| 35 to 64 Years | 84 (12.5%) | 61 (7.5%) |
| 65 to 74 Years | 24 (8.9%) | 0 (0.0%) |
| 75 Years and over | 7 (10.9%) | 0 (0.0%) |
Disability Class: Ambulatory Difficulty
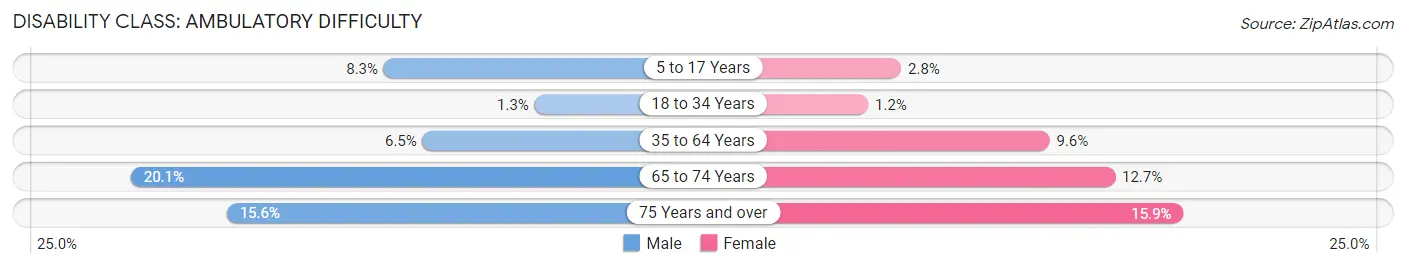
| Age Bracket | Male | Female |
| 5 to 17 Years | 24 (8.3%) | 8 (2.8%) |
| 18 to 34 Years | 6 (1.3%) | 5 (1.2%) |
| 35 to 64 Years | 44 (6.5%) | 78 (9.6%) |
| 65 to 74 Years | 54 (20.1%) | 27 (12.7%) |
| 75 Years and over | 10 (15.6%) | 13 (15.9%) |
Disability Class: Self-Care Difficulty
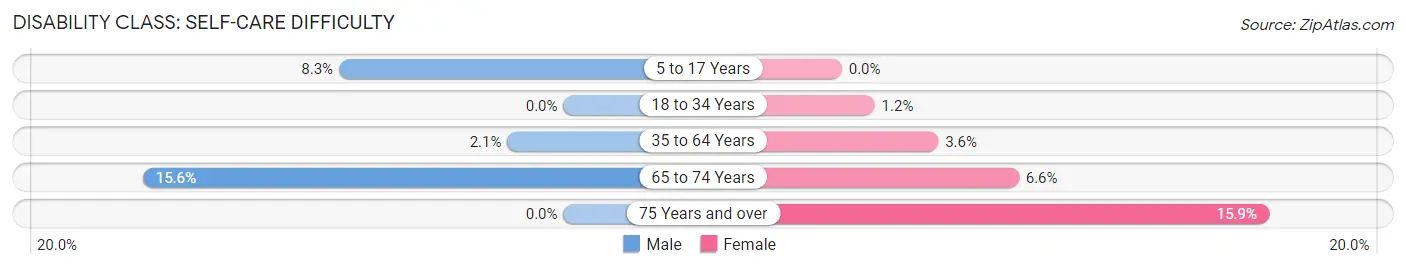
| Age Bracket | Male | Female |
| 5 to 17 Years | 24 (8.3%) | 0 (0.0%) |
| 18 to 34 Years | 0 (0.0%) | 5 (1.2%) |
| 35 to 64 Years | 14 (2.1%) | 29 (3.6%) |
| 65 to 74 Years | 42 (15.6%) | 14 (6.6%) |
| 75 Years and over | 0 (0.0%) | 13 (15.9%) |
Technology Access in Orange
Computing Device Access in Orange
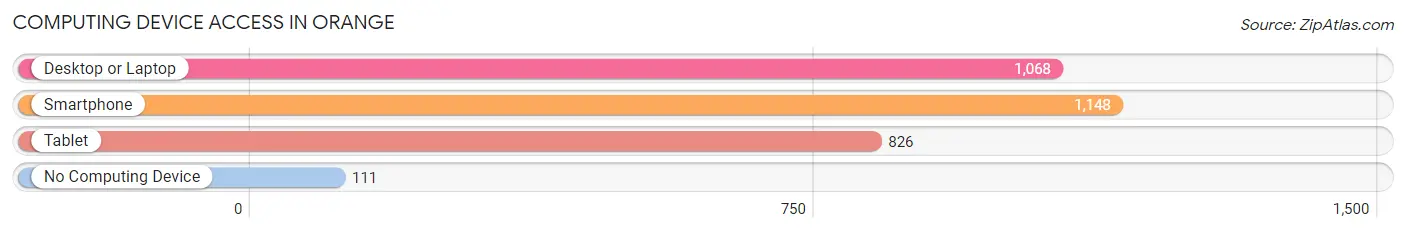
| Device Type | # Households | % Households |
| Desktop or Laptop | 1,068 | 72.9% |
| Smartphone | 1,148 | 78.4% |
| Tablet | 826 | 56.4% |
| No Computing Device | 111 | 7.6% |
| Total | 1,465 | 100.0% |
Internet Access in Orange
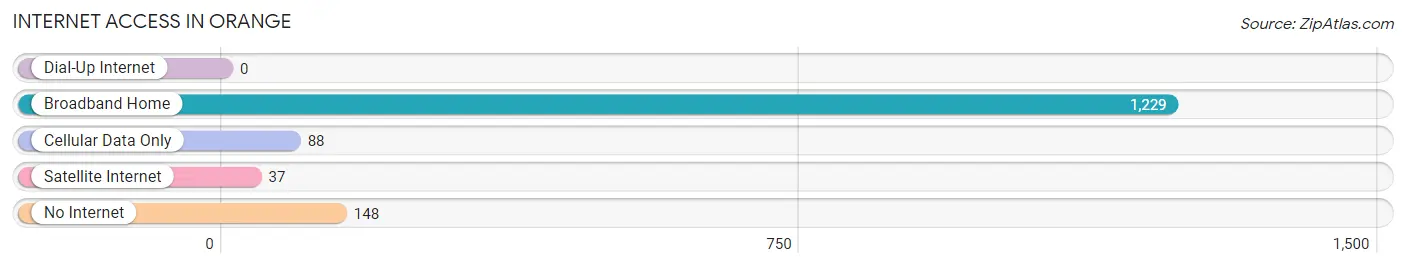
| Internet Type | # Households | % Households |
| Dial-Up Internet | 0 | 0.0% |
| Broadband Home | 1,229 | 83.9% |
| Cellular Data Only | 88 | 6.0% |
| Satellite Internet | 37 | 2.5% |
| No Internet | 148 | 10.1% |
| Total | 1,465 | 100.0% |
Orange Summary
Orange, Massachusetts is a small town located in the north-central part of the state, about 40 miles northwest of Boston. It is part of the Franklin County region and is bordered by the towns of Athol, Royalston, Warwick, and Erving. The town has a population of about 8,000 people and covers an area of about 24 square miles.
History
The area that is now Orange was originally inhabited by the Nipmuc tribe, who called the area Quabaug, meaning “place of many rocks”. The first European settlers arrived in the area in 1746, and the town was officially incorporated in 1783. The town was named after William of Orange, the Prince of Orange and the King of England at the time.
In the 19th century, Orange was an agricultural community, with many farms producing dairy, apples, and other crops. The town also had several mills, including a grist mill, a saw mill, and a paper mill. The town was also home to several factories, including a shoe factory, a woolen mill, and a paper mill.
Geography
Orange is located in north-central Massachusetts, about 40 miles northwest of Boston. The town is bordered by the towns of Athol, Royalston, Warwick, and Erving. The town is located in the Connecticut River Valley, and is surrounded by hills and mountains. The highest point in the town is the summit of Mount Toby, which is 1,092 feet above sea level.
The town is drained by several rivers, including the Millers River, the Quinebaug River, and the Ware River. The town is also home to several ponds, including Lake Mattawa, Lake Rohunta, and Lake Wyola.
Economy
Orange is a rural town, and the economy is largely based on agriculture and tourism. The town is home to several farms, which produce dairy, apples, and other crops. The town is also home to several small businesses, including restaurants, retail stores, and service providers.
The town is also home to several manufacturing companies, including a paper mill, a shoe factory, and a woolen mill. The town is also home to several technology companies, including a software development company and a medical device manufacturer.
Demographics
As of the 2010 census, the population of Orange was 8,000 people. The racial makeup of the town was 94.3% White, 1.2% African American, 0.3% Native American, 0.7% Asian, 0.1% Pacific Islander, 1.2% from other races, and 2.3% from two or more races. Hispanic or Latino of any race were 2.7% of the population.
The median household income in Orange was $60,000, and the median family income was $68,000. The per capita income was $25,000. About 8.5% of the population was below the poverty line.
Common Questions
What is Per Capita Income in Orange?
Per Capita income in Orange is $28,526.
What is the Median Family Income in Orange?
Median Family Income in Orange is $71,985.
What is the Median Household income in Orange?
Median Household Income in Orange is $55,558.
What is Income or Wage Gap in Orange?
Income or Wage Gap in Orange is 3.3%.
Women in Orange earn 96.7 cents for every dollar earned by a man.
What is Family Income Deficit in Orange?
Family Income Deficit in Orange is $11,452.
Families that are below poverty line in Orange earn $11,452 less on average than the poverty threshold level.
What is Inequality or Gini Index in Orange?
Inequality or Gini Index in Orange is 0.38.
What is the Total Population of Orange?
Total Population of Orange is 3,731.
What is the Total Male Population of Orange?
Total Male Population of Orange is 1,830.
What is the Total Female Population of Orange?
Total Female Population of Orange is 1,901.
What is the Ratio of Males per 100 Females in Orange?
There are 96.27 Males per 100 Females in Orange.
What is the Ratio of Females per 100 Males in Orange?
There are 103.88 Females per 100 Males in Orange.
What is the Median Population Age in Orange?
Median Population Age in Orange is 41.2 Years.
What is the Average Family Size in Orange
Average Family Size in Orange is 3.3 People.
What is the Average Household Size in Orange
Average Household Size in Orange is 2.5 People.
How Large is the Labor Force in Orange?
There are 1,828 People in the Labor Forcein in Orange.
What is the Percentage of People in the Labor Force in Orange?
59.4% of People are in the Labor Force in Orange.
What is the Unemployment Rate in Orange?
Unemployment Rate in Orange is 13.0%.