Cities with the Highest Percentage of Celtic Population in Massachusetts

RELATED REPORTS & OPTIONS

Celtic
Population
Families and Households
Female Fertility
Female Fertility (Unmarried)
Race (Community Size)
Race (Percentage)
Ancestry (Community Size)
AfghanAfricanAlaska NativeAlaskan AthabascanAlbanianAleutAlsatianAmericanApacheArabArapahoArgentineanArmenianAssyrian / Chaldean / SyriacAustralianAustrianBahamianBangladeshiBarbadianBasqueBelgianBelizeanBermudanBhutaneseBlackfeetBolivianBrazilianBritishBritish West IndianBulgarianBurmeseCajunCambodianCanadianCape VerdeanCarpatho RusynCelticCentral AmericanCentral American IndianCherokeeCheyenneChickasawChileanChineseChippewaChoctawColombianColvilleComancheCosta RicanCreeCreekCroatianCrowCubanCypriotCzechCzechoslovakianDanishDelawareDominicanDutchDutch West IndianEastern EuropeanEcuadorianEgyptianEnglishEstonianEthiopianEuropeanFijianFilipinoFinnishFrenchFrench American IndianFrench CanadianGermanGerman RussianGhanaianGreekGuamanian / ChamorroGuatemalanGuyaneseHaitianHmongHonduranHopiHoumaHungarianIcelanderIndian (Asian)IndonesianInupiatIranianIraqiIrishIroquoisIsraeliItalianJamaicanJapaneseJordanianKenyanKiowaKoreanLaotianLatvianLebaneseLiberianLithuanianLumbeeLuxembourgerMacedonianMalaysianMalteseMarshalleseMenomineeMexicanMexican American IndianMongolianMoroccanNative HawaiianNavajoNepaleseNew ZealanderNicaraguanNigerianNorthern EuropeanNorwegianOkinawanOsageOttawaPaiutePakistaniPalestinianPanamanianParaguayanPennsylvania GermanPeruvianPimaPolishPortuguesePotawatomiPuebloPuerto RicanPuget Sound SalishRomanianRussianSalvadoranSamoanScandinavianScotch-IrishScottishSeminoleSenegaleseSerbianShoshoneSierra LeoneanSiouxSlavicSlovakSloveneSomaliSouth AfricanSouth AmericanSouth American IndianSoviet UnionSpaniardSpanishSpanish AmericanSpanish American IndianSri LankanSubsaharan AfricanSudaneseSwedishSwissSyrianTaiwaneseThaiTlingit-HaidaTohono O'OdhamTonganTrinidadian and TobagonianTsimshianTurkishU.S. Virgin IslanderUgandanUkrainianUruguayanUteVenezuelanVietnameseWelshWest IndianYakamaYaquiYugoslavianYumanYup'ikZimbabwean
Ancestry (Percentage)
AfghanAfricanAlaska NativeAlaskan AthabascanAlbanianAleutAlsatianAmericanApacheArabArapahoArgentineanArmenianAssyrian / Chaldean / SyriacAustralianAustrianBahamianBangladeshiBarbadianBasqueBelgianBelizeanBermudanBhutaneseBlackfeetBolivianBrazilianBritishBritish West IndianBulgarianBurmeseCajunCambodianCanadianCape VerdeanCarpatho RusynCelticCentral AmericanCentral American IndianCherokeeCheyenneChickasawChileanChineseChippewaChoctawColombianColvilleComancheCosta RicanCreeCreekCroatianCrowCubanCypriotCzechCzechoslovakianDanishDelawareDominicanDutchDutch West IndianEastern EuropeanEcuadorianEgyptianEnglishEstonianEthiopianEuropeanFijianFilipinoFinnishFrenchFrench American IndianFrench CanadianGermanGerman RussianGhanaianGreekGuamanian / ChamorroGuatemalanGuyaneseHaitianHmongHonduranHopiHoumaHungarianIcelanderIndian (Asian)IndonesianInupiatIranianIraqiIrishIroquoisIsraeliItalianJamaicanJapaneseJordanianKenyanKiowaKoreanLaotianLatvianLebaneseLiberianLithuanianLumbeeLuxembourgerMacedonianMalaysianMalteseMarshalleseMenomineeMexicanMexican American IndianMongolianMoroccanNative HawaiianNavajoNepaleseNew ZealanderNicaraguanNigerianNorthern EuropeanNorwegianOkinawanOsageOttawaPaiutePakistaniPalestinianPanamanianParaguayanPennsylvania GermanPeruvianPimaPolishPortuguesePotawatomiPuebloPuerto RicanPuget Sound SalishRomanianRussianSalvadoranSamoanScandinavianScotch-IrishScottishSeminoleSenegaleseSerbianShoshoneSierra LeoneanSiouxSlavicSlovakSloveneSomaliSouth AfricanSouth AmericanSouth American IndianSoviet UnionSpaniardSpanishSpanish AmericanSpanish American IndianSri LankanSubsaharan AfricanSudaneseSwedishSwissSyrianTaiwaneseThaiTlingit-HaidaTohono O'OdhamTonganTrinidadian and TobagonianTsimshianTurkishU.S. Virgin IslanderUgandanUkrainianUruguayanUteVenezuelanVietnameseWelshWest IndianYakamaYaquiYugoslavianYumanYup'ikZimbabwean
Immigrant Origin (Total)
AfghanistanAfricaAlbaniaArgentinaArmeniaAsiaAustraliaAustriaAzoresBahamasBangladeshBarbadosBelarusBelgiumBelizeBoliviaBosnia and HerzegovinaBrazilBulgariaBurma / MyanmarCabo VerdeCambodiaCameroonCanadaCaribbeanCentral AmericaChileChinaColombiaCongoCosta RicaCroatiaCubaCzechoslovakiaDenmarkDominicaDominican RepublicEastern AfricaEastern AsiaEastern EuropeEcuadorEgyptEl SalvadorEnglandEritreaEthiopiaEuropeFijiFranceGermanyGhanaGreeceGrenadaGuatemalaGuyanaHaitiHondurasHong KongHungaryIndiaIndonesiaIranIraqIrelandIsraelItalyJamaicaJapanJordanKazakhstanKenyaKoreaKuwaitLaosLatin AmericaLatviaLebanonLiberiaLithuaniaMalaysiaMexicoMicronesiaMiddle AfricaMoldovaMoroccoNepalNetherlandsNicaraguaNigeriaNorth MacedoniaNorthern AfricaNorthern EuropeNorwayOceaniaPakistanPanamaPeruPhilippinesPolandPortugalRomaniaRussiaSaudi ArabiaScotlandSenegalSerbiaSierra LeoneSingaporeSomaliaSouth AfricaSouth AmericaSouth Central AsiaSouth Eastern AsiaSouthern EuropeSpainSri LankaSt. Vincent and the GrenadinesSudanSwedenSwitzerlandSyriaTaiwanThailandTrinidad and TobagoTurkeyUgandaUkraineUruguayUzbekistanVenezuelaVietnamWest IndiesWestern AfricaWestern AsiaWestern EuropeYemenZaireZimbabwe
Immigrant Origin (Percentage)
AfghanistanAfricaAlbaniaArgentinaArmeniaAsiaAustraliaAustriaAzoresBahamasBangladeshBarbadosBelarusBelgiumBelizeBoliviaBosnia and HerzegovinaBrazilBulgariaBurma / MyanmarCabo VerdeCambodiaCameroonCanadaCaribbeanCentral AmericaChileChinaColombiaCongoCosta RicaCroatiaCubaCzechoslovakiaDenmarkDominicaDominican RepublicEastern AfricaEastern AsiaEastern EuropeEcuadorEgyptEl SalvadorEnglandEritreaEthiopiaEuropeFijiFranceGermanyGhanaGreeceGrenadaGuatemalaGuyanaHaitiHondurasHong KongHungaryIndiaIndonesiaIranIraqIrelandIsraelItalyJamaicaJapanJordanKazakhstanKenyaKoreaKuwaitLaosLatin AmericaLatviaLebanonLiberiaLithuaniaMalaysiaMexicoMicronesiaMiddle AfricaMoldovaMoroccoNepalNetherlandsNicaraguaNigeriaNorth MacedoniaNorthern AfricaNorthern EuropeNorwayOceaniaPakistanPanamaPeruPhilippinesPolandPortugalRomaniaRussiaSaudi ArabiaScotlandSenegalSerbiaSierra LeoneSingaporeSomaliaSouth AfricaSouth AmericaSouth Central AsiaSouth Eastern AsiaSouthern EuropeSpainSri LankaSt. Vincent and the GrenadinesSudanSwedenSwitzerlandSyriaTaiwanThailandTrinidad and TobagoTurkeyUgandaUkraineUruguayUzbekistanVenezuelaVietnamWest IndiesWestern AfricaWestern AsiaWestern EuropeYemenZaireZimbabwe
Income
Income (Families)
Income (Households)
Poverty
Poverty (Families)
Unemployment
Employment Occupations
Employment Industries
Employer Class
Commute Time
Commute Means
School Enrollment
Education by Degree Field
Occupancy
Finances
Physical Characteristics
Massachusetts
Compare Cities
Comparison Subject

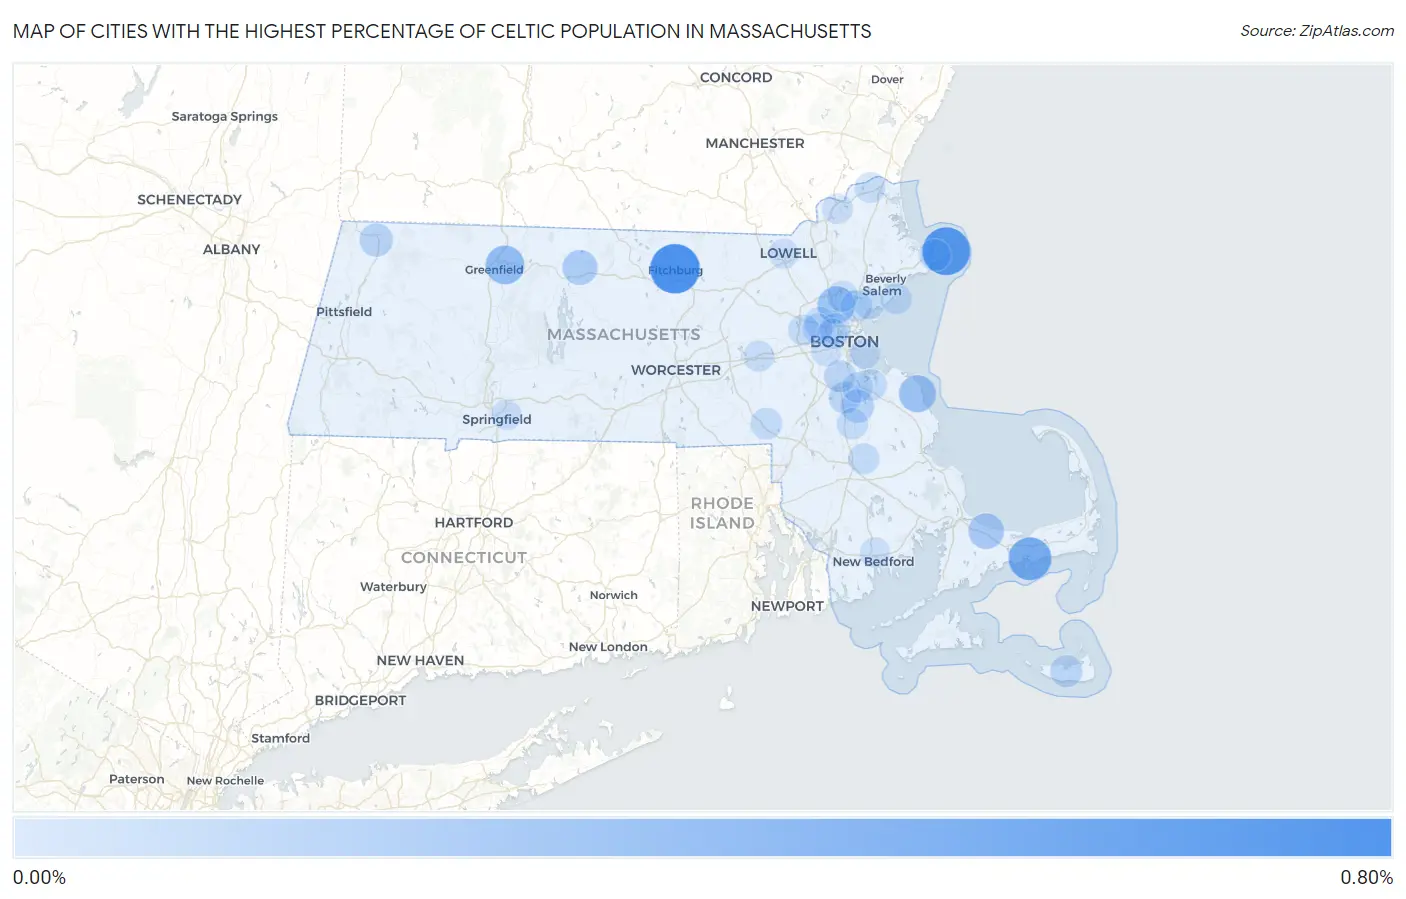
Map of Cities with the Highest Percentage of Celtic Population in Massachusetts

0.00%
0.80%
Cities with the Highest Percentage of Celtic Population in Massachusetts Map

Cities with the Highest Percentage of Celtic Population in Massachusetts

City Celtic vs State vs National
1.Fitchburg0.78%0.020%(+0.764)#10.015%(+0.769)#128
2.Rockport0.71%0.020%(+0.689)#20.015%(+0.693)#143
3.Cedar Crest0.69%0.020%(+0.671)#30.015%(+0.676)#148
4.West Yarmouth0.51%0.020%(+0.489)#40.015%(+0.494)#208
5.Turners Falls0.34%0.020%(+0.319)#50.015%(+0.324)#291
6.Stoneham0.28%0.020%(+0.263)#60.015%(+0.268)#333
7.Scituate0.28%0.020%(+0.256)#70.015%(+0.261)#344
8.East Sandwich0.21%0.020%(+0.192)#80.015%(+0.197)#452
9.Athol0.19%0.020%(+0.166)#90.015%(+0.171)#501
10.North Adams0.12%0.020%(+0.104)#100.015%(+0.109)#639
11.Holbrook0.11%0.020%(+0.095)#110.015%(+0.100)#673
12.Greenfield0.10%0.020%(+0.082)#120.015%(+0.087)#711
13.Nantucket0.076%0.020%(+0.057)#130.015%(+0.062)#803
14.Randolph Town0.075%0.020%(+0.055)#140.015%(+0.060)#811
15.Milton0.074%0.020%(+0.054)#150.015%(+0.059)#816
16.Gloucester0.067%0.020%(+0.047)#160.015%(+0.052)#848
17.Franklin Town0.055%0.020%(+0.035)#170.015%(+0.040)#905
18.Arlington0.050%0.020%(+0.031)#180.015%(+0.035)#929
19.Saugus0.049%0.020%(+0.029)#190.015%(+0.034)#936
20.Weymouth Town0.047%0.020%(+0.028)#200.015%(+0.032)#950
21.Marblehead0.044%0.020%(+0.025)#210.015%(+0.030)#966
22.Somerville0.040%0.020%(+0.020)#220.015%(+0.025)#997
23.Lynn0.039%0.020%(+0.019)#230.015%(+0.024)#1,004
24.Brockton0.038%0.020%(+0.019)#240.015%(+0.024)#1,013
25.Waltham0.036%0.020%(+0.016)#250.015%(+0.021)#1,033
26.Bridgewater Town0.035%0.020%(+0.015)#260.015%(+0.020)#1,041
27.Wakefield0.033%0.020%(+0.014)#270.015%(+0.019)#1,062
28.Framingham0.032%0.020%(+0.012)#280.015%(+0.017)#1,073
29.Braintree Town0.026%0.020%(+0.006)#290.015%(+0.011)#1,139
30.Amesbury Town0.023%0.020%(+0.004)#300.015%(+0.009)#1,171
31.Haverhill0.019%0.020%(-0.000)#310.015%(+0.005)#1,217
32.Belmont0.019%0.020%(-0.001)#320.015%(+0.004)#1,227
33.Boston0.011%0.020%(-0.009)#330.015%(-0.004)#1,337
34.Springfield0.0090%0.020%(-0.011)#340.015%(-0.006)#1,364
35.Brookline0.0080%0.020%(-0.012)#350.015%(-0.007)#1,377
36.Cambridge0.0068%0.020%(-0.013)#360.015%(-0.008)#1,401
37.New Bedford0.0050%0.020%(-0.015)#370.015%(-0.010)#1,432
38.Lowell0.0017%0.020%(-0.018)#380.015%(-0.013)#1,467

Common Questions

What are the Top 10 Cities with the Highest Percentage of Celtic Population in Massachusetts?
Top 10 Cities with the Highest Percentage of Celtic Population in Massachusetts are:
#1
0.78%
#2
0.71%
#3
0.51%
#4
0.34%
#5
0.28%
#6
0.28%
#7
0.21%
#8
0.19%
#9
0.12%
#10
0.11%
What city has the Highest Percentage of Celtic Population in Massachusetts?
Fitchburg has the Highest Percentage of Celtic Population in Massachusetts with 0.78%.
What is the Percentage of Celtic Population in the State of Massachusetts?
Percentage of Celtic Population in Massachusetts is 0.020%.
What is the Percentage of Celtic Population in the United States?
Percentage of Celtic Population in the United States is 0.015%.