Cities with the Highest Percentage of Immigrants from Haiti in Massachusetts
RELATED REPORTS & OPTIONS
Haiti
Massachusetts
Compare Cities
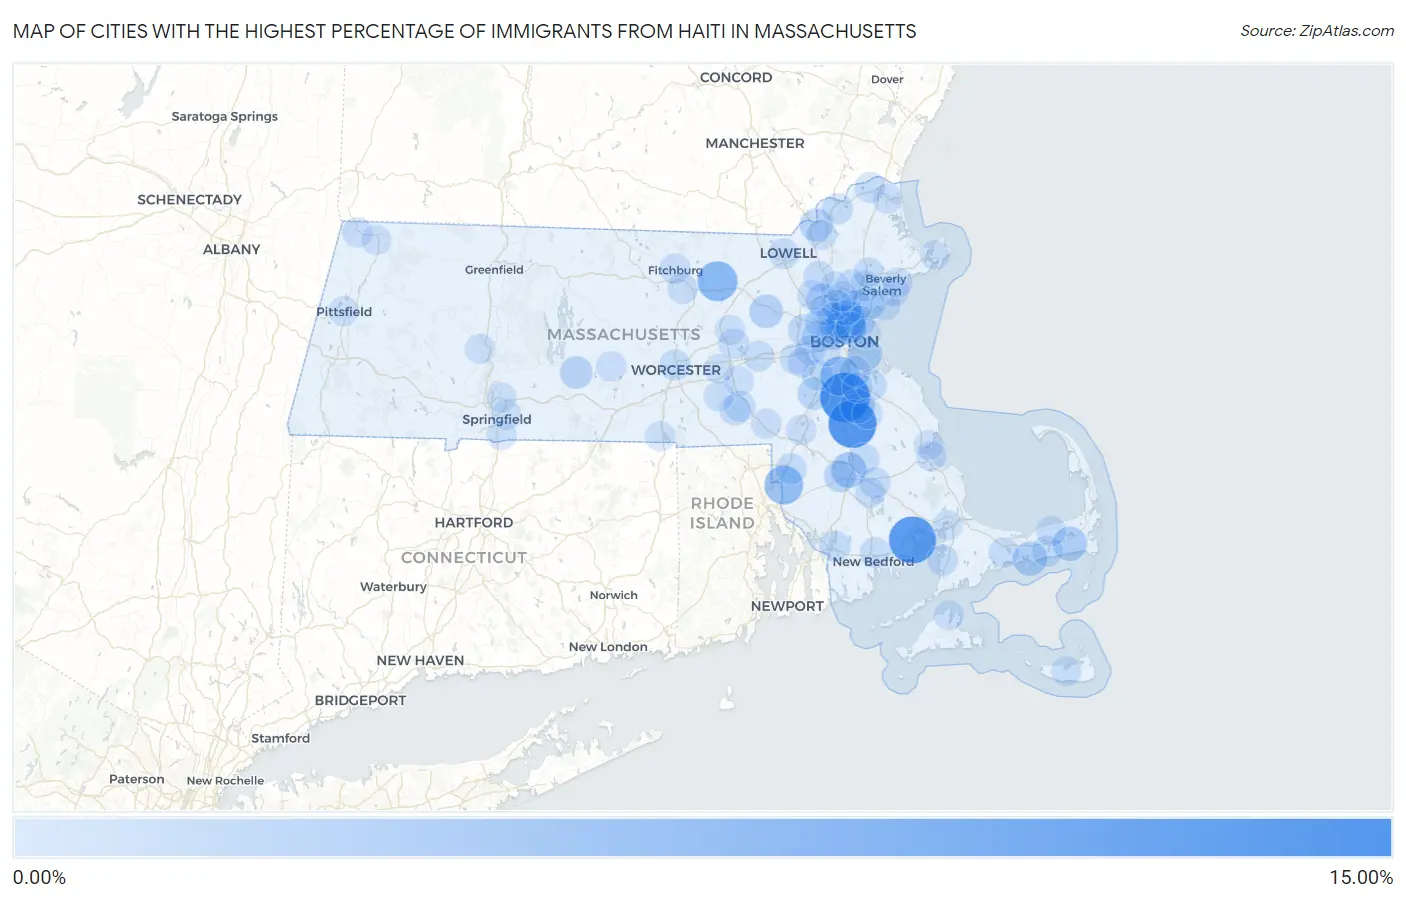
Map of Cities with the Highest Percentage of Immigrants from Haiti in Massachusetts
0.00%
15.00%
Cities with the Highest Percentage of Immigrants from Haiti in Massachusetts
| City | Haiti | vs State | vs National | |
| 1. | Randolph Town | 11.64% | 0.87%(+10.8)#8 | 0.21%(+11.4)#1,191 |
| 2. | Brockton | 10.78% | 0.87%(+9.91)#12 | 0.21%(+10.6)#1,547 |
| 3. | Marion Center | 10.20% | 0.87%(+9.34)#17 | 0.21%(+9.99)#2,394 |
| 4. | Devens | 5.73% | 0.87%(+4.86)#18 | 0.21%(+5.52)#2,627 |
| 5. | Milton | 5.42% | 0.87%(+4.55)#28 | 0.21%(+5.21)#3,156 |
| 6. | Everett | 5.26% | 0.87%(+4.39)#29 | 0.21%(+5.05)#3,157 |
| 7. | North Seekonk | 5.03% | 0.87%(+4.16)#50 | 0.21%(+4.82)#4,781 |
| 8. | Malden | 4.48% | 0.87%(+3.61)#51 | 0.21%(+4.27)#4,782 |
| 9. | Raynham Center | 3.04% | 0.87%(+2.17)#52 | 0.21%(+2.83)#4,990 |
| 10. | Holbrook | 2.55% | 0.87%(+1.68)#53 | 0.21%(+2.34)#4,991 |
| 11. | Harwich Center | 2.54% | 0.87%(+1.67)#90 | 0.21%(+2.33)#7,316 |
| 12. | West Yarmouth | 2.44% | 0.87%(+1.58)#91 | 0.21%(+2.23)#7,317 |
| 13. | Boston | 2.42% | 0.87%(+1.55)#92 | 0.21%(+2.21)#7,318 |
| 14. | Medford | 2.32% | 0.87%(+1.46)#93 | 0.21%(+2.11)#7,319 |
| 15. | West Concord | 2.02% | 0.87%(+1.15)#94 | 0.21%(+1.81)#7,320 |
| 16. | Methuen Town | 1.69% | 0.87%(+0.820)#95 | 0.21%(+1.48)#7,321 |
| 17. | Ware | 1.52% | 0.87%(+0.654)#103 | 0.21%(+1.31)#7,962 |
| 18. | Woburn | 1.51% | 0.87%(+0.642)#104 | 0.21%(+1.30)#7,963 |
| 19. | Norwood | 1.44% | 0.87%(+0.574)#105 | 0.21%(+1.23)#7,964 |
| 20. | Lynn | 1.31% | 0.87%(+0.443)#106 | 0.21%(+1.10)#7,965 |
| 21. | Cambridge | 1.19% | 0.87%(+0.323)#107 | 0.21%(+0.979)#7,966 |
| 22. | Taunton | 1.18% | 0.87%(+0.314)#108 | 0.21%(+0.970)#7,967 |
| 23. | Waltham | 0.97% | 0.87%(+0.105)#109 | 0.21%(+0.761)#7,968 |
| 24. | Saugus | 0.88% | 0.87%(+0.013)#110 | 0.21%(+0.669)#7,969 |
| 25. | Weymouth Town | 0.77% | 0.87%(-0.096)#111 | 0.21%(+0.560)#7,970 |
| 26. | Dedham | 0.77% | 0.87%(-0.098)#112 | 0.21%(+0.558)#7,971 |
| 27. | Peabody | 0.73% | 0.87%(-0.133)#113 | 0.21%(+0.523)#7,972 |
| 28. | Somerville | 0.70% | 0.87%(-0.164)#114 | 0.21%(+0.491)#7,973 |
| 29. | Watertown Town | 0.66% | 0.87%(-0.203)#115 | 0.21%(+0.453)#7,974 |
| 30. | North Falmouth | 0.65% | 0.87%(-0.218)#182 | 0.21%(+0.437)#14,323 |
| 31. | Bridgewater Town | 0.62% | 0.87%(-0.241)#183 | 0.21%(+0.414)#14,324 |
| 32. | West Dennis | 0.59% | 0.87%(-0.280)#184 | 0.21%(+0.376)#14,325 |
| 33. | Revere | 0.58% | 0.87%(-0.281)#185 | 0.21%(+0.375)#14,326 |
| 34. | Fall River | 0.57% | 0.87%(-0.293)#186 | 0.21%(+0.363)#14,327 |
| 35. | Chelsea | 0.55% | 0.87%(-0.319)#187 | 0.21%(+0.337)#14,328 |
| 36. | Melrose | 0.54% | 0.87%(-0.326)#188 | 0.21%(+0.330)#14,329 |
| 37. | Milford | 0.54% | 0.87%(-0.328)#189 | 0.21%(+0.327)#14,330 |
| 38. | Worcester | 0.53% | 0.87%(-0.334)#190 | 0.21%(+0.322)#14,331 |
| 39. | Attleboro | 0.51% | 0.87%(-0.354)#191 | 0.21%(+0.301)#14,332 |
| 40. | Haverhill | 0.50% | 0.87%(-0.366)#192 | 0.21%(+0.290)#14,333 |
| 41. | Middleborough Center | 0.49% | 0.87%(-0.379)#193 | 0.21%(+0.277)#14,334 |
| 42. | Lynnfield | 0.44% | 0.87%(-0.424)#194 | 0.21%(+0.231)#14,335 |
| 43. | Quincy | 0.43% | 0.87%(-0.439)#195 | 0.21%(+0.216)#14,336 |
| 44. | Swampscott | 0.42% | 0.87%(-0.442)#196 | 0.21%(+0.213)#14,337 |
| 45. | Framingham | 0.42% | 0.87%(-0.447)#197 | 0.21%(+0.208)#14,338 |
| 46. | Hopedale | 0.41% | 0.87%(-0.454)#198 | 0.21%(+0.201)#14,339 |
| 47. | Wellesley | 0.41% | 0.87%(-0.457)#199 | 0.21%(+0.199)#14,340 |
| 48. | New Bedford | 0.38% | 0.87%(-0.481)#200 | 0.21%(+0.175)#14,341 |
| 49. | Wilmington | 0.37% | 0.87%(-0.499)#201 | 0.21%(+0.157)#14,342 |
| 50. | Amesbury Town | 0.34% | 0.87%(-0.530)#202 | 0.21%(+0.126)#14,343 |
| 51. | Barnstable Town | 0.34% | 0.87%(-0.530)#203 | 0.21%(+0.125)#14,344 |
| 52. | Lowell | 0.33% | 0.87%(-0.532)#204 | 0.21%(+0.123)#14,345 |
| 53. | Winchester | 0.33% | 0.87%(-0.536)#205 | 0.21%(+0.119)#14,346 |
| 54. | Leominster | 0.33% | 0.87%(-0.540)#206 | 0.21%(+0.116)#14,347 |
| 55. | Danvers | 0.31% | 0.87%(-0.557)#207 | 0.21%(+0.098)#14,348 |
| 56. | Fitchburg | 0.29% | 0.87%(-0.577)#208 | 0.21%(+0.079)#14,349 |
| 57. | Marlborough | 0.29% | 0.87%(-0.578)#209 | 0.21%(+0.078)#14,350 |
| 58. | Foxborough | 0.29% | 0.87%(-0.580)#210 | 0.21%(+0.075)#14,351 |
| 59. | Salem | 0.27% | 0.87%(-0.594)#211 | 0.21%(+0.062)#14,352 |
| 60. | North Brookfield | 0.25% | 0.87%(-0.619)#212 | 0.21%(+0.036)#15,357 |
| 61. | Braintree Town | 0.24% | 0.87%(-0.625)#213 | 0.21%(+0.030)#15,358 |
| 62. | East Dennis | 0.22% | 0.87%(-0.650)#214 | 0.21%(+0.006)#15,757 |
| 63. | Stoneham | 0.20% | 0.87%(-0.661)#215 | 0.21%(-0.005)#15,758 |
| 64. | Arlington | 0.20% | 0.87%(-0.663)#216 | 0.21%(-0.007)#15,759 |
| 65. | North Lakeville | 0.19% | 0.87%(-0.673)#217 | 0.21%(-0.017)#15,760 |
| 66. | North Attleborough | 0.19% | 0.87%(-0.677)#218 | 0.21%(-0.021)#15,761 |
| 67. | Franklin Town | 0.18% | 0.87%(-0.682)#219 | 0.21%(-0.027)#15,762 |
| 68. | Beverly | 0.14% | 0.87%(-0.721)#220 | 0.21%(-0.066)#15,763 |
| 69. | Burlington | 0.14% | 0.87%(-0.728)#221 | 0.21%(-0.072)#15,764 |
| 70. | North Plymouth | 0.14% | 0.87%(-0.729)#222 | 0.21%(-0.074)#15,765 |
| 71. | Nantucket | 0.13% | 0.87%(-0.732)#223 | 0.21%(-0.076)#15,766 |
| 72. | Newton | 0.13% | 0.87%(-0.732)#224 | 0.21%(-0.076)#15,767 |
| 73. | Lawrence | 0.13% | 0.87%(-0.738)#225 | 0.21%(-0.083)#15,768 |
| 74. | Needham | 0.12% | 0.87%(-0.743)#226 | 0.21%(-0.088)#15,769 |
| 75. | Upton | 0.12% | 0.87%(-0.750)#227 | 0.21%(-0.094)#15,770 |
| 76. | Williamstown | 0.11% | 0.87%(-0.754)#228 | 0.21%(-0.099)#15,771 |
| 77. | Abington | 0.11% | 0.87%(-0.759)#229 | 0.21%(-0.104)#15,772 |
| 78. | Brookline | 0.10% | 0.87%(-0.762)#230 | 0.21%(-0.106)#15,773 |
| 79. | North Adams | 0.093% | 0.87%(-0.773)#231 | 0.21%(-0.117)#15,774 |
| 80. | Hopkinton | 0.091% | 0.87%(-0.774)#232 | 0.21%(-0.119)#15,775 |
| 81. | Vineyard Haven | 0.084% | 0.87%(-0.781)#233 | 0.21%(-0.125)#15,776 |
| 82. | Longmeadow | 0.076% | 0.87%(-0.789)#234 | 0.21%(-0.134)#15,777 |
| 83. | Webster | 0.073% | 0.87%(-0.792)#235 | 0.21%(-0.136)#15,778 |
| 84. | Springfield | 0.073% | 0.87%(-0.793)#236 | 0.21%(-0.137)#15,779 |
| 85. | Gloucester | 0.064% | 0.87%(-0.802)#237 | 0.21%(-0.146)#15,780 |
| 86. | Winthrop Town | 0.063% | 0.87%(-0.802)#238 | 0.21%(-0.147)#15,781 |
| 87. | Wakefield | 0.055% | 0.87%(-0.810)#239 | 0.21%(-0.154)#15,782 |
| 88. | Northampton | 0.053% | 0.87%(-0.812)#240 | 0.21%(-0.157)#15,783 |
| 89. | Westborough | 0.046% | 0.87%(-0.820)#241 | 0.21%(-0.164)#15,784 |
| 90. | Buzzards Bay | 0.033% | 0.87%(-0.832)#242 | 0.21%(-0.176)#15,785 |
| 91. | Chicopee | 0.032% | 0.87%(-0.833)#243 | 0.21%(-0.177)#15,786 |
| 92. | South Duxbury | 0.029% | 0.87%(-0.836)#244 | 0.21%(-0.180)#15,787 |
| 93. | Hudson | 0.026% | 0.87%(-0.839)#245 | 0.21%(-0.184)#15,788 |
| 94. | Newburyport | 0.022% | 0.87%(-0.843)#246 | 0.21%(-0.188)#15,789 |
| 95. | Amherst | 0.0060% | 0.87%(-0.859)#247 | 0.21%(-0.204)#15,790 |
| 96. | Reading | 0.0039% | 0.87%(-0.861)#248 | 0.21%(-0.206)#15,791 |
| 97. | Pittsfield | 0.0023% | 0.87%(-0.863)#249 | 0.21%(-0.207)#15,792 |
Common Questions
What are the Top 10 Cities with the Highest Percentage of Immigrants from Haiti in Massachusetts?
Top 10 Cities with the Highest Percentage of Immigrants from Haiti in Massachusetts are:
#1
11.64%
#2
10.78%
#3
10.20%
#4
5.73%
#5
5.42%
#6
5.26%
#7
5.03%
#8
4.48%
#9
3.04%
#10
2.55%
What city has the Highest Percentage of Immigrants from Haiti in Massachusetts?
Randolph Town has the Highest Percentage of Immigrants from Haiti in Massachusetts with 11.64%.
What is the Percentage of Immigrants from Haiti in the State of Massachusetts?
Percentage of Immigrants from Haiti in Massachusetts is 0.87%.
What is the Percentage of Immigrants from Haiti in the United States?
Percentage of Immigrants from Haiti in the United States is 0.21%.