Lynn, MA Map & Demographics
Lynn Map
Lynn Overview
$31,816
PER CAPITA INCOME
$81,359
AVG FAMILY INCOME
$70,046
AVG HOUSEHOLD INCOME
19.4%
WAGE / INCOME GAP [ % ]
80.6¢/ $1
WAGE / INCOME GAP [ $ ]
$11,912
FAMILY INCOME DEFICIT
0.45
INEQUALITY / GINI INDEX
100,653
TOTAL POPULATION
50,168
MALE POPULATION
50,485
FEMALE POPULATION
99.37
MALES / 100 FEMALES
100.63
FEMALES / 100 MALES
36.2
MEDIAN AGE
3.4
AVG FAMILY SIZE
2.8
AVG HOUSEHOLD SIZE
53,263
LABOR FORCE [ PEOPLE ]
66.8%
PERCENT IN LABOR FORCE
5.7%
UNEMPLOYMENT RATE
Income in Lynn
Income Overview in Lynn
Per Capita Income in Lynn is $31,816, while median incomes of families and households are $81,359 and $70,046 respectively.
| Characteristic | Number | Measure |
| Per Capita Income | 100,653 | $31,816 |
| Median Family Income | 23,435 | $81,359 |
| Mean Family Income | 23,435 | $100,287 |
| Median Household Income | 35,915 | $70,046 |
| Mean Household Income | 35,915 | $87,204 |
| Income Deficit | 23,435 | $11,912 |
| Wage / Income Gap (%) | 100,653 | 19.42% |
| Wage / Income Gap ($) | 100,653 | 80.58¢ per $1 |
| Gini / Inequality Index | 100,653 | 0.45 |
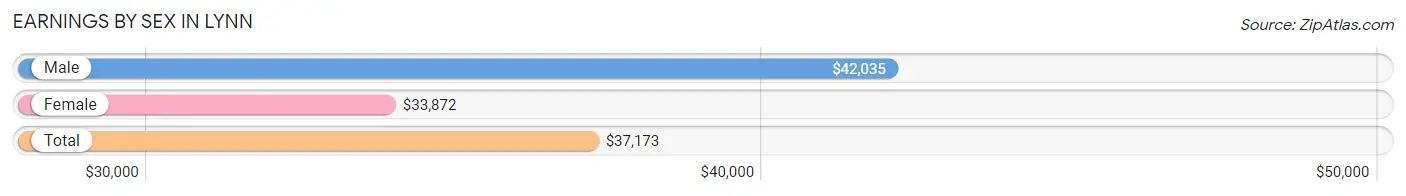
Earnings by Sex in Lynn
Average Earnings in Lynn are $37,173, $42,035 for men and $33,872 for women, a difference of 19.4%.
| Sex | Number | Average Earnings |
| Male | 29,396 (53.5%) | $42,035 |
| Female | 25,582 (46.5%) | $33,872 |
| Total | 54,978 (100.0%) | $37,173 |
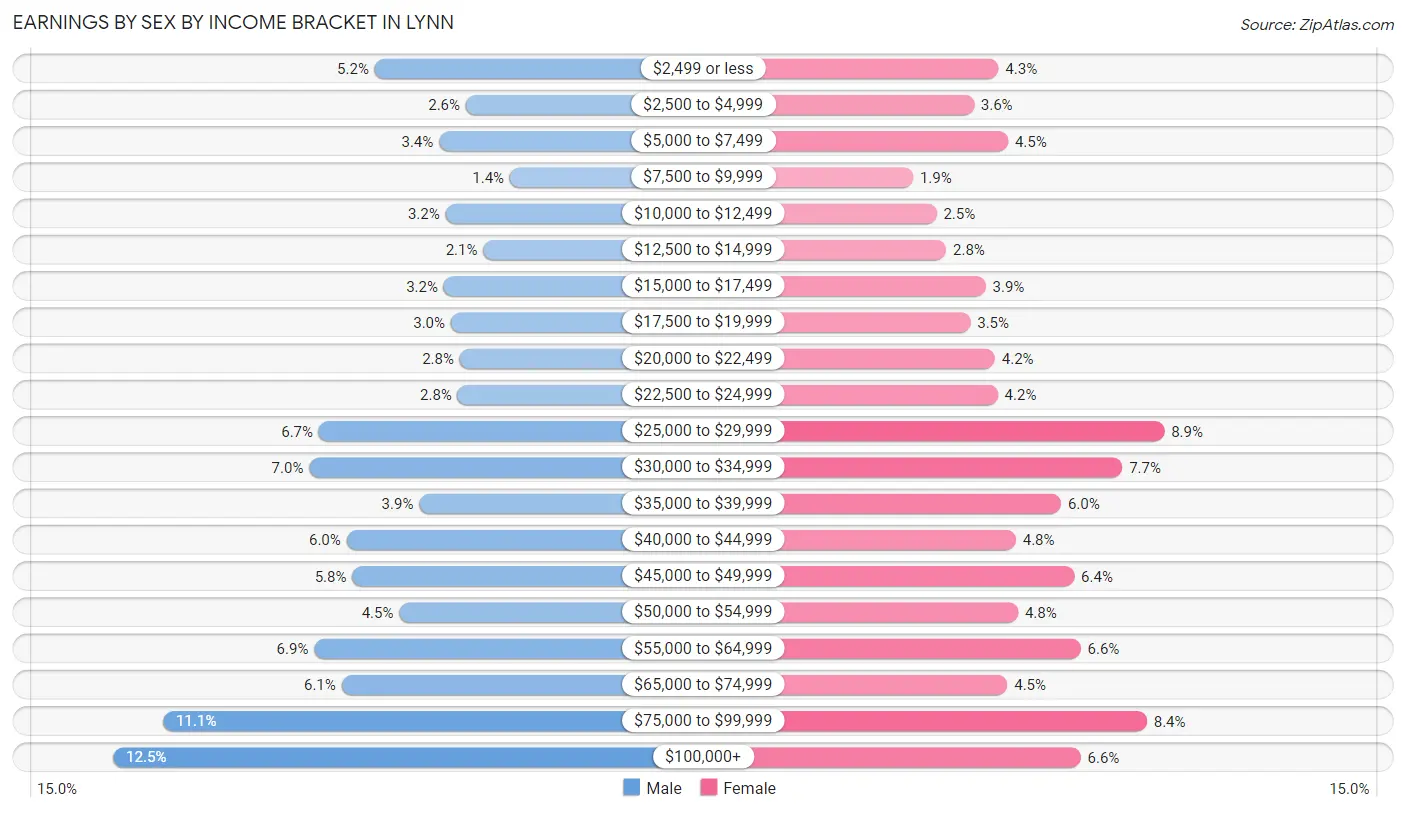
Earnings by Sex by Income Bracket in Lynn
The most common earnings brackets in Lynn are $100,000+ for men (3,676 | 12.5%) and $25,000 to $29,999 for women (2,283 | 8.9%).
| Income | Male | Female |
| $2,499 or less | 1,517 (5.2%) | 1,089 (4.3%) |
| $2,500 to $4,999 | 765 (2.6%) | 912 (3.6%) |
| $5,000 to $7,499 | 986 (3.4%) | 1,158 (4.5%) |
| $7,500 to $9,999 | 399 (1.4%) | 477 (1.9%) |
| $10,000 to $12,499 | 933 (3.2%) | 644 (2.5%) |
| $12,500 to $14,999 | 620 (2.1%) | 714 (2.8%) |
| $15,000 to $17,499 | 947 (3.2%) | 998 (3.9%) |
| $17,500 to $19,999 | 888 (3.0%) | 887 (3.5%) |
| $20,000 to $22,499 | 814 (2.8%) | 1,063 (4.2%) |
| $22,500 to $24,999 | 831 (2.8%) | 1,085 (4.2%) |
| $25,000 to $29,999 | 1,978 (6.7%) | 2,283 (8.9%) |
| $30,000 to $34,999 | 2,058 (7.0%) | 1,980 (7.7%) |
| $35,000 to $39,999 | 1,148 (3.9%) | 1,539 (6.0%) |
| $40,000 to $44,999 | 1,750 (5.9%) | 1,215 (4.8%) |
| $45,000 to $49,999 | 1,701 (5.8%) | 1,635 (6.4%) |
| $50,000 to $54,999 | 1,315 (4.5%) | 1,231 (4.8%) |
| $55,000 to $64,999 | 2,016 (6.9%) | 1,681 (6.6%) |
| $65,000 to $74,999 | 1,789 (6.1%) | 1,155 (4.5%) |
| $75,000 to $99,999 | 3,265 (11.1%) | 2,156 (8.4%) |
| $100,000+ | 3,676 (12.5%) | 1,680 (6.6%) |
| Total | 29,396 (100.0%) | 25,582 (100.0%) |
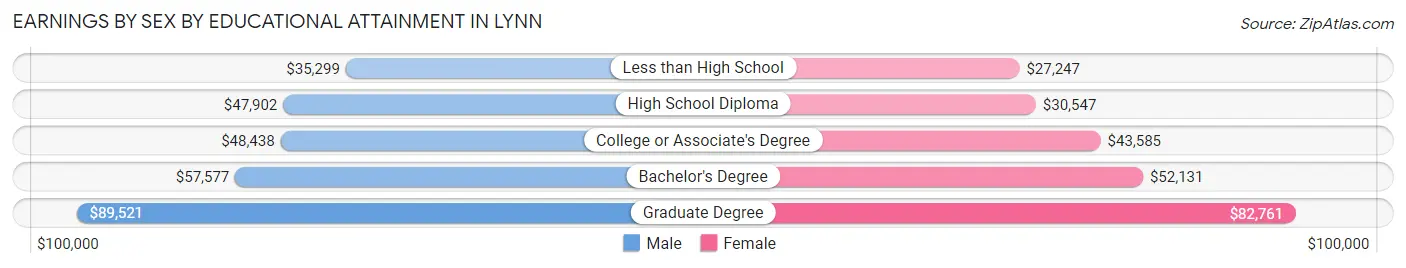
Earnings by Sex by Educational Attainment in Lynn
Average earnings in Lynn are $47,400 for men and $38,575 for women, a difference of 18.6%. Men with an educational attainment of graduate degree enjoy the highest average annual earnings of $89,521, while those with less than high school education earn the least with $35,299. Women with an educational attainment of graduate degree earn the most with the average annual earnings of $82,761, while those with less than high school education have the smallest earnings of $27,247.
| Educational Attainment | Male Income | Female Income |
| Less than High School | $35,299 | $27,247 |
| High School Diploma | $47,902 | $30,547 |
| College or Associate's Degree | $48,438 | $43,585 |
| Bachelor's Degree | $57,577 | $52,131 |
| Graduate Degree | $89,521 | $82,761 |
| Total | $47,400 | $38,575 |
Family Income in Lynn
Family Income Brackets in Lynn
According to the Lynn family income data, there are 4,242 families falling into the $100,000 to $149,999 income range, which is the most common income bracket and makes up 18.1% of all families. Conversely, the $10,000 to $14,999 income bracket is the least frequent group with only 539 families (2.3%) belonging to this category.
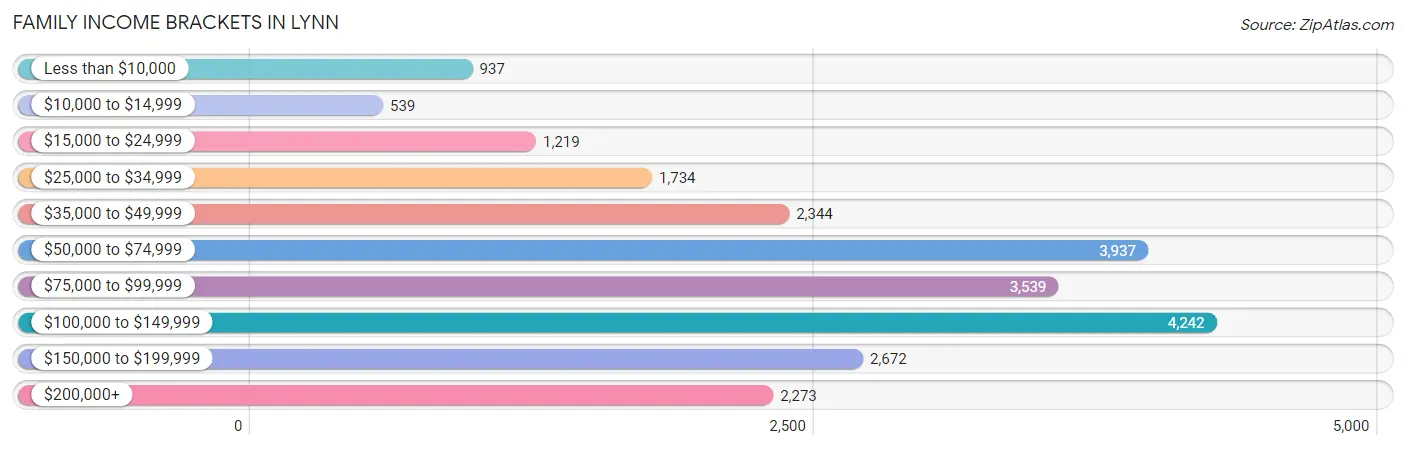
| Income Bracket | # Families | % Families |
| Less than $10,000 | 937 | 4.0% |
| $10,000 to $14,999 | 539 | 2.3% |
| $15,000 to $24,999 | 1,219 | 5.2% |
| $25,000 to $34,999 | 1,734 | 7.4% |
| $35,000 to $49,999 | 2,344 | 10.0% |
| $50,000 to $74,999 | 3,937 | 16.8% |
| $75,000 to $99,999 | 3,539 | 15.1% |
| $100,000 to $149,999 | 4,242 | 18.1% |
| $150,000 to $199,999 | 2,672 | 11.4% |
| $200,000+ | 2,273 | 9.7% |
Family Income by Famaliy Size in Lynn
7+ person families (807 | 3.4%) account for the highest median family income in Lynn with $185,737 per family, while 2-person families (7,944 | 33.9%) have the highest median income of $32,674 per family member.
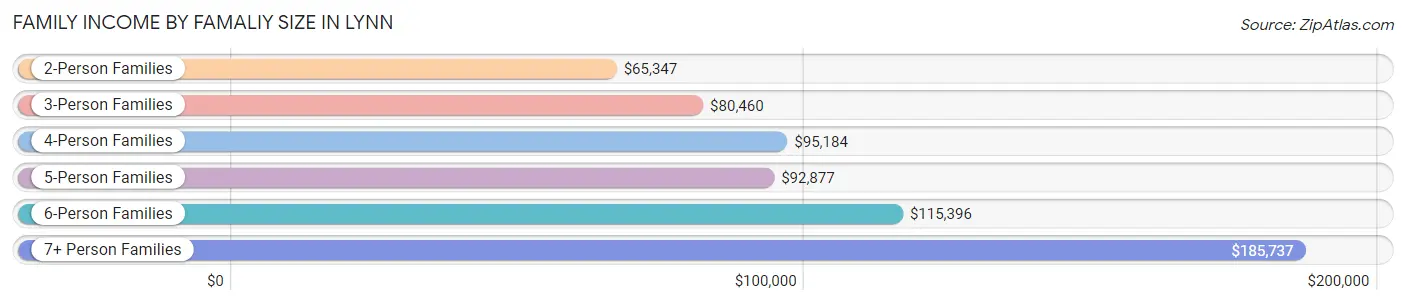
| Income Bracket | # Families | Median Income |
| 2-Person Families | 7,944 (33.9%) | $65,347 |
| 3-Person Families | 5,557 (23.7%) | $80,460 |
| 4-Person Families | 5,504 (23.5%) | $95,184 |
| 5-Person Families | 2,576 (11.0%) | $92,877 |
| 6-Person Families | 1,047 (4.5%) | $115,396 |
| 7+ Person Families | 807 (3.4%) | $185,737 |
| Total | 23,435 (100.0%) | $81,359 |
Family Income by Number of Earners in Lynn
The median family income in Lynn is $81,359, with families comprising 3+ earners (4,799) having the highest median family income of $143,416, while families with no earners (2,034) have the lowest median family income of $28,867, accounting for 20.5% and 8.7% of families, respectively.
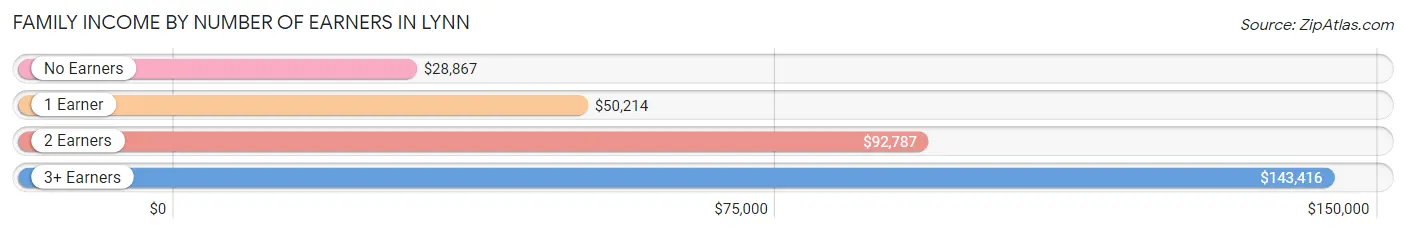
| Number of Earners | # Families | Median Income |
| No Earners | 2,034 (8.7%) | $28,867 |
| 1 Earner | 7,232 (30.9%) | $50,214 |
| 2 Earners | 9,370 (40.0%) | $92,787 |
| 3+ Earners | 4,799 (20.5%) | $143,416 |
| Total | 23,435 (100.0%) | $81,359 |
Household Income in Lynn
Household Income Brackets in Lynn
With 5,639 households falling in the category, the $50,000 to $74,999 income range is the most frequent in Lynn, accounting for 15.7% of all households. In contrast, only 2,263 households (6.3%) fall into the $10,000 to $14,999 income bracket, making it the least populous group.
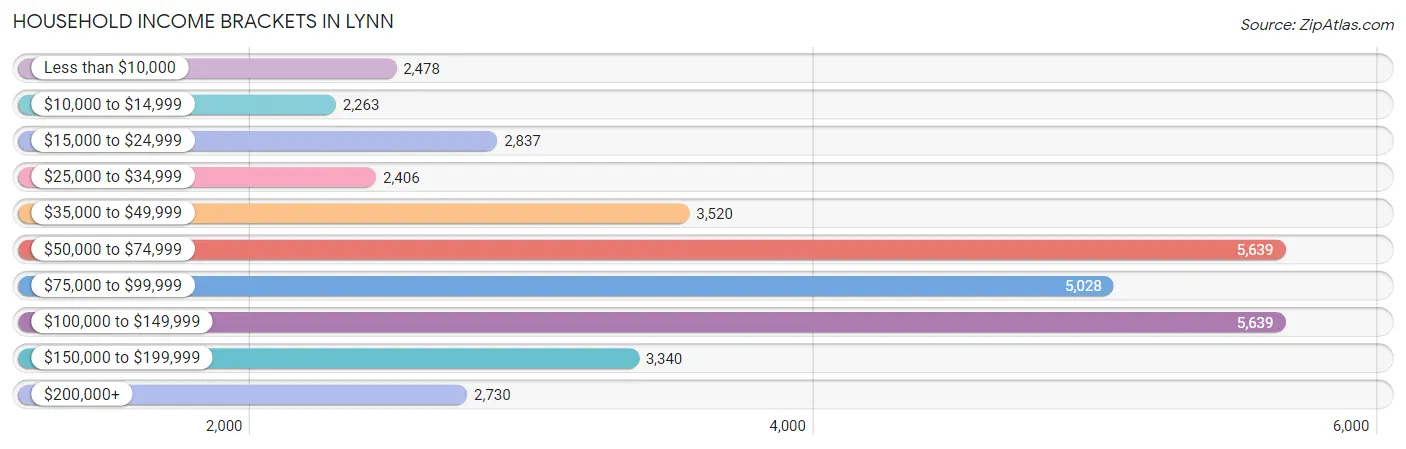
| Income Bracket | # Households | % Households |
| Less than $10,000 | 2,478 | 6.9% |
| $10,000 to $14,999 | 2,263 | 6.3% |
| $15,000 to $24,999 | 2,837 | 7.9% |
| $25,000 to $34,999 | 2,406 | 6.7% |
| $35,000 to $49,999 | 3,520 | 9.8% |
| $50,000 to $74,999 | 5,639 | 15.7% |
| $75,000 to $99,999 | 5,028 | 14.0% |
| $100,000 to $149,999 | 5,639 | 15.7% |
| $150,000 to $199,999 | 3,340 | 9.3% |
| $200,000+ | 2,730 | 7.6% |
Household Income by Householder Age in Lynn
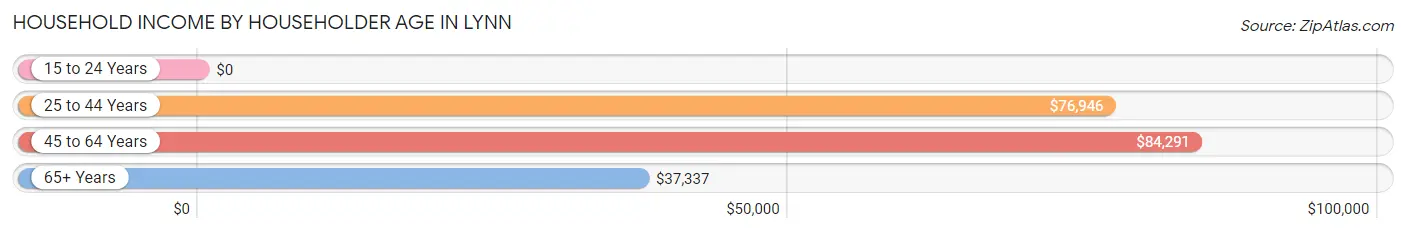
The median household income in Lynn is $70,046, with the highest median household income of $84,291 found in the 45 to 64 years age bracket for the primary householder. A total of 14,273 households (39.7%) fall into this category. Meanwhile, the 15 to 24 years age bracket for the primary householder has the lowest median household income of $0, with 876 households (2.4%) in this group.
| Income Bracket | # Households | Median Income |
| 15 to 24 Years | 876 (2.4%) | $0 |
| 25 to 44 Years | 12,485 (34.8%) | $76,946 |
| 45 to 64 Years | 14,273 (39.7%) | $84,291 |
| 65+ Years | 8,281 (23.1%) | $37,337 |
| Total | 35,915 (100.0%) | $70,046 |
Poverty in Lynn
Income Below Poverty by Sex and Age in Lynn
With 12.1% poverty level for males and 16.1% for females among the residents of Lynn, 15 year old males and 75 year old and over females are the most vulnerable to poverty, with 117 males (22.8%) and 760 females (23.4%) in their respective age groups living below the poverty level.
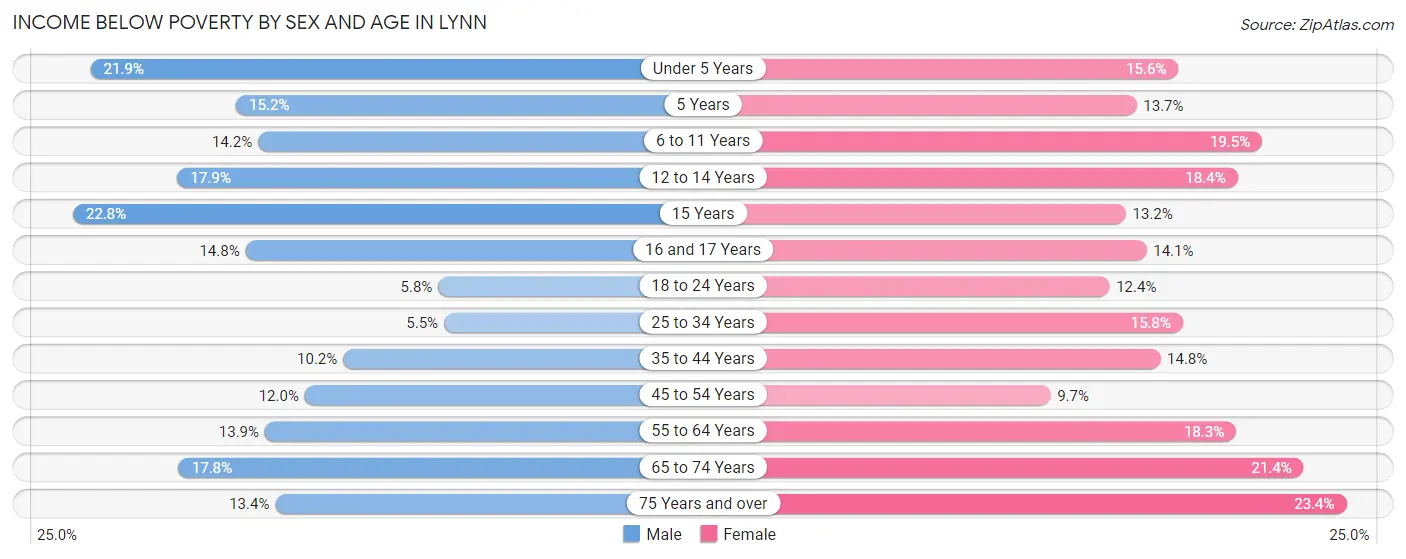
| Age Bracket | Male | Female |
| Under 5 Years | 740 (21.9%) | 445 (15.6%) |
| 5 Years | 92 (15.2%) | 92 (13.7%) |
| 6 to 11 Years | 512 (14.2%) | 783 (19.5%) |
| 12 to 14 Years | 313 (17.9%) | 377 (18.4%) |
| 15 Years | 117 (22.8%) | 115 (13.2%) |
| 16 and 17 Years | 266 (14.7%) | 198 (14.1%) |
| 18 to 24 Years | 344 (5.8%) | 540 (12.4%) |
| 25 to 34 Years | 403 (5.5%) | 1,123 (15.8%) |
| 35 to 44 Years | 708 (10.2%) | 1,063 (14.8%) |
| 45 to 54 Years | 806 (12.0%) | 630 (9.7%) |
| 55 to 64 Years | 787 (13.9%) | 1,017 (18.3%) |
| 65 to 74 Years | 673 (17.8%) | 912 (21.4%) |
| 75 Years and over | 237 (13.4%) | 760 (23.4%) |
| Total | 5,998 (12.1%) | 8,055 (16.1%) |
Income Above Poverty by Sex and Age in Lynn
According to the poverty statistics in Lynn, males aged 25 to 34 years and females aged 45 to 54 years are the age groups that are most secure financially, with 94.5% of males and 90.3% of females in these age groups living above the poverty line.
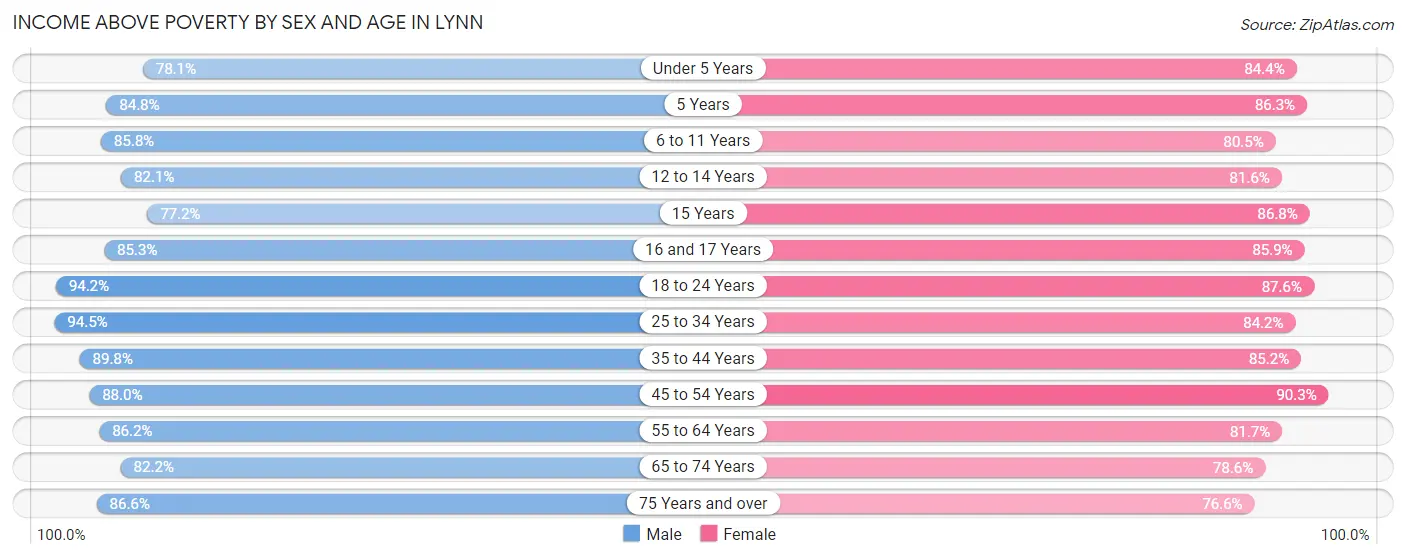
| Age Bracket | Male | Female |
| Under 5 Years | 2,633 (78.1%) | 2,406 (84.4%) |
| 5 Years | 514 (84.8%) | 581 (86.3%) |
| 6 to 11 Years | 3,101 (85.8%) | 3,232 (80.5%) |
| 12 to 14 Years | 1,436 (82.1%) | 1,676 (81.6%) |
| 15 Years | 397 (77.2%) | 758 (86.8%) |
| 16 and 17 Years | 1,538 (85.3%) | 1,203 (85.9%) |
| 18 to 24 Years | 5,577 (94.2%) | 3,810 (87.6%) |
| 25 to 34 Years | 6,876 (94.5%) | 5,975 (84.2%) |
| 35 to 44 Years | 6,221 (89.8%) | 6,135 (85.2%) |
| 45 to 54 Years | 5,913 (88.0%) | 5,884 (90.3%) |
| 55 to 64 Years | 4,894 (86.2%) | 4,542 (81.7%) |
| 65 to 74 Years | 3,100 (82.2%) | 3,343 (78.6%) |
| 75 Years and over | 1,535 (86.6%) | 2,486 (76.6%) |
| Total | 43,735 (87.9%) | 42,031 (83.9%) |
Income Below Poverty Among Married-Couple Families in Lynn
The poverty statistics for married-couple families in Lynn show that 5.6% or 764 of the total 13,638 families live below the poverty line. Families with 3 or 4 children have the highest poverty rate of 8.7%, comprising of 127 families. On the other hand, families with 5 or more children have the lowest poverty rate of 0.0%, which includes 0 families.
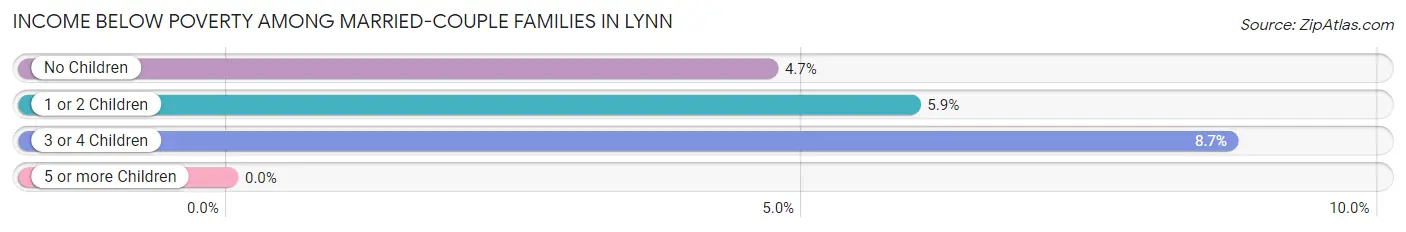
| Children | Above Poverty | Below Poverty |
| No Children | 6,388 (95.3%) | 315 (4.7%) |
| 1 or 2 Children | 5,096 (94.1%) | 322 (5.9%) |
| 3 or 4 Children | 1,331 (91.3%) | 127 (8.7%) |
| 5 or more Children | 59 (100.0%) | 0 (0.0%) |
| Total | 12,874 (94.4%) | 764 (5.6%) |
Income Below Poverty Among Single-Parent Households in Lynn
According to the poverty data in Lynn, 16.2% or 486 single-father households and 19.4% or 1,315 single-mother households are living below the poverty line. Among single-father households, those with 1 or 2 children have the highest poverty rate, with 268 households (22.4%) experiencing poverty. Likewise, among single-mother households, those with 5 or more children have the highest poverty rate, with 55 households (75.3%) falling below the poverty line.
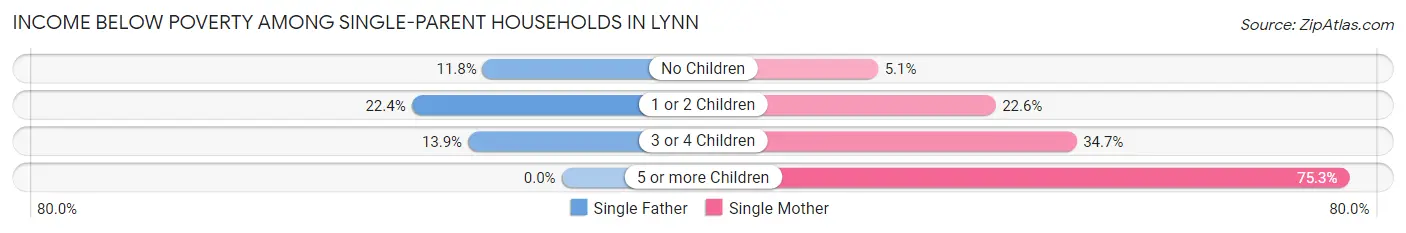
| Children | Single Father | Single Mother |
| No Children | 178 (11.8%) | 104 (5.1%) |
| 1 or 2 Children | 268 (22.4%) | 866 (22.6%) |
| 3 or 4 Children | 40 (13.9%) | 290 (34.6%) |
| 5 or more Children | 0 (0.0%) | 55 (75.3%) |
| Total | 486 (16.2%) | 1,315 (19.4%) |
Income Below Poverty Among Married-Couple vs Single-Parent Households in Lynn
The poverty data for Lynn shows that 764 of the married-couple family households (5.6%) and 1,801 of the single-parent households (18.4%) are living below the poverty level. Within the married-couple family households, those with 3 or 4 children have the highest poverty rate, with 127 households (8.7%) falling below the poverty line. Among the single-parent households, those with 5 or more children have the highest poverty rate, with 55 household (75.3%) living below poverty.
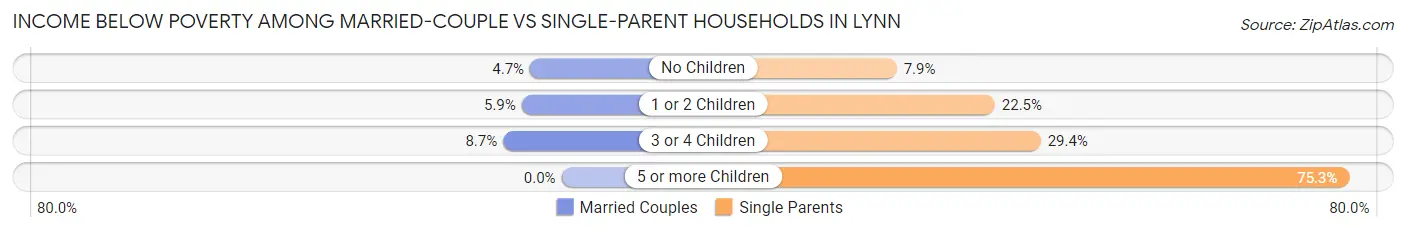
| Children | Married-Couple Families | Single-Parent Households |
| No Children | 315 (4.7%) | 282 (7.9%) |
| 1 or 2 Children | 322 (5.9%) | 1,134 (22.5%) |
| 3 or 4 Children | 127 (8.7%) | 330 (29.4%) |
| 5 or more Children | 0 (0.0%) | 55 (75.3%) |
| Total | 764 (5.6%) | 1,801 (18.4%) |
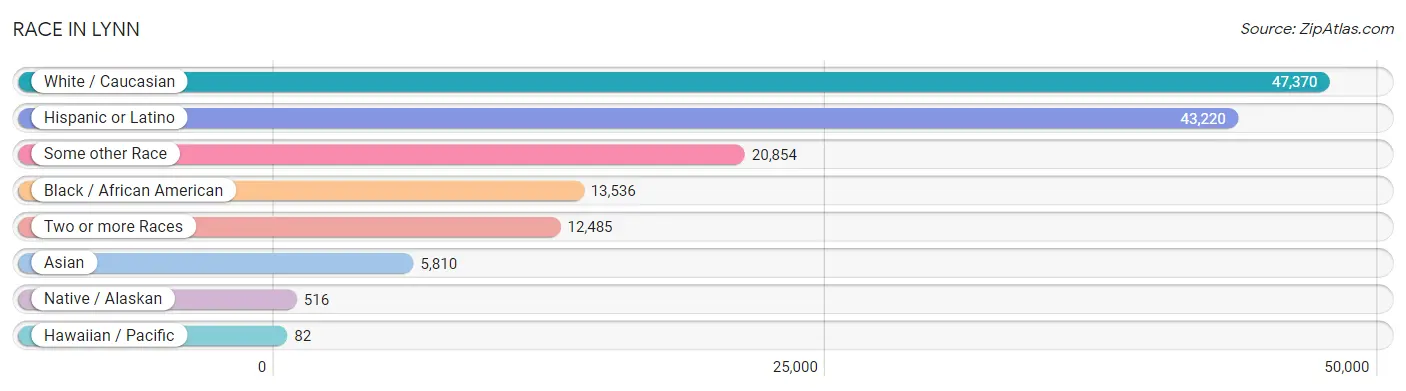
Race in Lynn
The most populous races in Lynn are White / Caucasian (47,370 | 47.1%), Hispanic or Latino (43,220 | 42.9%), and Some other Race (20,854 | 20.7%).
| Race | # Population | % Population |
| Asian | 5,810 | 5.8% |
| Black / African American | 13,536 | 13.5% |
| Hawaiian / Pacific | 82 | 0.1% |
| Hispanic or Latino | 43,220 | 42.9% |
| Native / Alaskan | 516 | 0.5% |
| White / Caucasian | 47,370 | 47.1% |
| Two or more Races | 12,485 | 12.4% |
| Some other Race | 20,854 | 20.7% |
| Total | 100,653 | 100.0% |
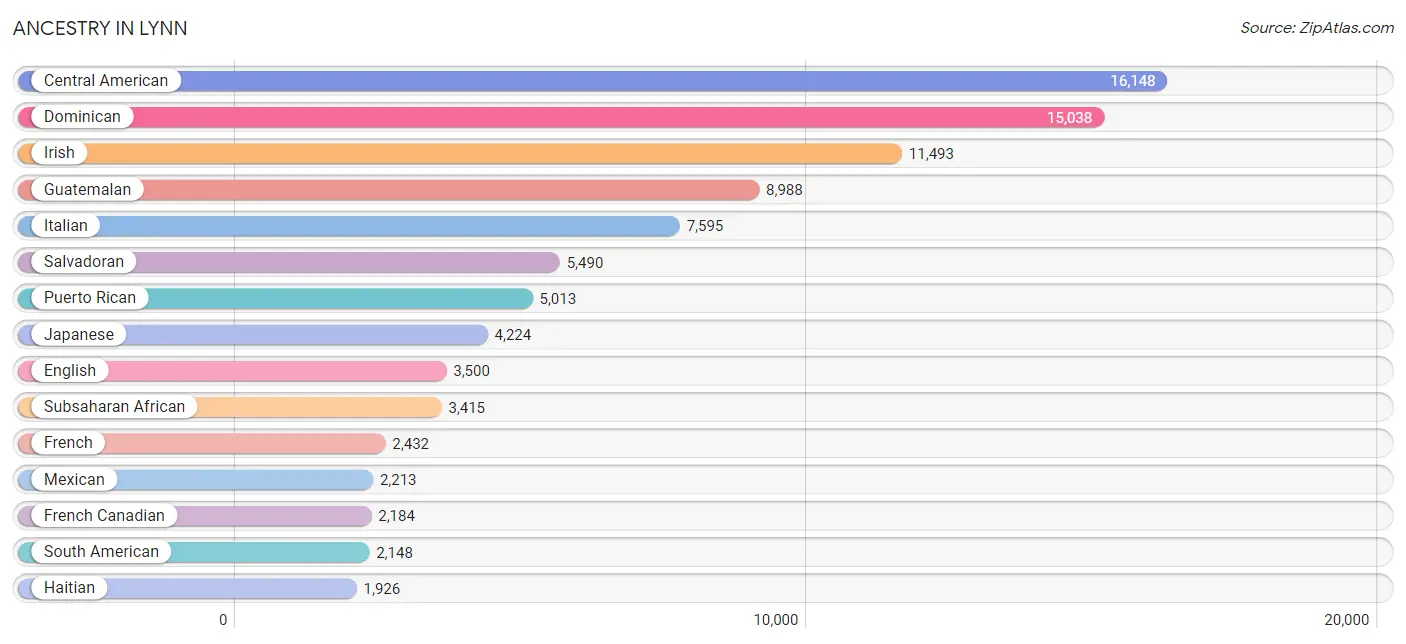
Ancestry in Lynn
The most populous ancestries reported in Lynn are Central American (16,148 | 16.0%), Dominican (15,038 | 14.9%), Irish (11,493 | 11.4%), Guatemalan (8,988 | 8.9%), and Italian (7,595 | 7.5%), together accounting for 58.9% of all Lynn residents.
| Ancestry | # Population | % Population |
| Afghan | 156 | 0.2% |
| African | 1,061 | 1.1% |
| Alaska Native | 8 | 0.0% |
| Albanian | 120 | 0.1% |
| American | 1,894 | 1.9% |
| Apache | 11 | 0.0% |
| Arab | 1,112 | 1.1% |
| Armenian | 151 | 0.2% |
| Austrian | 10 | 0.0% |
| Bahamian | 111 | 0.1% |
| Barbadian | 322 | 0.3% |
| Bhutanese | 163 | 0.2% |
| Blackfeet | 70 | 0.1% |
| Brazilian | 1,385 | 1.4% |
| British | 130 | 0.1% |
| British West Indian | 40 | 0.0% |
| Bulgarian | 6 | 0.0% |
| Burmese | 110 | 0.1% |
| Canadian | 397 | 0.4% |
| Cape Verdean | 316 | 0.3% |
| Celtic | 39 | 0.0% |
| Central American | 16,148 | 16.0% |
| Central American Indian | 461 | 0.5% |
| Cherokee | 82 | 0.1% |
| Chilean | 94 | 0.1% |
| Colombian | 1,393 | 1.4% |
| Costa Rican | 246 | 0.2% |
| Croatian | 29 | 0.0% |
| Cuban | 428 | 0.4% |
| Danish | 13 | 0.0% |
| Dominican | 15,038 | 14.9% |
| Dutch | 54 | 0.1% |
| Eastern European | 171 | 0.2% |
| Ecuadorian | 57 | 0.1% |
| Egyptian | 49 | 0.1% |
| English | 3,500 | 3.5% |
| Ethiopian | 61 | 0.1% |
| European | 383 | 0.4% |
| Finnish | 93 | 0.1% |
| French | 2,432 | 2.4% |
| French American Indian | 278 | 0.3% |
| French Canadian | 2,184 | 2.2% |
| German | 1,733 | 1.7% |
| Ghanaian | 113 | 0.1% |
| Greek | 1,386 | 1.4% |
| Guatemalan | 8,988 | 8.9% |
| Guyanese | 44 | 0.0% |
| Haitian | 1,926 | 1.9% |
| Honduran | 1,065 | 1.1% |
| Hungarian | 34 | 0.0% |
| Indian (Asian) | 586 | 0.6% |
| Iranian | 72 | 0.1% |
| Iraqi | 122 | 0.1% |
| Irish | 11,493 | 11.4% |
| Iroquois | 10 | 0.0% |
| Italian | 7,595 | 7.5% |
| Jamaican | 556 | 0.5% |
| Japanese | 4,224 | 4.2% |
| Kenyan | 137 | 0.1% |
| Korean | 326 | 0.3% |
| Lebanese | 98 | 0.1% |
| Liberian | 479 | 0.5% |
| Lithuanian | 86 | 0.1% |
| Malaysian | 131 | 0.1% |
| Mexican | 2,213 | 2.2% |
| Mexican American Indian | 8 | 0.0% |
| Moroccan | 419 | 0.4% |
| Native Hawaiian | 22 | 0.0% |
| Nigerian | 857 | 0.9% |
| Northern European | 46 | 0.1% |
| Norwegian | 175 | 0.2% |
| Pakistani | 23 | 0.0% |
| Palestinian | 15 | 0.0% |
| Panamanian | 72 | 0.1% |
| Peruvian | 486 | 0.5% |
| Polish | 1,465 | 1.5% |
| Portuguese | 1,354 | 1.3% |
| Puerto Rican | 5,013 | 5.0% |
| Romanian | 76 | 0.1% |
| Russian | 784 | 0.8% |
| Salvadoran | 5,490 | 5.4% |
| Scandinavian | 200 | 0.2% |
| Scotch-Irish | 96 | 0.1% |
| Scottish | 793 | 0.8% |
| Serbian | 61 | 0.1% |
| Sioux | 4 | 0.0% |
| Slovak | 31 | 0.0% |
| South American | 2,148 | 2.1% |
| South American Indian | 46 | 0.1% |
| Soviet Union | 25 | 0.0% |
| Spaniard | 44 | 0.0% |
| Spanish | 120 | 0.1% |
| Sri Lankan | 385 | 0.4% |
| Subsaharan African | 3,415 | 3.4% |
| Sudanese | 166 | 0.2% |
| Swedish | 842 | 0.8% |
| Swiss | 17 | 0.0% |
| Thai | 483 | 0.5% |
| Trinidadian and Tobagonian | 122 | 0.1% |
| U.S. Virgin Islander | 1 | 0.0% |
| Ugandan | 104 | 0.1% |
| Ukrainian | 328 | 0.3% |
| Venezuelan | 53 | 0.1% |
| Vietnamese | 210 | 0.2% |
| Welsh | 240 | 0.2% |
| West Indian | 127 | 0.1% |
| Yugoslavian | 77 | 0.1% |
| Yup'ik | 12 | 0.0% | View All 108 Rows |
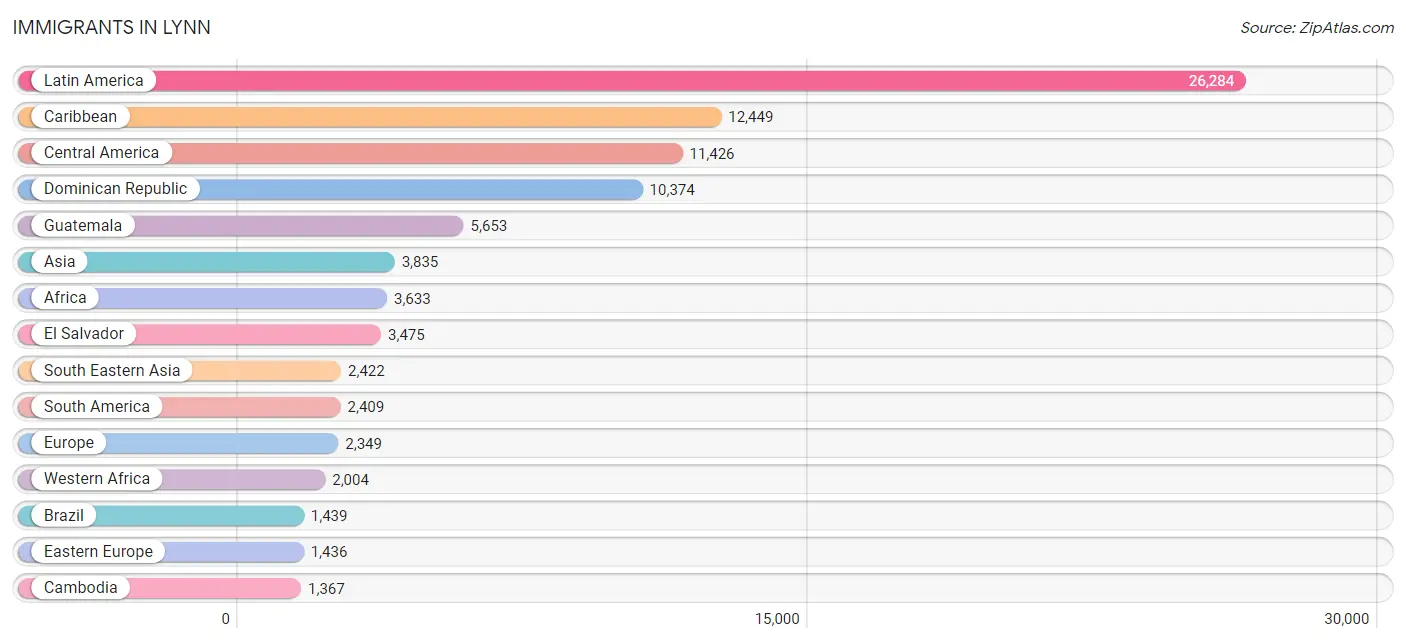
Immigrants in Lynn
The most numerous immigrant groups reported in Lynn came from Latin America (26,284 | 26.1%), Caribbean (12,449 | 12.4%), Central America (11,426 | 11.4%), Dominican Republic (10,374 | 10.3%), and Guatemala (5,653 | 5.6%), together accounting for 65.8% of all Lynn residents.
| Immigration Origin | # Population | % Population |
| Afghanistan | 228 | 0.2% |
| Africa | 3,633 | 3.6% |
| Albania | 105 | 0.1% |
| Asia | 3,835 | 3.8% |
| Azores | 82 | 0.1% |
| Bangladesh | 184 | 0.2% |
| Barbados | 142 | 0.1% |
| Belarus | 20 | 0.0% |
| Bosnia and Herzegovina | 95 | 0.1% |
| Brazil | 1,439 | 1.4% |
| Cabo Verde | 170 | 0.2% |
| Cambodia | 1,367 | 1.4% |
| Cameroon | 139 | 0.1% |
| Canada | 226 | 0.2% |
| Caribbean | 12,449 | 12.4% |
| Central America | 11,426 | 11.4% |
| Chile | 28 | 0.0% |
| China | 220 | 0.2% |
| Colombia | 324 | 0.3% |
| Costa Rica | 63 | 0.1% |
| Cuba | 49 | 0.1% |
| Dominica | 12 | 0.0% |
| Dominican Republic | 10,374 | 10.3% |
| Eastern Africa | 539 | 0.5% |
| Eastern Asia | 333 | 0.3% |
| Eastern Europe | 1,436 | 1.4% |
| Ecuador | 38 | 0.0% |
| Egypt | 102 | 0.1% |
| El Salvador | 3,475 | 3.5% |
| England | 21 | 0.0% |
| Eritrea | 52 | 0.1% |
| Ethiopia | 9 | 0.0% |
| Europe | 2,349 | 2.3% |
| Germany | 163 | 0.2% |
| Ghana | 100 | 0.1% |
| Greece | 264 | 0.3% |
| Grenada | 17 | 0.0% |
| Guatemala | 5,653 | 5.6% |
| Guyana | 60 | 0.1% |
| Haiti | 1,317 | 1.3% |
| Honduras | 1,166 | 1.2% |
| Hong Kong | 37 | 0.0% |
| Hungary | 15 | 0.0% |
| India | 126 | 0.1% |
| Indonesia | 15 | 0.0% |
| Iran | 16 | 0.0% |
| Iraq | 177 | 0.2% |
| Ireland | 90 | 0.1% |
| Italy | 80 | 0.1% |
| Jamaica | 138 | 0.1% |
| Japan | 18 | 0.0% |
| Kenya | 208 | 0.2% |
| Korea | 95 | 0.1% |
| Laos | 133 | 0.1% |
| Latin America | 26,284 | 26.1% |
| Liberia | 534 | 0.5% |
| Lithuania | 7 | 0.0% |
| Mexico | 958 | 0.9% |
| Middle Africa | 167 | 0.2% |
| Moldova | 66 | 0.1% |
| Morocco | 297 | 0.3% |
| Nepal | 113 | 0.1% |
| Nigeria | 856 | 0.9% |
| Northern Africa | 596 | 0.6% |
| Northern Europe | 129 | 0.1% |
| Pakistan | 102 | 0.1% |
| Panama | 111 | 0.1% |
| Peru | 461 | 0.5% |
| Philippines | 92 | 0.1% |
| Poland | 81 | 0.1% |
| Portugal | 267 | 0.3% |
| Romania | 9 | 0.0% |
| Russia | 578 | 0.6% |
| Sierra Leone | 25 | 0.0% |
| South America | 2,409 | 2.4% |
| South Central Asia | 848 | 0.8% |
| South Eastern Asia | 2,422 | 2.4% |
| Southern Europe | 621 | 0.6% |
| Spain | 10 | 0.0% |
| Sweden | 18 | 0.0% |
| Taiwan | 6 | 0.0% |
| Thailand | 496 | 0.5% |
| Trinidad and Tobago | 96 | 0.1% |
| Uganda | 90 | 0.1% |
| Ukraine | 360 | 0.4% |
| Uzbekistan | 13 | 0.0% |
| Venezuela | 46 | 0.1% |
| Vietnam | 319 | 0.3% |
| West Indies | 293 | 0.3% |
| Western Africa | 2,004 | 2.0% |
| Western Asia | 227 | 0.2% |
| Western Europe | 163 | 0.2% |
| Zaire | 18 | 0.0% |
| Zimbabwe | 10 | 0.0% | View All 94 Rows |
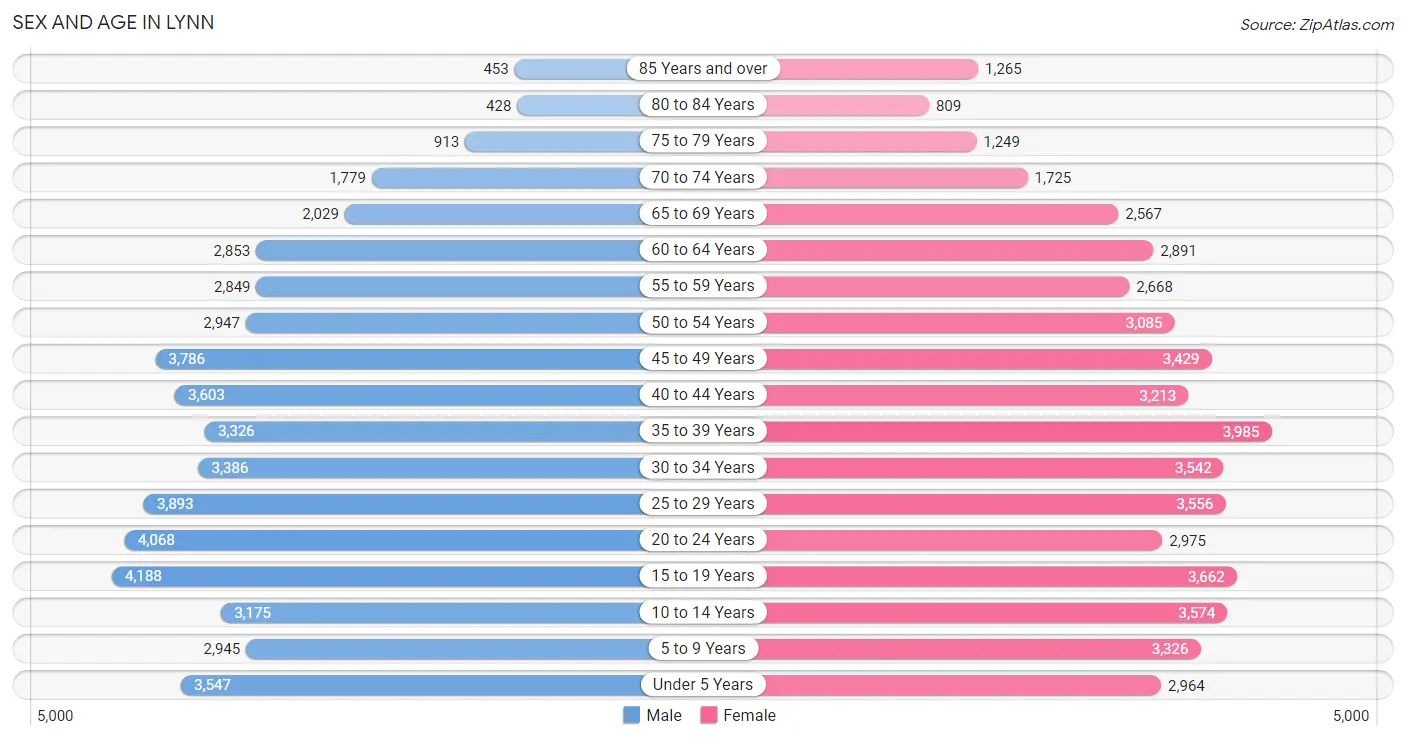
Sex and Age in Lynn
Sex and Age in Lynn
The most populous age groups in Lynn are 15 to 19 Years (4,188 | 8.4%) for men and 35 to 39 Years (3,985 | 7.9%) for women.
| Age Bracket | Male | Female |
| Under 5 Years | 3,547 (7.1%) | 2,964 (5.9%) |
| 5 to 9 Years | 2,945 (5.9%) | 3,326 (6.6%) |
| 10 to 14 Years | 3,175 (6.3%) | 3,574 (7.1%) |
| 15 to 19 Years | 4,188 (8.4%) | 3,662 (7.2%) |
| 20 to 24 Years | 4,068 (8.1%) | 2,975 (5.9%) |
| 25 to 29 Years | 3,893 (7.8%) | 3,556 (7.0%) |
| 30 to 34 Years | 3,386 (6.8%) | 3,542 (7.0%) |
| 35 to 39 Years | 3,326 (6.6%) | 3,985 (7.9%) |
| 40 to 44 Years | 3,603 (7.2%) | 3,213 (6.4%) |
| 45 to 49 Years | 3,786 (7.5%) | 3,429 (6.8%) |
| 50 to 54 Years | 2,947 (5.9%) | 3,085 (6.1%) |
| 55 to 59 Years | 2,849 (5.7%) | 2,668 (5.3%) |
| 60 to 64 Years | 2,853 (5.7%) | 2,891 (5.7%) |
| 65 to 69 Years | 2,029 (4.0%) | 2,567 (5.1%) |
| 70 to 74 Years | 1,779 (3.5%) | 1,725 (3.4%) |
| 75 to 79 Years | 913 (1.8%) | 1,249 (2.5%) |
| 80 to 84 Years | 428 (0.9%) | 809 (1.6%) |
| 85 Years and over | 453 (0.9%) | 1,265 (2.5%) |
| Total | 50,168 (100.0%) | 50,485 (100.0%) |
Families and Households in Lynn
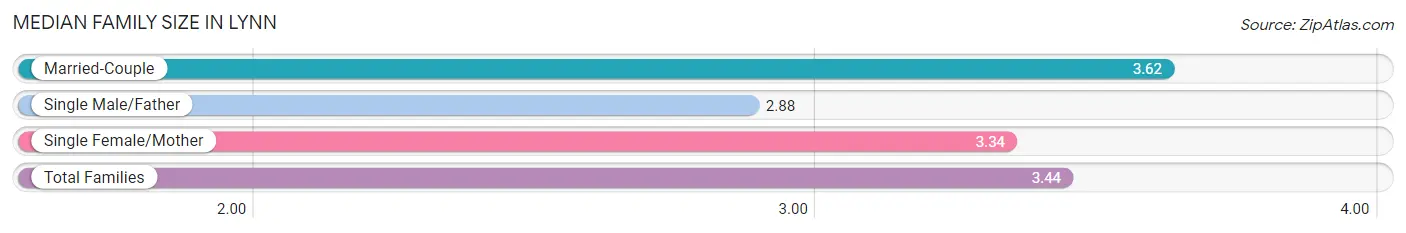
Median Family Size in Lynn
The median family size in Lynn is 3.44 persons per family, with married-couple families (13,638 | 58.2%) accounting for the largest median family size of 3.62 persons per family. On the other hand, single male/father families (3,000 | 12.8%) represent the smallest median family size with 2.88 persons per family.
| Family Type | # Families | Family Size |
| Married-Couple | 13,638 (58.2%) | 3.62 |
| Single Male/Father | 3,000 (12.8%) | 2.88 |
| Single Female/Mother | 6,797 (29.0%) | 3.34 |
| Total Families | 23,435 (100.0%) | 3.44 |
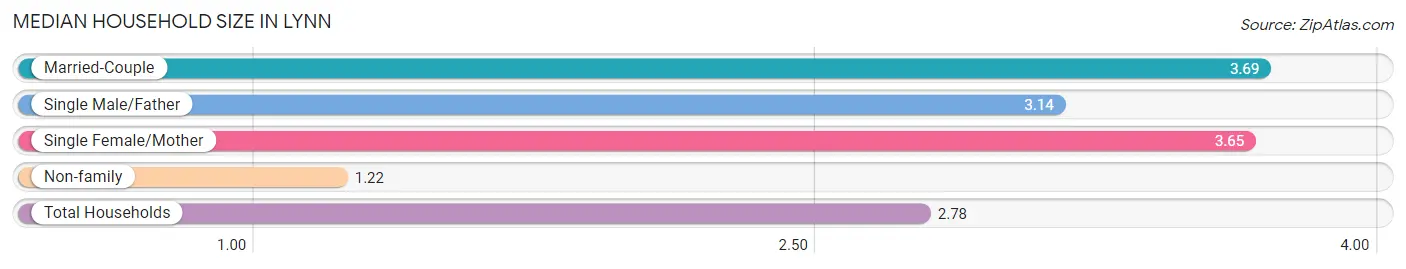
Median Household Size in Lynn
The median household size in Lynn is 2.78 persons per household, with married-couple households (13,638 | 38.0%) accounting for the largest median household size of 3.69 persons per household. non-family households (12,480 | 34.7%) represent the smallest median household size with 1.22 persons per household.
| Household Type | # Households | Household Size |
| Married-Couple | 13,638 (38.0%) | 3.69 |
| Single Male/Father | 3,000 (8.4%) | 3.14 |
| Single Female/Mother | 6,797 (18.9%) | 3.65 |
| Non-family | 12,480 (34.7%) | 1.22 |
| Total Households | 35,915 (100.0%) | 2.78 |
Household Size by Marriage Status in Lynn
Out of a total of 35,915 households in Lynn, 23,435 (65.2%) are family households, while 12,480 (34.7%) are nonfamily households. The most numerous type of family households are 2-person households, comprising 7,264, and the most common type of nonfamily households are 1-person households, comprising 10,465.
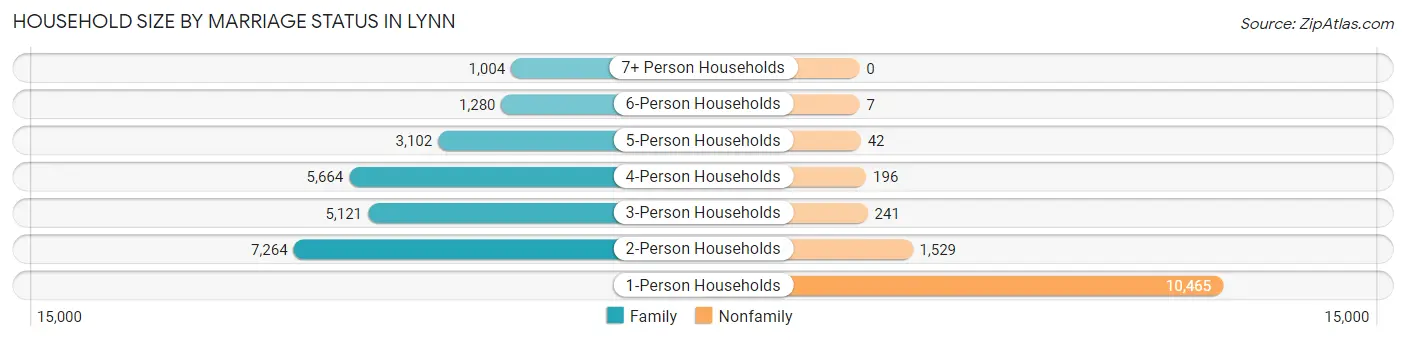
| Household Size | Family Households | Nonfamily Households |
| 1-Person Households | - | 10,465 (29.1%) |
| 2-Person Households | 7,264 (20.2%) | 1,529 (4.3%) |
| 3-Person Households | 5,121 (14.3%) | 241 (0.7%) |
| 4-Person Households | 5,664 (15.8%) | 196 (0.5%) |
| 5-Person Households | 3,102 (8.6%) | 42 (0.1%) |
| 6-Person Households | 1,280 (3.6%) | 7 (0.0%) |
| 7+ Person Households | 1,004 (2.8%) | 0 (0.0%) |
| Total | 23,435 (65.2%) | 12,480 (34.7%) |
Female Fertility in Lynn
Fertility by Age in Lynn
Average fertility rate in Lynn is 50.0 births per 1,000 women. Women in the age bracket of 20 to 34 years have the highest fertility rate with 80.0 births per 1,000 women. Women in the age bracket of 20 to 34 years acount for 64.1% of all women with births.
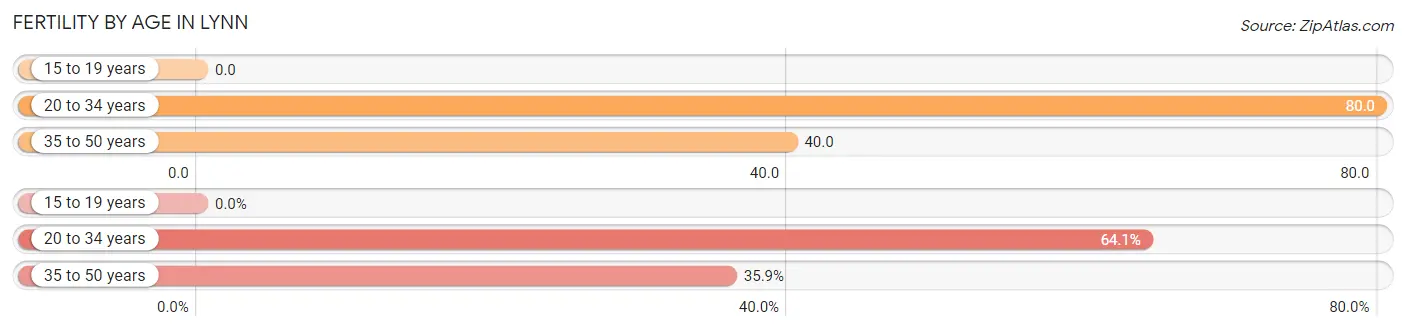
| Age Bracket | Women with Births | Births / 1,000 Women |
| 15 to 19 years | 0 (0.0%) | 0.0 |
| 20 to 34 years | 804 (64.1%) | 80.0 |
| 35 to 50 years | 450 (35.9%) | 40.0 |
| Total | 1,254 (100.0%) | 50.0 |
Fertility by Age by Marriage Status in Lynn
62.8% of women with births (1,254) in Lynn are married. The highest percentage of unmarried women with births falls into 20 to 34 years age bracket with 44.5% of them unmarried at the time of birth, while the lowest percentage of unmarried women with births belong to 35 to 50 years age bracket with 24.2% of them unmarried.
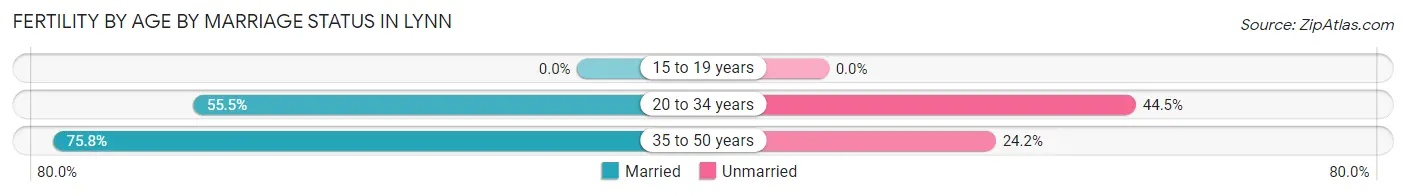
| Age Bracket | Married | Unmarried |
| 15 to 19 years | 0 (0.0%) | 0 (0.0%) |
| 20 to 34 years | 446 (55.5%) | 358 (44.5%) |
| 35 to 50 years | 341 (75.8%) | 109 (24.2%) |
| Total | 788 (62.8%) | 466 (37.2%) |
Fertility by Education in Lynn
Average fertility rate in Lynn is 50.0 births per 1,000 women. Women with the education attainment of bachelor's degree have the highest fertility rate of 92.0 births per 1,000 women, while women with the education attainment of high school diploma have the lowest fertility at 26.0 births per 1,000 women. Women with the education attainment of college or associate's degree represent 39.7% of all women with births.
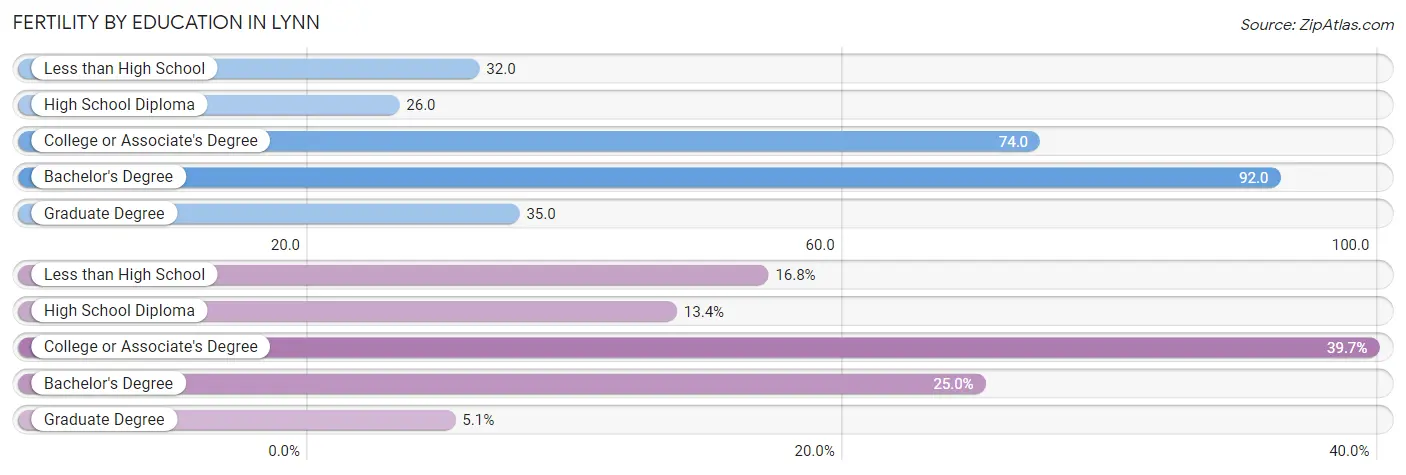
| Educational Attainment | Women with Births | Births / 1,000 Women |
| Less than High School | 211 (16.8%) | 32.0 |
| High School Diploma | 168 (13.4%) | 26.0 |
| College or Associate's Degree | 498 (39.7%) | 74.0 |
| Bachelor's Degree | 313 (25.0%) | 92.0 |
| Graduate Degree | 64 (5.1%) | 35.0 |
| Total | 1,254 (100.0%) | 50.0 |
Fertility by Education by Marriage Status in Lynn
37.2% of women with births in Lynn are unmarried. Women with the educational attainment of graduate degree are most likely to be married with 87.5% of them married at childbirth, while women with the educational attainment of college or associate's degree are least likely to be married with 50.4% of them unmarried at childbirth.
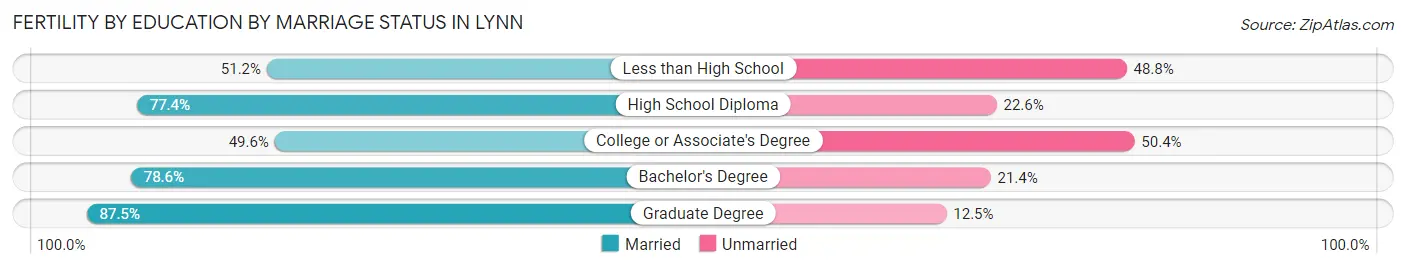
| Educational Attainment | Married | Unmarried |
| Less than High School | 108 (51.2%) | 103 (48.8%) |
| High School Diploma | 130 (77.4%) | 38 (22.6%) |
| College or Associate's Degree | 247 (49.6%) | 251 (50.4%) |
| Bachelor's Degree | 246 (78.6%) | 67 (21.4%) |
| Graduate Degree | 56 (87.5%) | 8 (12.5%) |
| Total | 788 (62.8%) | 466 (37.2%) |
Employment Characteristics in Lynn
Employment by Class of Employer in Lynn
Among the 48,980 employed individuals in Lynn, private company employees (34,833 | 71.1%), not-for-profit organizations (5,691 | 11.6%), and local government employees (2,986 | 6.1%) make up the most common classes of employment.
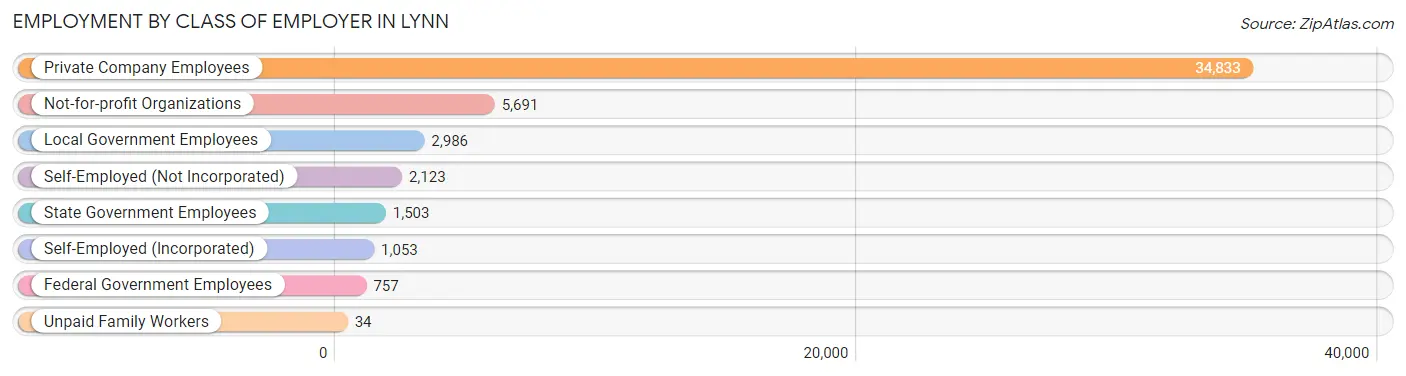
| Employer Class | # Employees | % Employees |
| Private Company Employees | 34,833 | 71.1% |
| Self-Employed (Incorporated) | 1,053 | 2.1% |
| Self-Employed (Not Incorporated) | 2,123 | 4.3% |
| Not-for-profit Organizations | 5,691 | 11.6% |
| Local Government Employees | 2,986 | 6.1% |
| State Government Employees | 1,503 | 3.1% |
| Federal Government Employees | 757 | 1.5% |
| Unpaid Family Workers | 34 | 0.1% |
| Total | 48,980 | 100.0% |
Employment Status by Age in Lynn
According to the labor force statistics for Lynn, out of the total population over 16 years of age (79,735), 66.8% or 53,263 individuals are in the labor force, with 5.7% or 3,036 of them unemployed. The age group with the highest labor force participation rate is 30 to 34 years, with 87.9% or 6,090 individuals in the labor force. Within the labor force, the 20 to 24 years age range has the highest percentage of unemployed individuals, with 9.8% or 542 of them being unemployed.
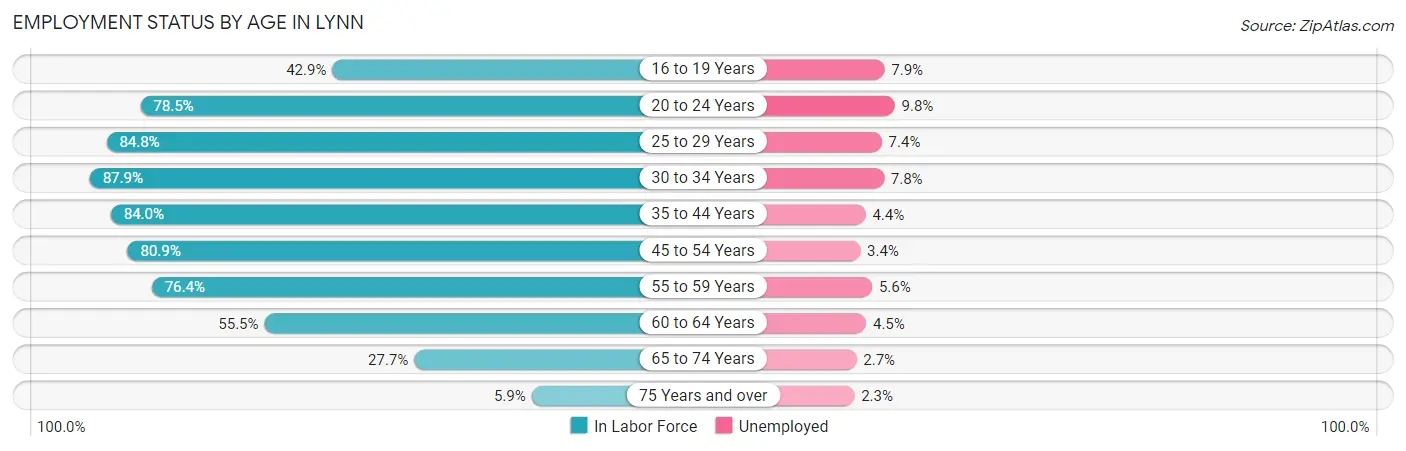
| Age Bracket | In Labor Force | Unemployed |
| 16 to 19 Years | 2,773 (42.9%) | 219 (7.9%) |
| 20 to 24 Years | 5,529 (78.5%) | 542 (9.8%) |
| 25 to 29 Years | 6,317 (84.8%) | 467 (7.4%) |
| 30 to 34 Years | 6,090 (87.9%) | 475 (7.8%) |
| 35 to 44 Years | 11,867 (84.0%) | 522 (4.4%) |
| 45 to 54 Years | 10,717 (80.9%) | 364 (3.4%) |
| 55 to 59 Years | 4,215 (76.4%) | 236 (5.6%) |
| 60 to 64 Years | 3,188 (55.5%) | 143 (4.5%) |
| 65 to 74 Years | 2,244 (27.7%) | 61 (2.7%) |
| 75 Years and over | 302 (5.9%) | 7 (2.3%) |
| Total | 53,263 (66.8%) | 3,036 (5.7%) |
Employment Status by Educational Attainment in Lynn
According to labor force statistics for Lynn, 80.0% of individuals (42,410) out of the total population between 25 and 64 years of age (53,012) are in the labor force, with 5.2% or 2,205 of them being unemployed. The group with the highest labor force participation rate are those with the educational attainment of bachelor's degree or higher, with 89.1% or 10,538 individuals in the labor force. Within the labor force, individuals with less than high school education have the highest percentage of unemployment, with 9.8% or 847 of them being unemployed.
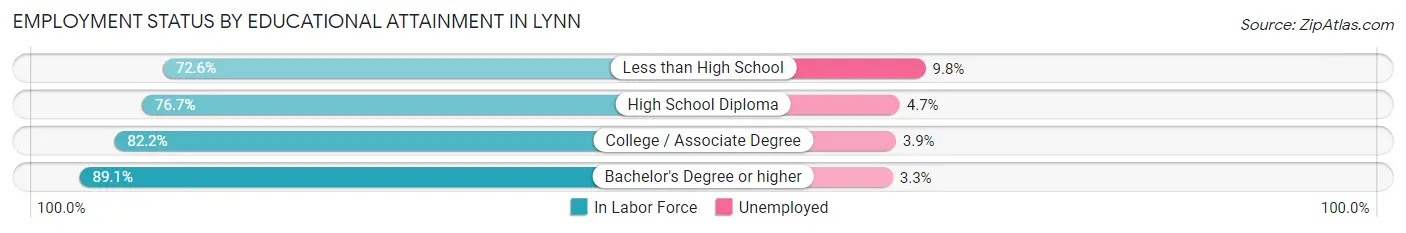
| Educational Attainment | In Labor Force | Unemployed |
| Less than High School | 8,644 (72.6%) | 1,167 (9.8%) |
| High School Diploma | 12,122 (76.7%) | 743 (4.7%) |
| College / Associate Degree | 11,076 (82.2%) | 525 (3.9%) |
| Bachelor's Degree or higher | 10,538 (89.1%) | 390 (3.3%) |
| Total | 42,410 (80.0%) | 2,757 (5.2%) |
Employment Occupations by Sex in Lynn
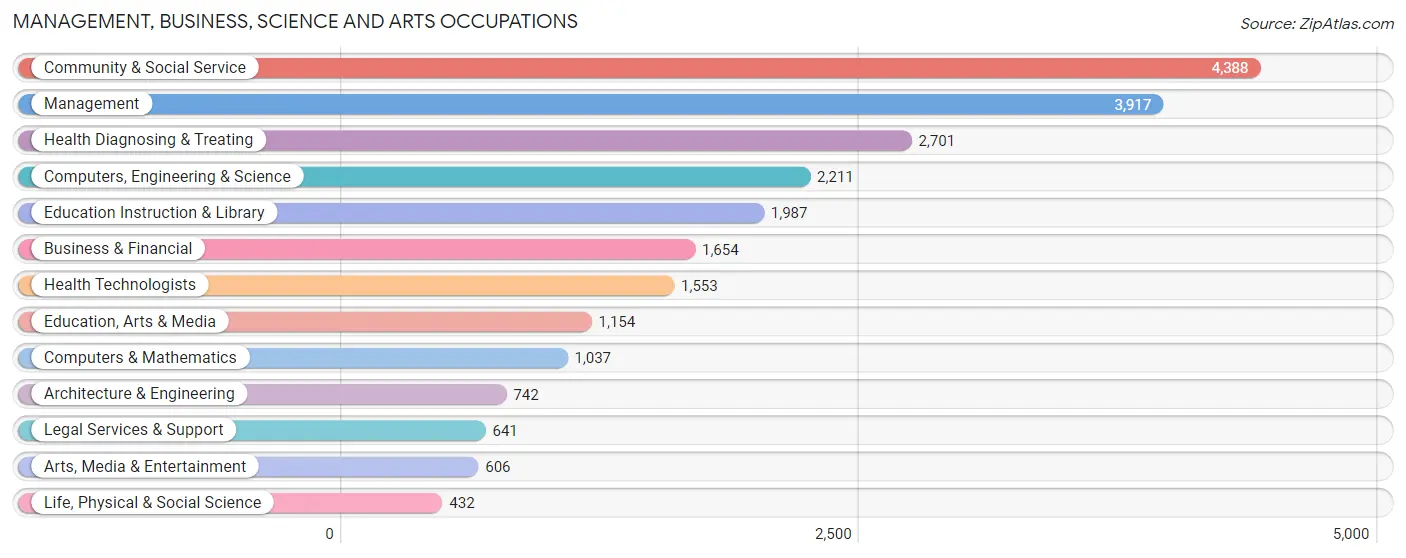
Management, Business, Science and Arts Occupations
The most common Management, Business, Science and Arts occupations in Lynn are Community & Social Service (4,388 | 8.7%), Management (3,917 | 7.8%), Health Diagnosing & Treating (2,701 | 5.4%), Computers, Engineering & Science (2,211 | 4.4%), and Education Instruction & Library (1,987 | 4.0%).
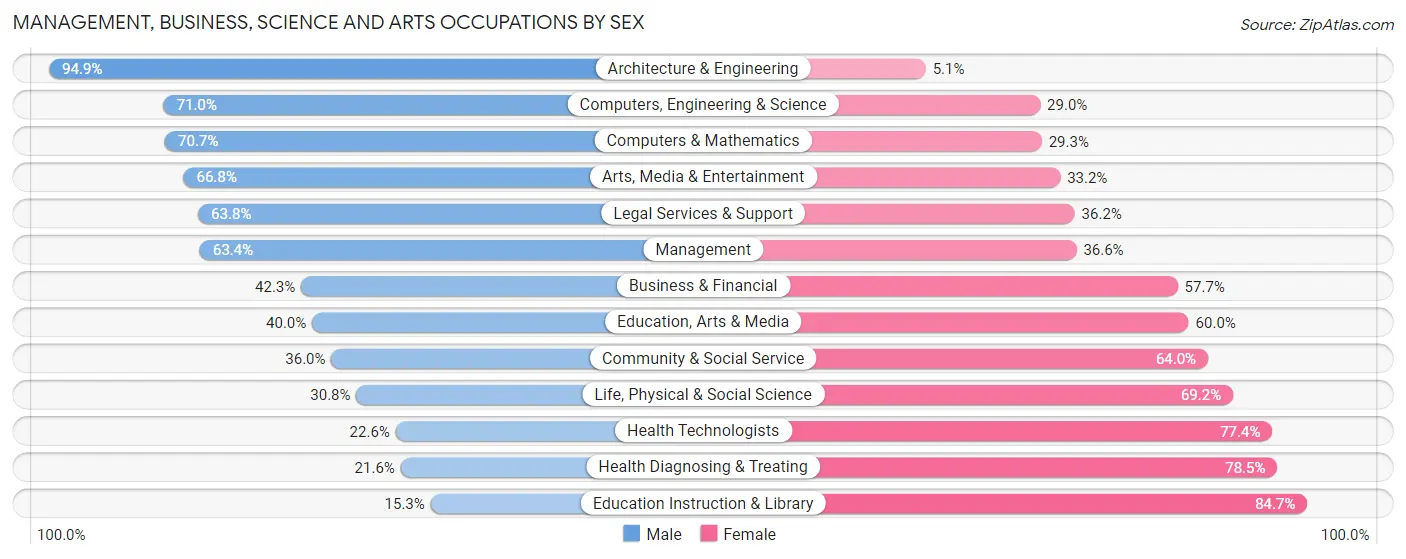
Management, Business, Science and Arts Occupations by Sex
Within the Management, Business, Science and Arts occupations in Lynn, the most male-oriented occupations are Architecture & Engineering (94.9%), Computers, Engineering & Science (71.0%), and Computers & Mathematics (70.7%), while the most female-oriented occupations are Education Instruction & Library (84.7%), Health Diagnosing & Treating (78.4%), and Health Technologists (77.4%).
| Occupation | Male | Female |
| Management | 2,485 (63.4%) | 1,432 (36.6%) |
| Business & Financial | 700 (42.3%) | 954 (57.7%) |
| Computers, Engineering & Science | 1,570 (71.0%) | 641 (29.0%) |
| Computers & Mathematics | 733 (70.7%) | 304 (29.3%) |
| Architecture & Engineering | 704 (94.9%) | 38 (5.1%) |
| Life, Physical & Social Science | 133 (30.8%) | 299 (69.2%) |
| Community & Social Service | 1,580 (36.0%) | 2,808 (64.0%) |
| Education, Arts & Media | 462 (40.0%) | 692 (60.0%) |
| Legal Services & Support | 409 (63.8%) | 232 (36.2%) |
| Education Instruction & Library | 304 (15.3%) | 1,683 (84.7%) |
| Arts, Media & Entertainment | 405 (66.8%) | 201 (33.2%) |
| Health Diagnosing & Treating | 582 (21.5%) | 2,119 (78.4%) |
| Health Technologists | 351 (22.6%) | 1,202 (77.4%) |
| Total (Category) | 6,917 (46.5%) | 7,954 (53.5%) |
| Total (Overall) | 26,461 (52.7%) | 23,750 (47.3%) |
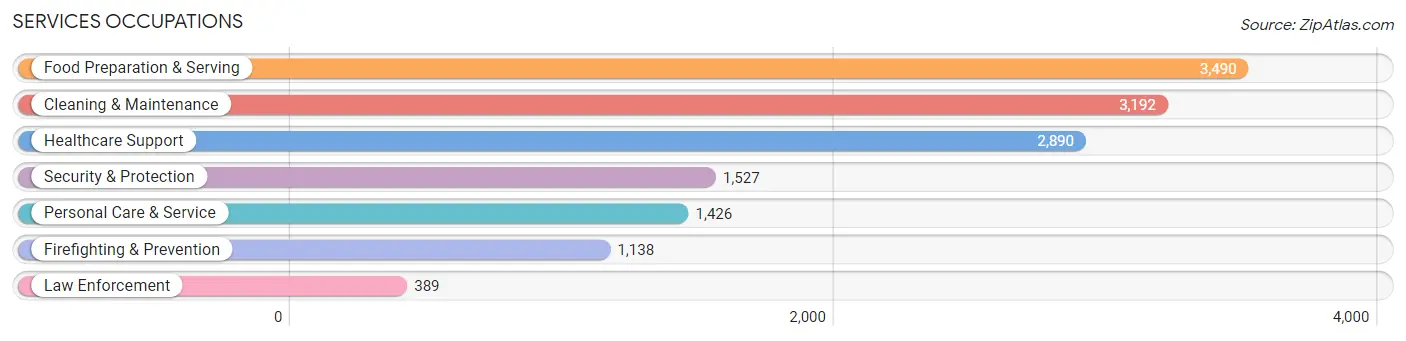
Services Occupations
The most common Services occupations in Lynn are Food Preparation & Serving (3,490 | 7.0%), Cleaning & Maintenance (3,192 | 6.4%), Healthcare Support (2,890 | 5.8%), Security & Protection (1,527 | 3.0%), and Personal Care & Service (1,426 | 2.8%).
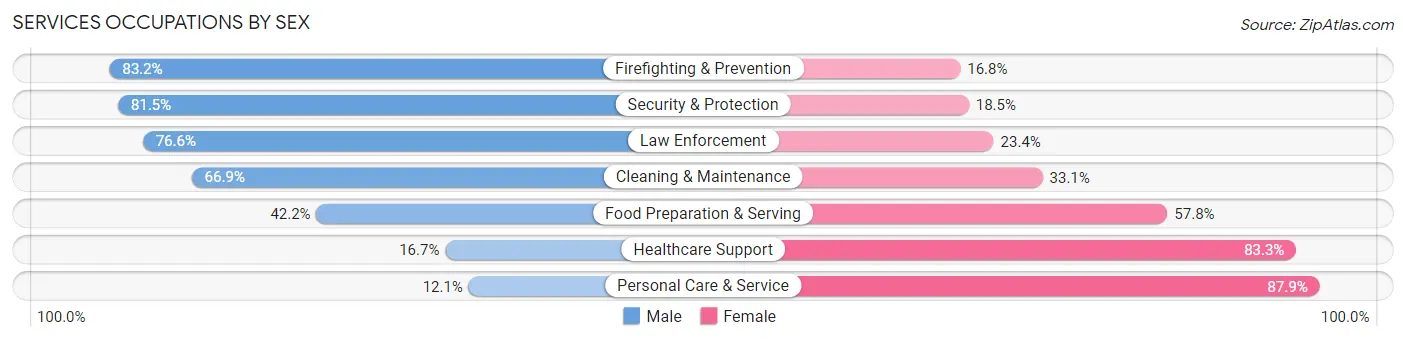
Services Occupations by Sex
Within the Services occupations in Lynn, the most male-oriented occupations are Firefighting & Prevention (83.2%), Security & Protection (81.5%), and Law Enforcement (76.6%), while the most female-oriented occupations are Personal Care & Service (87.9%), Healthcare Support (83.3%), and Food Preparation & Serving (57.8%).
| Occupation | Male | Female |
| Healthcare Support | 483 (16.7%) | 2,407 (83.3%) |
| Security & Protection | 1,245 (81.5%) | 282 (18.5%) |
| Firefighting & Prevention | 947 (83.2%) | 191 (16.8%) |
| Law Enforcement | 298 (76.6%) | 91 (23.4%) |
| Food Preparation & Serving | 1,473 (42.2%) | 2,017 (57.8%) |
| Cleaning & Maintenance | 2,136 (66.9%) | 1,056 (33.1%) |
| Personal Care & Service | 172 (12.1%) | 1,254 (87.9%) |
| Total (Category) | 5,509 (44.0%) | 7,016 (56.0%) |
| Total (Overall) | 26,461 (52.7%) | 23,750 (47.3%) |
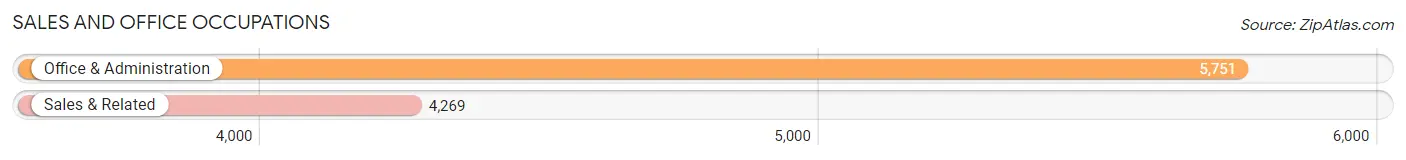
Sales and Office Occupations
The most common Sales and Office occupations in Lynn are Office & Administration (5,751 | 11.5%), and Sales & Related (4,269 | 8.5%).
Sales and Office Occupations by Sex
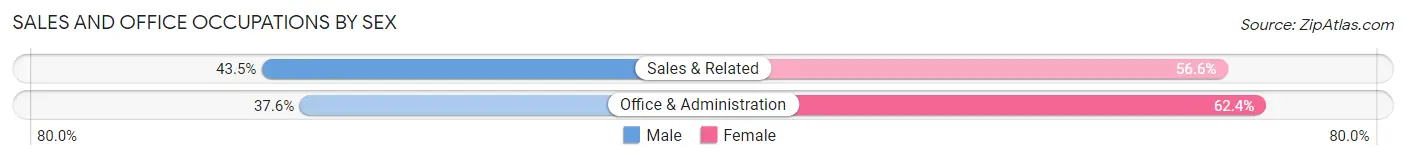
| Occupation | Male | Female |
| Sales & Related | 1,855 (43.4%) | 2,414 (56.6%) |
| Office & Administration | 2,164 (37.6%) | 3,587 (62.4%) |
| Total (Category) | 4,019 (40.1%) | 6,001 (59.9%) |
| Total (Overall) | 26,461 (52.7%) | 23,750 (47.3%) |
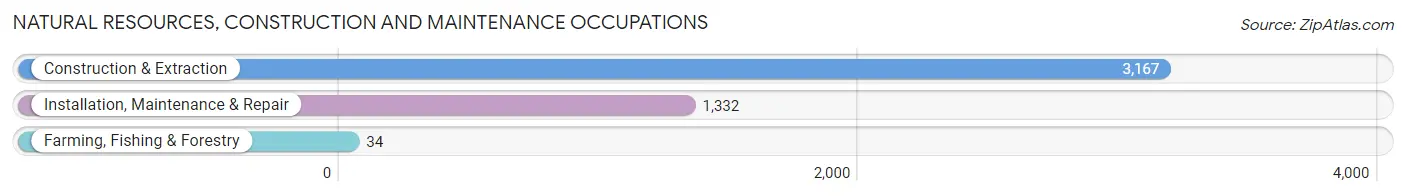
Natural Resources, Construction and Maintenance Occupations
The most common Natural Resources, Construction and Maintenance occupations in Lynn are Construction & Extraction (3,167 | 6.3%), Installation, Maintenance & Repair (1,332 | 2.6%), and Farming, Fishing & Forestry (34 | 0.1%).
Natural Resources, Construction and Maintenance Occupations by Sex
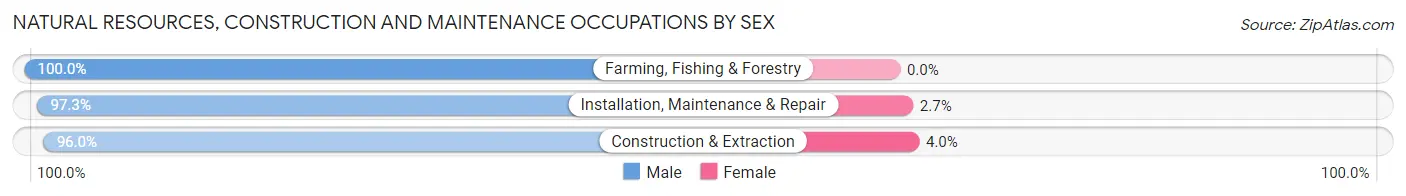
| Occupation | Male | Female |
| Farming, Fishing & Forestry | 34 (100.0%) | 0 (0.0%) |
| Construction & Extraction | 3,041 (96.0%) | 126 (4.0%) |
| Installation, Maintenance & Repair | 1,296 (97.3%) | 36 (2.7%) |
| Total (Category) | 4,371 (96.4%) | 162 (3.6%) |
| Total (Overall) | 26,461 (52.7%) | 23,750 (47.3%) |
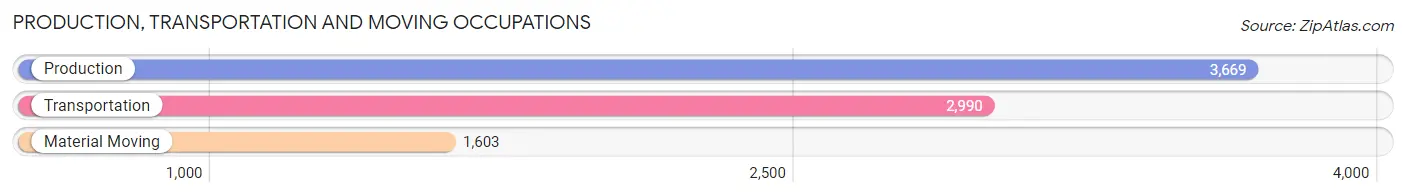
Production, Transportation and Moving Occupations
The most common Production, Transportation and Moving occupations in Lynn are Production (3,669 | 7.3%), Transportation (2,990 | 5.9%), and Material Moving (1,603 | 3.2%).
Production, Transportation and Moving Occupations by Sex
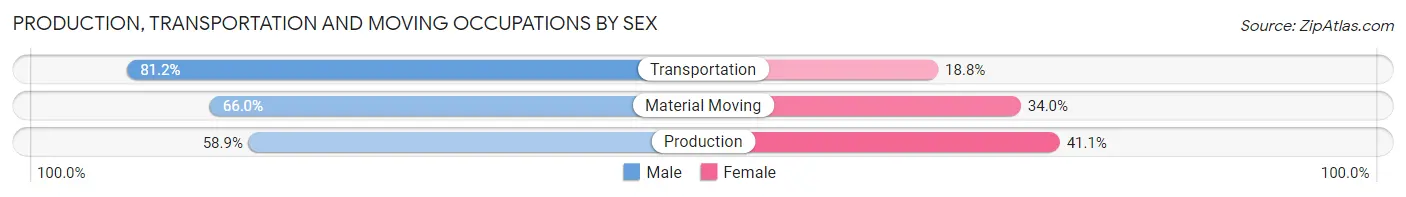
| Occupation | Male | Female |
| Production | 2,160 (58.9%) | 1,509 (41.1%) |
| Transportation | 2,427 (81.2%) | 563 (18.8%) |
| Material Moving | 1,058 (66.0%) | 545 (34.0%) |
| Total (Category) | 5,645 (68.3%) | 2,617 (31.7%) |
| Total (Overall) | 26,461 (52.7%) | 23,750 (47.3%) |
Employment Industries by Sex in Lynn
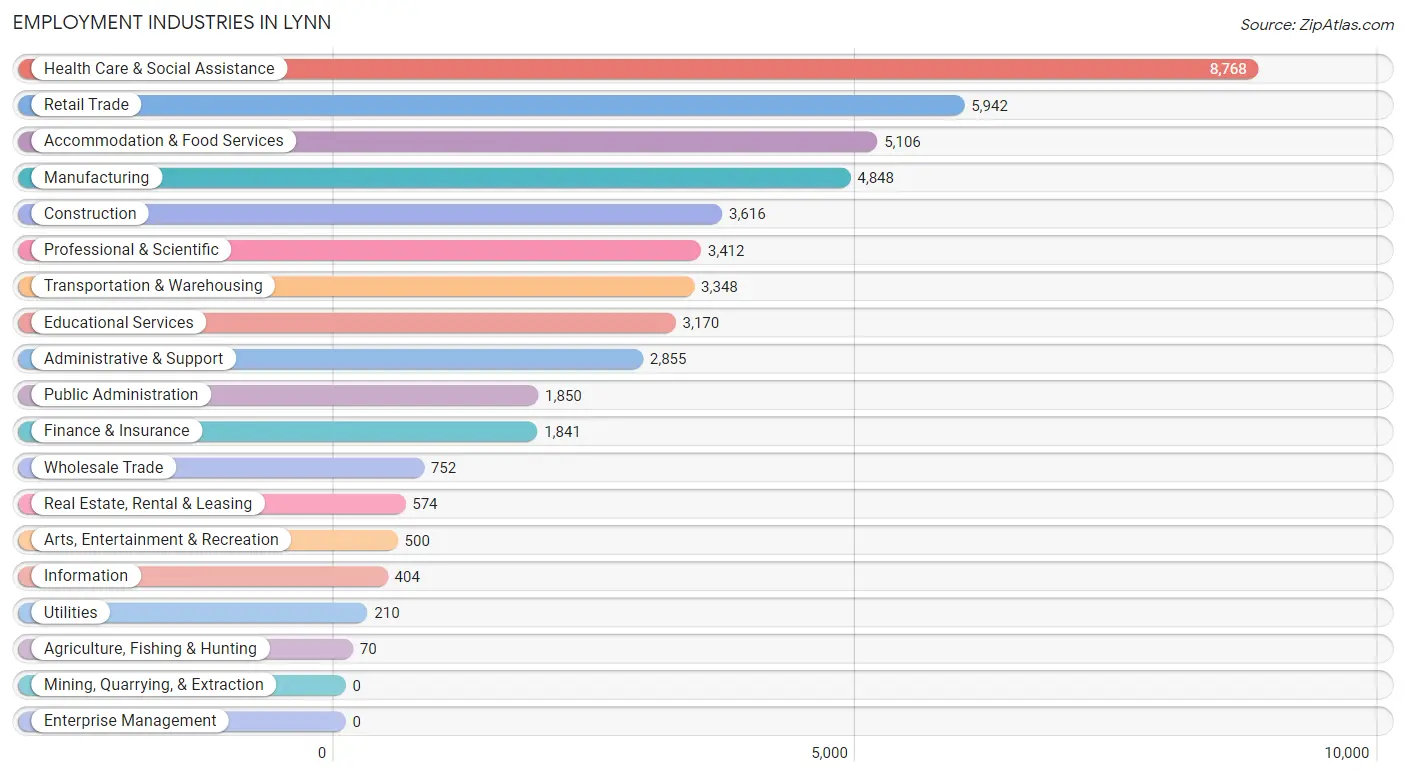
Employment Industries in Lynn
The major employment industries in Lynn include Health Care & Social Assistance (8,768 | 17.5%), Retail Trade (5,942 | 11.8%), Accommodation & Food Services (5,106 | 10.2%), Manufacturing (4,848 | 9.7%), and Construction (3,616 | 7.2%).
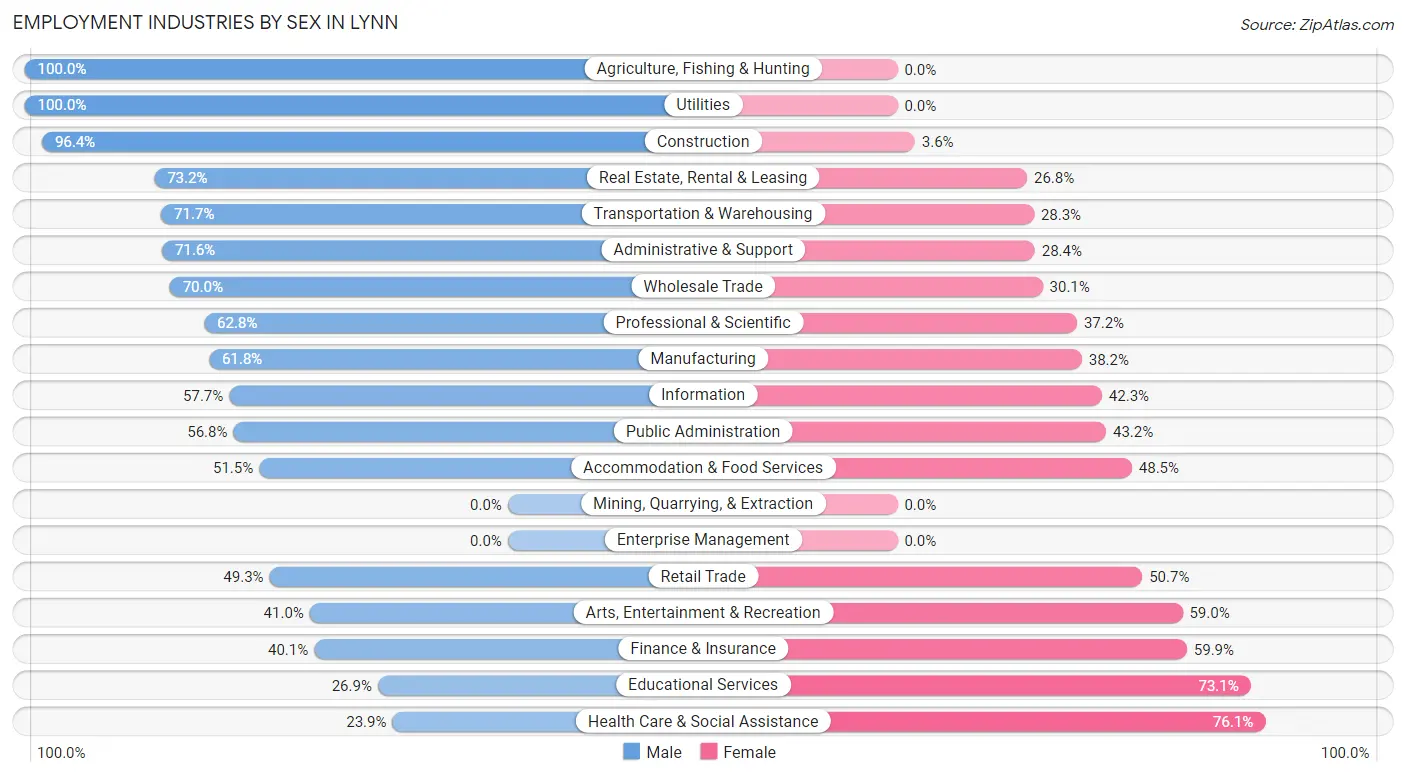
Employment Industries by Sex in Lynn
The Lynn industries that see more men than women are Agriculture, Fishing & Hunting (100.0%), Utilities (100.0%), and Construction (96.4%), whereas the industries that tend to have a higher number of women are Health Care & Social Assistance (76.1%), Educational Services (73.1%), and Finance & Insurance (59.9%).
| Industry | Male | Female |
| Agriculture, Fishing & Hunting | 70 (100.0%) | 0 (0.0%) |
| Mining, Quarrying, & Extraction | 0 (0.0%) | 0 (0.0%) |
| Construction | 3,486 (96.4%) | 130 (3.6%) |
| Manufacturing | 2,998 (61.8%) | 1,850 (38.2%) |
| Wholesale Trade | 526 (70.0%) | 226 (30.0%) |
| Retail Trade | 2,931 (49.3%) | 3,011 (50.7%) |
| Transportation & Warehousing | 2,402 (71.7%) | 946 (28.3%) |
| Utilities | 210 (100.0%) | 0 (0.0%) |
| Information | 233 (57.7%) | 171 (42.3%) |
| Finance & Insurance | 738 (40.1%) | 1,103 (59.9%) |
| Real Estate, Rental & Leasing | 420 (73.2%) | 154 (26.8%) |
| Professional & Scientific | 2,144 (62.8%) | 1,268 (37.2%) |
| Enterprise Management | 0 (0.0%) | 0 (0.0%) |
| Administrative & Support | 2,043 (71.6%) | 812 (28.4%) |
| Educational Services | 853 (26.9%) | 2,317 (73.1%) |
| Health Care & Social Assistance | 2,095 (23.9%) | 6,673 (76.1%) |
| Arts, Entertainment & Recreation | 205 (41.0%) | 295 (59.0%) |
| Accommodation & Food Services | 2,628 (51.5%) | 2,478 (48.5%) |
| Public Administration | 1,051 (56.8%) | 799 (43.2%) |
| Total | 26,461 (52.7%) | 23,750 (47.3%) |
Education in Lynn
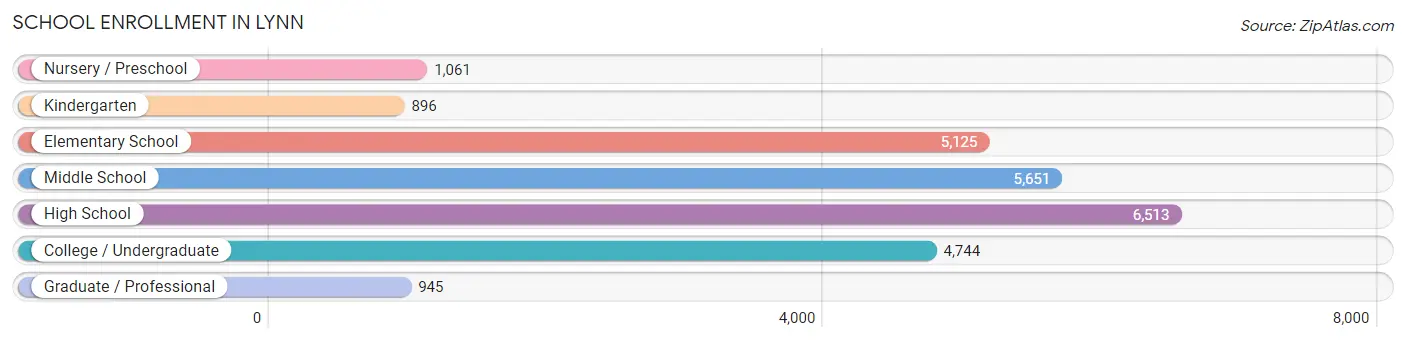
School Enrollment in Lynn
The most common levels of schooling among the 24,935 students in Lynn are high school (6,513 | 26.1%), middle school (5,651 | 22.7%), and elementary school (5,125 | 20.5%).
| School Level | # Students | % Students |
| Nursery / Preschool | 1,061 | 4.3% |
| Kindergarten | 896 | 3.6% |
| Elementary School | 5,125 | 20.5% |
| Middle School | 5,651 | 22.7% |
| High School | 6,513 | 26.1% |
| College / Undergraduate | 4,744 | 19.0% |
| Graduate / Professional | 945 | 3.8% |
| Total | 24,935 | 100.0% |
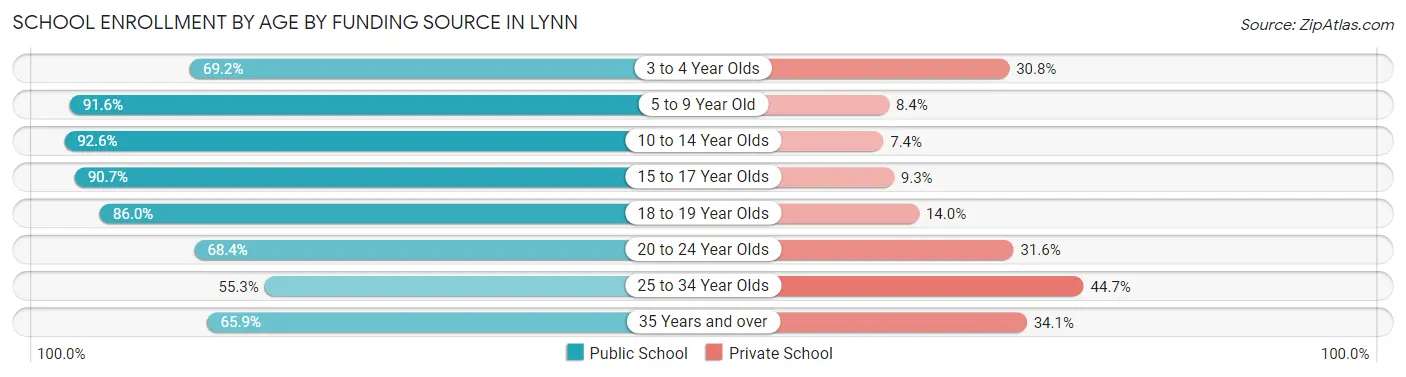
School Enrollment by Age by Funding Source in Lynn
Out of a total of 24,935 students who are enrolled in schools in Lynn, 3,815 (15.3%) attend a private institution, while the remaining 21,120 (84.7%) are enrolled in public schools. The age group of 25 to 34 year olds has the highest likelihood of being enrolled in private schools, with 675 (44.7% in the age bracket) enrolled. Conversely, the age group of 10 to 14 year olds has the lowest likelihood of being enrolled in a private school, with 6,137 (92.6% in the age bracket) attending a public institution.
| Age Bracket | Public School | Private School |
| 3 to 4 Year Olds | 424 (69.2%) | 189 (30.8%) |
| 5 to 9 Year Old | 5,255 (91.6%) | 484 (8.4%) |
| 10 to 14 Year Olds | 6,137 (92.6%) | 489 (7.4%) |
| 15 to 17 Year Olds | 3,980 (90.7%) | 410 (9.3%) |
| 18 to 19 Year Olds | 1,912 (86.0%) | 312 (14.0%) |
| 20 to 24 Year Olds | 1,698 (68.4%) | 786 (31.6%) |
| 25 to 34 Year Olds | 835 (55.3%) | 675 (44.7%) |
| 35 Years and over | 889 (65.9%) | 460 (34.1%) |
| Total | 21,120 (84.7%) | 3,815 (15.3%) |
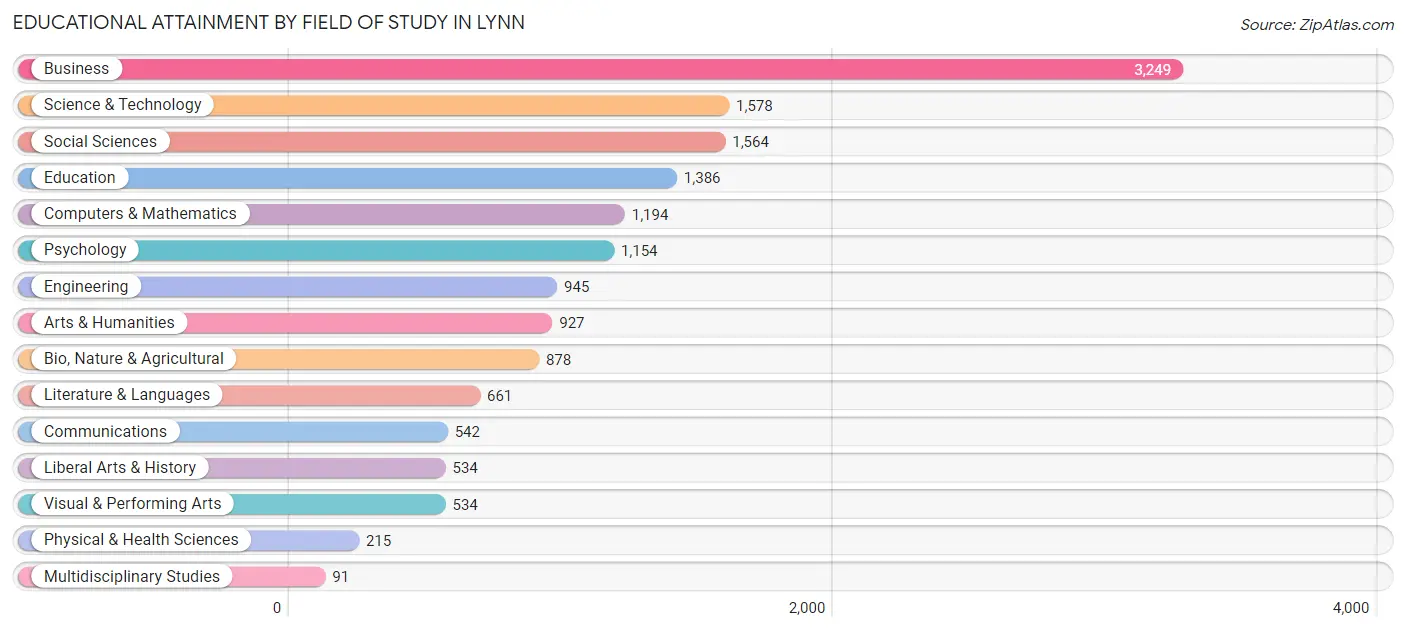
Educational Attainment by Field of Study in Lynn
Business (3,249 | 21.0%), science & technology (1,578 | 10.2%), social sciences (1,564 | 10.1%), education (1,386 | 9.0%), and computers & mathematics (1,194 | 7.7%) are the most common fields of study among 15,452 individuals in Lynn who have obtained a bachelor's degree or higher.
| Field of Study | # Graduates | % Graduates |
| Computers & Mathematics | 1,194 | 7.7% |
| Bio, Nature & Agricultural | 878 | 5.7% |
| Physical & Health Sciences | 215 | 1.4% |
| Psychology | 1,154 | 7.5% |
| Social Sciences | 1,564 | 10.1% |
| Engineering | 945 | 6.1% |
| Multidisciplinary Studies | 91 | 0.6% |
| Science & Technology | 1,578 | 10.2% |
| Business | 3,249 | 21.0% |
| Education | 1,386 | 9.0% |
| Literature & Languages | 661 | 4.3% |
| Liberal Arts & History | 534 | 3.5% |
| Visual & Performing Arts | 534 | 3.5% |
| Communications | 542 | 3.5% |
| Arts & Humanities | 927 | 6.0% |
| Total | 15,452 | 100.0% |
Transportation & Commute in Lynn
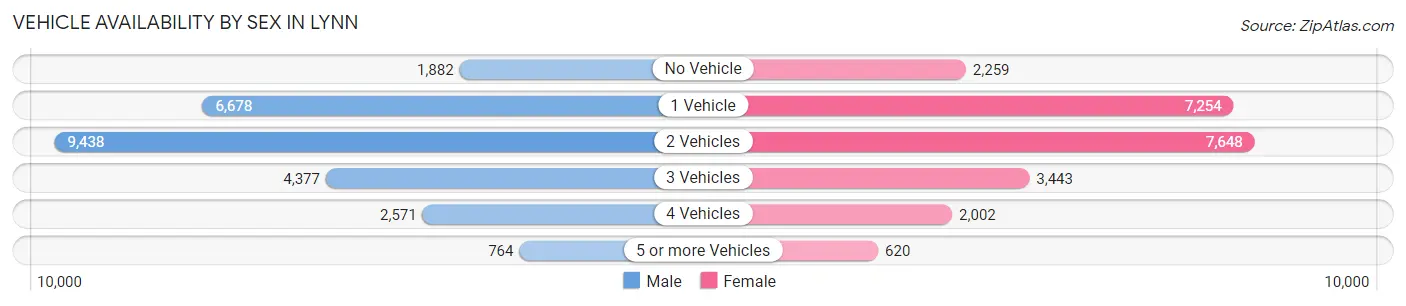
Vehicle Availability by Sex in Lynn
The most prevalent vehicle ownership categories in Lynn are males with 2 vehicles (9,438, accounting for 36.7%) and females with 2 vehicles (7,648, making up 40.6%).
| Vehicles Available | Male | Female |
| No Vehicle | 1,882 (7.3%) | 2,259 (9.7%) |
| 1 Vehicle | 6,678 (26.0%) | 7,254 (31.2%) |
| 2 Vehicles | 9,438 (36.7%) | 7,648 (32.9%) |
| 3 Vehicles | 4,377 (17.0%) | 3,443 (14.8%) |
| 4 Vehicles | 2,571 (10.0%) | 2,002 (8.6%) |
| 5 or more Vehicles | 764 (3.0%) | 620 (2.7%) |
| Total | 25,710 (100.0%) | 23,226 (100.0%) |
Commute Time in Lynn
The most frequently occuring commute durations in Lynn are 30 to 34 minutes (8,128 commuters, 17.7%), 20 to 24 minutes (6,792 commuters, 14.8%), and 10 to 14 minutes (5,539 commuters, 12.0%).
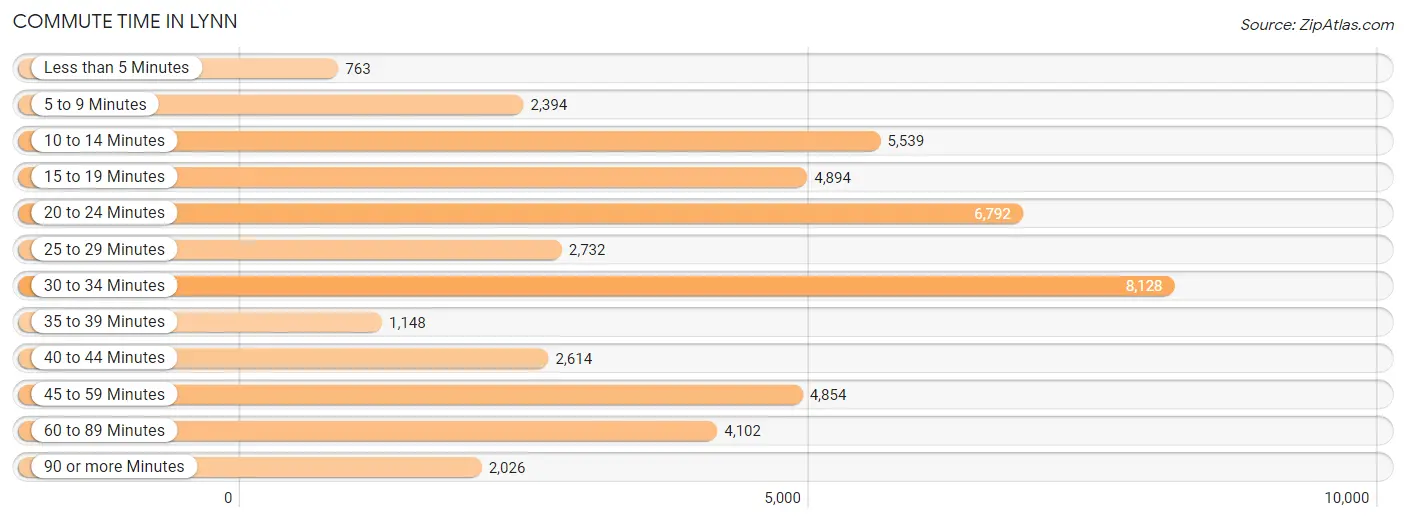
| Commute Time | # Commuters | % Commuters |
| Less than 5 Minutes | 763 | 1.7% |
| 5 to 9 Minutes | 2,394 | 5.2% |
| 10 to 14 Minutes | 5,539 | 12.0% |
| 15 to 19 Minutes | 4,894 | 10.6% |
| 20 to 24 Minutes | 6,792 | 14.8% |
| 25 to 29 Minutes | 2,732 | 5.9% |
| 30 to 34 Minutes | 8,128 | 17.7% |
| 35 to 39 Minutes | 1,148 | 2.5% |
| 40 to 44 Minutes | 2,614 | 5.7% |
| 45 to 59 Minutes | 4,854 | 10.6% |
| 60 to 89 Minutes | 4,102 | 8.9% |
| 90 or more Minutes | 2,026 | 4.4% |
Commute Time by Sex in Lynn
The most common commute times in Lynn are 30 to 34 minutes (3,959 commuters, 16.3%) for males and 30 to 34 minutes (4,169 commuters, 19.2%) for females.
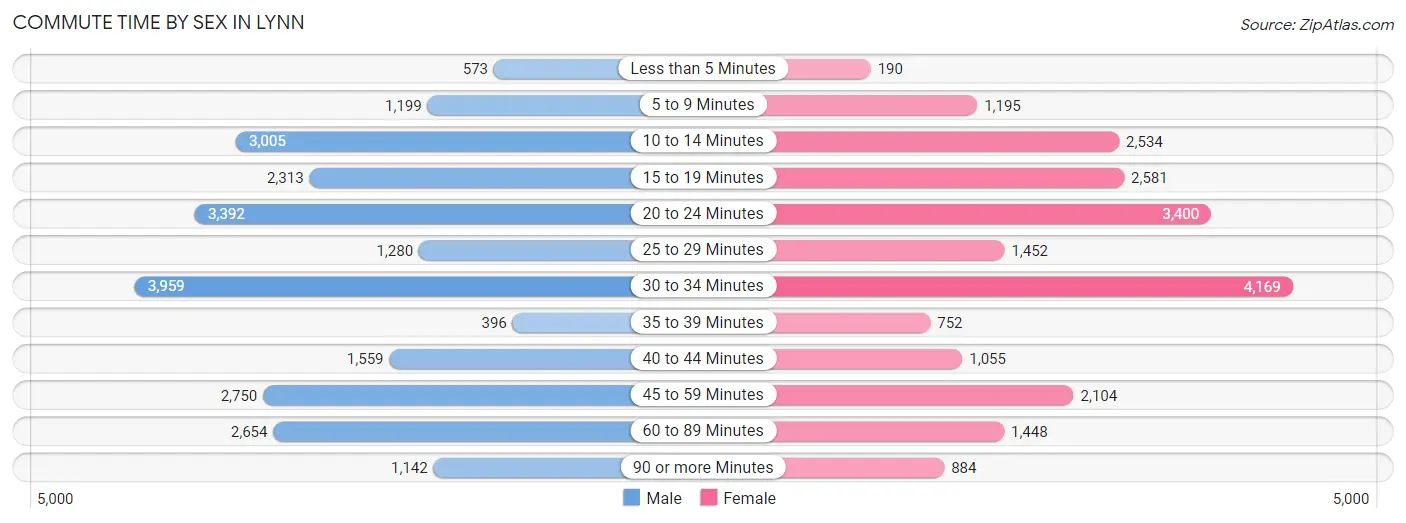
| Commute Time | Male | Female |
| Less than 5 Minutes | 573 (2.4%) | 190 (0.9%) |
| 5 to 9 Minutes | 1,199 (5.0%) | 1,195 (5.5%) |
| 10 to 14 Minutes | 3,005 (12.4%) | 2,534 (11.6%) |
| 15 to 19 Minutes | 2,313 (9.6%) | 2,581 (11.9%) |
| 20 to 24 Minutes | 3,392 (14.0%) | 3,400 (15.6%) |
| 25 to 29 Minutes | 1,280 (5.3%) | 1,452 (6.7%) |
| 30 to 34 Minutes | 3,959 (16.3%) | 4,169 (19.2%) |
| 35 to 39 Minutes | 396 (1.6%) | 752 (3.5%) |
| 40 to 44 Minutes | 1,559 (6.4%) | 1,055 (4.9%) |
| 45 to 59 Minutes | 2,750 (11.4%) | 2,104 (9.7%) |
| 60 to 89 Minutes | 2,654 (11.0%) | 1,448 (6.7%) |
| 90 or more Minutes | 1,142 (4.7%) | 884 (4.1%) |
Time of Departure to Work by Sex in Lynn
The most frequent times of departure to work in Lynn are 6:00 AM to 6:29 AM (3,280, 13.5%) for males and 7:00 AM to 7:29 AM (3,244, 14.9%) for females.
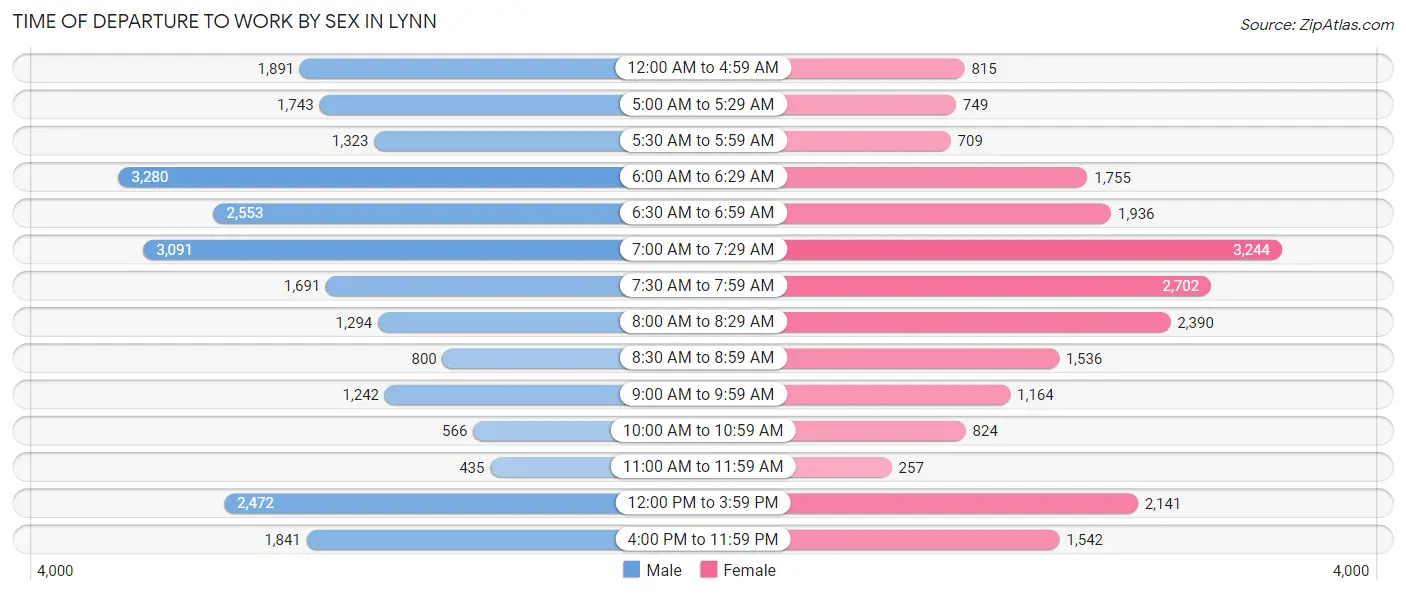
| Time of Departure | Male | Female |
| 12:00 AM to 4:59 AM | 1,891 (7.8%) | 815 (3.7%) |
| 5:00 AM to 5:29 AM | 1,743 (7.2%) | 749 (3.4%) |
| 5:30 AM to 5:59 AM | 1,323 (5.5%) | 709 (3.3%) |
| 6:00 AM to 6:29 AM | 3,280 (13.5%) | 1,755 (8.1%) |
| 6:30 AM to 6:59 AM | 2,553 (10.5%) | 1,936 (8.9%) |
| 7:00 AM to 7:29 AM | 3,091 (12.8%) | 3,244 (14.9%) |
| 7:30 AM to 7:59 AM | 1,691 (7.0%) | 2,702 (12.4%) |
| 8:00 AM to 8:29 AM | 1,294 (5.3%) | 2,390 (11.0%) |
| 8:30 AM to 8:59 AM | 800 (3.3%) | 1,536 (7.1%) |
| 9:00 AM to 9:59 AM | 1,242 (5.1%) | 1,164 (5.3%) |
| 10:00 AM to 10:59 AM | 566 (2.3%) | 824 (3.8%) |
| 11:00 AM to 11:59 AM | 435 (1.8%) | 257 (1.2%) |
| 12:00 PM to 3:59 PM | 2,472 (10.2%) | 2,141 (9.8%) |
| 4:00 PM to 11:59 PM | 1,841 (7.6%) | 1,542 (7.1%) |
| Total | 24,222 (100.0%) | 21,764 (100.0%) |
Housing Occupancy in Lynn
Occupancy by Ownership in Lynn
Of the total 35,915 dwellings in Lynn, owner-occupied units account for 17,439 (48.6%), while renter-occupied units make up 18,476 (51.4%).
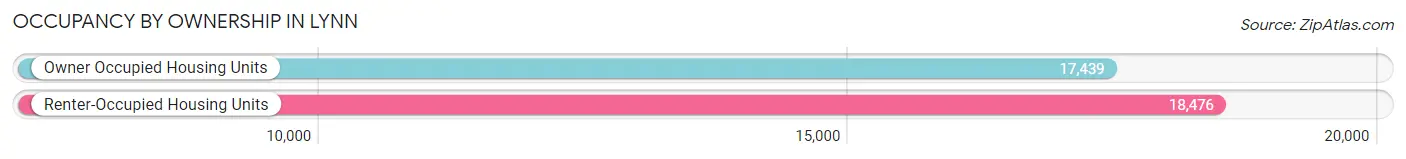
| Occupancy | # Housing Units | % Housing Units |
| Owner Occupied Housing Units | 17,439 | 48.6% |
| Renter-Occupied Housing Units | 18,476 | 51.4% |
| Total Occupied Housing Units | 35,915 | 100.0% |
Occupancy by Household Size in Lynn
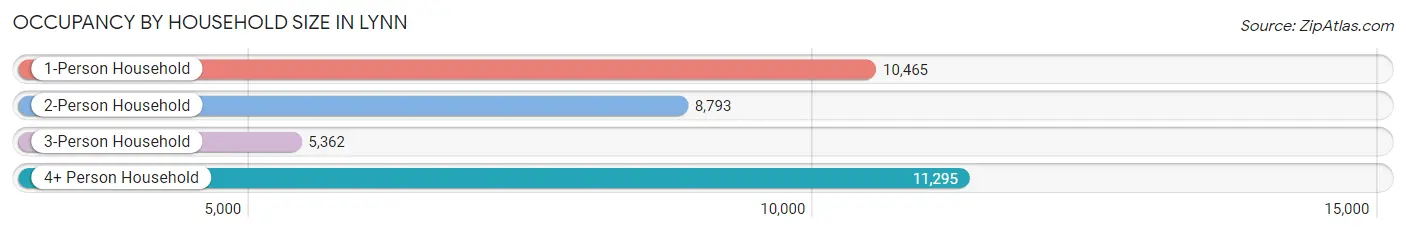
| Household Size | # Housing Units | % Housing Units |
| 1-Person Household | 10,465 | 29.1% |
| 2-Person Household | 8,793 | 24.5% |
| 3-Person Household | 5,362 | 14.9% |
| 4+ Person Household | 11,295 | 31.5% |
| Total Housing Units | 35,915 | 100.0% |
Occupancy by Ownership by Household Size in Lynn
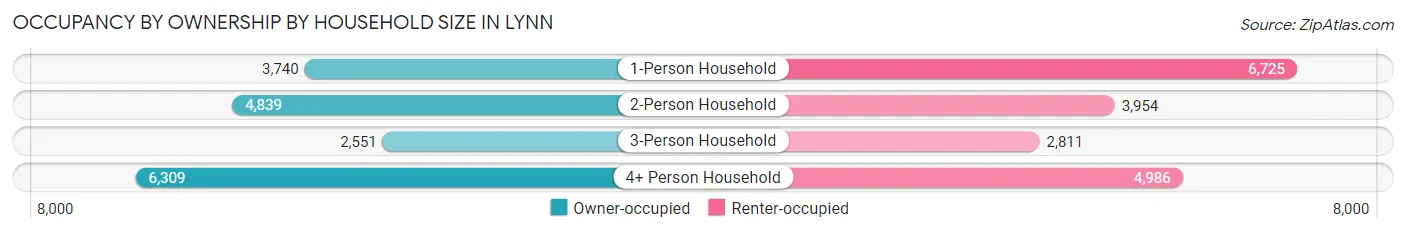
| Household Size | Owner-occupied | Renter-occupied |
| 1-Person Household | 3,740 (35.7%) | 6,725 (64.3%) |
| 2-Person Household | 4,839 (55.0%) | 3,954 (45.0%) |
| 3-Person Household | 2,551 (47.6%) | 2,811 (52.4%) |
| 4+ Person Household | 6,309 (55.9%) | 4,986 (44.1%) |
| Total Housing Units | 17,439 (48.6%) | 18,476 (51.4%) |
Occupancy by Educational Attainment in Lynn
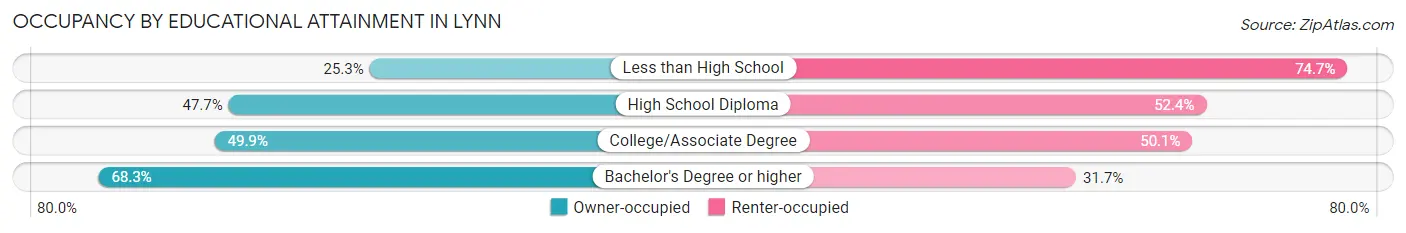
| Household Size | Owner-occupied | Renter-occupied |
| Less than High School | 1,823 (25.3%) | 5,384 (74.7%) |
| High School Diploma | 4,826 (47.6%) | 5,301 (52.3%) |
| College/Associate Degree | 5,136 (49.9%) | 5,164 (50.1%) |
| Bachelor's Degree or higher | 5,654 (68.3%) | 2,627 (31.7%) |
Occupancy by Age of Householder in Lynn
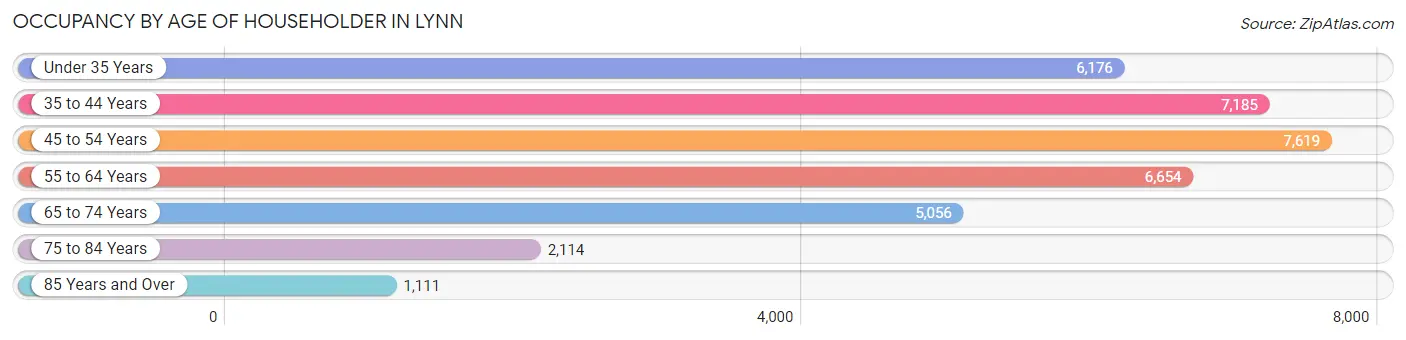
| Age Bracket | # Households | % Households |
| Under 35 Years | 6,176 | 17.2% |
| 35 to 44 Years | 7,185 | 20.0% |
| 45 to 54 Years | 7,619 | 21.2% |
| 55 to 64 Years | 6,654 | 18.5% |
| 65 to 74 Years | 5,056 | 14.1% |
| 75 to 84 Years | 2,114 | 5.9% |
| 85 Years and Over | 1,111 | 3.1% |
| Total | 35,915 | 100.0% |
Housing Finances in Lynn
Median Income by Occupancy in Lynn
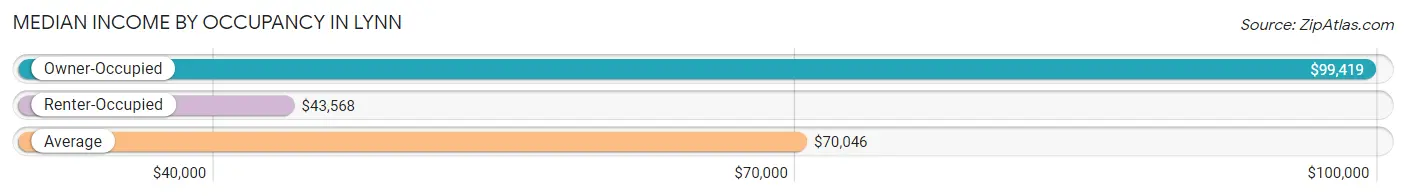
| Occupancy Type | # Households | Median Income |
| Owner-Occupied | 17,439 (48.6%) | $99,419 |
| Renter-Occupied | 18,476 (51.4%) | $43,568 |
| Average | 35,915 (100.0%) | $70,046 |
Occupancy by Householder Income Bracket in Lynn
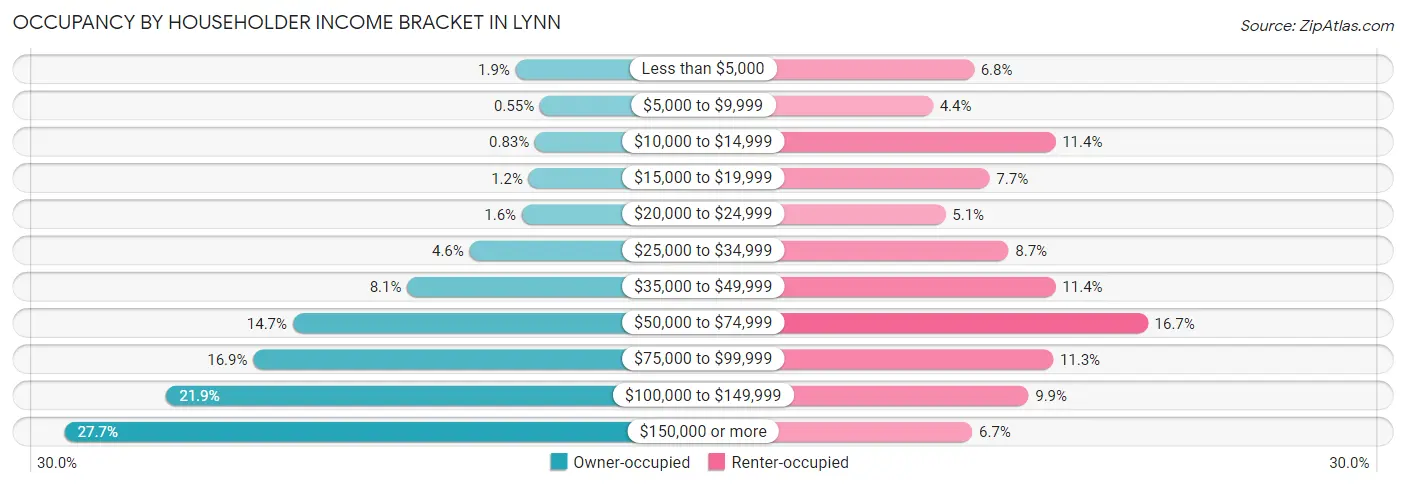
| Income Bracket | Owner-occupied | Renter-occupied |
| Less than $5,000 | 339 (1.9%) | 1,247 (6.8%) |
| $5,000 to $9,999 | 96 (0.5%) | 814 (4.4%) |
| $10,000 to $14,999 | 144 (0.8%) | 2,109 (11.4%) |
| $15,000 to $19,999 | 208 (1.2%) | 1,414 (7.6%) |
| $20,000 to $24,999 | 275 (1.6%) | 948 (5.1%) |
| $25,000 to $34,999 | 797 (4.6%) | 1,613 (8.7%) |
| $35,000 to $49,999 | 1,418 (8.1%) | 2,110 (11.4%) |
| $50,000 to $74,999 | 2,559 (14.7%) | 3,083 (16.7%) |
| $75,000 to $99,999 | 2,952 (16.9%) | 2,084 (11.3%) |
| $100,000 to $149,999 | 3,819 (21.9%) | 1,824 (9.9%) |
| $150,000 or more | 4,832 (27.7%) | 1,230 (6.7%) |
| Total | 17,439 (100.0%) | 18,476 (100.0%) |
Monthly Housing Cost Tiers in Lynn
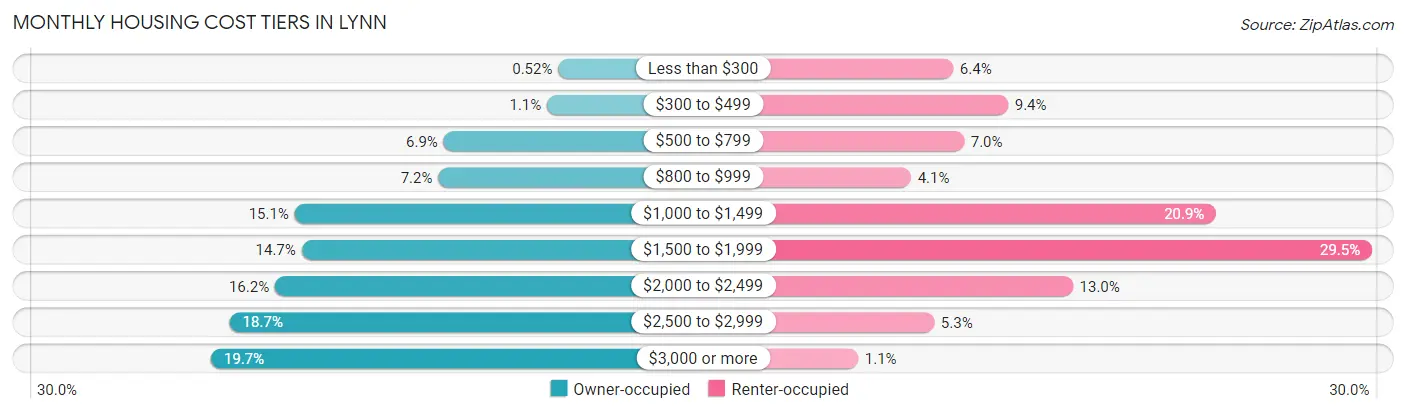
| Monthly Cost | Owner-occupied | Renter-occupied |
| Less than $300 | 90 (0.5%) | 1,178 (6.4%) |
| $300 to $499 | 199 (1.1%) | 1,739 (9.4%) |
| $500 to $799 | 1,195 (6.9%) | 1,289 (7.0%) |
| $800 to $999 | 1,247 (7.1%) | 749 (4.1%) |
| $1,000 to $1,499 | 2,630 (15.1%) | 3,865 (20.9%) |
| $1,500 to $1,999 | 2,564 (14.7%) | 5,456 (29.5%) |
| $2,000 to $2,499 | 2,820 (16.2%) | 2,400 (13.0%) |
| $2,500 to $2,999 | 3,257 (18.7%) | 985 (5.3%) |
| $3,000 or more | 3,437 (19.7%) | 209 (1.1%) |
| Total | 17,439 (100.0%) | 18,476 (100.0%) |
Physical Housing Characteristics in Lynn
Housing Structures in Lynn
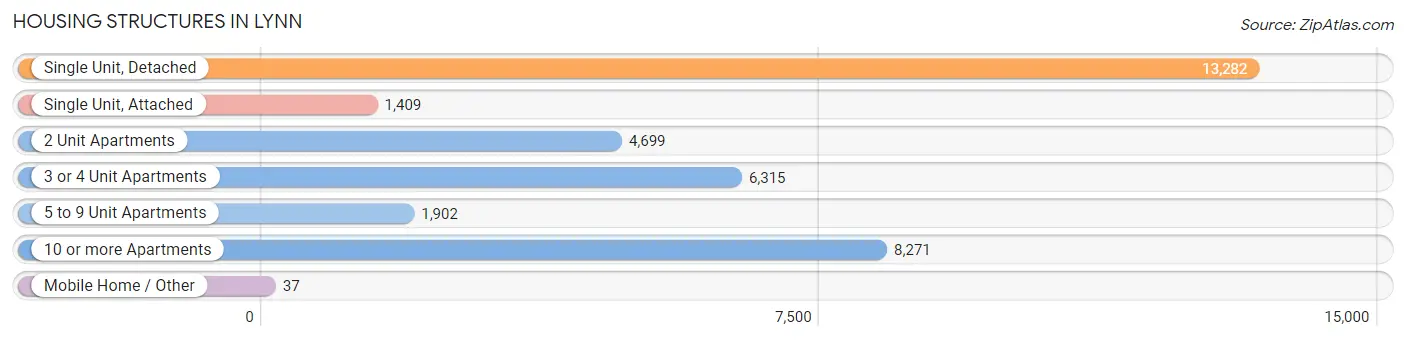
| Structure Type | # Housing Units | % Housing Units |
| Single Unit, Detached | 13,282 | 37.0% |
| Single Unit, Attached | 1,409 | 3.9% |
| 2 Unit Apartments | 4,699 | 13.1% |
| 3 or 4 Unit Apartments | 6,315 | 17.6% |
| 5 to 9 Unit Apartments | 1,902 | 5.3% |
| 10 or more Apartments | 8,271 | 23.0% |
| Mobile Home / Other | 37 | 0.1% |
| Total | 35,915 | 100.0% |
Housing Structures by Occupancy in Lynn
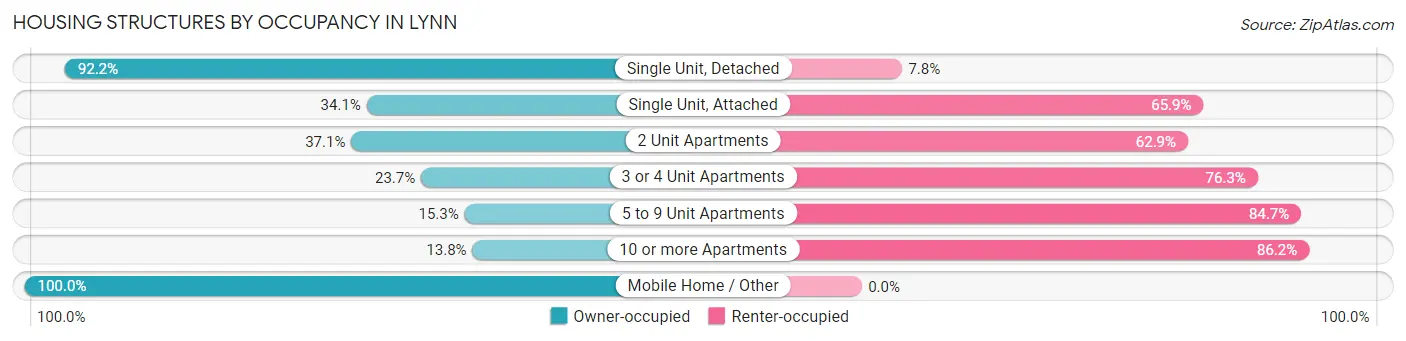
| Structure Type | Owner-occupied | Renter-occupied |
| Single Unit, Detached | 12,251 (92.2%) | 1,031 (7.8%) |
| Single Unit, Attached | 481 (34.1%) | 928 (65.9%) |
| 2 Unit Apartments | 1,744 (37.1%) | 2,955 (62.9%) |
| 3 or 4 Unit Apartments | 1,495 (23.7%) | 4,820 (76.3%) |
| 5 to 9 Unit Apartments | 291 (15.3%) | 1,611 (84.7%) |
| 10 or more Apartments | 1,140 (13.8%) | 7,131 (86.2%) |
| Mobile Home / Other | 37 (100.0%) | 0 (0.0%) |
| Total | 17,439 (48.6%) | 18,476 (51.4%) |
Housing Structures by Number of Rooms in Lynn
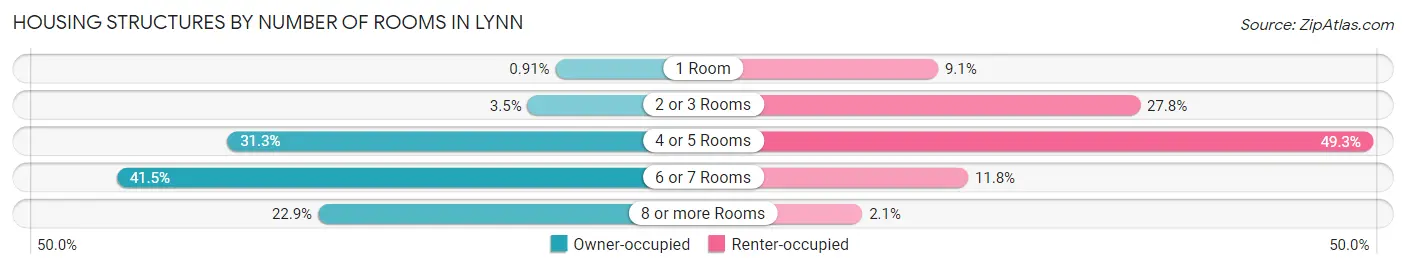
| Number of Rooms | Owner-occupied | Renter-occupied |
| 1 Room | 158 (0.9%) | 1,676 (9.1%) |
| 2 or 3 Rooms | 608 (3.5%) | 5,129 (27.8%) |
| 4 or 5 Rooms | 5,451 (31.3%) | 9,103 (49.3%) |
| 6 or 7 Rooms | 7,234 (41.5%) | 2,188 (11.8%) |
| 8 or more Rooms | 3,988 (22.9%) | 380 (2.1%) |
| Total | 17,439 (100.0%) | 18,476 (100.0%) |
Housing Structure by Heating Type in Lynn
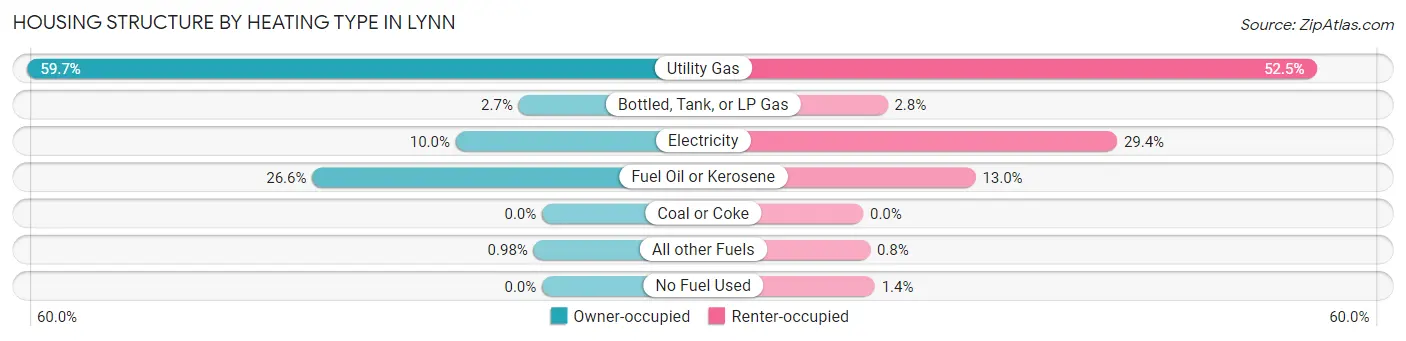
| Heating Type | Owner-occupied | Renter-occupied |
| Utility Gas | 10,405 (59.7%) | 9,708 (52.5%) |
| Bottled, Tank, or LP Gas | 472 (2.7%) | 523 (2.8%) |
| Electricity | 1,745 (10.0%) | 5,440 (29.4%) |
| Fuel Oil or Kerosene | 4,646 (26.6%) | 2,408 (13.0%) |
| Coal or Coke | 0 (0.0%) | 0 (0.0%) |
| All other Fuels | 171 (1.0%) | 147 (0.8%) |
| No Fuel Used | 0 (0.0%) | 250 (1.3%) |
| Total | 17,439 (100.0%) | 18,476 (100.0%) |
Household Vehicle Usage in Lynn
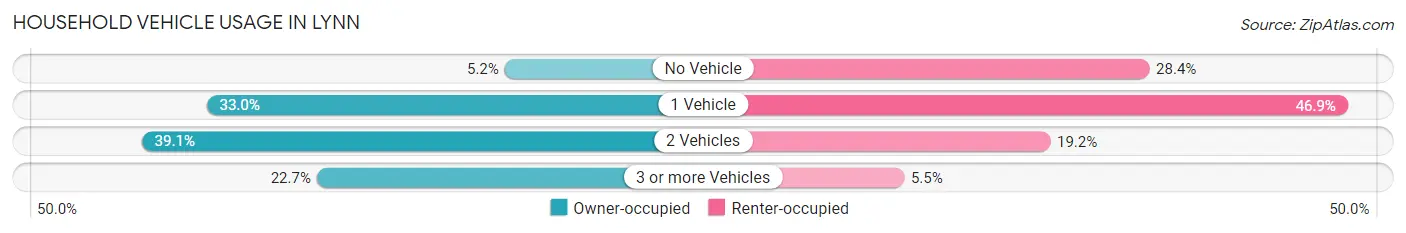
| Vehicles per Household | Owner-occupied | Renter-occupied |
| No Vehicle | 905 (5.2%) | 5,248 (28.4%) |
| 1 Vehicle | 5,756 (33.0%) | 8,671 (46.9%) |
| 2 Vehicles | 6,814 (39.1%) | 3,539 (19.2%) |
| 3 or more Vehicles | 3,964 (22.7%) | 1,018 (5.5%) |
| Total | 17,439 (100.0%) | 18,476 (100.0%) |
Real Estate & Mortgages in Lynn
Real Estate and Mortgage Overview in Lynn
| Characteristic | Without Mortgage | With Mortgage |
| Housing Units | 4,179 | 13,260 |
| Median Property Value | $433,600 | $446,400 |
| Median Household Income | $80,928 | $3,944 |
| Monthly Housing Costs | $950 | $3,420 |
| Real Estate Taxes | $5,046 | $327 |
Property Value by Mortgage Status in Lynn
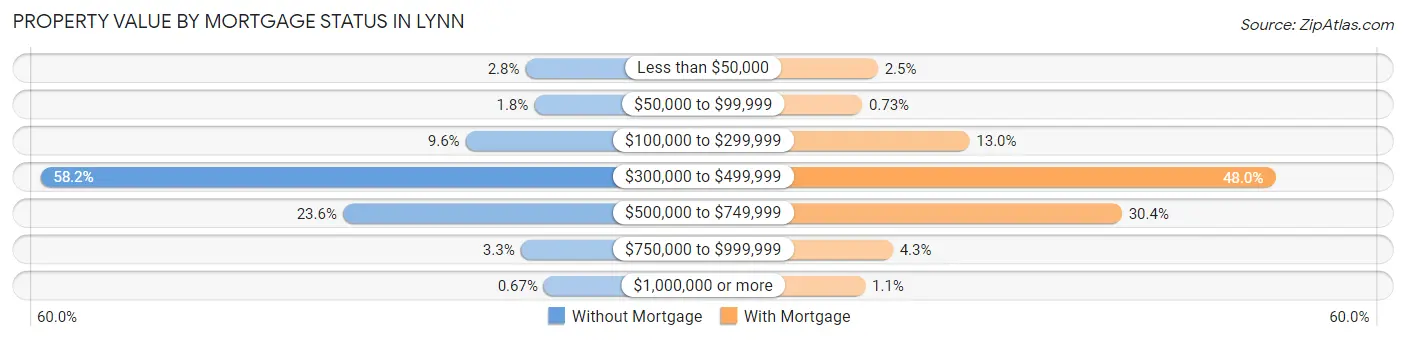
| Property Value | Without Mortgage | With Mortgage |
| Less than $50,000 | 116 (2.8%) | 335 (2.5%) |
| $50,000 to $99,999 | 74 (1.8%) | 97 (0.7%) |
| $100,000 to $299,999 | 402 (9.6%) | 1,725 (13.0%) |
| $300,000 to $499,999 | 2,432 (58.2%) | 6,360 (48.0%) |
| $500,000 to $749,999 | 988 (23.6%) | 4,034 (30.4%) |
| $750,000 to $999,999 | 139 (3.3%) | 564 (4.3%) |
| $1,000,000 or more | 28 (0.7%) | 145 (1.1%) |
| Total | 4,179 (100.0%) | 13,260 (100.0%) |
Household Income by Mortgage Status in Lynn
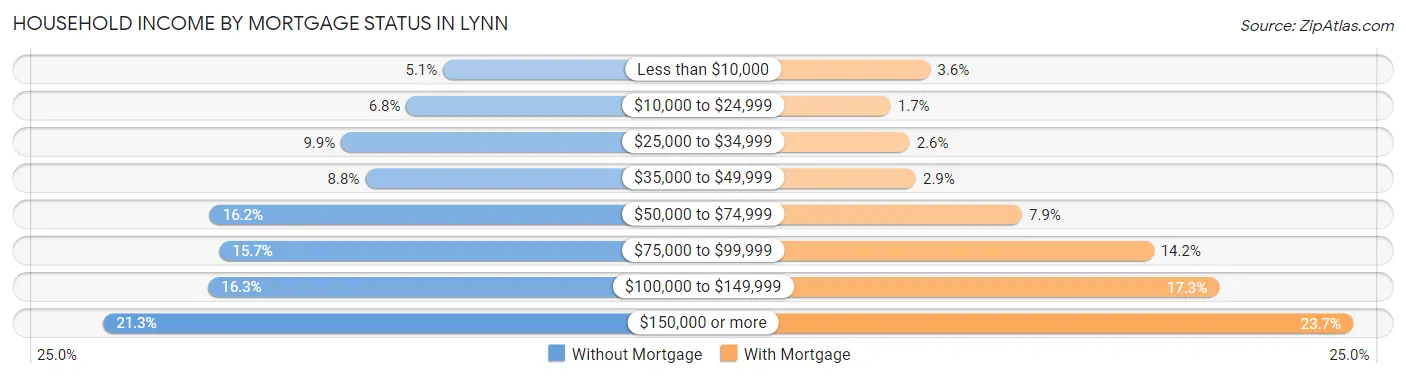
| Household Income | Without Mortgage | With Mortgage |
| Less than $10,000 | 212 (5.1%) | 473 (3.6%) |
| $10,000 to $24,999 | 285 (6.8%) | 223 (1.7%) |
| $25,000 to $34,999 | 415 (9.9%) | 342 (2.6%) |
| $35,000 to $49,999 | 367 (8.8%) | 382 (2.9%) |
| $50,000 to $74,999 | 676 (16.2%) | 1,051 (7.9%) |
| $75,000 to $99,999 | 657 (15.7%) | 1,883 (14.2%) |
| $100,000 to $149,999 | 679 (16.3%) | 2,295 (17.3%) |
| $150,000 or more | 888 (21.2%) | 3,140 (23.7%) |
| Total | 4,179 (100.0%) | 13,260 (100.0%) |
Property Value to Household Income Ratio in Lynn
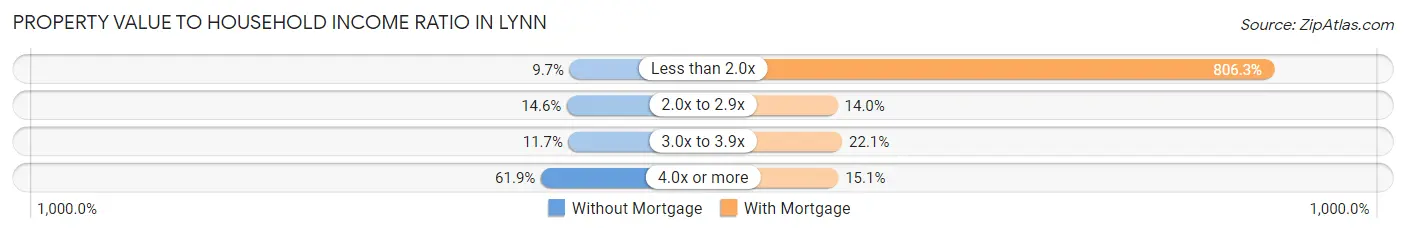
| Value-to-Income Ratio | Without Mortgage | With Mortgage |
| Less than 2.0x | 405 (9.7%) | 106,916 (806.3%) |
| 2.0x to 2.9x | 610 (14.6%) | 1,852 (14.0%) |
| 3.0x to 3.9x | 489 (11.7%) | 2,934 (22.1%) |
| 4.0x or more | 2,586 (61.9%) | 2,000 (15.1%) |
| Total | 4,179 (100.0%) | 13,260 (100.0%) |
Real Estate Taxes by Mortgage Status in Lynn
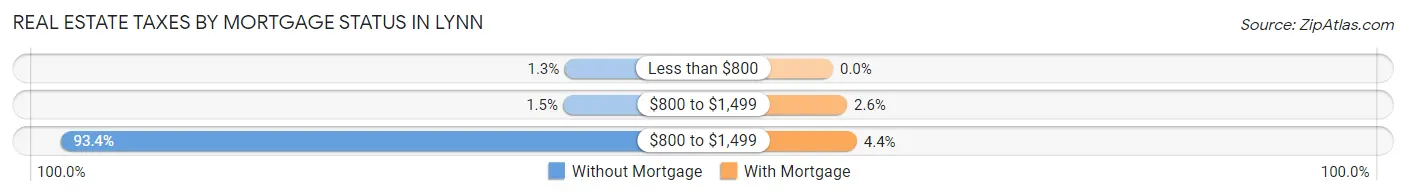
| Property Taxes | Without Mortgage | With Mortgage |
| Less than $800 | 53 (1.3%) | 0 (0.0%) |
| $800 to $1,499 | 63 (1.5%) | 341 (2.6%) |
| $800 to $1,499 | 3,904 (93.4%) | 577 (4.3%) |
| Total | 4,179 (100.0%) | 13,260 (100.0%) |
Health & Disability in Lynn
Health Insurance Coverage by Age in Lynn
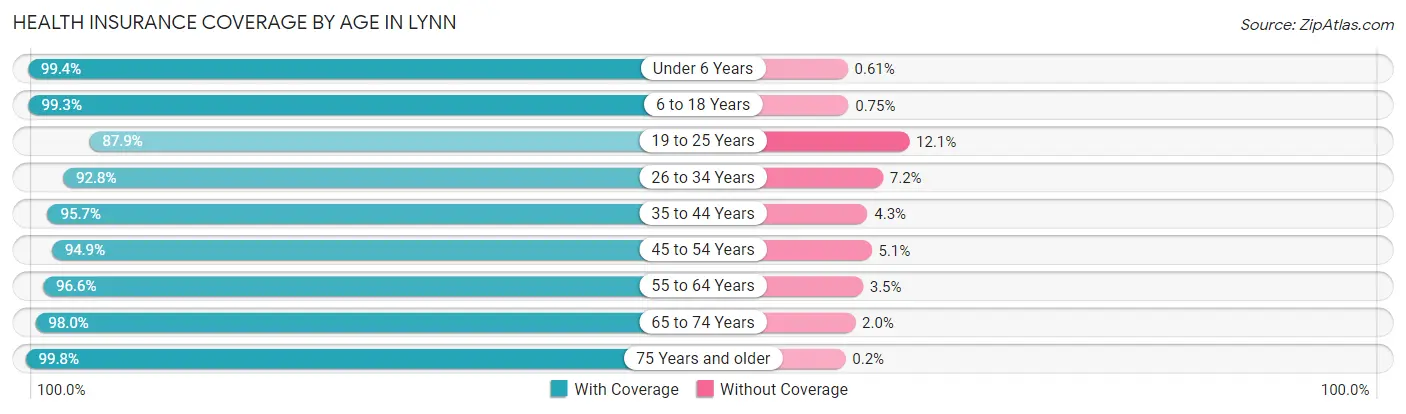
| Age Bracket | With Coverage | Without Coverage |
| Under 6 Years | 7,792 (99.4%) | 48 (0.6%) |
| 6 to 18 Years | 17,911 (99.3%) | 135 (0.7%) |
| 19 to 25 Years | 8,783 (87.9%) | 1,208 (12.1%) |
| 26 to 34 Years | 11,960 (92.8%) | 927 (7.2%) |
| 35 to 44 Years | 13,520 (95.7%) | 607 (4.3%) |
| 45 to 54 Years | 12,561 (94.9%) | 672 (5.1%) |
| 55 to 64 Years | 10,852 (96.6%) | 388 (3.5%) |
| 65 to 74 Years | 7,866 (98.0%) | 162 (2.0%) |
| 75 Years and older | 5,008 (99.8%) | 10 (0.2%) |
| Total | 96,253 (95.9%) | 4,157 (4.1%) |
Health Insurance Coverage by Citizenship Status in Lynn
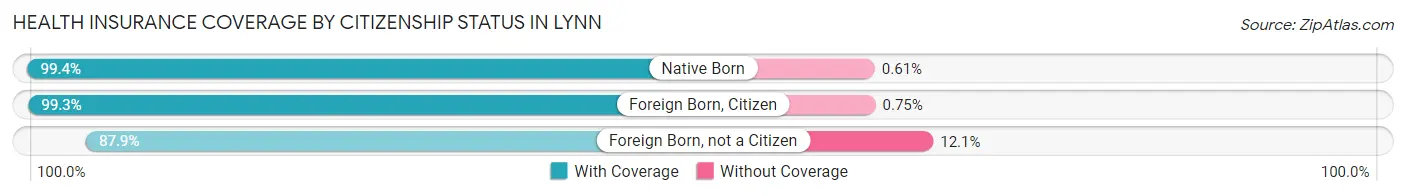
| Citizenship Status | With Coverage | Without Coverage |
| Native Born | 7,792 (99.4%) | 48 (0.6%) |
| Foreign Born, Citizen | 17,911 (99.3%) | 135 (0.7%) |
| Foreign Born, not a Citizen | 8,783 (87.9%) | 1,208 (12.1%) |
Health Insurance Coverage by Household Income in Lynn
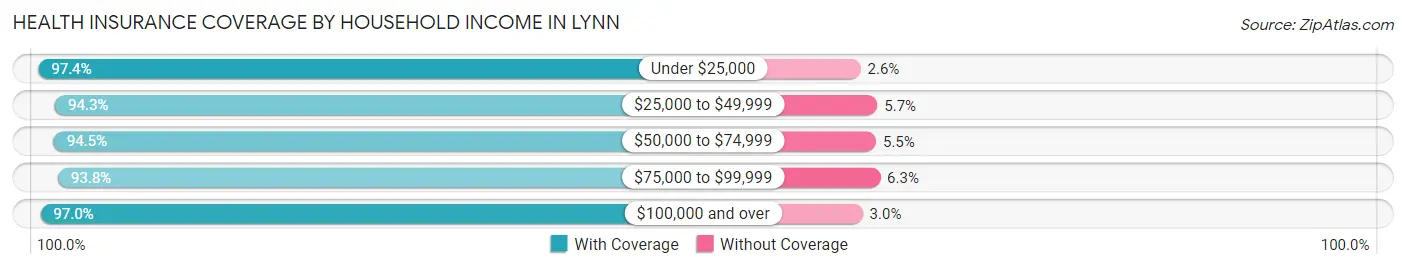
| Household Income | With Coverage | Without Coverage |
| Under $25,000 | 12,368 (97.4%) | 329 (2.6%) |
| $25,000 to $49,999 | 13,648 (94.3%) | 829 (5.7%) |
| $50,000 to $74,999 | 13,821 (94.5%) | 802 (5.5%) |
| $75,000 to $99,999 | 13,459 (93.8%) | 898 (6.2%) |
| $100,000 and over | 42,422 (97.0%) | 1,299 (3.0%) |
Public vs Private Health Insurance Coverage by Age in Lynn
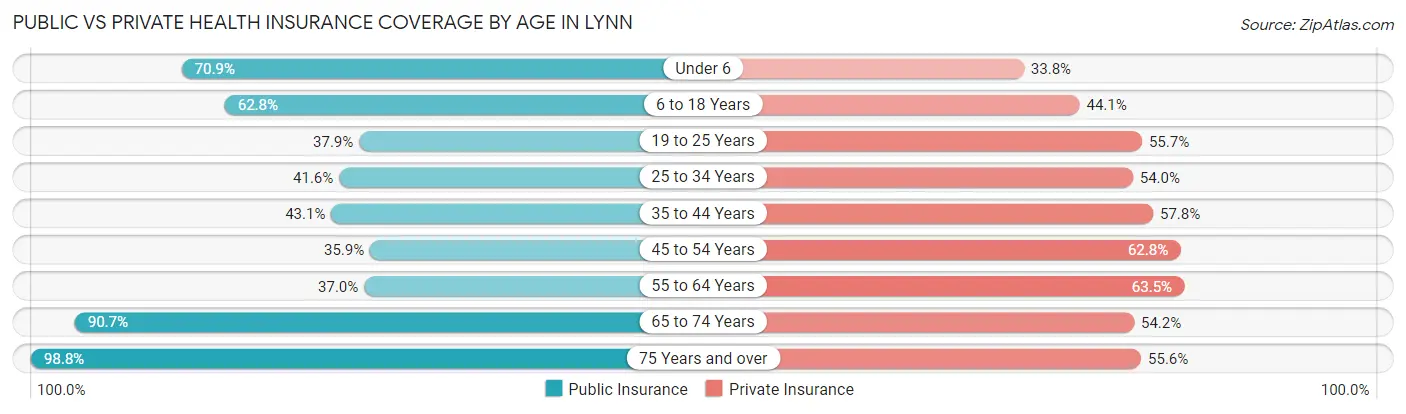
| Age Bracket | Public Insurance | Private Insurance |
| Under 6 | 5,555 (70.9%) | 2,650 (33.8%) |
| 6 to 18 Years | 11,338 (62.8%) | 7,963 (44.1%) |
| 19 to 25 Years | 3,788 (37.9%) | 5,567 (55.7%) |
| 25 to 34 Years | 5,364 (41.6%) | 6,960 (54.0%) |
| 35 to 44 Years | 6,086 (43.1%) | 8,161 (57.8%) |
| 45 to 54 Years | 4,748 (35.9%) | 8,307 (62.8%) |
| 55 to 64 Years | 4,156 (37.0%) | 7,136 (63.5%) |
| 65 to 74 Years | 7,279 (90.7%) | 4,354 (54.2%) |
| 75 Years and over | 4,959 (98.8%) | 2,788 (55.6%) |
| Total | 53,273 (53.1%) | 53,886 (53.7%) |
Disability Status by Sex by Age in Lynn
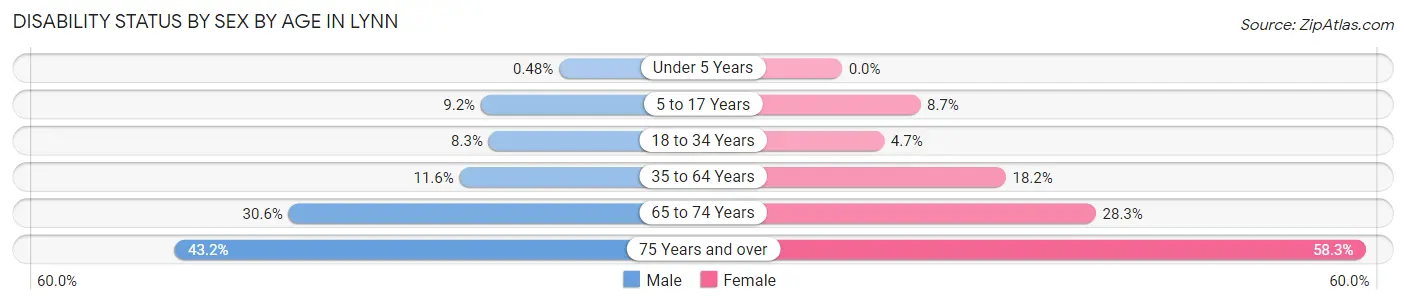
| Age Bracket | Male | Female |
| Under 5 Years | 17 (0.5%) | 0 (0.0%) |
| 5 to 17 Years | 774 (9.2%) | 799 (8.7%) |
| 18 to 34 Years | 1,097 (8.3%) | 537 (4.7%) |
| 35 to 64 Years | 2,235 (11.6%) | 3,515 (18.2%) |
| 65 to 74 Years | 1,154 (30.6%) | 1,203 (28.3%) |
| 75 Years and over | 766 (43.2%) | 1,892 (58.3%) |
Disability Class by Sex by Age in Lynn
Disability Class: Hearing Difficulty
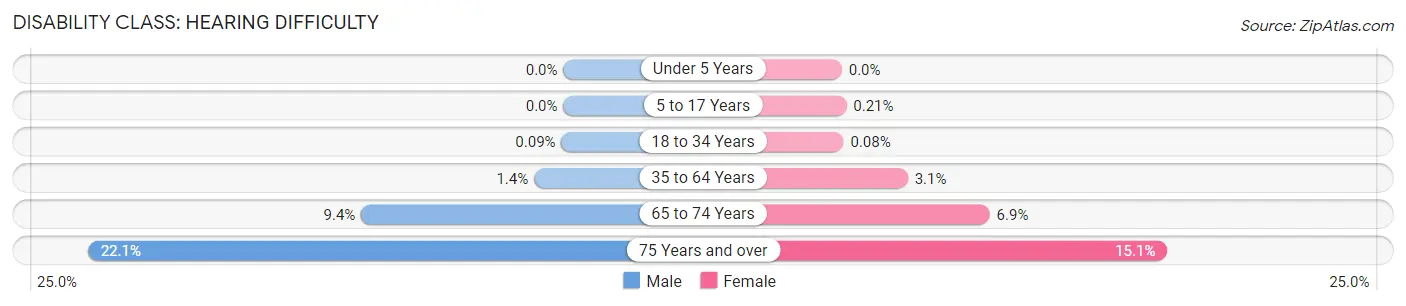
| Age Bracket | Male | Female |
| Under 5 Years | 0 (0.0%) | 0 (0.0%) |
| 5 to 17 Years | 0 (0.0%) | 19 (0.2%) |
| 18 to 34 Years | 12 (0.1%) | 9 (0.1%) |
| 35 to 64 Years | 262 (1.4%) | 589 (3.1%) |
| 65 to 74 Years | 354 (9.4%) | 292 (6.9%) |
| 75 Years and over | 391 (22.1%) | 490 (15.1%) |
Disability Class: Vision Difficulty
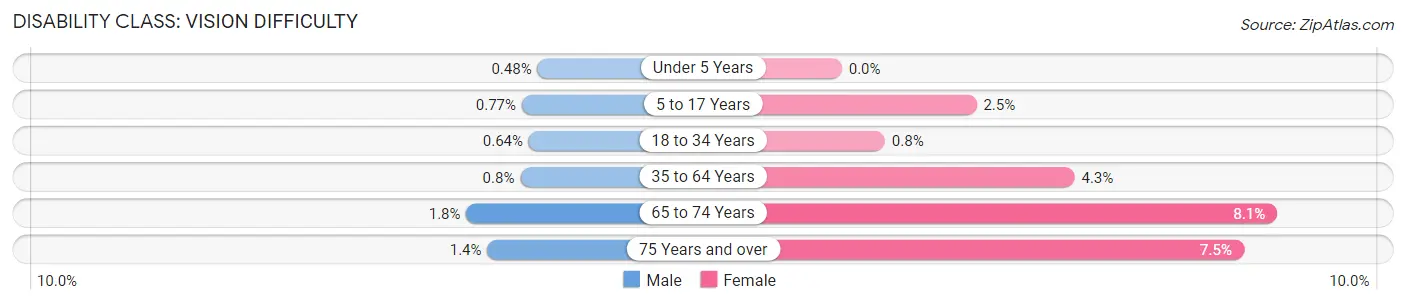
| Age Bracket | Male | Female |
| Under 5 Years | 17 (0.5%) | 0 (0.0%) |
| 5 to 17 Years | 65 (0.8%) | 229 (2.5%) |
| 18 to 34 Years | 85 (0.6%) | 92 (0.8%) |
| 35 to 64 Years | 155 (0.8%) | 833 (4.3%) |
| 65 to 74 Years | 68 (1.8%) | 344 (8.1%) |
| 75 Years and over | 25 (1.4%) | 242 (7.5%) |
Disability Class: Cognitive Difficulty
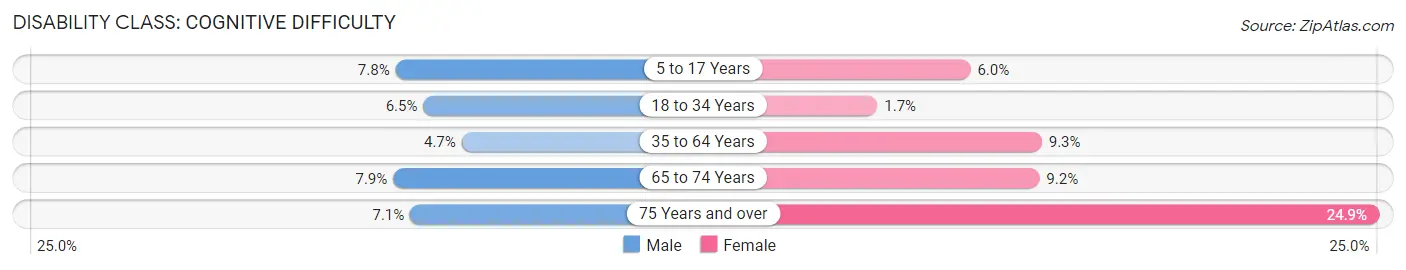
| Age Bracket | Male | Female |
| 5 to 17 Years | 657 (7.8%) | 548 (6.0%) |
| 18 to 34 Years | 858 (6.5%) | 189 (1.7%) |
| 35 to 64 Years | 913 (4.7%) | 1,789 (9.3%) |
| 65 to 74 Years | 298 (7.9%) | 390 (9.2%) |
| 75 Years and over | 126 (7.1%) | 809 (24.9%) |
Disability Class: Ambulatory Difficulty
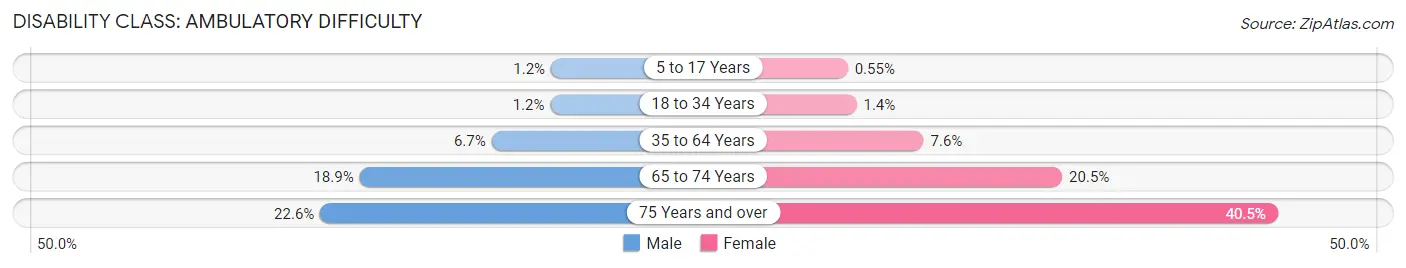
| Age Bracket | Male | Female |
| 5 to 17 Years | 97 (1.1%) | 50 (0.5%) |
| 18 to 34 Years | 160 (1.2%) | 157 (1.4%) |
| 35 to 64 Years | 1,288 (6.7%) | 1,463 (7.6%) |
| 65 to 74 Years | 714 (18.9%) | 870 (20.4%) |
| 75 Years and over | 400 (22.6%) | 1,313 (40.5%) |
Disability Class: Self-Care Difficulty
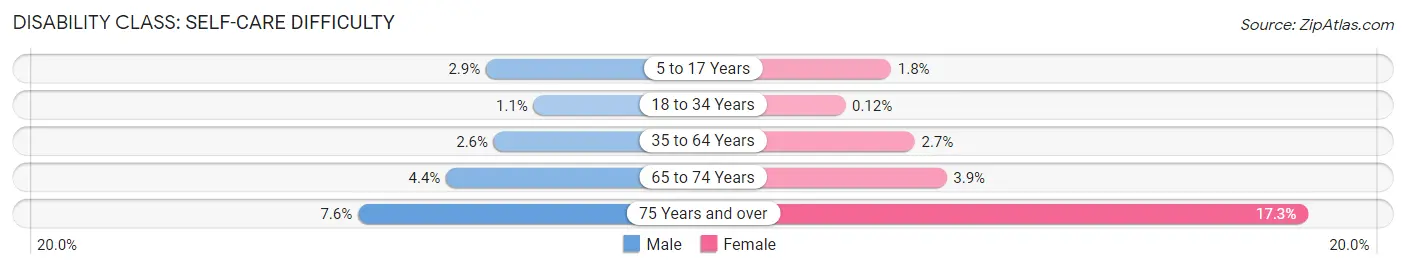
| Age Bracket | Male | Female |
| 5 to 17 Years | 242 (2.9%) | 167 (1.8%) |
| 18 to 34 Years | 145 (1.1%) | 14 (0.1%) |
| 35 to 64 Years | 499 (2.6%) | 521 (2.7%) |
| 65 to 74 Years | 164 (4.3%) | 165 (3.9%) |
| 75 Years and over | 135 (7.6%) | 562 (17.3%) |
Technology Access in Lynn
Computing Device Access in Lynn
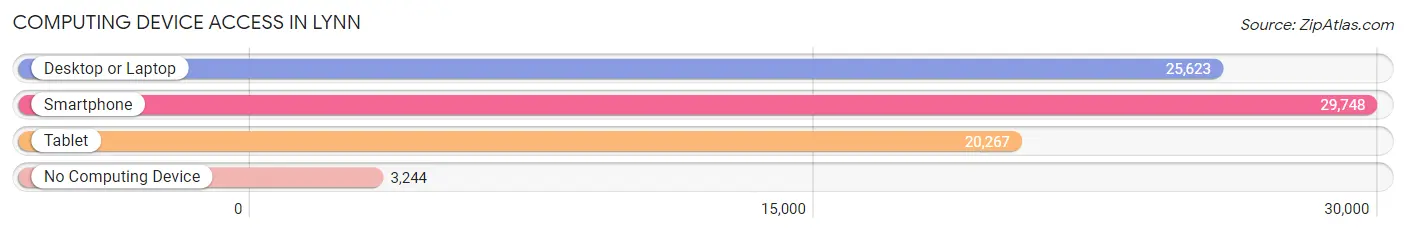
| Device Type | # Households | % Households |
| Desktop or Laptop | 25,623 | 71.3% |
| Smartphone | 29,748 | 82.8% |
| Tablet | 20,267 | 56.4% |
| No Computing Device | 3,244 | 9.0% |
| Total | 35,915 | 100.0% |
Internet Access in Lynn
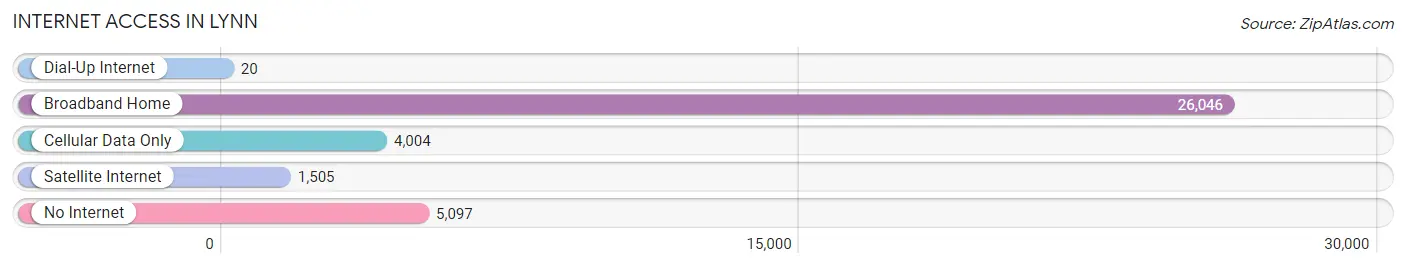
| Internet Type | # Households | % Households |
| Dial-Up Internet | 20 | 0.1% |
| Broadband Home | 26,046 | 72.5% |
| Cellular Data Only | 4,004 | 11.2% |
| Satellite Internet | 1,505 | 4.2% |
| No Internet | 5,097 | 14.2% |
| Total | 35,915 | 100.0% |
Lynn Summary
Lynn, Massachusetts is a city located in Essex County, Massachusetts, United States. It is situated on the Atlantic Ocean, about 10 miles north of Boston. The city has a population of approximately 90,000 people, making it the ninth largest city in the state.
History
Lynn was first settled in 1629 by Europeans, who named it Saugus. The area was originally inhabited by the Naumkeag tribe of the Pawtucket Indians. The town was officially incorporated in 1631 and was renamed Lynn in 1637. The name was chosen in honor of King's Lynn in England.
In the late 19th century, Lynn became a major industrial center, with shoe and leather factories, iron foundries, and other manufacturing businesses. The city was also home to the first public beach in the United States, Revere Beach.
Geography
Lynn is located in eastern Massachusetts, on the Atlantic Ocean. It is bordered by the cities of Salem to the north, Revere to the east, Saugus to the south, and Nahant to the west. The city covers an area of 8.7 square miles, with a population density of 10,000 people per square mile.
The city is divided into several neighborhoods, including Central Square, Diamond District, East Lynn, and West Lynn. The city is also home to several parks, including Lynn Woods Reservation, Lynn Heritage State Park, and Lynn Shore Reservation.
Economy
Lynn's economy is largely based on manufacturing and services. The city is home to several large companies, including General Electric, Honeywell, and Reebok. The city also has a large retail sector, with several shopping malls and outlets.
The city is also home to several educational institutions, including Lynn University, North Shore Community College, and Endicott College.
Demographics
As of the 2010 census, the population of Lynn was 90,329. The racial makeup of the city was 79.3% White, 8.2% African American, 0.3% Native American, 4.2% Asian, 0.1% Pacific Islander, and 6.9% from other races. The median household income was $41,837, and the median family income was $50,919.
The city is home to a large immigrant population, with over 20% of the population being foreign-born. The largest ethnic groups are from El Salvador, the Dominican Republic, and Haiti.
Lynn is also home to a large LGBT population, with an estimated 8.3% of the population identifying as LGBT.
Conclusion
Lynn, Massachusetts is a city located in Essex County, Massachusetts, United States. It is situated on the Atlantic Ocean, about 10 miles north of Boston. The city has a population of approximately 90,000 people, making it the ninth largest city in the state. Lynn has a long history, dating back to 1629 when it was first settled by Europeans. The city has a diverse economy, with manufacturing, services, and retail sectors. The population is diverse, with a large immigrant population and a significant LGBT population.
Common Questions
What is Per Capita Income in Lynn?
Per Capita income in Lynn is $31,816.
What is the Median Family Income in Lynn?
Median Family Income in Lynn is $81,359.
What is the Median Household income in Lynn?
Median Household Income in Lynn is $70,046.
What is Income or Wage Gap in Lynn?
Income or Wage Gap in Lynn is 19.4%.
Women in Lynn earn 80.6 cents for every dollar earned by a man.
What is Family Income Deficit in Lynn?
Family Income Deficit in Lynn is $11,912.
Families that are below poverty line in Lynn earn $11,912 less on average than the poverty threshold level.
What is Inequality or Gini Index in Lynn?
Inequality or Gini Index in Lynn is 0.45.
What is the Total Population of Lynn?
Total Population of Lynn is 100,653.
What is the Total Male Population of Lynn?
Total Male Population of Lynn is 50,168.
What is the Total Female Population of Lynn?
Total Female Population of Lynn is 50,485.
What is the Ratio of Males per 100 Females in Lynn?
There are 99.37 Males per 100 Females in Lynn.
What is the Ratio of Females per 100 Males in Lynn?
There are 100.63 Females per 100 Males in Lynn.
What is the Median Population Age in Lynn?
Median Population Age in Lynn is 36.2 Years.
What is the Average Family Size in Lynn
Average Family Size in Lynn is 3.4 People.
What is the Average Household Size in Lynn
Average Household Size in Lynn is 2.8 People.
How Large is the Labor Force in Lynn?
There are 53,263 People in the Labor Forcein in Lynn.
What is the Percentage of People in the Labor Force in Lynn?
66.8% of People are in the Labor Force in Lynn.
What is the Unemployment Rate in Lynn?
Unemployment Rate in Lynn is 5.7%.