Pinehurst, MA Map & Demographics
Pinehurst Map
Pinehurst Overview
$54,837
PER CAPITA INCOME
$152,560
AVG FAMILY INCOME
$136,292
AVG HOUSEHOLD INCOME
36.2%
WAGE / INCOME GAP [ % ]
63.8¢/ $1
WAGE / INCOME GAP [ $ ]
0.36
INEQUALITY / GINI INDEX
6,426
TOTAL POPULATION
3,223
MALE POPULATION
3,203
FEMALE POPULATION
100.62
MALES / 100 FEMALES
99.38
FEMALES / 100 MALES
45.0
MEDIAN AGE
3.2
AVG FAMILY SIZE
2.8
AVG HOUSEHOLD SIZE
3,587
LABOR FORCE [ PEOPLE ]
68.0%
PERCENT IN LABOR FORCE
3.8%
UNEMPLOYMENT RATE
Income in Pinehurst
Income Overview in Pinehurst
Per Capita Income in Pinehurst is $54,837, while median incomes of families and households are $152,560 and $136,292 respectively.
| Characteristic | Number | Measure |
| Per Capita Income | 6,426 | $54,837 |
| Median Family Income | 1,791 | $152,560 |
| Mean Family Income | 1,791 | $165,166 |
| Median Household Income | 2,329 | $136,292 |
| Mean Household Income | 2,329 | $151,251 |
| Income Deficit | 1,791 | $0 |
| Wage / Income Gap (%) | 6,426 | 36.16% |
| Wage / Income Gap ($) | 6,426 | 63.84¢ per $1 |
| Gini / Inequality Index | 6,426 | 0.36 |
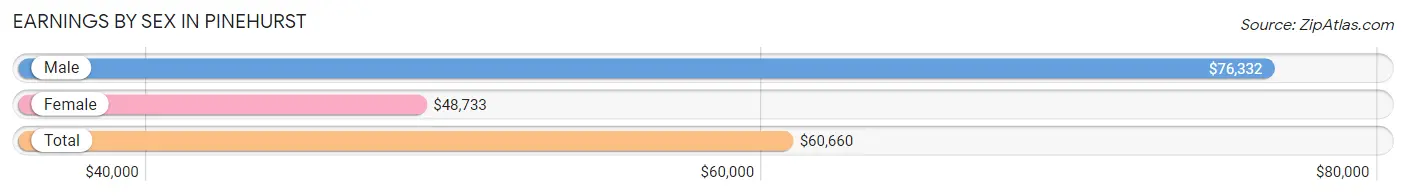
Earnings by Sex in Pinehurst
Average Earnings in Pinehurst are $60,660, $76,332 for men and $48,733 for women, a difference of 36.2%.
| Sex | Number | Average Earnings |
| Male | 2,041 (53.3%) | $76,332 |
| Female | 1,790 (46.7%) | $48,733 |
| Total | 3,831 (100.0%) | $60,660 |
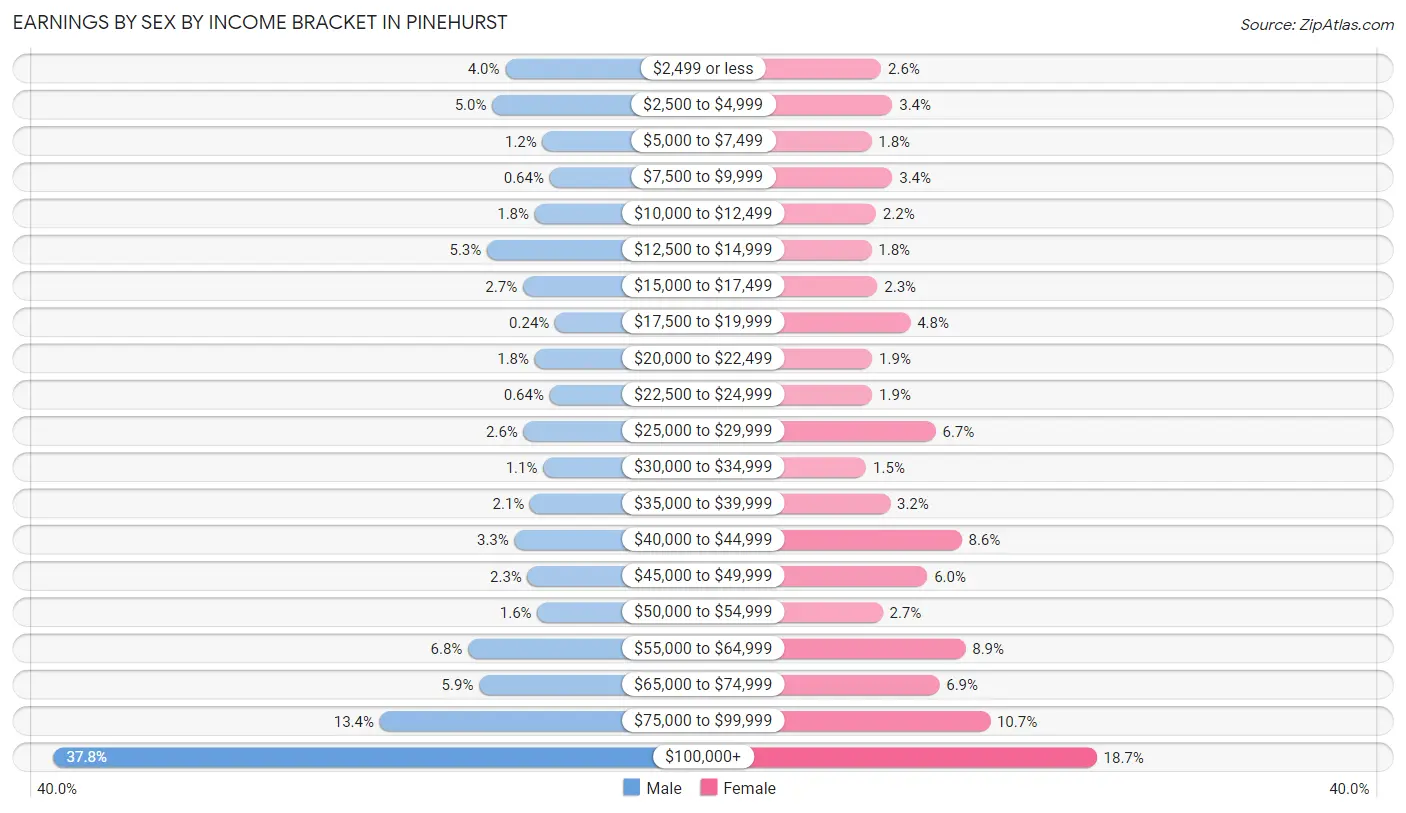
Earnings by Sex by Income Bracket in Pinehurst
The most common earnings brackets in Pinehurst are $100,000+ for men (772 | 37.8%) and $100,000+ for women (335 | 18.7%).
| Income | Male | Female |
| $2,499 or less | 81 (4.0%) | 46 (2.6%) |
| $2,500 to $4,999 | 101 (5.0%) | 61 (3.4%) |
| $5,000 to $7,499 | 24 (1.2%) | 33 (1.8%) |
| $7,500 to $9,999 | 13 (0.6%) | 61 (3.4%) |
| $10,000 to $12,499 | 36 (1.8%) | 39 (2.2%) |
| $12,500 to $14,999 | 109 (5.3%) | 33 (1.8%) |
| $15,000 to $17,499 | 54 (2.6%) | 41 (2.3%) |
| $17,500 to $19,999 | 5 (0.2%) | 85 (4.8%) |
| $20,000 to $22,499 | 36 (1.8%) | 34 (1.9%) |
| $22,500 to $24,999 | 13 (0.6%) | 34 (1.9%) |
| $25,000 to $29,999 | 53 (2.6%) | 119 (6.7%) |
| $30,000 to $34,999 | 23 (1.1%) | 26 (1.5%) |
| $35,000 to $39,999 | 43 (2.1%) | 58 (3.2%) |
| $40,000 to $44,999 | 67 (3.3%) | 154 (8.6%) |
| $45,000 to $49,999 | 47 (2.3%) | 108 (6.0%) |
| $50,000 to $54,999 | 32 (1.6%) | 48 (2.7%) |
| $55,000 to $64,999 | 138 (6.8%) | 159 (8.9%) |
| $65,000 to $74,999 | 121 (5.9%) | 124 (6.9%) |
| $75,000 to $99,999 | 273 (13.4%) | 192 (10.7%) |
| $100,000+ | 772 (37.8%) | 335 (18.7%) |
| Total | 2,041 (100.0%) | 1,790 (100.0%) |
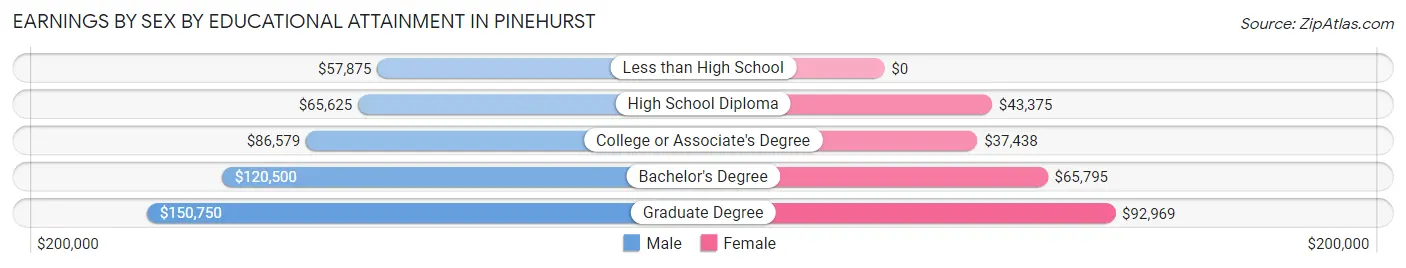
Earnings by Sex by Educational Attainment in Pinehurst
Average earnings in Pinehurst are $91,705 for men and $52,156 for women, a difference of 43.1%. Men with an educational attainment of graduate degree enjoy the highest average annual earnings of $150,750, while those with less than high school education earn the least with $57,875. Women with an educational attainment of graduate degree earn the most with the average annual earnings of $92,969, while those with college or associate's degree education have the smallest earnings of $37,438.
| Educational Attainment | Male Income | Female Income |
| Less than High School | $57,875 | $0 |
| High School Diploma | $65,625 | $43,375 |
| College or Associate's Degree | $86,579 | $37,438 |
| Bachelor's Degree | $120,500 | $65,795 |
| Graduate Degree | $150,750 | $92,969 |
| Total | $91,705 | $52,156 |
Family Income in Pinehurst
Family Income Brackets in Pinehurst
According to the Pinehurst family income data, there are 598 families falling into the $200,000+ income range, which is the most common income bracket and makes up 33.4% of all families.
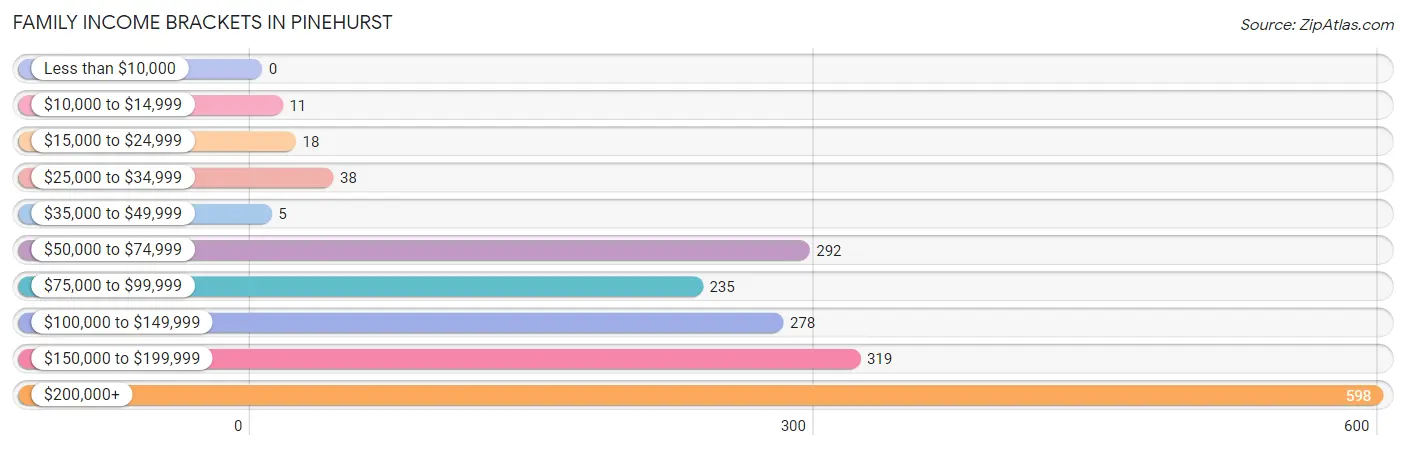
| Income Bracket | # Families | % Families |
| Less than $10,000 | 0 | 0.0% |
| $10,000 to $14,999 | 11 | 0.6% |
| $15,000 to $24,999 | 18 | 1.0% |
| $25,000 to $34,999 | 38 | 2.1% |
| $35,000 to $49,999 | 5 | 0.3% |
| $50,000 to $74,999 | 292 | 16.3% |
| $75,000 to $99,999 | 235 | 13.1% |
| $100,000 to $149,999 | 278 | 15.5% |
| $150,000 to $199,999 | 319 | 17.8% |
| $200,000+ | 598 | 33.4% |
Family Income by Famaliy Size in Pinehurst
5-person families (93 | 5.2%) account for the highest median family income in Pinehurst with $183,988 per family, while 2-person families (672 | 37.5%) have the highest median income of $66,358 per family member.
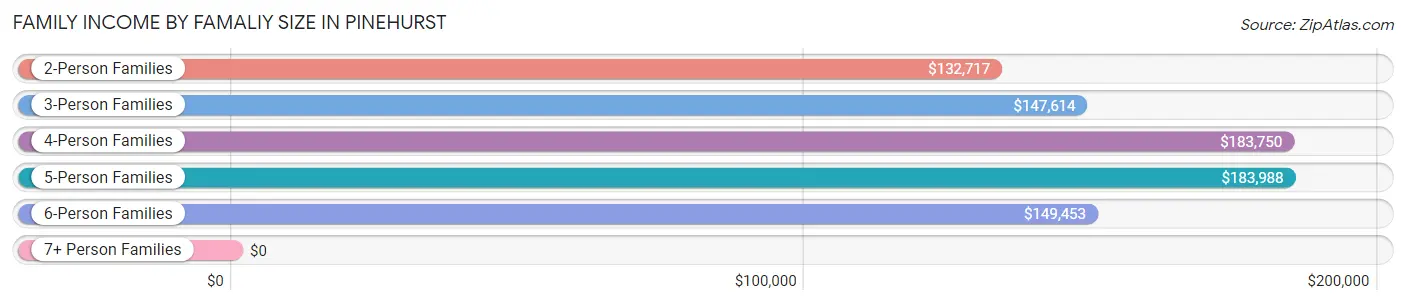
| Income Bracket | # Families | Median Income |
| 2-Person Families | 672 (37.5%) | $132,717 |
| 3-Person Families | 484 (27.0%) | $147,614 |
| 4-Person Families | 408 (22.8%) | $183,750 |
| 5-Person Families | 93 (5.2%) | $183,988 |
| 6-Person Families | 101 (5.6%) | $149,453 |
| 7+ Person Families | 33 (1.8%) | $0 |
| Total | 1,791 (100.0%) | $152,560 |
Family Income by Number of Earners in Pinehurst
The median family income in Pinehurst is $152,560, with families comprising 3+ earners (394) having the highest median family income of $186,818, while families with no earners (144) have the lowest median family income of $71,875, accounting for 22.0% and 8.0% of families, respectively.
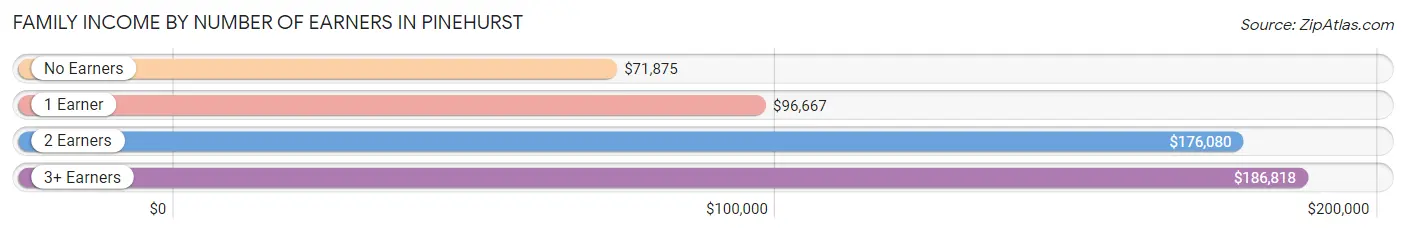
| Number of Earners | # Families | Median Income |
| No Earners | 144 (8.0%) | $71,875 |
| 1 Earner | 472 (26.4%) | $96,667 |
| 2 Earners | 781 (43.6%) | $176,080 |
| 3+ Earners | 394 (22.0%) | $186,818 |
| Total | 1,791 (100.0%) | $152,560 |
Household Income in Pinehurst
Household Income Brackets in Pinehurst
With 631 households falling in the category, the $200,000+ income range is the most frequent in Pinehurst, accounting for 27.1% of all households. In contrast, only 9 households (0.4%) fall into the less than $10,000 income bracket, making it the least populous group.
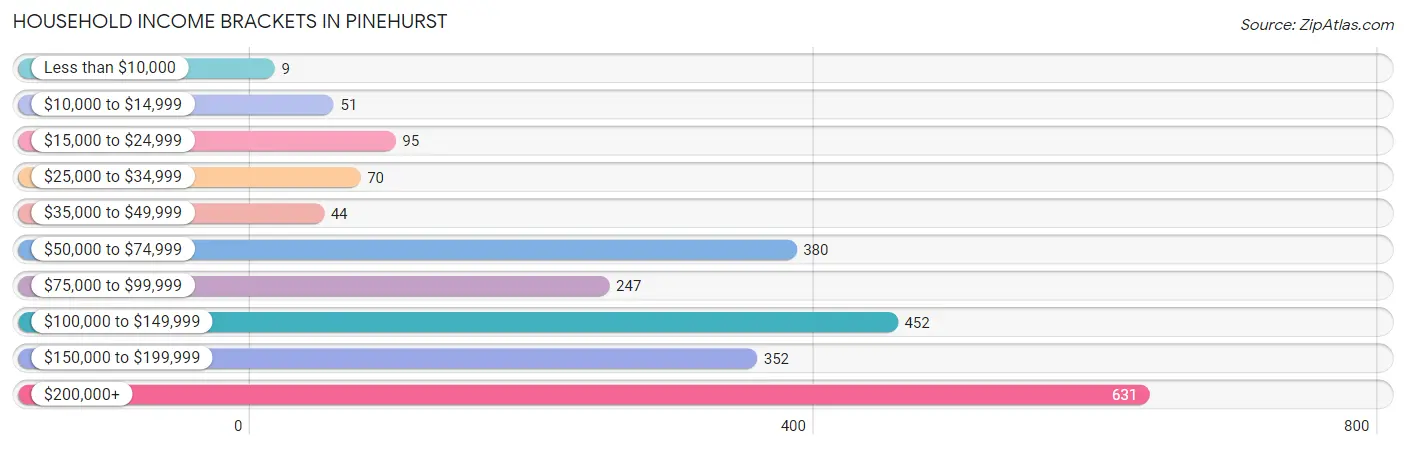
| Income Bracket | # Households | % Households |
| Less than $10,000 | 9 | 0.4% |
| $10,000 to $14,999 | 51 | 2.2% |
| $15,000 to $24,999 | 95 | 4.1% |
| $25,000 to $34,999 | 70 | 3.0% |
| $35,000 to $49,999 | 44 | 1.9% |
| $50,000 to $74,999 | 380 | 16.3% |
| $75,000 to $99,999 | 247 | 10.6% |
| $100,000 to $149,999 | 452 | 19.4% |
| $150,000 to $199,999 | 352 | 15.1% |
| $200,000+ | 631 | 27.1% |
Household Income by Householder Age in Pinehurst
The median household income in Pinehurst is $136,292, with the highest median household income of $175,893 found in the 25 to 44 years age bracket for the primary householder. A total of 569 households (24.4%) fall into this category.
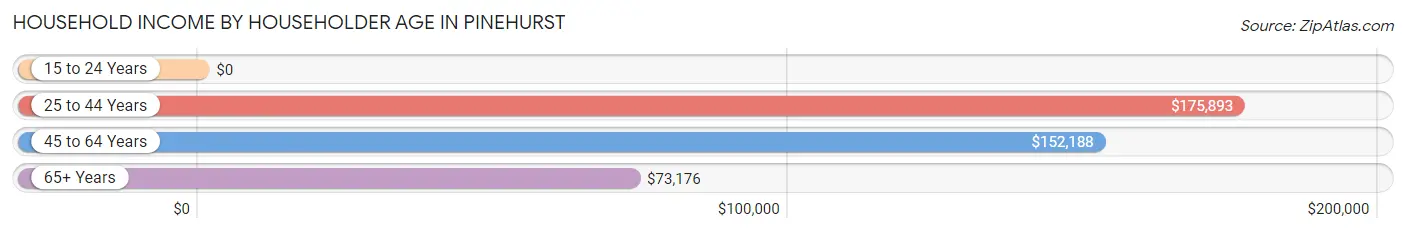
| Income Bracket | # Households | Median Income |
| 15 to 24 Years | 0 (0.0%) | $0 |
| 25 to 44 Years | 569 (24.4%) | $175,893 |
| 45 to 64 Years | 1,063 (45.6%) | $152,188 |
| 65+ Years | 697 (29.9%) | $73,176 |
| Total | 2,329 (100.0%) | $136,292 |
Poverty in Pinehurst
Income Below Poverty by Sex and Age in Pinehurst
With 3.0% poverty level for males and 4.0% for females among the residents of Pinehurst, 5 year old males and 6 to 11 year old females are the most vulnerable to poverty, with 12 males (42.9%) and 36 females (17.5%) in their respective age groups living below the poverty level.
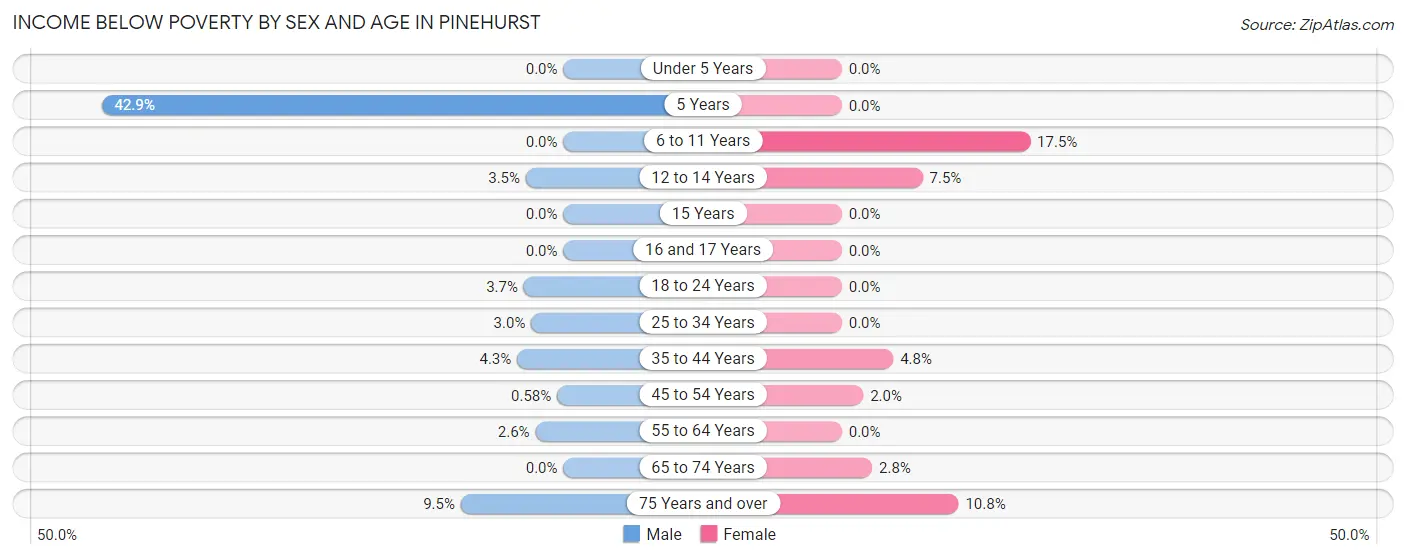
| Age Bracket | Male | Female |
| Under 5 Years | 0 (0.0%) | 0 (0.0%) |
| 5 Years | 12 (42.9%) | 0 (0.0%) |
| 6 to 11 Years | 0 (0.0%) | 36 (17.5%) |
| 12 to 14 Years | 7 (3.5%) | 9 (7.5%) |
| 15 Years | 0 (0.0%) | 0 (0.0%) |
| 16 and 17 Years | 0 (0.0%) | 0 (0.0%) |
| 18 to 24 Years | 11 (3.7%) | 0 (0.0%) |
| 25 to 34 Years | 5 (3.0%) | 0 (0.0%) |
| 35 to 44 Years | 21 (4.3%) | 20 (4.8%) |
| 45 to 54 Years | 3 (0.6%) | 10 (2.0%) |
| 55 to 64 Years | 11 (2.6%) | 0 (0.0%) |
| 65 to 74 Years | 0 (0.0%) | 10 (2.8%) |
| 75 Years and over | 28 (9.5%) | 43 (10.8%) |
| Total | 98 (3.0%) | 128 (4.0%) |
Income Above Poverty by Sex and Age in Pinehurst
According to the poverty statistics in Pinehurst, males aged under 5 years and females aged under 5 years are the age groups that are most secure financially, with 100.0% of males and 100.0% of females in these age groups living above the poverty line.
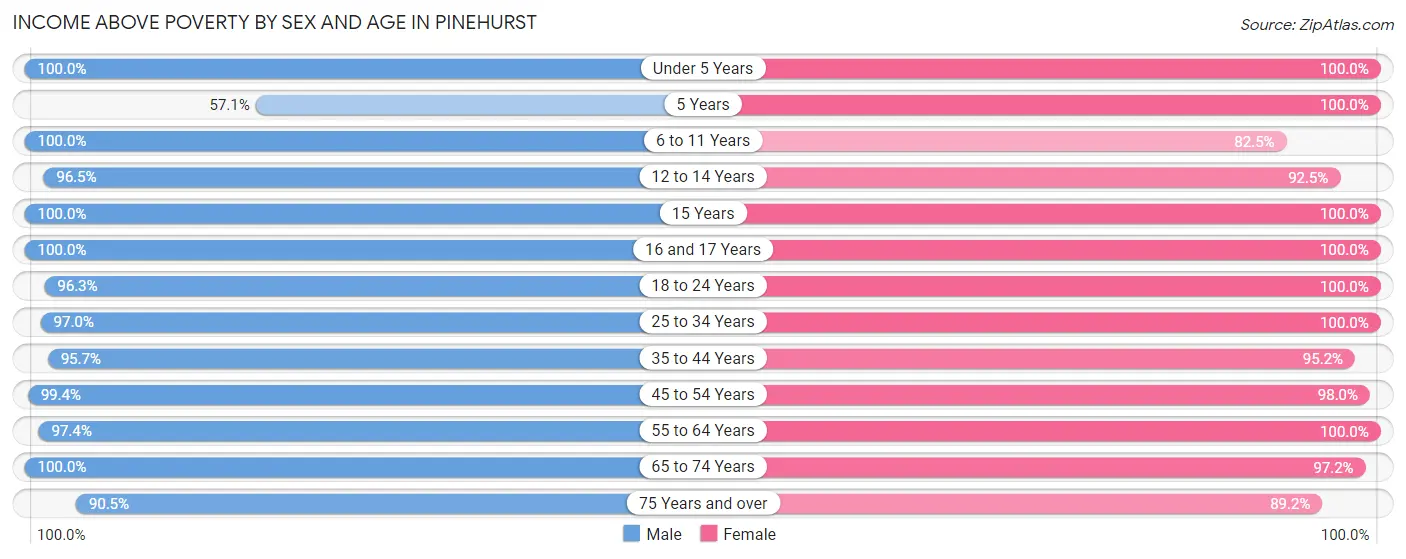
| Age Bracket | Male | Female |
| Under 5 Years | 149 (100.0%) | 145 (100.0%) |
| 5 Years | 16 (57.1%) | 31 (100.0%) |
| 6 to 11 Years | 191 (100.0%) | 170 (82.5%) |
| 12 to 14 Years | 194 (96.5%) | 111 (92.5%) |
| 15 Years | 50 (100.0%) | 28 (100.0%) |
| 16 and 17 Years | 132 (100.0%) | 55 (100.0%) |
| 18 to 24 Years | 289 (96.3%) | 155 (100.0%) |
| 25 to 34 Years | 163 (97.0%) | 348 (100.0%) |
| 35 to 44 Years | 469 (95.7%) | 399 (95.2%) |
| 45 to 54 Years | 517 (99.4%) | 492 (98.0%) |
| 55 to 64 Years | 413 (97.4%) | 441 (100.0%) |
| 65 to 74 Years | 274 (100.0%) | 346 (97.2%) |
| 75 Years and over | 266 (90.5%) | 354 (89.2%) |
| Total | 3,123 (97.0%) | 3,075 (96.0%) |
Income Below Poverty Among Married-Couple Families in Pinehurst
The poverty statistics for married-couple families in Pinehurst show that 2.0% or 31 of the total 1,532 families live below the poverty line. Families with 1 or 2 children have the highest poverty rate of 2.4%, comprising of 12 families. On the other hand, families with 3 or 4 children have the lowest poverty rate of 0.0%, which includes 0 families.
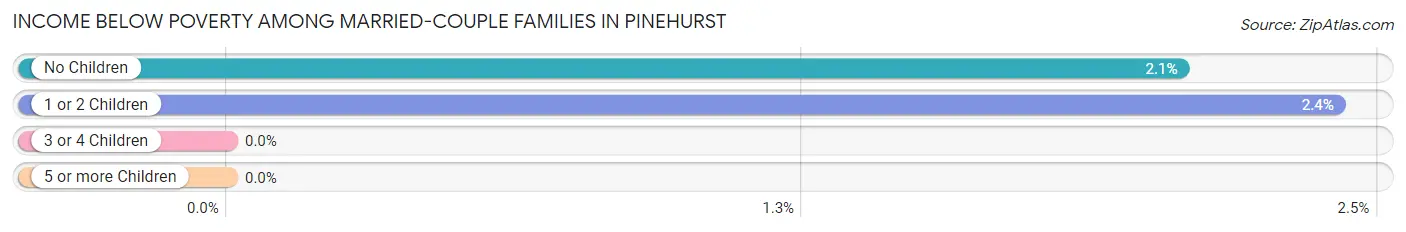
| Children | Above Poverty | Below Poverty |
| No Children | 898 (97.9%) | 19 (2.1%) |
| 1 or 2 Children | 486 (97.6%) | 12 (2.4%) |
| 3 or 4 Children | 101 (100.0%) | 0 (0.0%) |
| 5 or more Children | 16 (100.0%) | 0 (0.0%) |
| Total | 1,501 (98.0%) | 31 (2.0%) |
Income Below Poverty Among Single-Parent Households in Pinehurst
According to the poverty data in Pinehurst, 8.0% or 9 single-father households and 5.5% or 8 single-mother households are living below the poverty line. Among single-father households, those with 1 or 2 children have the highest poverty rate, with 9 households (12.2%) experiencing poverty. Likewise, among single-mother households, those with 3 or 4 children have the highest poverty rate, with 8 households (100.0%) falling below the poverty line.
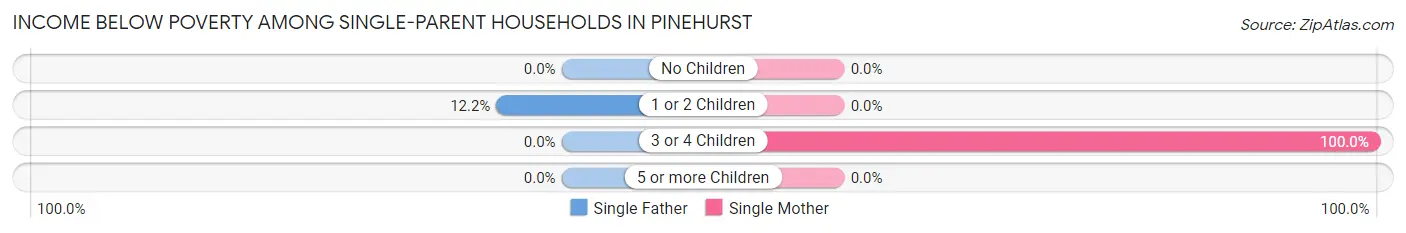
| Children | Single Father | Single Mother |
| No Children | 0 (0.0%) | 0 (0.0%) |
| 1 or 2 Children | 9 (12.2%) | 0 (0.0%) |
| 3 or 4 Children | 0 (0.0%) | 8 (100.0%) |
| 5 or more Children | 0 (0.0%) | 0 (0.0%) |
| Total | 9 (8.0%) | 8 (5.5%) |
Income Below Poverty Among Married-Couple vs Single-Parent Households in Pinehurst
The poverty data for Pinehurst shows that 31 of the married-couple family households (2.0%) and 17 of the single-parent households (6.6%) are living below the poverty level. Within the married-couple family households, those with 1 or 2 children have the highest poverty rate, with 12 households (2.4%) falling below the poverty line. Among the single-parent households, those with 3 or 4 children have the highest poverty rate, with 8 household (100.0%) living below poverty.
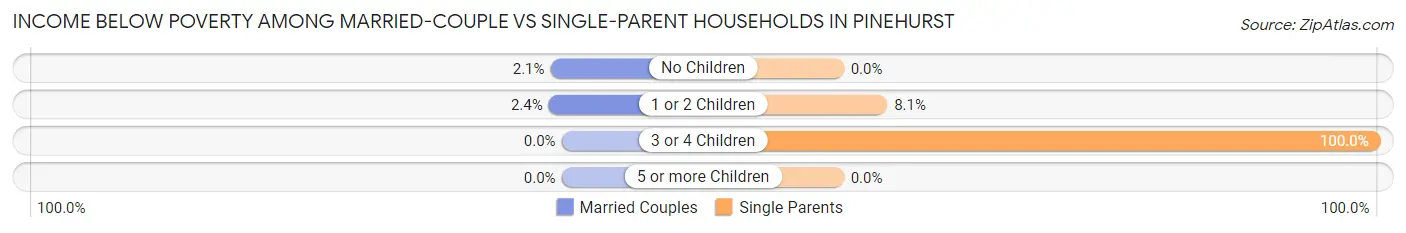
| Children | Married-Couple Families | Single-Parent Households |
| No Children | 19 (2.1%) | 0 (0.0%) |
| 1 or 2 Children | 12 (2.4%) | 9 (8.1%) |
| 3 or 4 Children | 0 (0.0%) | 8 (100.0%) |
| 5 or more Children | 0 (0.0%) | 0 (0.0%) |
| Total | 31 (2.0%) | 17 (6.6%) |
Race in Pinehurst
The most populous races in Pinehurst are White / Caucasian (5,264 | 81.9%), Asian (663 | 10.3%), and Black / African American (267 | 4.2%).
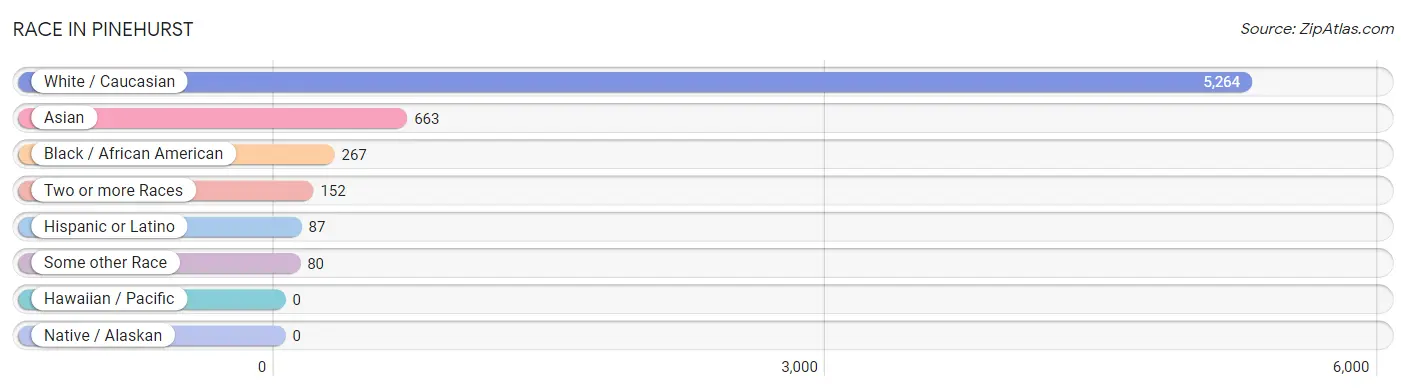
| Race | # Population | % Population |
| Asian | 663 | 10.3% |
| Black / African American | 267 | 4.2% |
| Hawaiian / Pacific | 0 | 0.0% |
| Hispanic or Latino | 87 | 1.3% |
| Native / Alaskan | 0 | 0.0% |
| White / Caucasian | 5,264 | 81.9% |
| Two or more Races | 152 | 2.4% |
| Some other Race | 80 | 1.2% |
| Total | 6,426 | 100.0% |
Ancestry in Pinehurst
The most populous ancestries reported in Pinehurst are Irish (1,628 | 25.3%), Italian (1,320 | 20.5%), Thai (537 | 8.4%), English (528 | 8.2%), and German (521 | 8.1%), together accounting for 70.6% of all Pinehurst residents.
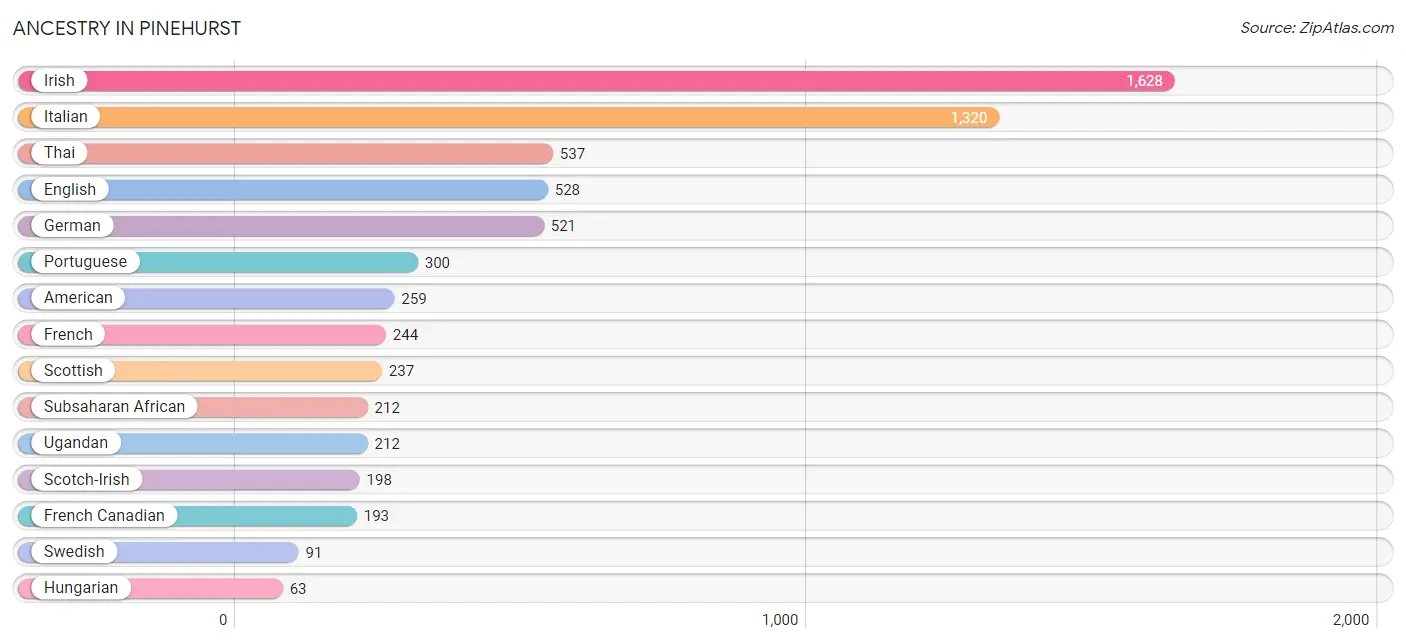
| Ancestry | # Population | % Population |
| Albanian | 18 | 0.3% |
| American | 259 | 4.0% |
| Arab | 23 | 0.4% |
| Barbadian | 12 | 0.2% |
| Bhutanese | 13 | 0.2% |
| British | 36 | 0.6% |
| Bulgarian | 19 | 0.3% |
| Burmese | 45 | 0.7% |
| Canadian | 48 | 0.7% |
| Colombian | 19 | 0.3% |
| Cuban | 12 | 0.2% |
| Dominican | 15 | 0.2% |
| Dutch | 29 | 0.4% |
| Eastern European | 22 | 0.3% |
| Ecuadorian | 7 | 0.1% |
| Egyptian | 12 | 0.2% |
| English | 528 | 8.2% |
| European | 48 | 0.7% |
| French | 244 | 3.8% |
| French Canadian | 193 | 3.0% |
| German | 521 | 8.1% |
| Greek | 27 | 0.4% |
| Hungarian | 63 | 1.0% |
| Indian (Asian) | 51 | 0.8% |
| Irish | 1,628 | 25.3% |
| Italian | 1,320 | 20.5% |
| Japanese | 19 | 0.3% |
| Jordanian | 11 | 0.2% |
| Korean | 1 | 0.0% |
| Lithuanian | 61 | 0.9% |
| Mexican | 5 | 0.1% |
| Norwegian | 51 | 0.8% |
| Pakistani | 11 | 0.2% |
| Palestinian | 11 | 0.2% |
| Polish | 56 | 0.9% |
| Portuguese | 300 | 4.7% |
| Puerto Rican | 18 | 0.3% |
| Russian | 30 | 0.5% |
| Scotch-Irish | 198 | 3.1% |
| Scottish | 237 | 3.7% |
| Slovak | 9 | 0.1% |
| South American | 26 | 0.4% |
| Spanish | 9 | 0.1% |
| Sri Lankan | 35 | 0.5% |
| Subsaharan African | 212 | 3.3% |
| Swedish | 91 | 1.4% |
| Thai | 537 | 8.4% |
| Ugandan | 212 | 3.3% |
| Welsh | 41 | 0.6% | View All 49 Rows |
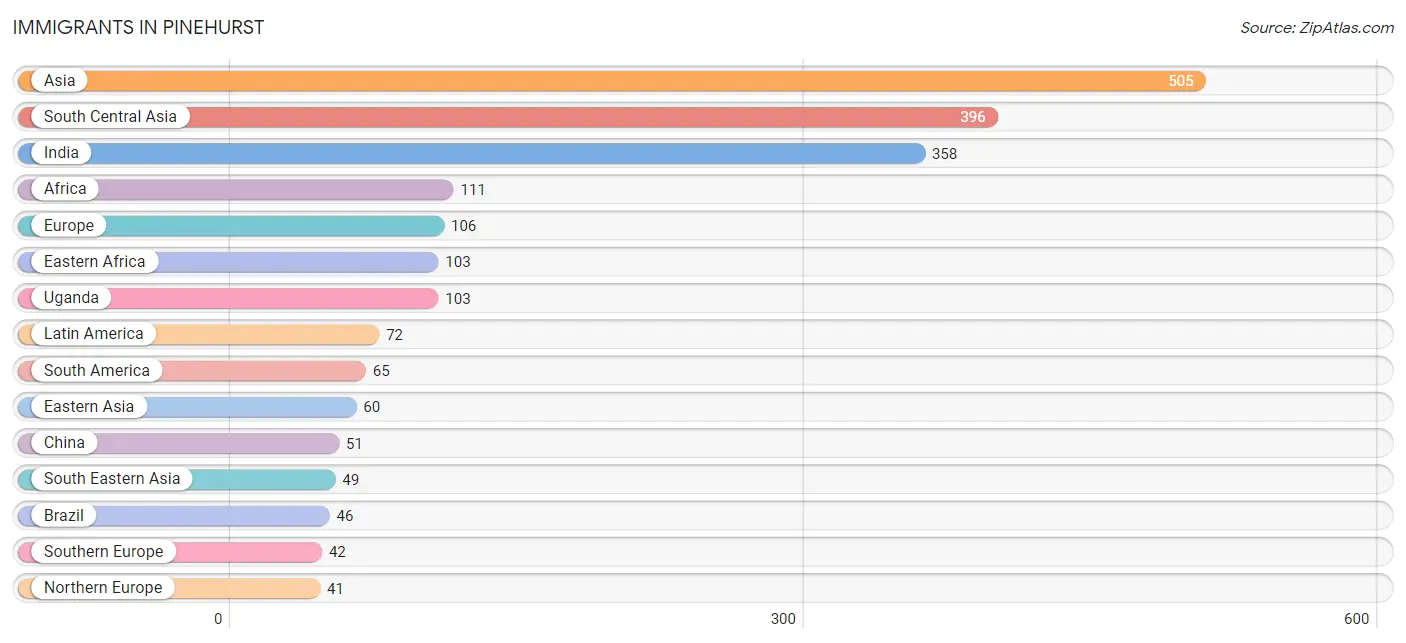
Immigrants in Pinehurst
The most numerous immigrant groups reported in Pinehurst came from Asia (505 | 7.9%), South Central Asia (396 | 6.2%), India (358 | 5.6%), Africa (111 | 1.7%), and Europe (106 | 1.7%), together accounting for 23.0% of all Pinehurst residents.
| Immigration Origin | # Population | % Population |
| Africa | 111 | 1.7% |
| Asia | 505 | 7.9% |
| Brazil | 46 | 0.7% |
| Bulgaria | 19 | 0.3% |
| Cambodia | 14 | 0.2% |
| Caribbean | 7 | 0.1% |
| China | 51 | 0.8% |
| Colombia | 19 | 0.3% |
| Dominican Republic | 7 | 0.1% |
| Eastern Africa | 103 | 1.6% |
| Eastern Asia | 60 | 0.9% |
| Eastern Europe | 23 | 0.4% |
| England | 31 | 0.5% |
| Europe | 106 | 1.7% |
| Greece | 9 | 0.1% |
| Hong Kong | 14 | 0.2% |
| Hungary | 4 | 0.1% |
| India | 358 | 5.6% |
| Italy | 4 | 0.1% |
| Korea | 9 | 0.1% |
| Latin America | 72 | 1.1% |
| Malaysia | 15 | 0.2% |
| Nepal | 38 | 0.6% |
| Northern Europe | 41 | 0.6% |
| Portugal | 29 | 0.4% |
| South Africa | 8 | 0.1% |
| South America | 65 | 1.0% |
| South Central Asia | 396 | 6.2% |
| South Eastern Asia | 49 | 0.8% |
| Southern Europe | 42 | 0.6% |
| Thailand | 9 | 0.1% |
| Uganda | 103 | 1.6% |
| Vietnam | 11 | 0.2% | View All 33 Rows |
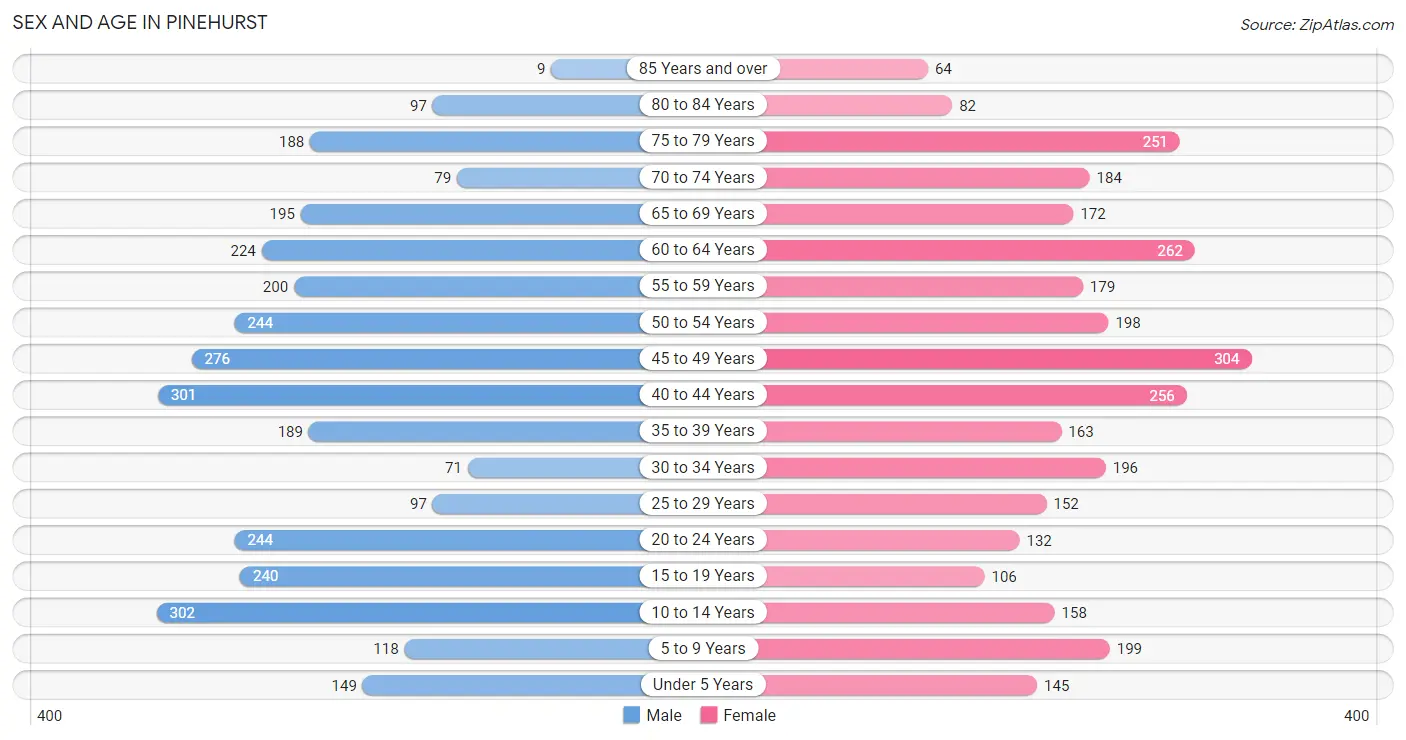
Sex and Age in Pinehurst
Sex and Age in Pinehurst
The most populous age groups in Pinehurst are 10 to 14 Years (302 | 9.4%) for men and 45 to 49 Years (304 | 9.5%) for women.
| Age Bracket | Male | Female |
| Under 5 Years | 149 (4.6%) | 145 (4.5%) |
| 5 to 9 Years | 118 (3.7%) | 199 (6.2%) |
| 10 to 14 Years | 302 (9.4%) | 158 (4.9%) |
| 15 to 19 Years | 240 (7.4%) | 106 (3.3%) |
| 20 to 24 Years | 244 (7.6%) | 132 (4.1%) |
| 25 to 29 Years | 97 (3.0%) | 152 (4.8%) |
| 30 to 34 Years | 71 (2.2%) | 196 (6.1%) |
| 35 to 39 Years | 189 (5.9%) | 163 (5.1%) |
| 40 to 44 Years | 301 (9.3%) | 256 (8.0%) |
| 45 to 49 Years | 276 (8.6%) | 304 (9.5%) |
| 50 to 54 Years | 244 (7.6%) | 198 (6.2%) |
| 55 to 59 Years | 200 (6.2%) | 179 (5.6%) |
| 60 to 64 Years | 224 (7.0%) | 262 (8.2%) |
| 65 to 69 Years | 195 (6.0%) | 172 (5.4%) |
| 70 to 74 Years | 79 (2.5%) | 184 (5.7%) |
| 75 to 79 Years | 188 (5.8%) | 251 (7.8%) |
| 80 to 84 Years | 97 (3.0%) | 82 (2.6%) |
| 85 Years and over | 9 (0.3%) | 64 (2.0%) |
| Total | 3,223 (100.0%) | 3,203 (100.0%) |
Families and Households in Pinehurst
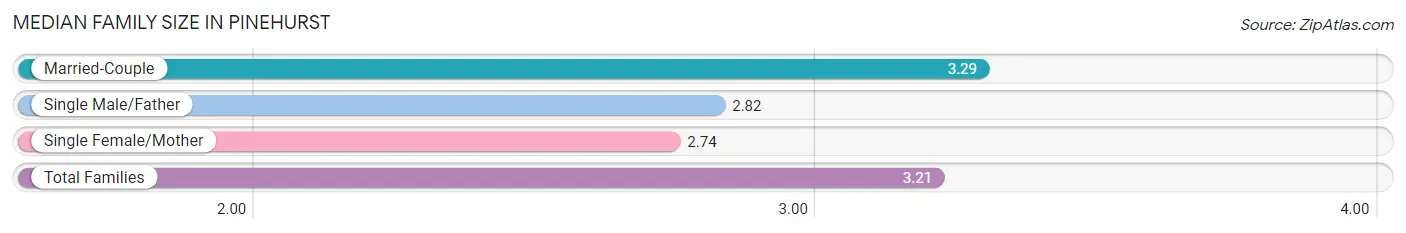
Median Family Size in Pinehurst
The median family size in Pinehurst is 3.21 persons per family, with married-couple families (1,532 | 85.5%) accounting for the largest median family size of 3.29 persons per family. On the other hand, single female/mother families (146 | 8.2%) represent the smallest median family size with 2.74 persons per family.
| Family Type | # Families | Family Size |
| Married-Couple | 1,532 (85.5%) | 3.29 |
| Single Male/Father | 113 (6.3%) | 2.82 |
| Single Female/Mother | 146 (8.2%) | 2.74 |
| Total Families | 1,791 (100.0%) | 3.21 |
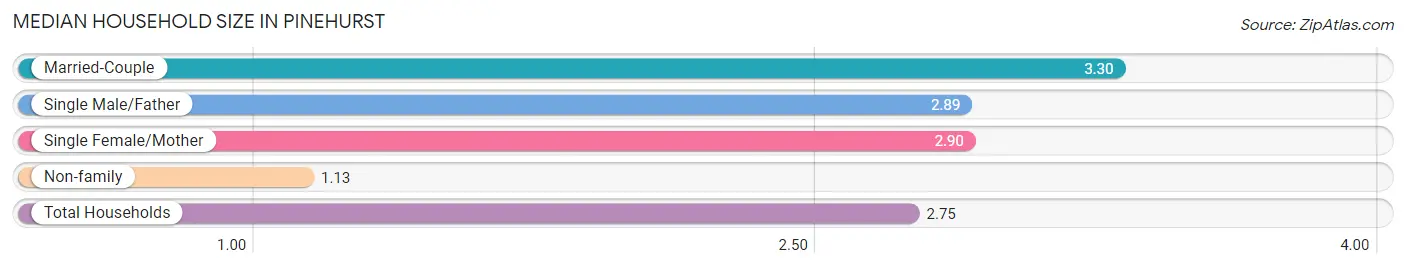
Median Household Size in Pinehurst
The median household size in Pinehurst is 2.75 persons per household, with married-couple households (1,532 | 65.8%) accounting for the largest median household size of 3.3 persons per household. non-family households (538 | 23.1%) represent the smallest median household size with 1.13 persons per household.
| Household Type | # Households | Household Size |
| Married-Couple | 1,532 (65.8%) | 3.30 |
| Single Male/Father | 113 (4.9%) | 2.89 |
| Single Female/Mother | 146 (6.3%) | 2.90 |
| Non-family | 538 (23.1%) | 1.13 |
| Total Households | 2,329 (100.0%) | 2.75 |
Household Size by Marriage Status in Pinehurst
Out of a total of 2,329 households in Pinehurst, 1,791 (76.9%) are family households, while 538 (23.1%) are nonfamily households. The most numerous type of family households are 2-person households, comprising 651, and the most common type of nonfamily households are 1-person households, comprising 480.
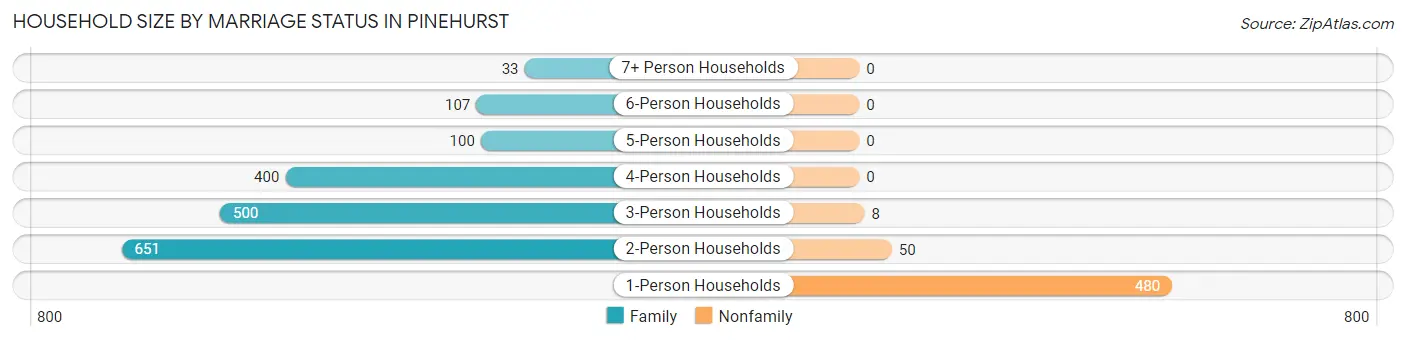
| Household Size | Family Households | Nonfamily Households |
| 1-Person Households | - | 480 (20.6%) |
| 2-Person Households | 651 (28.0%) | 50 (2.1%) |
| 3-Person Households | 500 (21.5%) | 8 (0.3%) |
| 4-Person Households | 400 (17.2%) | 0 (0.0%) |
| 5-Person Households | 100 (4.3%) | 0 (0.0%) |
| 6-Person Households | 107 (4.6%) | 0 (0.0%) |
| 7+ Person Households | 33 (1.4%) | 0 (0.0%) |
| Total | 1,791 (76.9%) | 538 (23.1%) |
Female Fertility in Pinehurst
Fertility by Age in Pinehurst
Average fertility rate in Pinehurst is 43.0 births per 1,000 women. Women in the age bracket of 20 to 34 years have the highest fertility rate with 60.0 births per 1,000 women. Women in the age bracket of 20 to 34 years acount for 50.0% of all women with births.
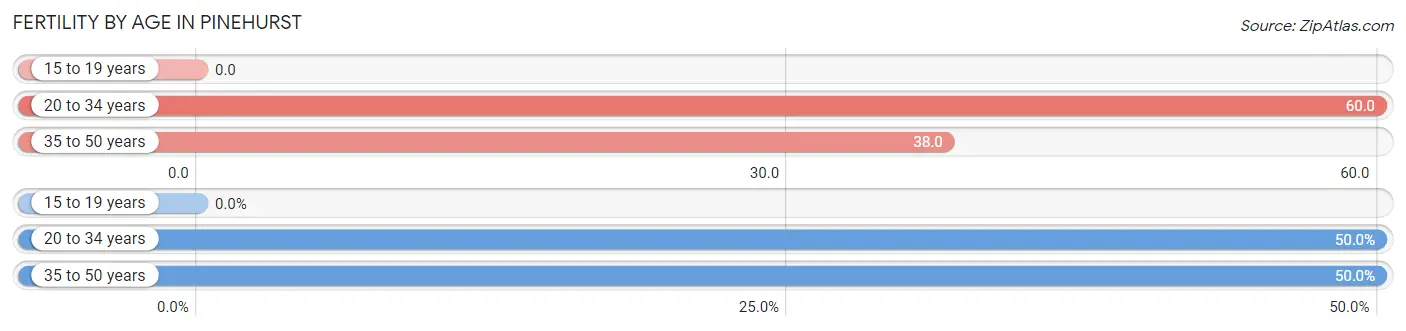
| Age Bracket | Women with Births | Births / 1,000 Women |
| 15 to 19 years | 0 (0.0%) | 0.0 |
| 20 to 34 years | 29 (50.0%) | 60.0 |
| 35 to 50 years | 29 (50.0%) | 38.0 |
| Total | 58 (100.0%) | 43.0 |
Fertility by Age by Marriage Status in Pinehurst
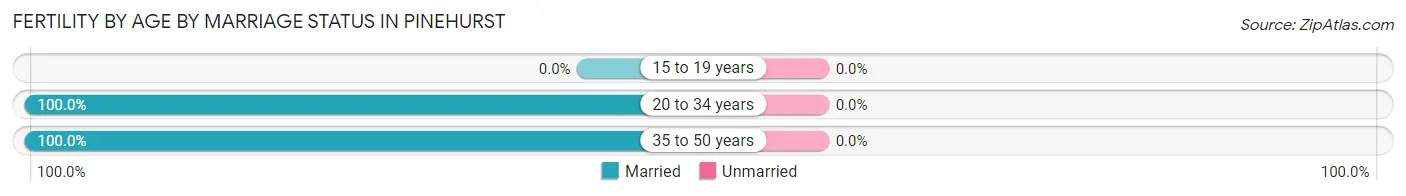
| Age Bracket | Married | Unmarried |
| 15 to 19 years | 0 (0.0%) | 0 (0.0%) |
| 20 to 34 years | 29 (100.0%) | 0 (0.0%) |
| 35 to 50 years | 29 (100.0%) | 0 (0.0%) |
| Total | 58 (100.0%) | 0 (0.0%) |
Fertility by Education in Pinehurst
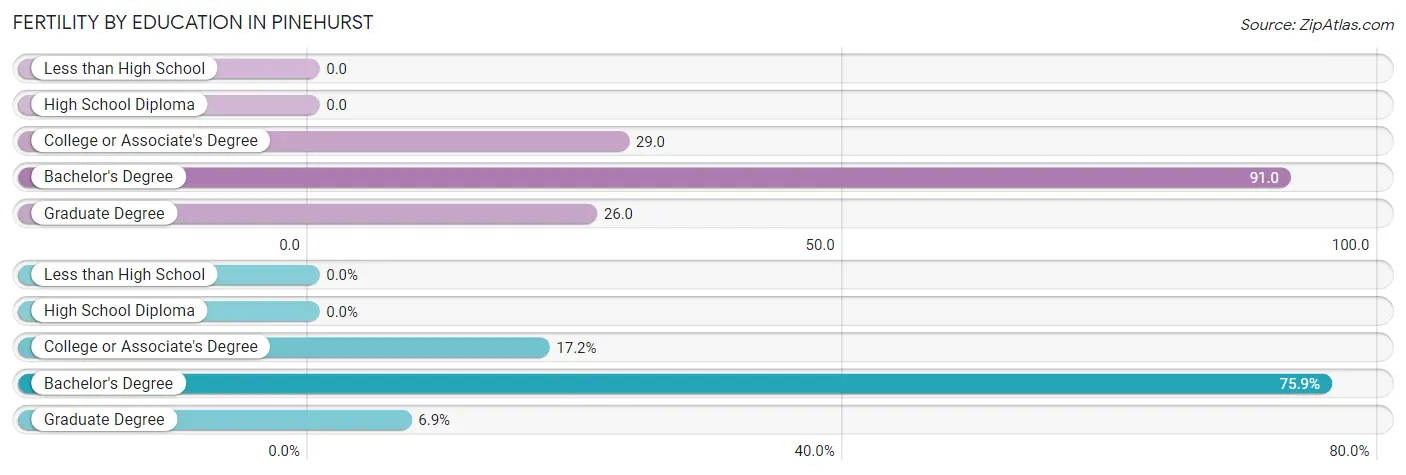
| Educational Attainment | Women with Births | Births / 1,000 Women |
| Less than High School | 0 (0.0%) | 0.0 |
| High School Diploma | 0 (0.0%) | 0.0 |
| College or Associate's Degree | 10 (17.2%) | 29.0 |
| Bachelor's Degree | 44 (75.9%) | 91.0 |
| Graduate Degree | 4 (6.9%) | 26.0 |
| Total | 58 (100.0%) | 43.0 |
Fertility by Education by Marriage Status in Pinehurst
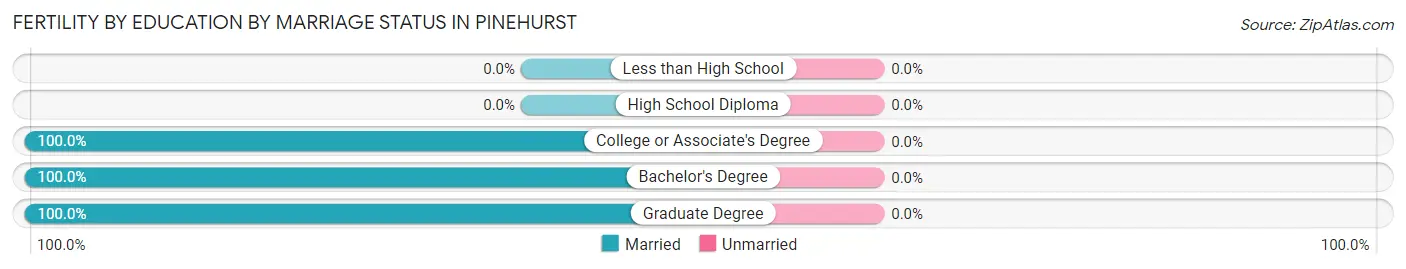
| Educational Attainment | Married | Unmarried |
| Less than High School | 0 (0.0%) | 0 (0.0%) |
| High School Diploma | 0 (0.0%) | 0 (0.0%) |
| College or Associate's Degree | 10 (100.0%) | 0 (0.0%) |
| Bachelor's Degree | 44 (100.0%) | 0 (0.0%) |
| Graduate Degree | 4 (100.0%) | 0 (0.0%) |
| Total | 58 (100.0%) | 0 (0.0%) |
Employment Characteristics in Pinehurst
Employment by Class of Employer in Pinehurst
Among the 3,426 employed individuals in Pinehurst, private company employees (2,471 | 72.1%), not-for-profit organizations (338 | 9.9%), and local government employees (262 | 7.6%) make up the most common classes of employment.
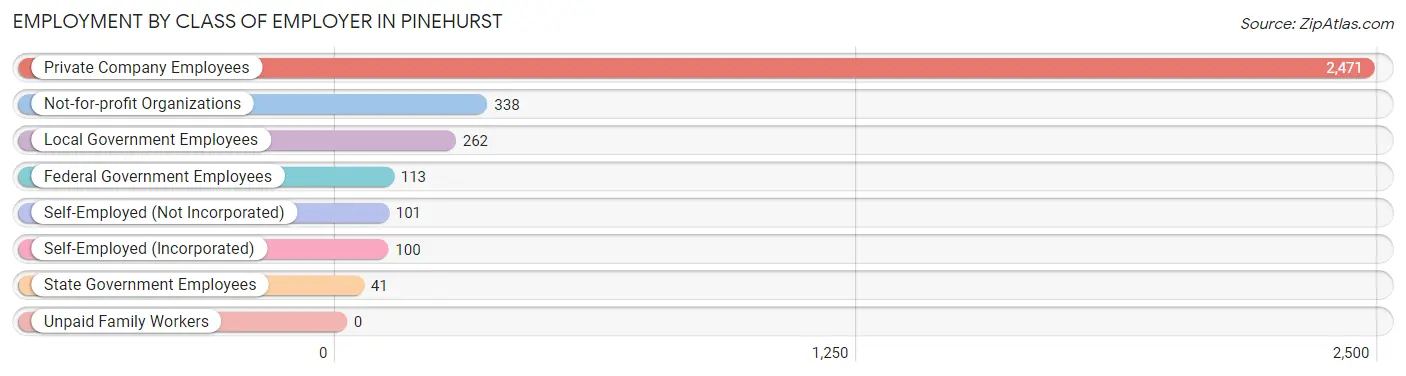
| Employer Class | # Employees | % Employees |
| Private Company Employees | 2,471 | 72.1% |
| Self-Employed (Incorporated) | 100 | 2.9% |
| Self-Employed (Not Incorporated) | 101 | 2.9% |
| Not-for-profit Organizations | 338 | 9.9% |
| Local Government Employees | 262 | 7.6% |
| State Government Employees | 41 | 1.2% |
| Federal Government Employees | 113 | 3.3% |
| Unpaid Family Workers | 0 | 0.0% |
| Total | 3,426 | 100.0% |
Employment Status by Age in Pinehurst
According to the labor force statistics for Pinehurst, out of the total population over 16 years of age (5,275), 68.0% or 3,587 individuals are in the labor force, with 3.8% or 136 of them unemployed. The age group with the highest labor force participation rate is 30 to 34 years, with 95.1% or 254 individuals in the labor force. Within the labor force, the 30 to 34 years age range has the highest percentage of unemployed individuals, with 22.8% or 58 of them being unemployed.
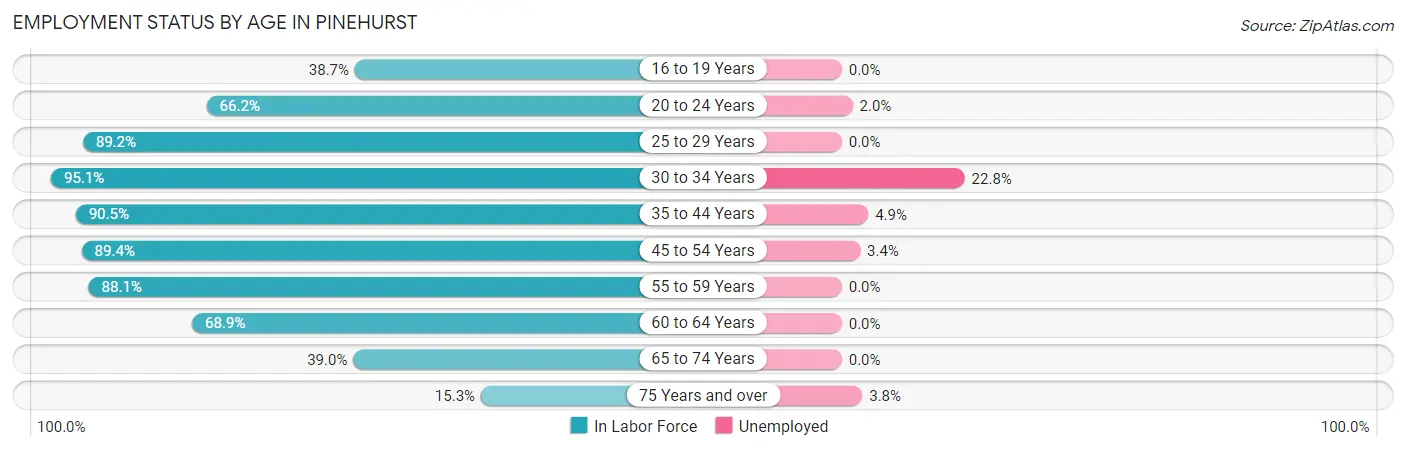
| Age Bracket | In Labor Force | Unemployed |
| 16 to 19 Years | 103 (38.7%) | 0 (0.0%) |
| 20 to 24 Years | 249 (66.2%) | 5 (2.0%) |
| 25 to 29 Years | 222 (89.2%) | 0 (0.0%) |
| 30 to 34 Years | 254 (95.1%) | 58 (22.8%) |
| 35 to 44 Years | 823 (90.5%) | 40 (4.9%) |
| 45 to 54 Years | 914 (89.4%) | 31 (3.4%) |
| 55 to 59 Years | 334 (88.1%) | 0 (0.0%) |
| 60 to 64 Years | 335 (68.9%) | 0 (0.0%) |
| 65 to 74 Years | 246 (39.0%) | 0 (0.0%) |
| 75 Years and over | 106 (15.3%) | 4 (3.8%) |
| Total | 3,587 (68.0%) | 136 (3.8%) |
Employment Status by Educational Attainment in Pinehurst
According to labor force statistics for Pinehurst, 87.0% of individuals (2,881) out of the total population between 25 and 64 years of age (3,312) are in the labor force, with 4.5% or 130 of them being unemployed. The group with the highest labor force participation rate are those with the educational attainment of college / associate degree, with 93.0% or 824 individuals in the labor force. Within the labor force, individuals with college / associate degree education have the highest percentage of unemployment, with 11.9% or 98 of them being unemployed.
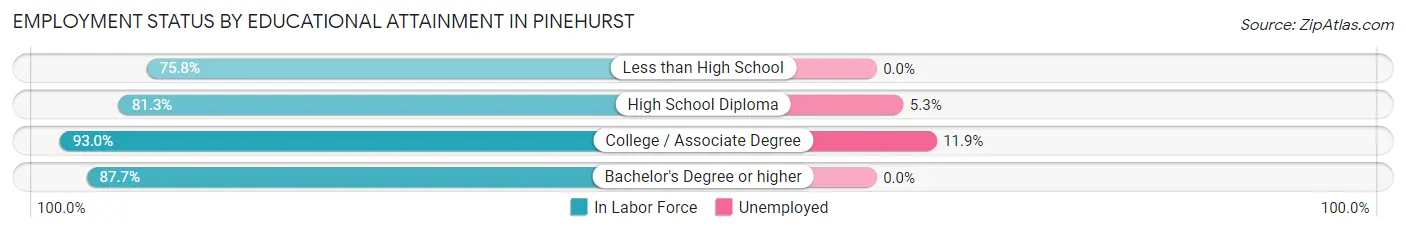
| Educational Attainment | In Labor Force | Unemployed |
| Less than High School | 147 (75.8%) | 0 (0.0%) |
| High School Diploma | 585 (81.3%) | 38 (5.3%) |
| College / Associate Degree | 824 (93.0%) | 105 (11.9%) |
| Bachelor's Degree or higher | 1,326 (87.7%) | 0 (0.0%) |
| Total | 2,881 (87.0%) | 149 (4.5%) |
Employment Occupations by Sex in Pinehurst
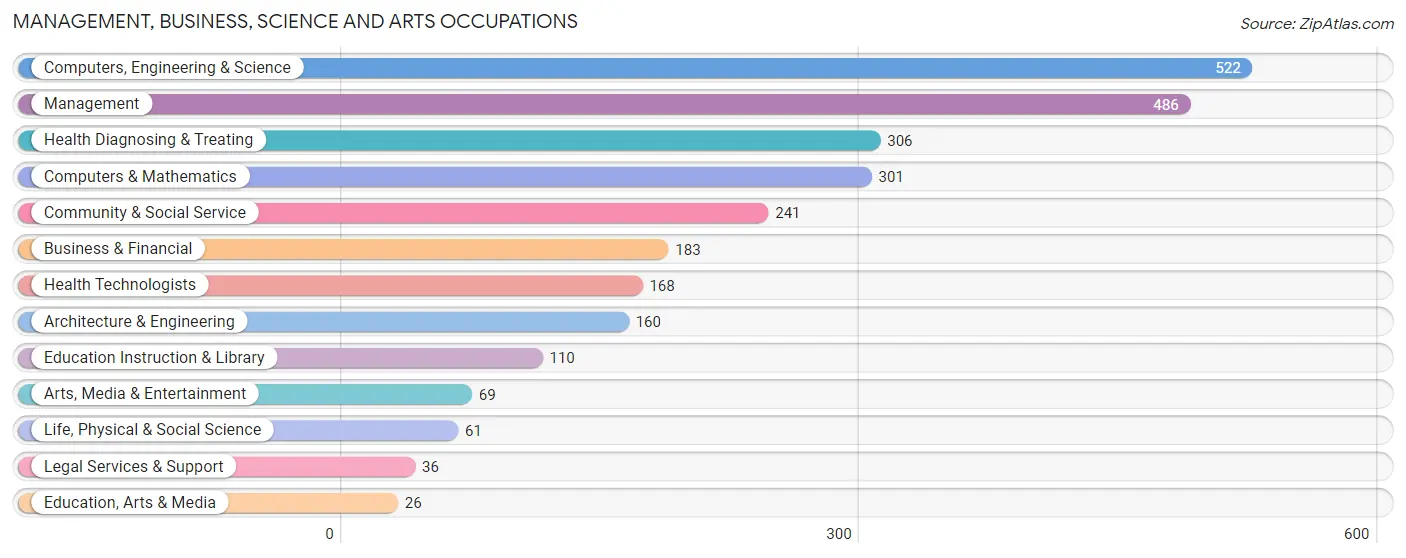
Management, Business, Science and Arts Occupations
The most common Management, Business, Science and Arts occupations in Pinehurst are Computers, Engineering & Science (522 | 15.1%), Management (486 | 14.1%), Health Diagnosing & Treating (306 | 8.9%), Computers & Mathematics (301 | 8.7%), and Community & Social Service (241 | 7.0%).
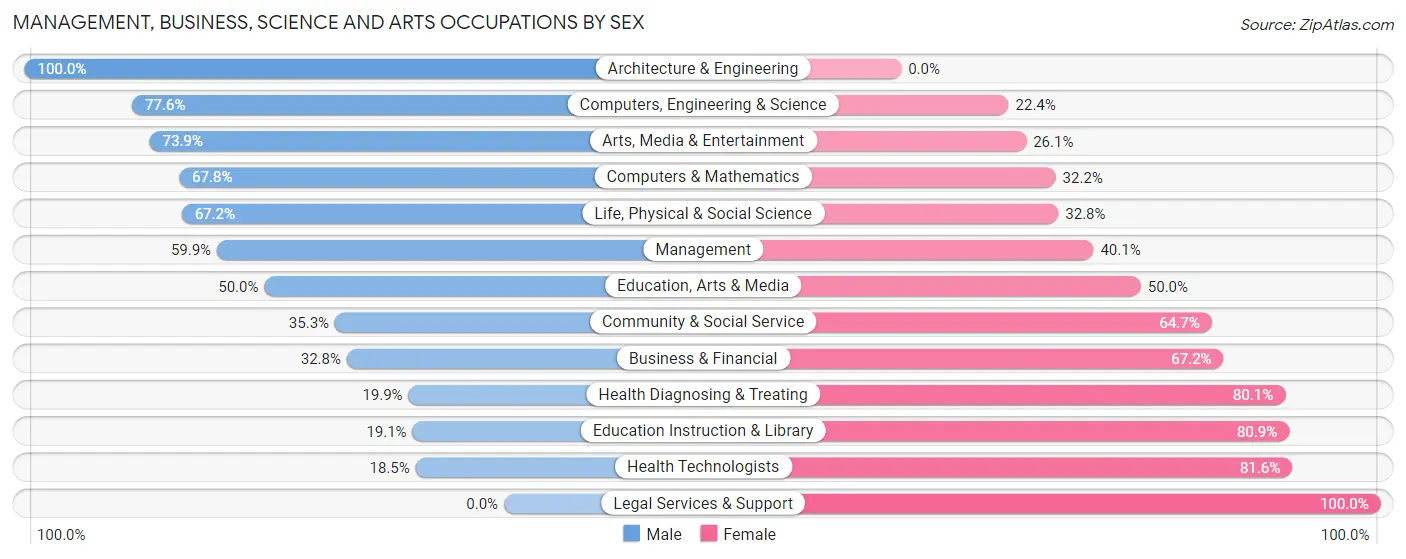
Management, Business, Science and Arts Occupations by Sex
Within the Management, Business, Science and Arts occupations in Pinehurst, the most male-oriented occupations are Architecture & Engineering (100.0%), Computers, Engineering & Science (77.6%), and Arts, Media & Entertainment (73.9%), while the most female-oriented occupations are Legal Services & Support (100.0%), Health Technologists (81.6%), and Education Instruction & Library (80.9%).
| Occupation | Male | Female |
| Management | 291 (59.9%) | 195 (40.1%) |
| Business & Financial | 60 (32.8%) | 123 (67.2%) |
| Computers, Engineering & Science | 405 (77.6%) | 117 (22.4%) |
| Computers & Mathematics | 204 (67.8%) | 97 (32.2%) |
| Architecture & Engineering | 160 (100.0%) | 0 (0.0%) |
| Life, Physical & Social Science | 41 (67.2%) | 20 (32.8%) |
| Community & Social Service | 85 (35.3%) | 156 (64.7%) |
| Education, Arts & Media | 13 (50.0%) | 13 (50.0%) |
| Legal Services & Support | 0 (0.0%) | 36 (100.0%) |
| Education Instruction & Library | 21 (19.1%) | 89 (80.9%) |
| Arts, Media & Entertainment | 51 (73.9%) | 18 (26.1%) |
| Health Diagnosing & Treating | 61 (19.9%) | 245 (80.1%) |
| Health Technologists | 31 (18.4%) | 137 (81.6%) |
| Total (Category) | 902 (51.9%) | 836 (48.1%) |
| Total (Overall) | 1,792 (52.0%) | 1,656 (48.0%) |
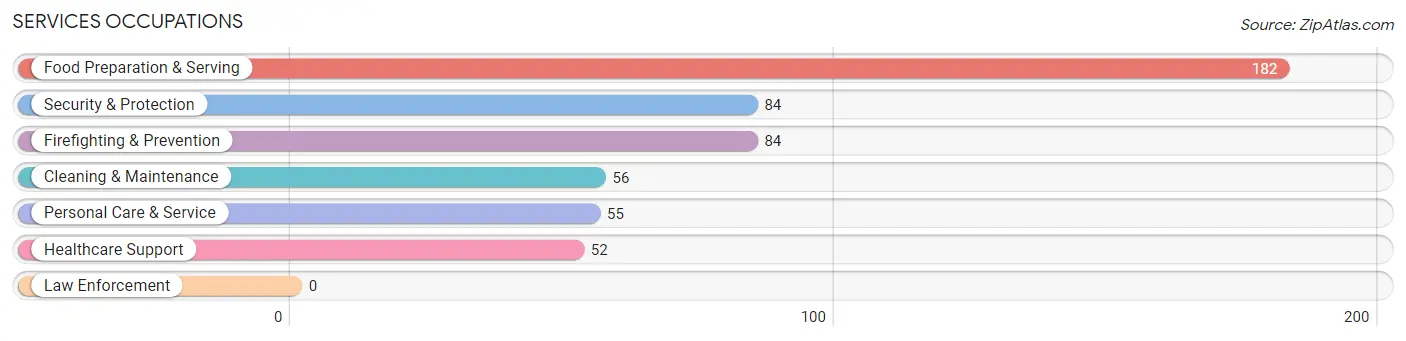
Services Occupations
The most common Services occupations in Pinehurst are Food Preparation & Serving (182 | 5.3%), Security & Protection (84 | 2.4%), Firefighting & Prevention (84 | 2.4%), Cleaning & Maintenance (56 | 1.6%), and Personal Care & Service (55 | 1.6%).
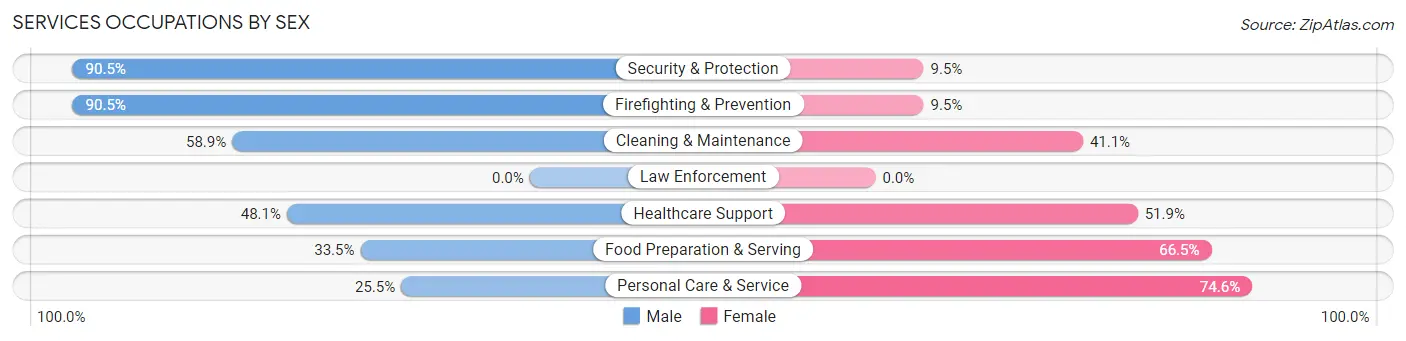
Services Occupations by Sex
Within the Services occupations in Pinehurst, the most male-oriented occupations are Security & Protection (90.5%), Firefighting & Prevention (90.5%), and Cleaning & Maintenance (58.9%), while the most female-oriented occupations are Personal Care & Service (74.6%), Food Preparation & Serving (66.5%), and Healthcare Support (51.9%).
| Occupation | Male | Female |
| Healthcare Support | 25 (48.1%) | 27 (51.9%) |
| Security & Protection | 76 (90.5%) | 8 (9.5%) |
| Firefighting & Prevention | 76 (90.5%) | 8 (9.5%) |
| Law Enforcement | 0 (0.0%) | 0 (0.0%) |
| Food Preparation & Serving | 61 (33.5%) | 121 (66.5%) |
| Cleaning & Maintenance | 33 (58.9%) | 23 (41.1%) |
| Personal Care & Service | 14 (25.5%) | 41 (74.6%) |
| Total (Category) | 209 (48.7%) | 220 (51.3%) |
| Total (Overall) | 1,792 (52.0%) | 1,656 (48.0%) |
Sales and Office Occupations
The most common Sales and Office occupations in Pinehurst are Office & Administration (381 | 11.1%), and Sales & Related (269 | 7.8%).
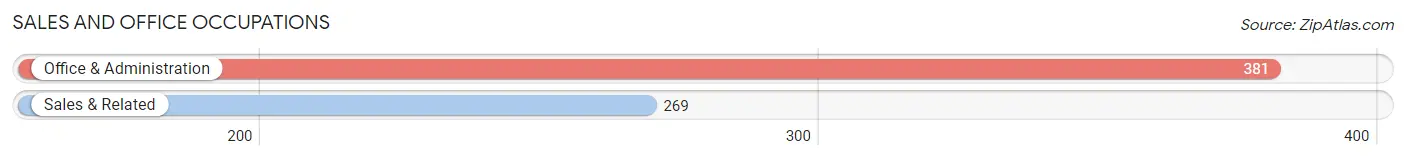
Sales and Office Occupations by Sex
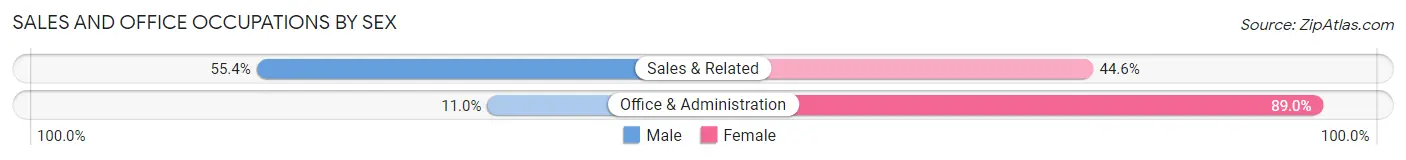
| Occupation | Male | Female |
| Sales & Related | 149 (55.4%) | 120 (44.6%) |
| Office & Administration | 42 (11.0%) | 339 (89.0%) |
| Total (Category) | 191 (29.4%) | 459 (70.6%) |
| Total (Overall) | 1,792 (52.0%) | 1,656 (48.0%) |
Natural Resources, Construction and Maintenance Occupations
The most common Natural Resources, Construction and Maintenance occupations in Pinehurst are Construction & Extraction (235 | 6.8%), and Installation, Maintenance & Repair (123 | 3.6%).
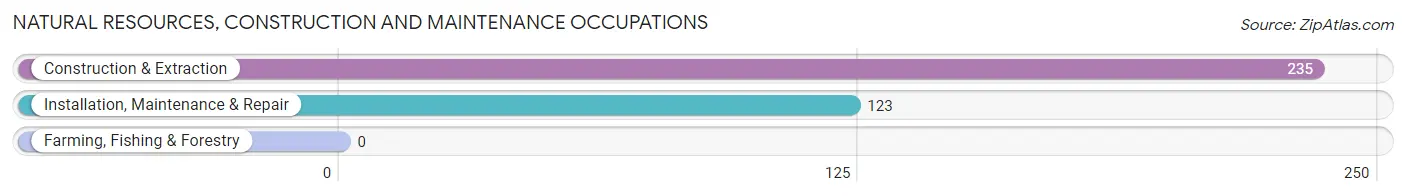
Natural Resources, Construction and Maintenance Occupations by Sex
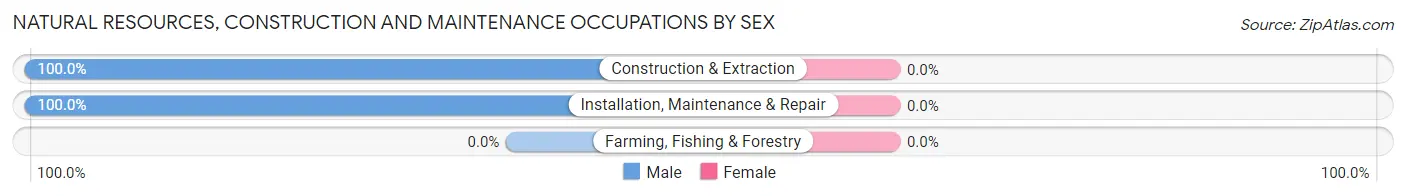
| Occupation | Male | Female |
| Farming, Fishing & Forestry | 0 (0.0%) | 0 (0.0%) |
| Construction & Extraction | 235 (100.0%) | 0 (0.0%) |
| Installation, Maintenance & Repair | 123 (100.0%) | 0 (0.0%) |
| Total (Category) | 358 (100.0%) | 0 (0.0%) |
| Total (Overall) | 1,792 (52.0%) | 1,656 (48.0%) |
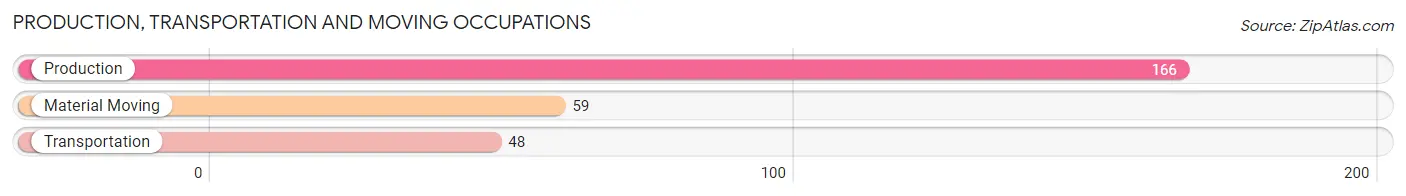
Production, Transportation and Moving Occupations
The most common Production, Transportation and Moving occupations in Pinehurst are Production (166 | 4.8%), Material Moving (59 | 1.7%), and Transportation (48 | 1.4%).
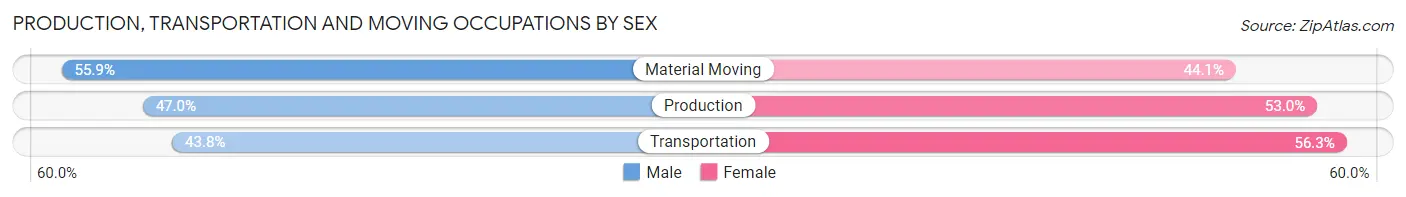
Production, Transportation and Moving Occupations by Sex
| Occupation | Male | Female |
| Production | 78 (47.0%) | 88 (53.0%) |
| Transportation | 21 (43.8%) | 27 (56.2%) |
| Material Moving | 33 (55.9%) | 26 (44.1%) |
| Total (Category) | 132 (48.3%) | 141 (51.6%) |
| Total (Overall) | 1,792 (52.0%) | 1,656 (48.0%) |
Employment Industries by Sex in Pinehurst
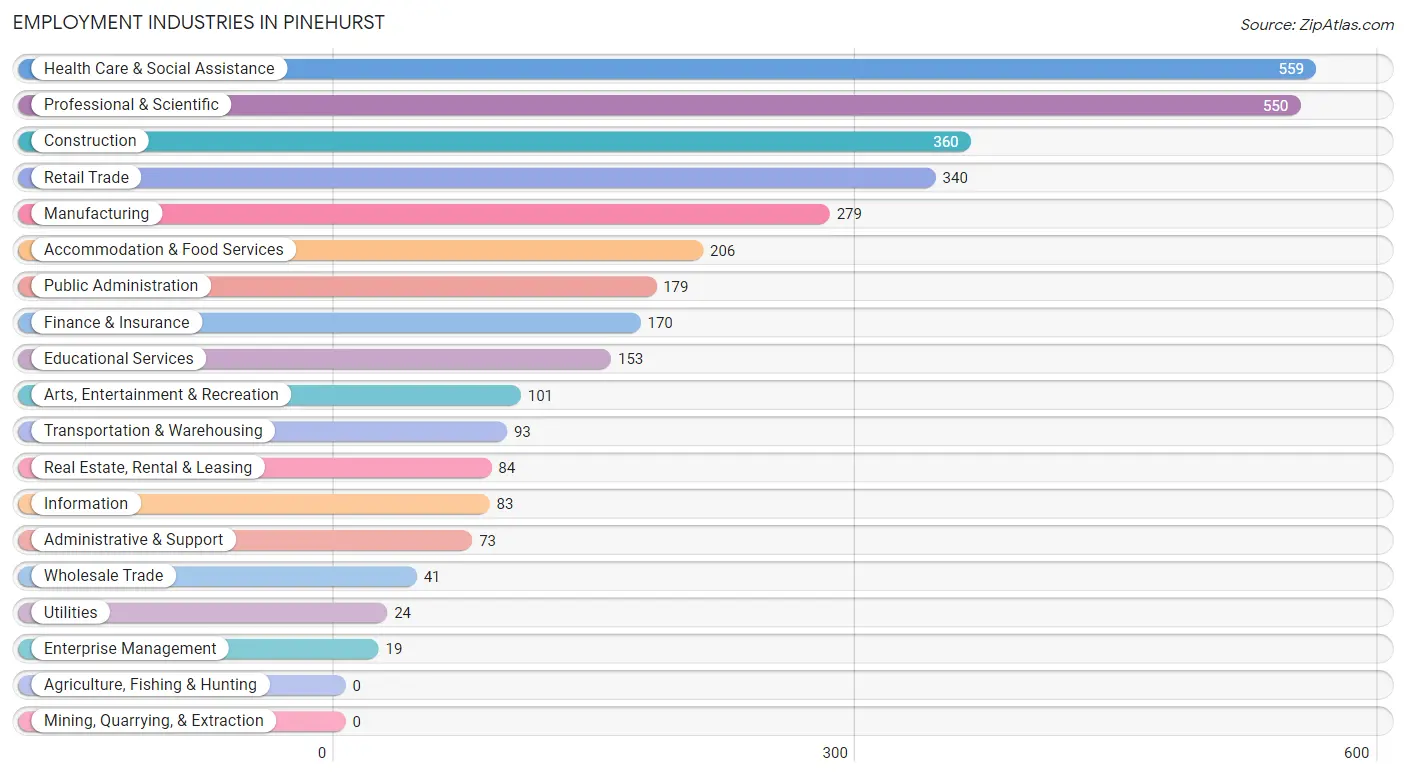
Employment Industries in Pinehurst
The major employment industries in Pinehurst include Health Care & Social Assistance (559 | 16.2%), Professional & Scientific (550 | 16.0%), Construction (360 | 10.4%), Retail Trade (340 | 9.9%), and Manufacturing (279 | 8.1%).
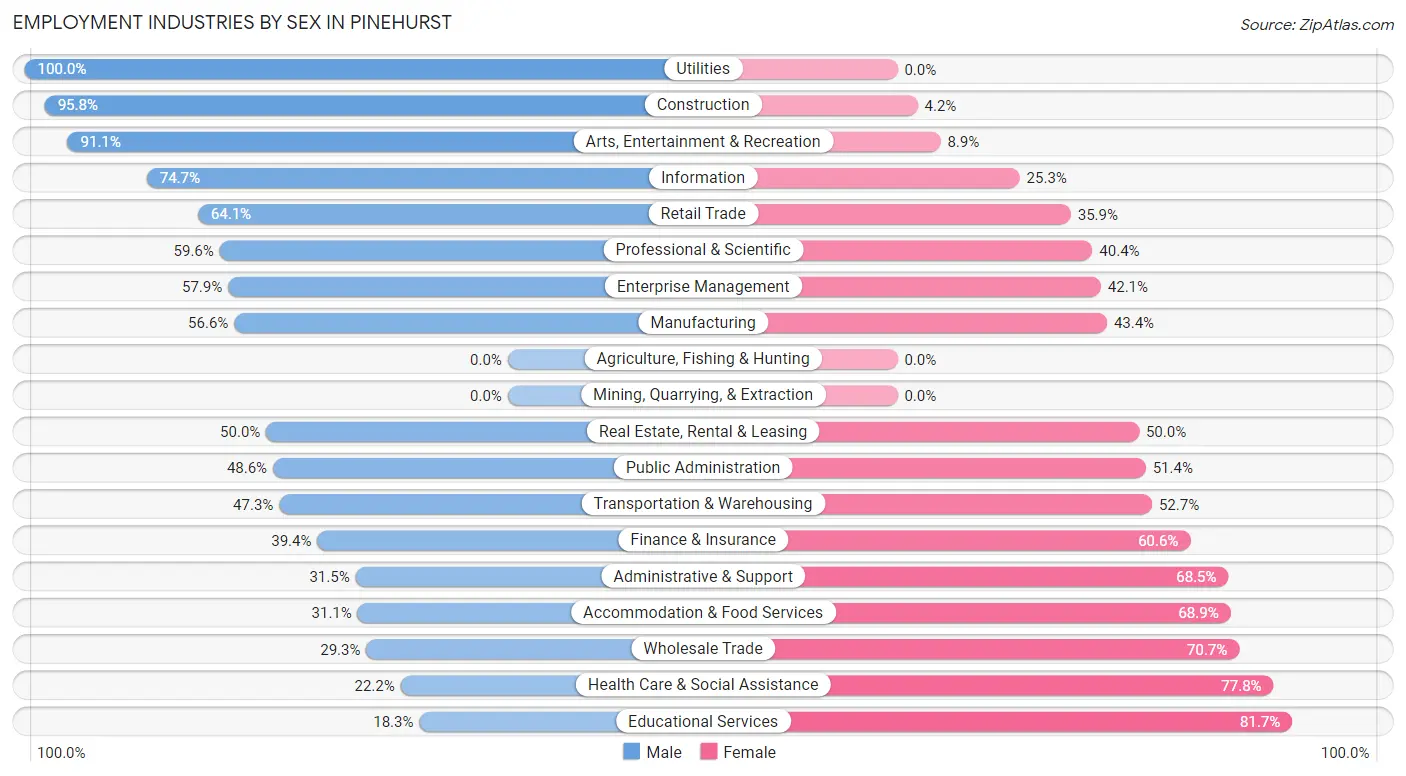
Employment Industries by Sex in Pinehurst
The Pinehurst industries that see more men than women are Utilities (100.0%), Construction (95.8%), and Arts, Entertainment & Recreation (91.1%), whereas the industries that tend to have a higher number of women are Educational Services (81.7%), Health Care & Social Assistance (77.8%), and Wholesale Trade (70.7%).
| Industry | Male | Female |
| Agriculture, Fishing & Hunting | 0 (0.0%) | 0 (0.0%) |
| Mining, Quarrying, & Extraction | 0 (0.0%) | 0 (0.0%) |
| Construction | 345 (95.8%) | 15 (4.2%) |
| Manufacturing | 158 (56.6%) | 121 (43.4%) |
| Wholesale Trade | 12 (29.3%) | 29 (70.7%) |
| Retail Trade | 218 (64.1%) | 122 (35.9%) |
| Transportation & Warehousing | 44 (47.3%) | 49 (52.7%) |
| Utilities | 24 (100.0%) | 0 (0.0%) |
| Information | 62 (74.7%) | 21 (25.3%) |
| Finance & Insurance | 67 (39.4%) | 103 (60.6%) |
| Real Estate, Rental & Leasing | 42 (50.0%) | 42 (50.0%) |
| Professional & Scientific | 328 (59.6%) | 222 (40.4%) |
| Enterprise Management | 11 (57.9%) | 8 (42.1%) |
| Administrative & Support | 23 (31.5%) | 50 (68.5%) |
| Educational Services | 28 (18.3%) | 125 (81.7%) |
| Health Care & Social Assistance | 124 (22.2%) | 435 (77.8%) |
| Arts, Entertainment & Recreation | 92 (91.1%) | 9 (8.9%) |
| Accommodation & Food Services | 64 (31.1%) | 142 (68.9%) |
| Public Administration | 87 (48.6%) | 92 (51.4%) |
| Total | 1,792 (52.0%) | 1,656 (48.0%) |
Education in Pinehurst
School Enrollment in Pinehurst
The most common levels of schooling among the 1,366 students in Pinehurst are middle school (343 | 25.1%), high school (341 | 25.0%), and elementary school (245 | 17.9%).
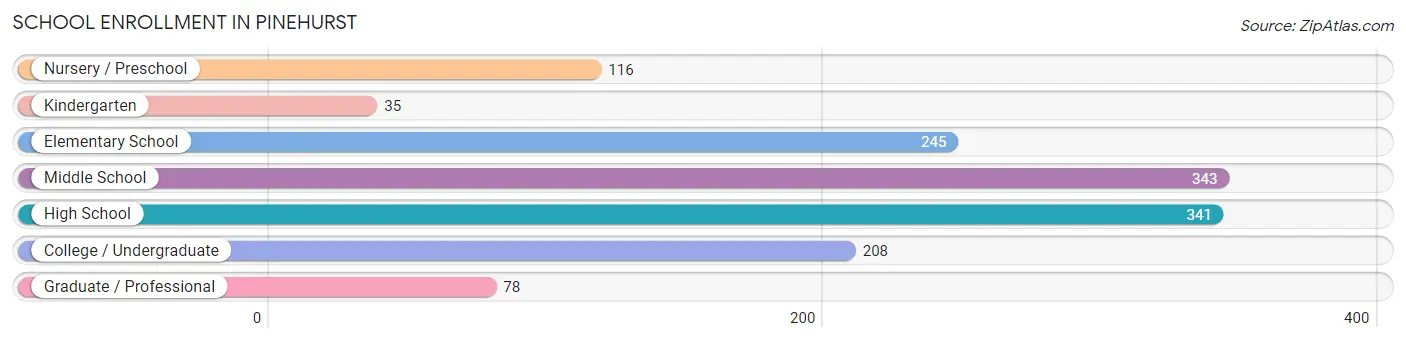
| School Level | # Students | % Students |
| Nursery / Preschool | 116 | 8.5% |
| Kindergarten | 35 | 2.6% |
| Elementary School | 245 | 17.9% |
| Middle School | 343 | 25.1% |
| High School | 341 | 25.0% |
| College / Undergraduate | 208 | 15.2% |
| Graduate / Professional | 78 | 5.7% |
| Total | 1,366 | 100.0% |
School Enrollment by Age by Funding Source in Pinehurst
Out of a total of 1,366 students who are enrolled in schools in Pinehurst, 161 (11.8%) attend a private institution, while the remaining 1,205 (88.2%) are enrolled in public schools. The age group of 3 to 4 year olds has the highest likelihood of being enrolled in private schools, with 26 (35.6% in the age bracket) enrolled. Conversely, the age group of 18 to 19 year olds has the lowest likelihood of being enrolled in a private school, with 47 (100.0% in the age bracket) attending a public institution.
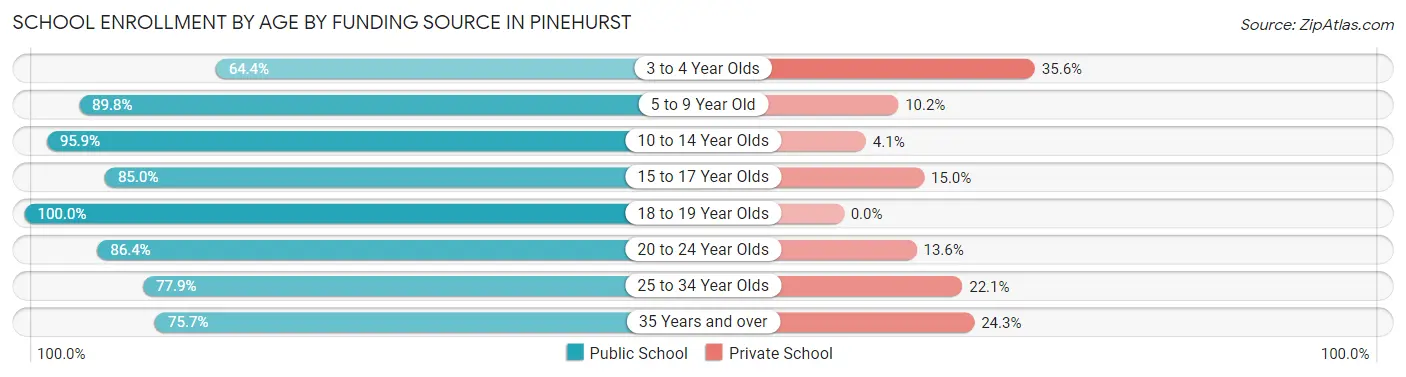
| Age Bracket | Public School | Private School |
| 3 to 4 Year Olds | 47 (64.4%) | 26 (35.6%) |
| 5 to 9 Year Old | 274 (89.8%) | 31 (10.2%) |
| 10 to 14 Year Olds | 394 (95.9%) | 17 (4.1%) |
| 15 to 17 Year Olds | 227 (85.0%) | 40 (15.0%) |
| 18 to 19 Year Olds | 47 (100.0%) | 0 (0.0%) |
| 20 to 24 Year Olds | 121 (86.4%) | 19 (13.6%) |
| 25 to 34 Year Olds | 67 (77.9%) | 19 (22.1%) |
| 35 Years and over | 28 (75.7%) | 9 (24.3%) |
| Total | 1,205 (88.2%) | 161 (11.8%) |
Educational Attainment by Field of Study in Pinehurst
Business (315 | 16.8%), science & technology (305 | 16.2%), engineering (225 | 12.0%), computers & mathematics (157 | 8.4%), and education (156 | 8.3%) are the most common fields of study among 1,879 individuals in Pinehurst who have obtained a bachelor's degree or higher.
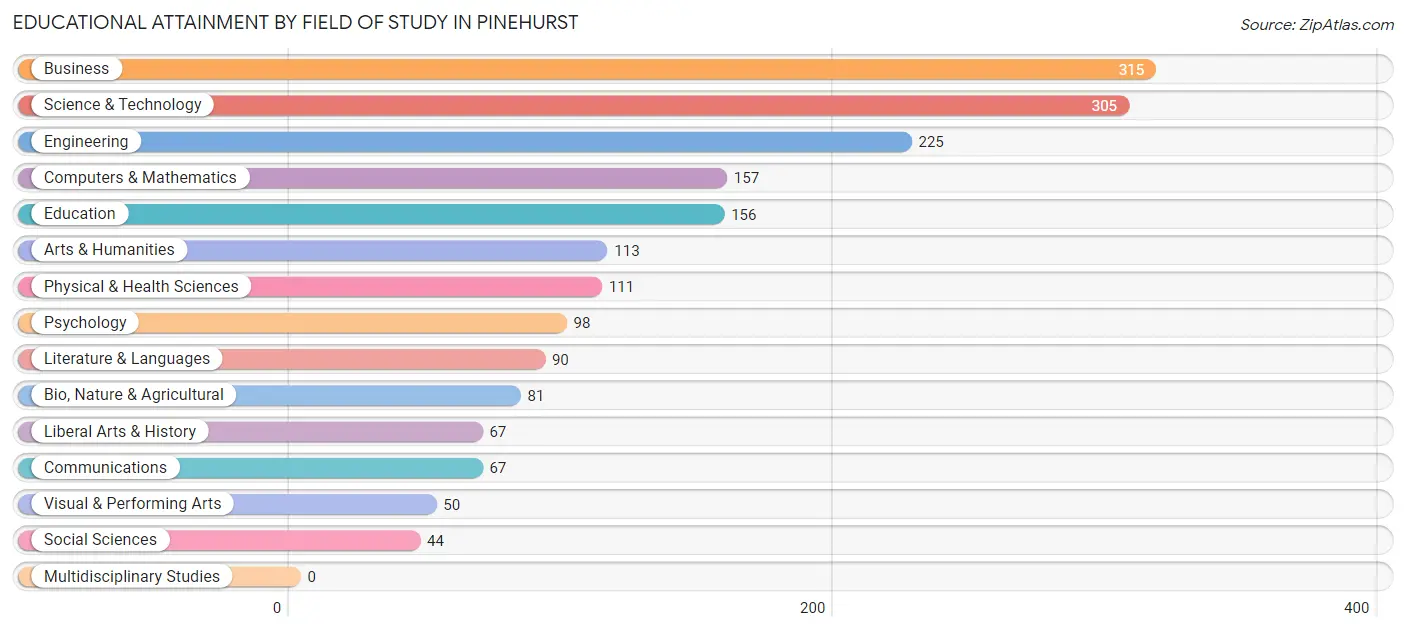
| Field of Study | # Graduates | % Graduates |
| Computers & Mathematics | 157 | 8.4% |
| Bio, Nature & Agricultural | 81 | 4.3% |
| Physical & Health Sciences | 111 | 5.9% |
| Psychology | 98 | 5.2% |
| Social Sciences | 44 | 2.3% |
| Engineering | 225 | 12.0% |
| Multidisciplinary Studies | 0 | 0.0% |
| Science & Technology | 305 | 16.2% |
| Business | 315 | 16.8% |
| Education | 156 | 8.3% |
| Literature & Languages | 90 | 4.8% |
| Liberal Arts & History | 67 | 3.6% |
| Visual & Performing Arts | 50 | 2.7% |
| Communications | 67 | 3.6% |
| Arts & Humanities | 113 | 6.0% |
| Total | 1,879 | 100.0% |
Transportation & Commute in Pinehurst
Vehicle Availability by Sex in Pinehurst
The most prevalent vehicle ownership categories in Pinehurst are males with 2 vehicles (604, accounting for 34.0%) and females with 2 vehicles (684, making up 36.7%).
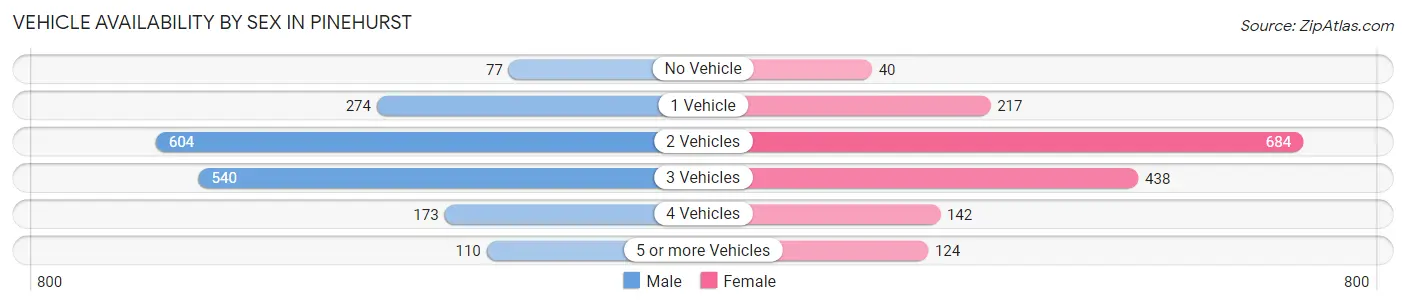
| Vehicles Available | Male | Female |
| No Vehicle | 77 (4.3%) | 40 (2.4%) |
| 1 Vehicle | 274 (15.4%) | 217 (13.2%) |
| 2 Vehicles | 604 (34.0%) | 684 (41.6%) |
| 3 Vehicles | 540 (30.4%) | 438 (26.6%) |
| 4 Vehicles | 173 (9.7%) | 142 (8.6%) |
| 5 or more Vehicles | 110 (6.2%) | 124 (7.5%) |
| Total | 1,778 (100.0%) | 1,645 (100.0%) |
Commute Time in Pinehurst
The most frequently occuring commute durations in Pinehurst are 30 to 34 minutes (537 commuters, 18.2%), 20 to 24 minutes (422 commuters, 14.3%), and 15 to 19 minutes (375 commuters, 12.8%).
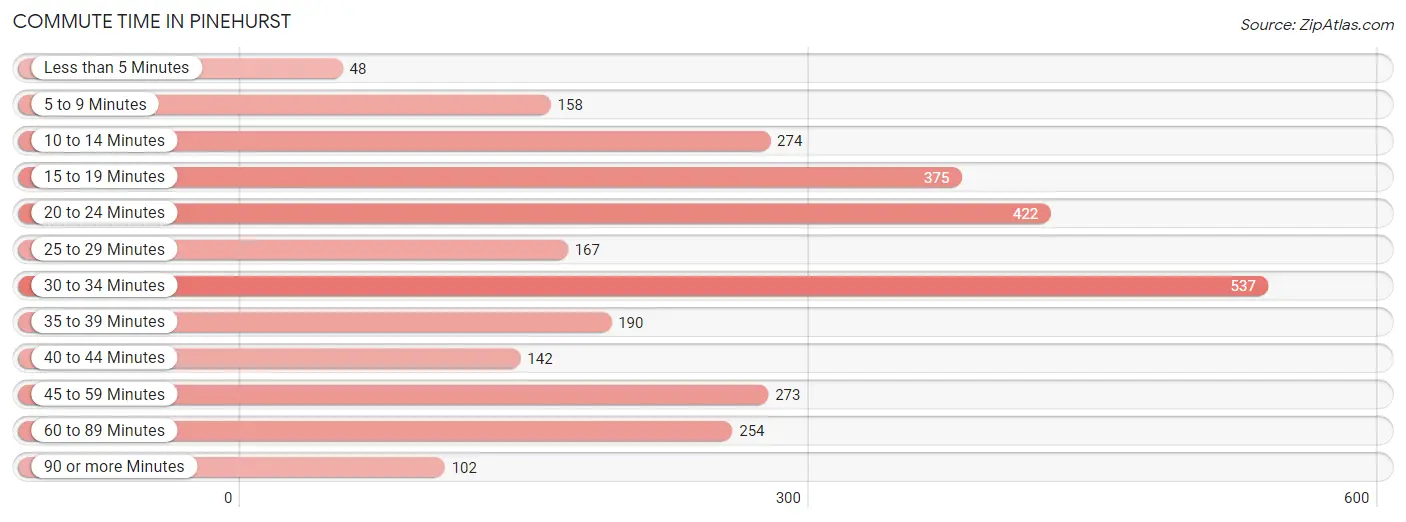
| Commute Time | # Commuters | % Commuters |
| Less than 5 Minutes | 48 | 1.6% |
| 5 to 9 Minutes | 158 | 5.4% |
| 10 to 14 Minutes | 274 | 9.3% |
| 15 to 19 Minutes | 375 | 12.8% |
| 20 to 24 Minutes | 422 | 14.3% |
| 25 to 29 Minutes | 167 | 5.7% |
| 30 to 34 Minutes | 537 | 18.2% |
| 35 to 39 Minutes | 190 | 6.5% |
| 40 to 44 Minutes | 142 | 4.8% |
| 45 to 59 Minutes | 273 | 9.3% |
| 60 to 89 Minutes | 254 | 8.6% |
| 90 or more Minutes | 102 | 3.5% |
Commute Time by Sex in Pinehurst
The most common commute times in Pinehurst are 30 to 34 minutes (290 commuters, 19.1%) for males and 30 to 34 minutes (247 commuters, 17.3%) for females.
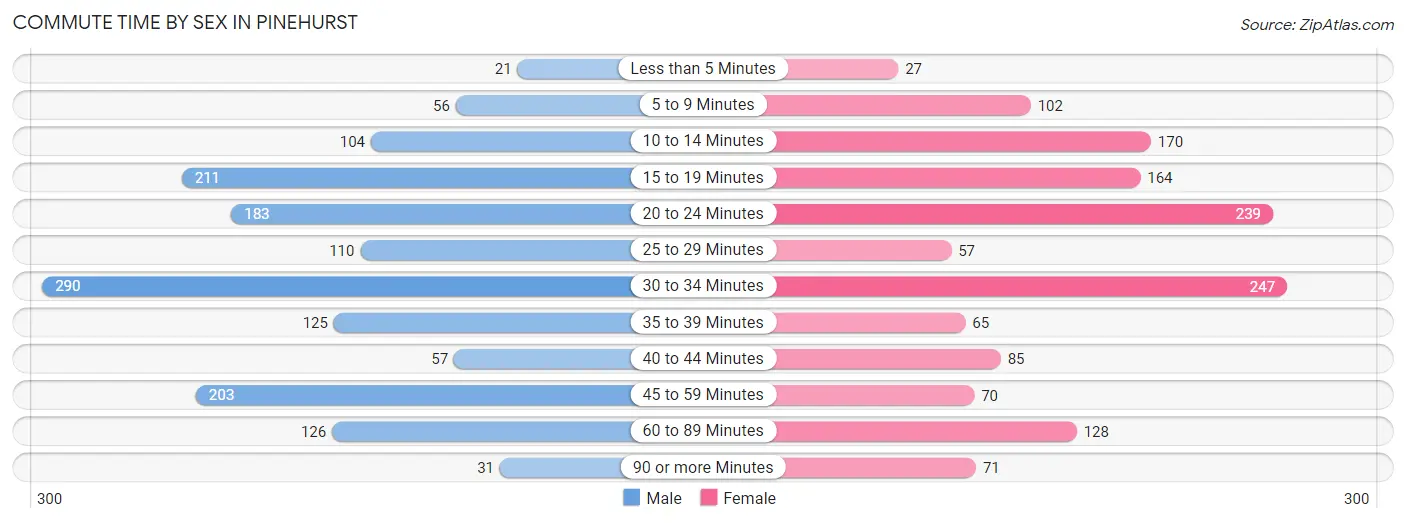
| Commute Time | Male | Female |
| Less than 5 Minutes | 21 (1.4%) | 27 (1.9%) |
| 5 to 9 Minutes | 56 (3.7%) | 102 (7.2%) |
| 10 to 14 Minutes | 104 (6.9%) | 170 (11.9%) |
| 15 to 19 Minutes | 211 (13.9%) | 164 (11.5%) |
| 20 to 24 Minutes | 183 (12.1%) | 239 (16.8%) |
| 25 to 29 Minutes | 110 (7.2%) | 57 (4.0%) |
| 30 to 34 Minutes | 290 (19.1%) | 247 (17.3%) |
| 35 to 39 Minutes | 125 (8.2%) | 65 (4.6%) |
| 40 to 44 Minutes | 57 (3.8%) | 85 (6.0%) |
| 45 to 59 Minutes | 203 (13.4%) | 70 (4.9%) |
| 60 to 89 Minutes | 126 (8.3%) | 128 (9.0%) |
| 90 or more Minutes | 31 (2.0%) | 71 (5.0%) |
Time of Departure to Work by Sex in Pinehurst
The most frequent times of departure to work in Pinehurst are 6:30 AM to 6:59 AM (281, 18.5%) for males and 7:00 AM to 7:29 AM (227, 15.9%) for females.
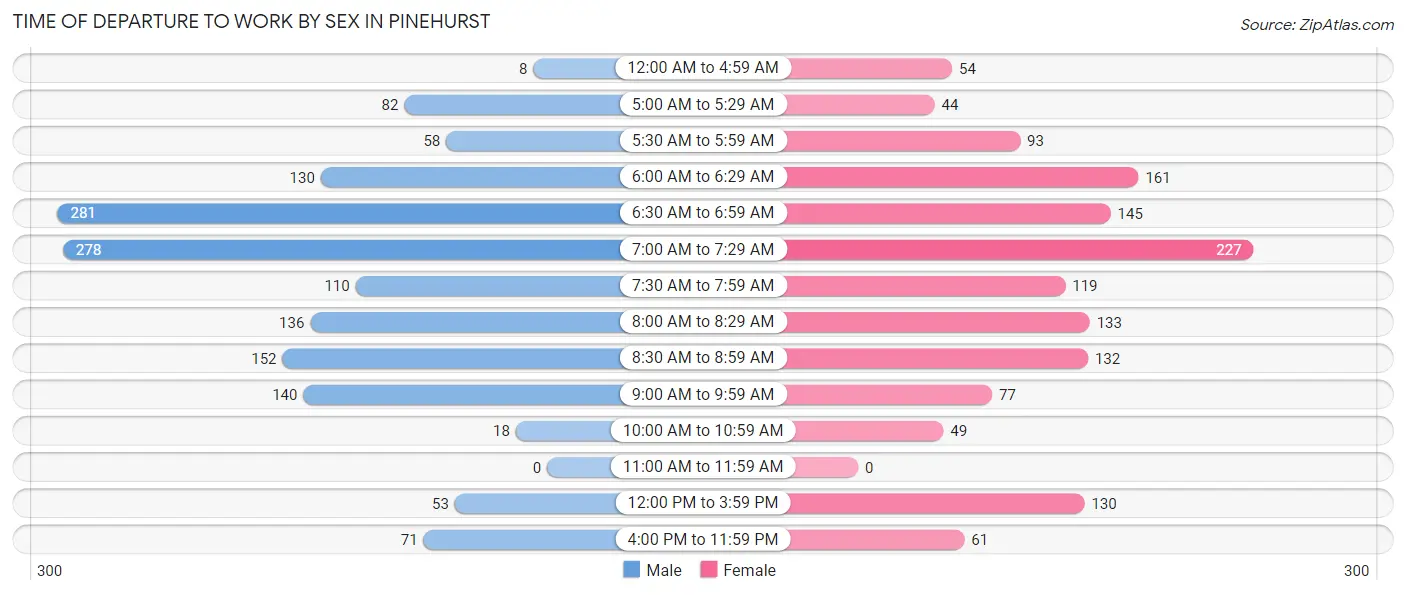
| Time of Departure | Male | Female |
| 12:00 AM to 4:59 AM | 8 (0.5%) | 54 (3.8%) |
| 5:00 AM to 5:29 AM | 82 (5.4%) | 44 (3.1%) |
| 5:30 AM to 5:59 AM | 58 (3.8%) | 93 (6.5%) |
| 6:00 AM to 6:29 AM | 130 (8.6%) | 161 (11.3%) |
| 6:30 AM to 6:59 AM | 281 (18.5%) | 145 (10.2%) |
| 7:00 AM to 7:29 AM | 278 (18.3%) | 227 (15.9%) |
| 7:30 AM to 7:59 AM | 110 (7.2%) | 119 (8.4%) |
| 8:00 AM to 8:29 AM | 136 (9.0%) | 133 (9.3%) |
| 8:30 AM to 8:59 AM | 152 (10.0%) | 132 (9.3%) |
| 9:00 AM to 9:59 AM | 140 (9.2%) | 77 (5.4%) |
| 10:00 AM to 10:59 AM | 18 (1.2%) | 49 (3.4%) |
| 11:00 AM to 11:59 AM | 0 (0.0%) | 0 (0.0%) |
| 12:00 PM to 3:59 PM | 53 (3.5%) | 130 (9.1%) |
| 4:00 PM to 11:59 PM | 71 (4.7%) | 61 (4.3%) |
| Total | 1,517 (100.0%) | 1,425 (100.0%) |
Housing Occupancy in Pinehurst
Occupancy by Ownership in Pinehurst
Of the total 2,329 dwellings in Pinehurst, owner-occupied units account for 2,264 (97.2%), while renter-occupied units make up 65 (2.8%).
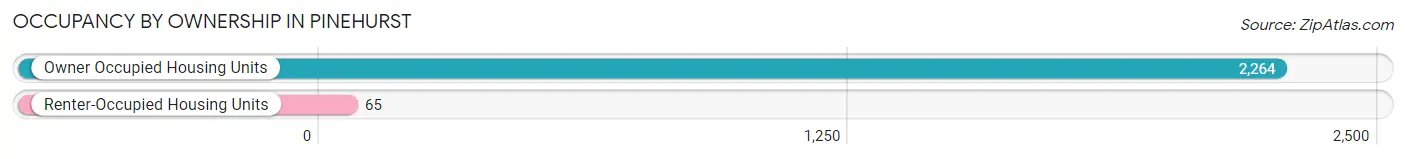
| Occupancy | # Housing Units | % Housing Units |
| Owner Occupied Housing Units | 2,264 | 97.2% |
| Renter-Occupied Housing Units | 65 | 2.8% |
| Total Occupied Housing Units | 2,329 | 100.0% |
Occupancy by Household Size in Pinehurst
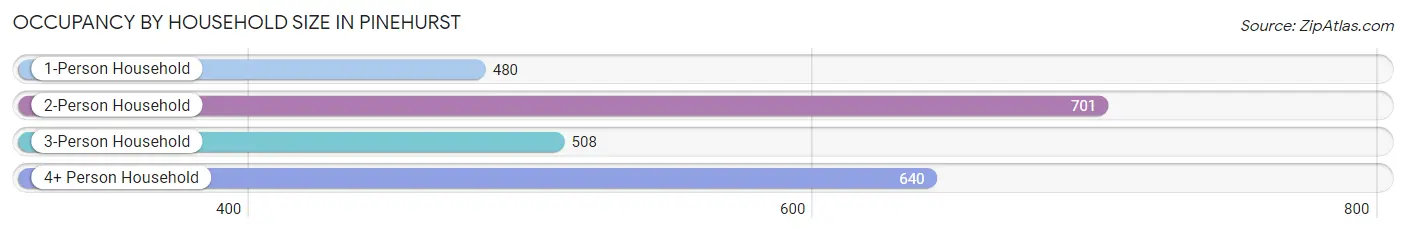
| Household Size | # Housing Units | % Housing Units |
| 1-Person Household | 480 | 20.6% |
| 2-Person Household | 701 | 30.1% |
| 3-Person Household | 508 | 21.8% |
| 4+ Person Household | 640 | 27.5% |
| Total Housing Units | 2,329 | 100.0% |
Occupancy by Ownership by Household Size in Pinehurst
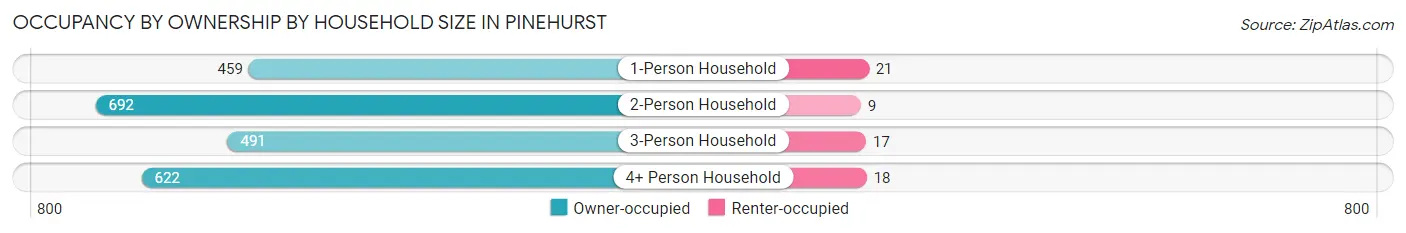
| Household Size | Owner-occupied | Renter-occupied |
| 1-Person Household | 459 (95.6%) | 21 (4.4%) |
| 2-Person Household | 692 (98.7%) | 9 (1.3%) |
| 3-Person Household | 491 (96.7%) | 17 (3.4%) |
| 4+ Person Household | 622 (97.2%) | 18 (2.8%) |
| Total Housing Units | 2,264 (97.2%) | 65 (2.8%) |
Occupancy by Educational Attainment in Pinehurst
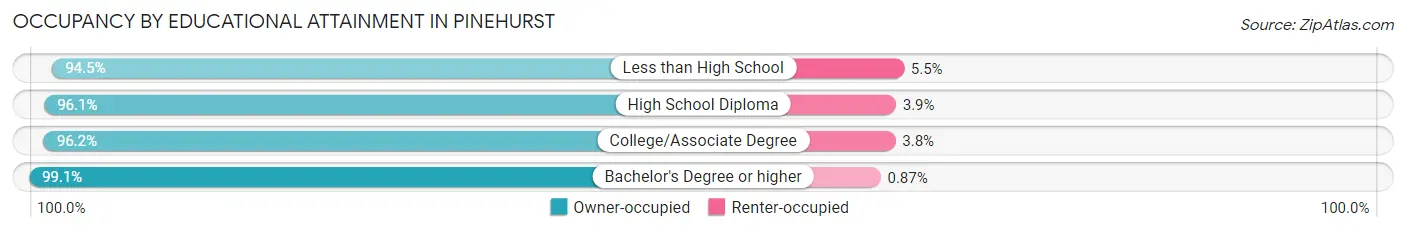
| Household Size | Owner-occupied | Renter-occupied |
| Less than High School | 155 (94.5%) | 9 (5.5%) |
| High School Diploma | 445 (96.1%) | 18 (3.9%) |
| College/Associate Degree | 757 (96.2%) | 30 (3.8%) |
| Bachelor's Degree or higher | 907 (99.1%) | 8 (0.9%) |
Occupancy by Age of Householder in Pinehurst
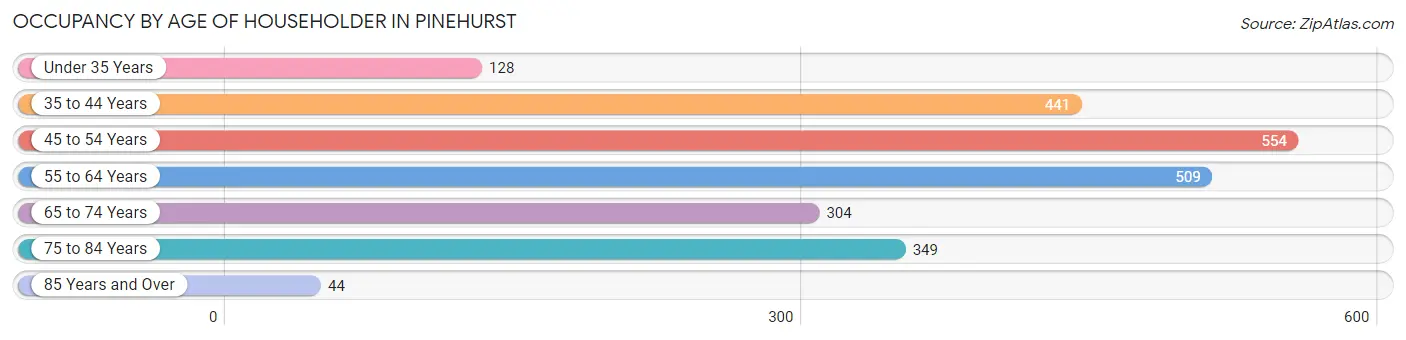
| Age Bracket | # Households | % Households |
| Under 35 Years | 128 | 5.5% |
| 35 to 44 Years | 441 | 18.9% |
| 45 to 54 Years | 554 | 23.8% |
| 55 to 64 Years | 509 | 21.8% |
| 65 to 74 Years | 304 | 13.1% |
| 75 to 84 Years | 349 | 15.0% |
| 85 Years and Over | 44 | 1.9% |
| Total | 2,329 | 100.0% |
Housing Finances in Pinehurst
Median Income by Occupancy in Pinehurst
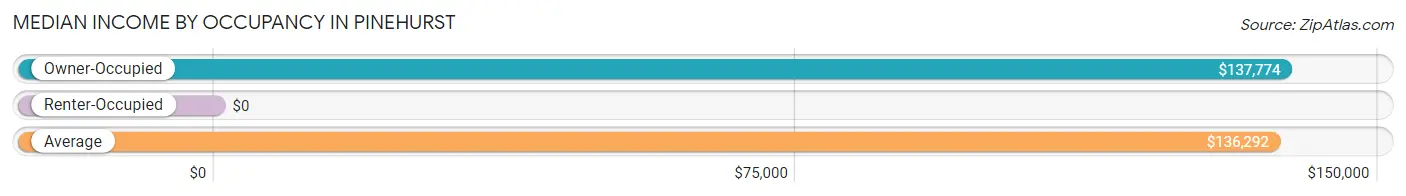
| Occupancy Type | # Households | Median Income |
| Owner-Occupied | 2,264 (97.2%) | $137,774 |
| Renter-Occupied | 65 (2.8%) | $0 |
| Average | 2,329 (100.0%) | $136,292 |
Occupancy by Householder Income Bracket in Pinehurst
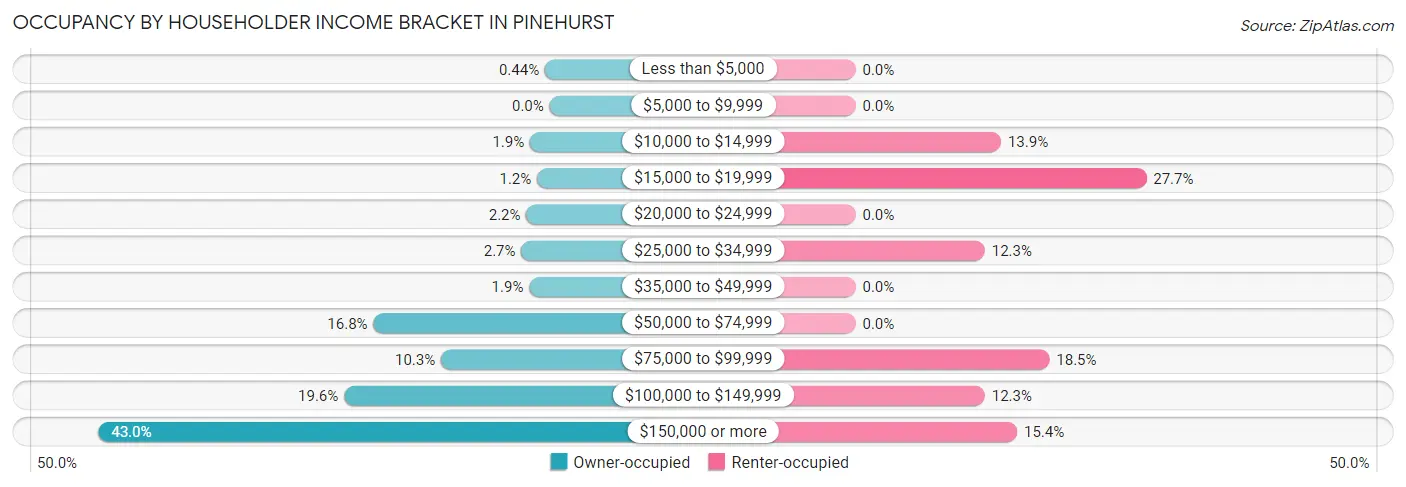
| Income Bracket | Owner-occupied | Renter-occupied |
| Less than $5,000 | 10 (0.4%) | 0 (0.0%) |
| $5,000 to $9,999 | 0 (0.0%) | 0 (0.0%) |
| $10,000 to $14,999 | 42 (1.9%) | 9 (13.9%) |
| $15,000 to $19,999 | 27 (1.2%) | 18 (27.7%) |
| $20,000 to $24,999 | 50 (2.2%) | 0 (0.0%) |
| $25,000 to $34,999 | 61 (2.7%) | 8 (12.3%) |
| $35,000 to $49,999 | 44 (1.9%) | 0 (0.0%) |
| $50,000 to $74,999 | 380 (16.8%) | 0 (0.0%) |
| $75,000 to $99,999 | 234 (10.3%) | 12 (18.5%) |
| $100,000 to $149,999 | 443 (19.6%) | 8 (12.3%) |
| $150,000 or more | 973 (43.0%) | 10 (15.4%) |
| Total | 2,264 (100.0%) | 65 (100.0%) |
Monthly Housing Cost Tiers in Pinehurst
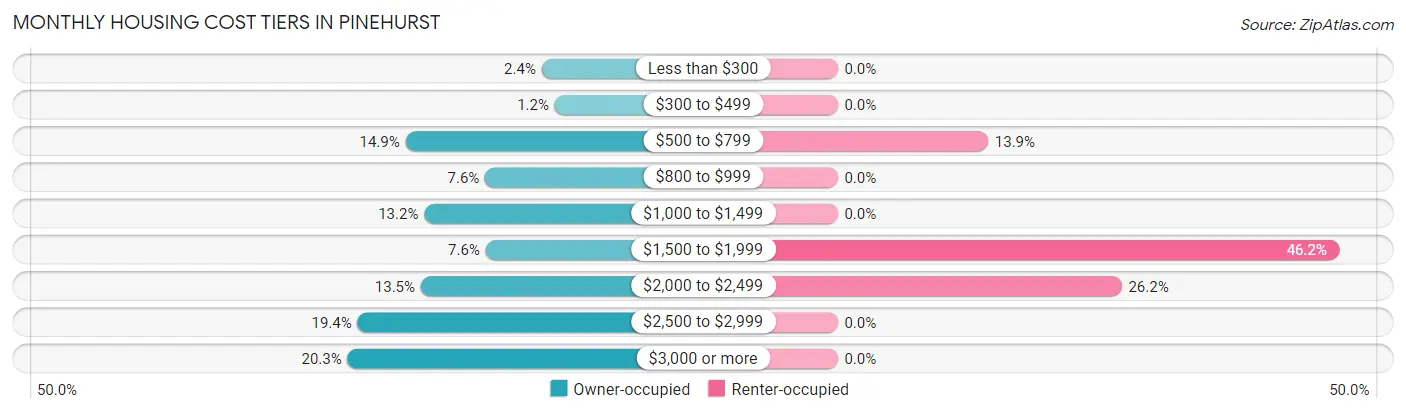
| Monthly Cost | Owner-occupied | Renter-occupied |
| Less than $300 | 54 (2.4%) | 0 (0.0%) |
| $300 to $499 | 27 (1.2%) | 0 (0.0%) |
| $500 to $799 | 338 (14.9%) | 9 (13.9%) |
| $800 to $999 | 172 (7.6%) | 0 (0.0%) |
| $1,000 to $1,499 | 299 (13.2%) | 0 (0.0%) |
| $1,500 to $1,999 | 171 (7.5%) | 30 (46.2%) |
| $2,000 to $2,499 | 306 (13.5%) | 17 (26.2%) |
| $2,500 to $2,999 | 438 (19.4%) | 0 (0.0%) |
| $3,000 or more | 459 (20.3%) | 0 (0.0%) |
| Total | 2,264 (100.0%) | 65 (100.0%) |
Physical Housing Characteristics in Pinehurst
Housing Structures in Pinehurst
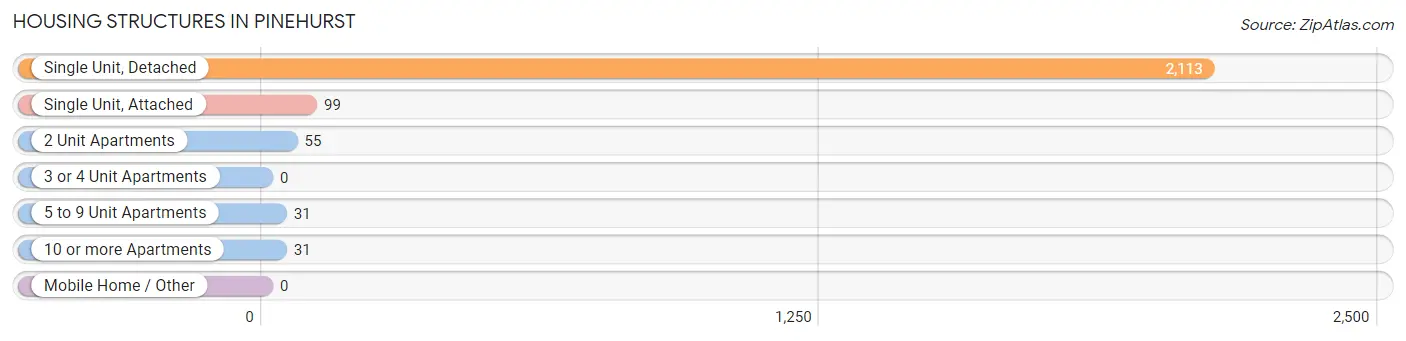
| Structure Type | # Housing Units | % Housing Units |
| Single Unit, Detached | 2,113 | 90.7% |
| Single Unit, Attached | 99 | 4.3% |
| 2 Unit Apartments | 55 | 2.4% |
| 3 or 4 Unit Apartments | 0 | 0.0% |
| 5 to 9 Unit Apartments | 31 | 1.3% |
| 10 or more Apartments | 31 | 1.3% |
| Mobile Home / Other | 0 | 0.0% |
| Total | 2,329 | 100.0% |
Housing Structures by Occupancy in Pinehurst
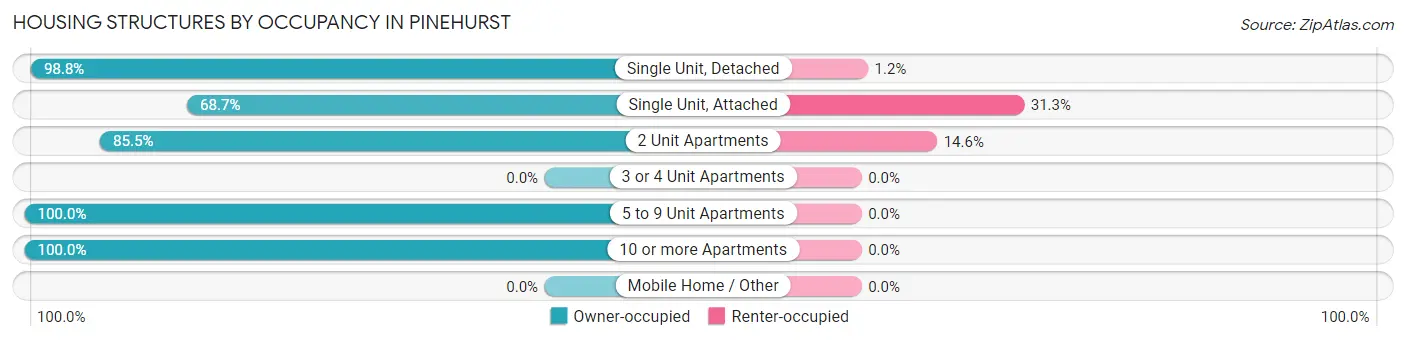
| Structure Type | Owner-occupied | Renter-occupied |
| Single Unit, Detached | 2,087 (98.8%) | 26 (1.2%) |
| Single Unit, Attached | 68 (68.7%) | 31 (31.3%) |
| 2 Unit Apartments | 47 (85.5%) | 8 (14.5%) |
| 3 or 4 Unit Apartments | 0 (0.0%) | 0 (0.0%) |
| 5 to 9 Unit Apartments | 31 (100.0%) | 0 (0.0%) |
| 10 or more Apartments | 31 (100.0%) | 0 (0.0%) |
| Mobile Home / Other | 0 (0.0%) | 0 (0.0%) |
| Total | 2,264 (97.2%) | 65 (2.8%) |
Housing Structures by Number of Rooms in Pinehurst
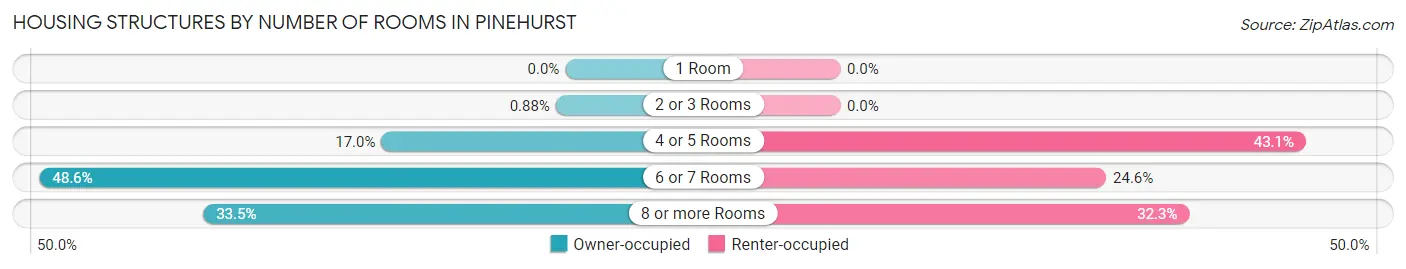
| Number of Rooms | Owner-occupied | Renter-occupied |
| 1 Room | 0 (0.0%) | 0 (0.0%) |
| 2 or 3 Rooms | 20 (0.9%) | 0 (0.0%) |
| 4 or 5 Rooms | 385 (17.0%) | 28 (43.1%) |
| 6 or 7 Rooms | 1,101 (48.6%) | 16 (24.6%) |
| 8 or more Rooms | 758 (33.5%) | 21 (32.3%) |
| Total | 2,264 (100.0%) | 65 (100.0%) |
Housing Structure by Heating Type in Pinehurst
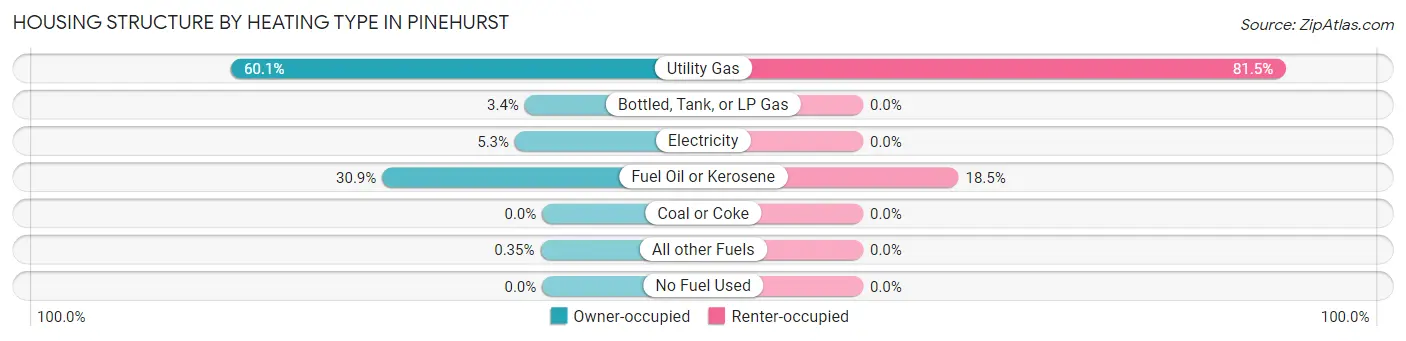
| Heating Type | Owner-occupied | Renter-occupied |
| Utility Gas | 1,361 (60.1%) | 53 (81.5%) |
| Bottled, Tank, or LP Gas | 76 (3.4%) | 0 (0.0%) |
| Electricity | 119 (5.3%) | 0 (0.0%) |
| Fuel Oil or Kerosene | 700 (30.9%) | 12 (18.5%) |
| Coal or Coke | 0 (0.0%) | 0 (0.0%) |
| All other Fuels | 8 (0.4%) | 0 (0.0%) |
| No Fuel Used | 0 (0.0%) | 0 (0.0%) |
| Total | 2,264 (100.0%) | 65 (100.0%) |
Household Vehicle Usage in Pinehurst
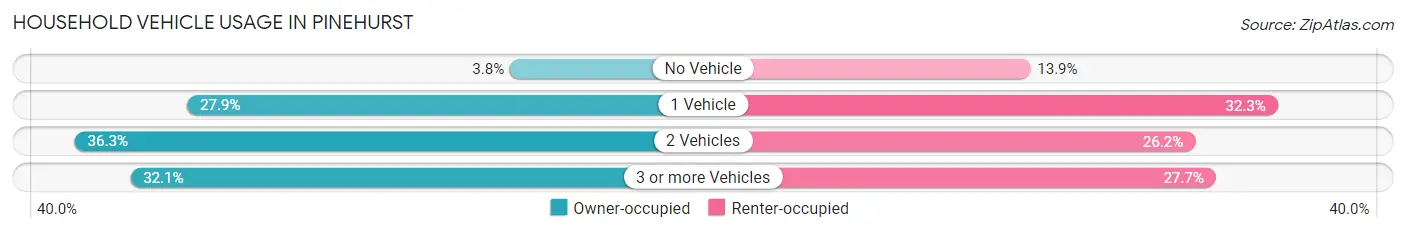
| Vehicles per Household | Owner-occupied | Renter-occupied |
| No Vehicle | 85 (3.7%) | 9 (13.9%) |
| 1 Vehicle | 631 (27.9%) | 21 (32.3%) |
| 2 Vehicles | 821 (36.3%) | 17 (26.2%) |
| 3 or more Vehicles | 727 (32.1%) | 18 (27.7%) |
| Total | 2,264 (100.0%) | 65 (100.0%) |
Real Estate & Mortgages in Pinehurst
Real Estate and Mortgage Overview in Pinehurst
| Characteristic | Without Mortgage | With Mortgage |
| Housing Units | 794 | 1,470 |
| Median Property Value | $486,400 | $567,900 |
| Median Household Income | $85,288 | $748 |
| Monthly Housing Costs | $887 | $459 |
| Real Estate Taxes | $5,847 | $90 |
Property Value by Mortgage Status in Pinehurst
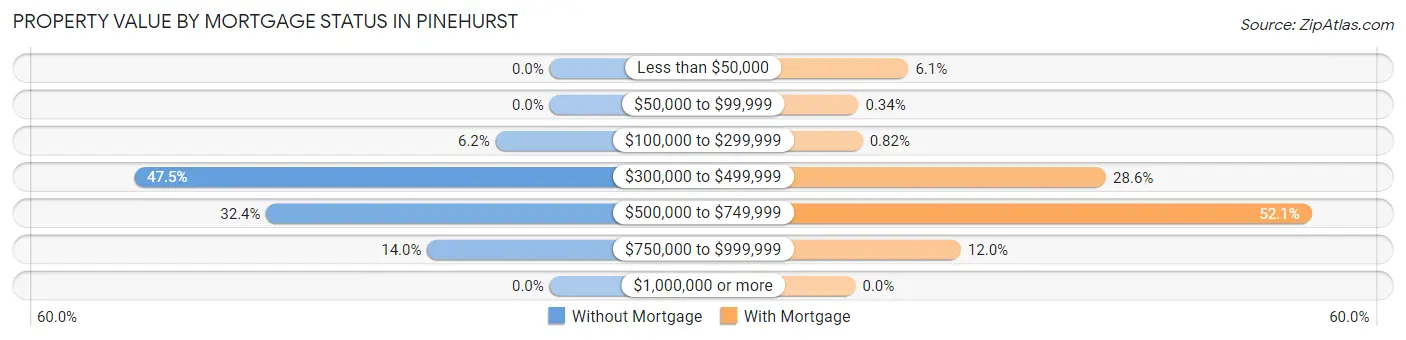
| Property Value | Without Mortgage | With Mortgage |
| Less than $50,000 | 0 (0.0%) | 89 (6.0%) |
| $50,000 to $99,999 | 0 (0.0%) | 5 (0.3%) |
| $100,000 to $299,999 | 49 (6.2%) | 12 (0.8%) |
| $300,000 to $499,999 | 377 (47.5%) | 421 (28.6%) |
| $500,000 to $749,999 | 257 (32.4%) | 766 (52.1%) |
| $750,000 to $999,999 | 111 (14.0%) | 177 (12.0%) |
| $1,000,000 or more | 0 (0.0%) | 0 (0.0%) |
| Total | 794 (100.0%) | 1,470 (100.0%) |
Household Income by Mortgage Status in Pinehurst
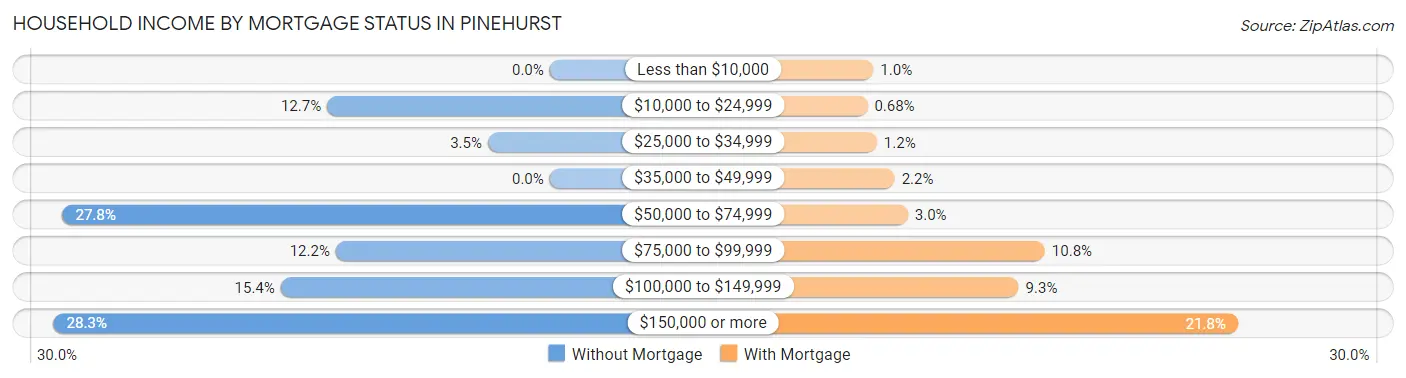
| Household Income | Without Mortgage | With Mortgage |
| Less than $10,000 | 0 (0.0%) | 15 (1.0%) |
| $10,000 to $24,999 | 101 (12.7%) | 10 (0.7%) |
| $25,000 to $34,999 | 28 (3.5%) | 18 (1.2%) |
| $35,000 to $49,999 | 0 (0.0%) | 33 (2.2%) |
| $50,000 to $74,999 | 221 (27.8%) | 44 (3.0%) |
| $75,000 to $99,999 | 97 (12.2%) | 159 (10.8%) |
| $100,000 to $149,999 | 122 (15.4%) | 137 (9.3%) |
| $150,000 or more | 225 (28.3%) | 321 (21.8%) |
| Total | 794 (100.0%) | 1,470 (100.0%) |
Property Value to Household Income Ratio in Pinehurst
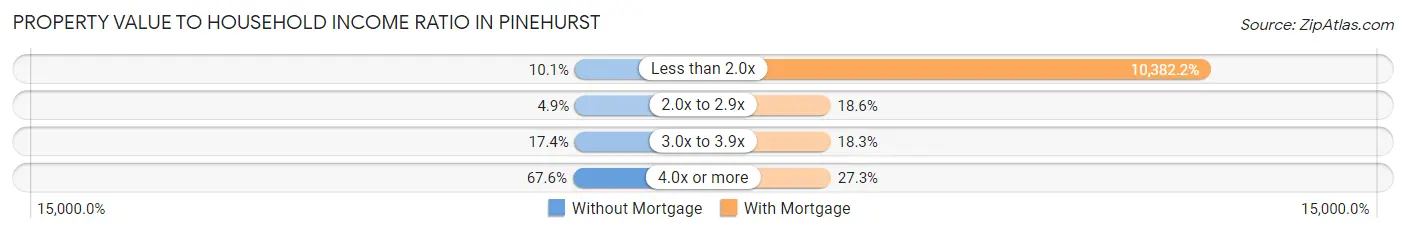
| Value-to-Income Ratio | Without Mortgage | With Mortgage |
| Less than 2.0x | 80 (10.1%) | 152,619 (10,382.2%) |
| 2.0x to 2.9x | 39 (4.9%) | 274 (18.6%) |
| 3.0x to 3.9x | 138 (17.4%) | 269 (18.3%) |
| 4.0x or more | 537 (67.6%) | 401 (27.3%) |
| Total | 794 (100.0%) | 1,470 (100.0%) |
Real Estate Taxes by Mortgage Status in Pinehurst
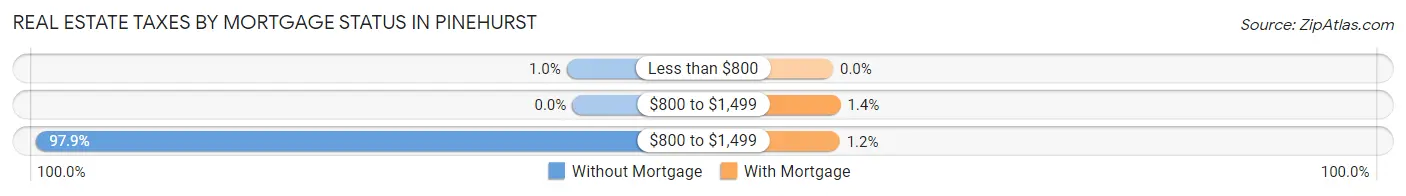
| Property Taxes | Without Mortgage | With Mortgage |
| Less than $800 | 8 (1.0%) | 0 (0.0%) |
| $800 to $1,499 | 0 (0.0%) | 20 (1.4%) |
| $800 to $1,499 | 777 (97.9%) | 18 (1.2%) |
| Total | 794 (100.0%) | 1,470 (100.0%) |
Health & Disability in Pinehurst
Health Insurance Coverage by Age in Pinehurst
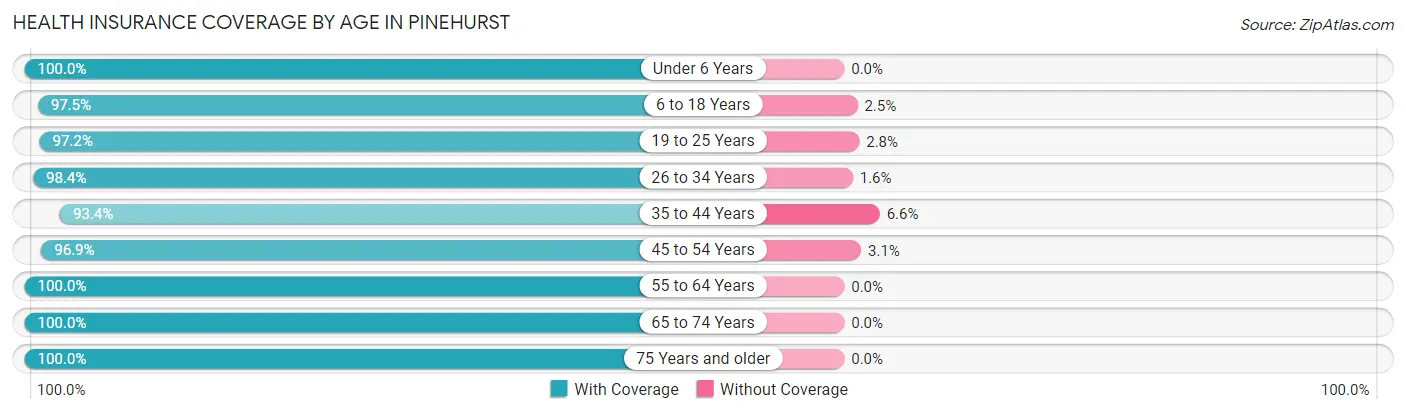
| Age Bracket | With Coverage | Without Coverage |
| Under 6 Years | 353 (100.0%) | 0 (0.0%) |
| 6 to 18 Years | 993 (97.5%) | 25 (2.5%) |
| 19 to 25 Years | 417 (97.2%) | 12 (2.8%) |
| 26 to 34 Years | 499 (98.4%) | 8 (1.6%) |
| 35 to 44 Years | 849 (93.4%) | 60 (6.6%) |
| 45 to 54 Years | 990 (96.9%) | 32 (3.1%) |
| 55 to 64 Years | 865 (100.0%) | 0 (0.0%) |
| 65 to 74 Years | 630 (100.0%) | 0 (0.0%) |
| 75 Years and older | 691 (100.0%) | 0 (0.0%) |
| Total | 6,287 (97.9%) | 137 (2.1%) |
Health Insurance Coverage by Citizenship Status in Pinehurst
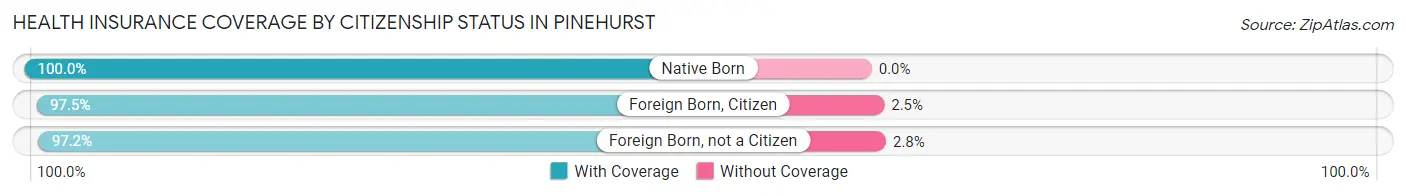
| Citizenship Status | With Coverage | Without Coverage |
| Native Born | 353 (100.0%) | 0 (0.0%) |
| Foreign Born, Citizen | 993 (97.5%) | 25 (2.5%) |
| Foreign Born, not a Citizen | 417 (97.2%) | 12 (2.8%) |
Health Insurance Coverage by Household Income in Pinehurst
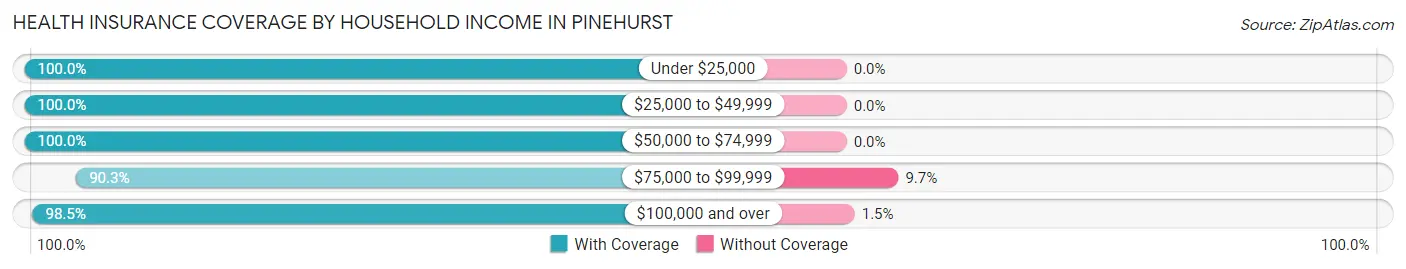
| Household Income | With Coverage | Without Coverage |
| Under $25,000 | 196 (100.0%) | 0 (0.0%) |
| $25,000 to $49,999 | 199 (100.0%) | 0 (0.0%) |
| $50,000 to $74,999 | 938 (100.0%) | 0 (0.0%) |
| $75,000 to $99,999 | 672 (90.3%) | 72 (9.7%) |
| $100,000 and over | 4,271 (98.5%) | 65 (1.5%) |
Public vs Private Health Insurance Coverage by Age in Pinehurst
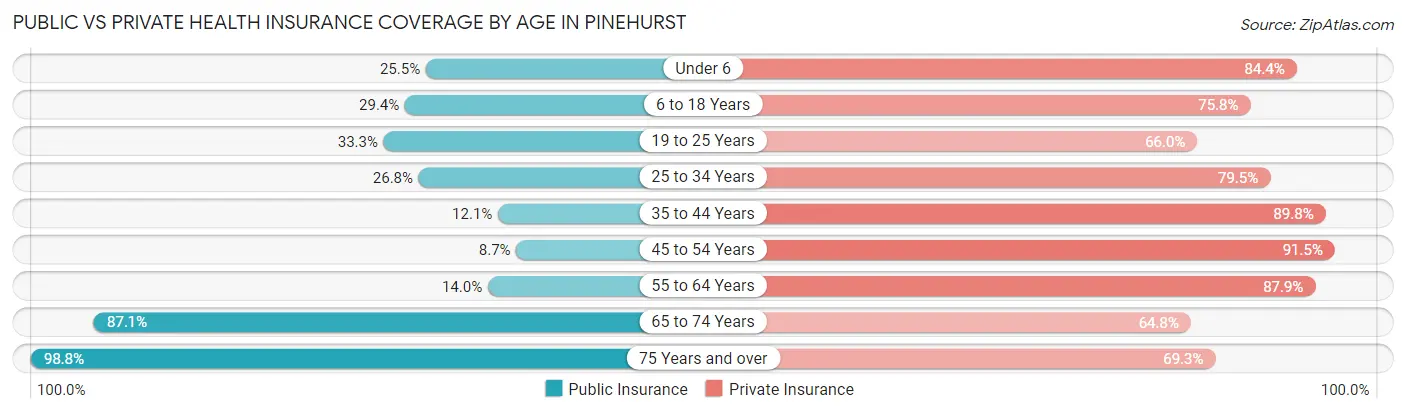
| Age Bracket | Public Insurance | Private Insurance |
| Under 6 | 90 (25.5%) | 298 (84.4%) |
| 6 to 18 Years | 299 (29.4%) | 772 (75.8%) |
| 19 to 25 Years | 143 (33.3%) | 283 (66.0%) |
| 25 to 34 Years | 136 (26.8%) | 403 (79.5%) |
| 35 to 44 Years | 110 (12.1%) | 816 (89.8%) |
| 45 to 54 Years | 89 (8.7%) | 935 (91.5%) |
| 55 to 64 Years | 121 (14.0%) | 760 (87.9%) |
| 65 to 74 Years | 549 (87.1%) | 408 (64.8%) |
| 75 Years and over | 683 (98.8%) | 479 (69.3%) |
| Total | 2,220 (34.6%) | 5,154 (80.2%) |
Disability Status by Sex by Age in Pinehurst
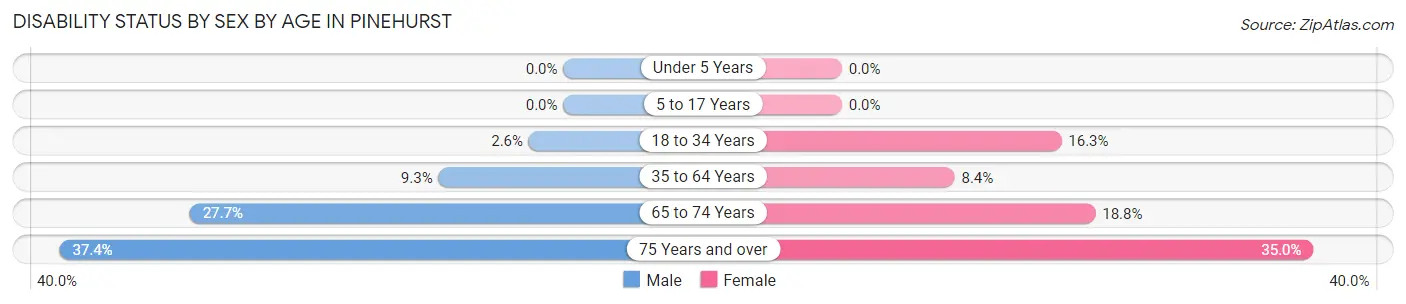
| Age Bracket | Male | Female |
| Under 5 Years | 0 (0.0%) | 0 (0.0%) |
| 5 to 17 Years | 0 (0.0%) | 0 (0.0%) |
| 18 to 34 Years | 12 (2.6%) | 82 (16.3%) |
| 35 to 64 Years | 133 (9.3%) | 114 (8.4%) |
| 65 to 74 Years | 76 (27.7%) | 67 (18.8%) |
| 75 Years and over | 110 (37.4%) | 139 (35.0%) |
Disability Class by Sex by Age in Pinehurst
Disability Class: Hearing Difficulty
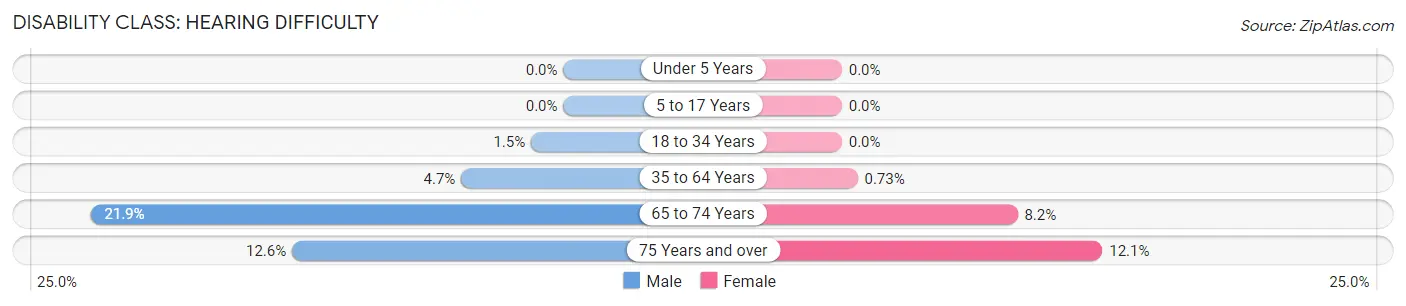
| Age Bracket | Male | Female |
| Under 5 Years | 0 (0.0%) | 0 (0.0%) |
| 5 to 17 Years | 0 (0.0%) | 0 (0.0%) |
| 18 to 34 Years | 7 (1.5%) | 0 (0.0%) |
| 35 to 64 Years | 68 (4.7%) | 10 (0.7%) |
| 65 to 74 Years | 60 (21.9%) | 29 (8.2%) |
| 75 Years and over | 37 (12.6%) | 48 (12.1%) |
Disability Class: Vision Difficulty
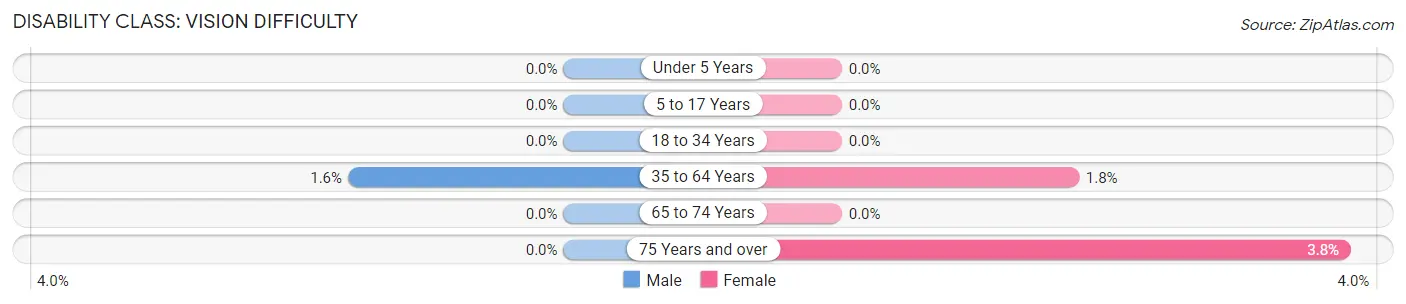
| Age Bracket | Male | Female |
| Under 5 Years | 0 (0.0%) | 0 (0.0%) |
| 5 to 17 Years | 0 (0.0%) | 0 (0.0%) |
| 18 to 34 Years | 0 (0.0%) | 0 (0.0%) |
| 35 to 64 Years | 23 (1.6%) | 24 (1.8%) |
| 65 to 74 Years | 0 (0.0%) | 0 (0.0%) |
| 75 Years and over | 0 (0.0%) | 15 (3.8%) |
Disability Class: Cognitive Difficulty
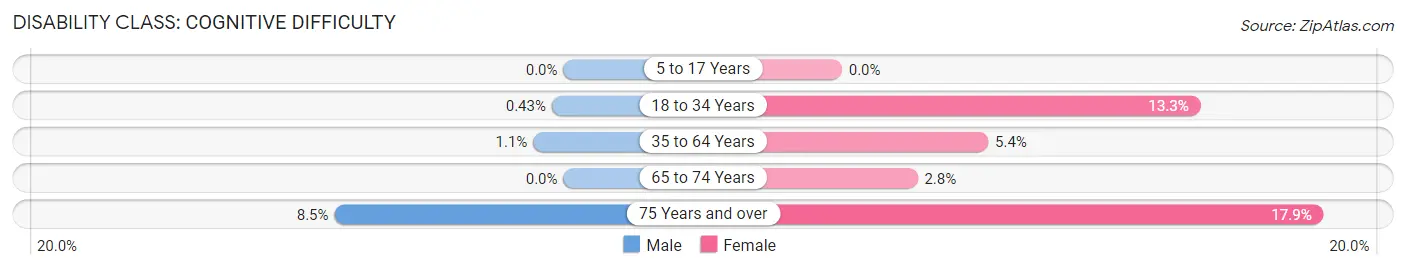
| Age Bracket | Male | Female |
| 5 to 17 Years | 0 (0.0%) | 0 (0.0%) |
| 18 to 34 Years | 2 (0.4%) | 67 (13.3%) |
| 35 to 64 Years | 16 (1.1%) | 74 (5.4%) |
| 65 to 74 Years | 0 (0.0%) | 10 (2.8%) |
| 75 Years and over | 25 (8.5%) | 71 (17.9%) |
Disability Class: Ambulatory Difficulty
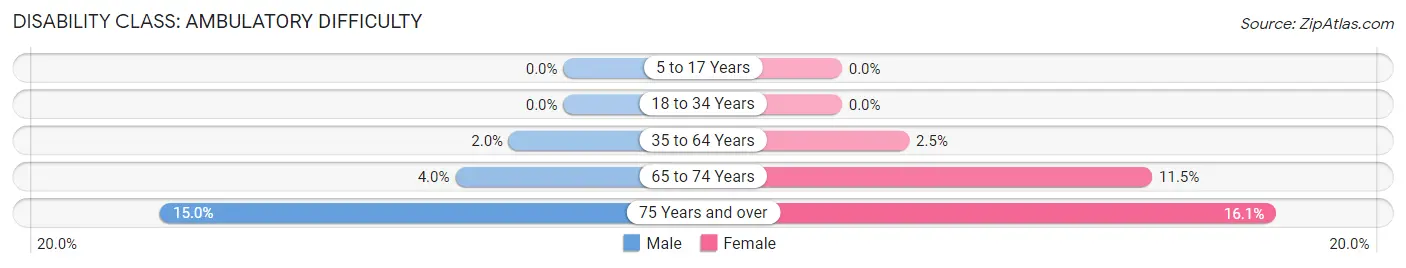
| Age Bracket | Male | Female |
| 5 to 17 Years | 0 (0.0%) | 0 (0.0%) |
| 18 to 34 Years | 0 (0.0%) | 0 (0.0%) |
| 35 to 64 Years | 29 (2.0%) | 34 (2.5%) |
| 65 to 74 Years | 11 (4.0%) | 41 (11.5%) |
| 75 Years and over | 44 (15.0%) | 64 (16.1%) |
Disability Class: Self-Care Difficulty
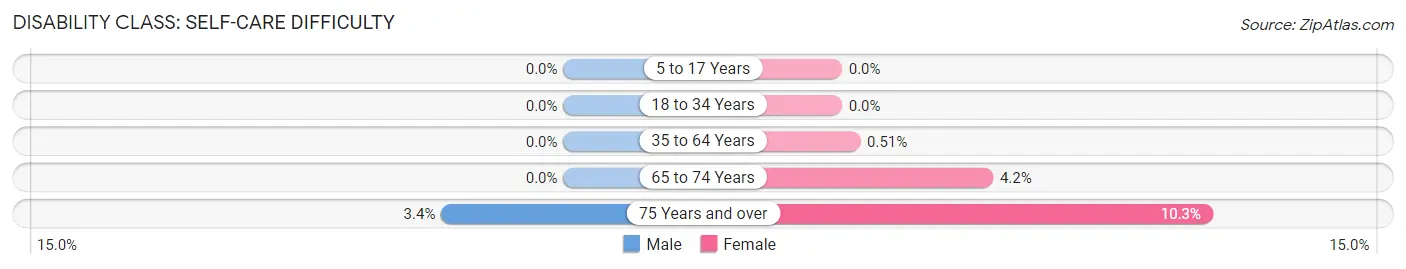
| Age Bracket | Male | Female |
| 5 to 17 Years | 0 (0.0%) | 0 (0.0%) |
| 18 to 34 Years | 0 (0.0%) | 0 (0.0%) |
| 35 to 64 Years | 0 (0.0%) | 7 (0.5%) |
| 65 to 74 Years | 0 (0.0%) | 15 (4.2%) |
| 75 Years and over | 10 (3.4%) | 41 (10.3%) |
Technology Access in Pinehurst
Computing Device Access in Pinehurst
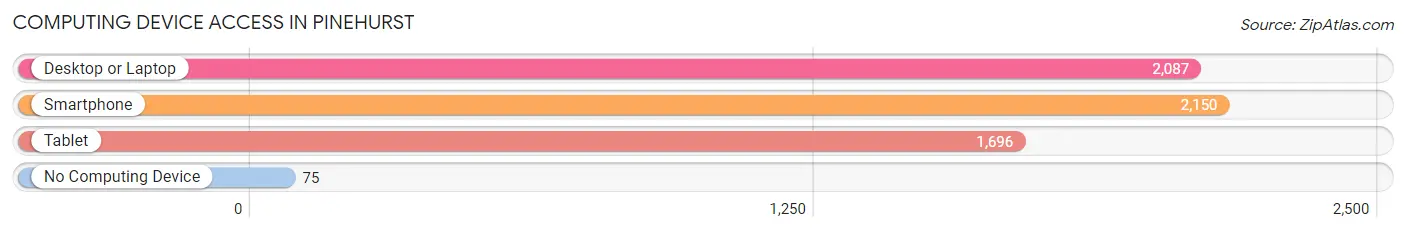
| Device Type | # Households | % Households |
| Desktop or Laptop | 2,087 | 89.6% |
| Smartphone | 2,150 | 92.3% |
| Tablet | 1,696 | 72.8% |
| No Computing Device | 75 | 3.2% |
| Total | 2,329 | 100.0% |
Internet Access in Pinehurst
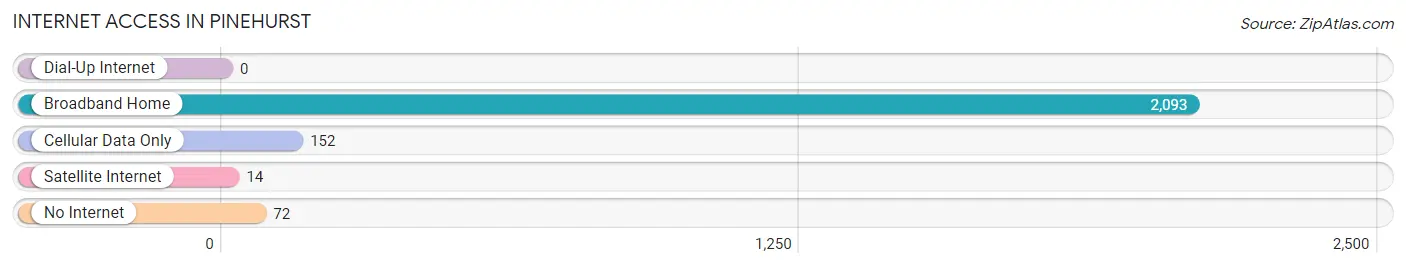
| Internet Type | # Households | % Households |
| Dial-Up Internet | 0 | 0.0% |
| Broadband Home | 2,093 | 89.9% |
| Cellular Data Only | 152 | 6.5% |
| Satellite Internet | 14 | 0.6% |
| No Internet | 72 | 3.1% |
| Total | 2,329 | 100.0% |
Pinehurst Summary
Pinehurst is a small town located in the state of Massachusetts, in the United States. It is situated in the western part of the state, in the Berkshire Hills region. The town is bordered by the towns of Becket, Washington, and Otis. The population of Pinehurst was 1,845 as of the 2010 census.
History
Pinehurst was first settled in 1762 by a group of settlers from Connecticut. The town was originally known as “Pine Hill” and was incorporated in 1775. The town was named after the abundance of pine trees in the area.
In the 19th century, Pinehurst was a thriving agricultural community. The town was known for its dairy farms, orchards, and lumber mills. The town also had a thriving tanning industry, which was centered around the tannery located in the center of town.
In the late 19th century, the town began to experience a decline in its agricultural industry. This was due to the introduction of new technologies and the rise of industrialization. As a result, many of the town’s residents began to move away in search of better economic opportunities.
Geography
Pinehurst is located in the western part of Massachusetts, in the Berkshire Hills region. The town is bordered by the towns of Becket, Washington, and Otis. The town is situated on the banks of the Westfield River, which flows through the town.
The town has a total area of 8.3 square miles, of which 8.2 square miles is land and 0.1 square miles is water. The town is located at an elevation of 1,000 feet above sea level.
Economy
The economy of Pinehurst is largely based on tourism and agriculture. The town is home to several tourist attractions, including the Pinehurst State Park, which offers camping, fishing, and hiking opportunities. The town is also home to several wineries and breweries, which attract visitors from all over the region.
The town is also home to several farms, which produce a variety of crops, including apples, corn, and hay. The town is also home to several lumber mills, which produce lumber for the local market.
Demographics
As of the 2010 census, the population of Pinehurst was 1,845. The racial makeup of the town was 97.3% White, 0.7% African American, 0.2% Native American, 0.3% Asian, 0.1% Pacific Islander, 0.3% from other races, and 1.2% from two or more races. Hispanic or Latino of any race were 1.2% of the population.
The median income for a household in the town was $50,938, and the median income for a family was $60,000. The per capita income for the town was $25,938. About 8.3% of families and 10.2% of the population were below the poverty line, including 14.3% of those under age 18 and 5.2% of those age 65 or over.
Common Questions
What is Per Capita Income in Pinehurst?
Per Capita income in Pinehurst is $54,837.
What is the Median Family Income in Pinehurst?
Median Family Income in Pinehurst is $152,560.
What is the Median Household income in Pinehurst?
Median Household Income in Pinehurst is $136,292.
What is Income or Wage Gap in Pinehurst?
Income or Wage Gap in Pinehurst is 36.2%.
Women in Pinehurst earn 63.8 cents for every dollar earned by a man.
What is Inequality or Gini Index in Pinehurst?
Inequality or Gini Index in Pinehurst is 0.36.
What is the Total Population of Pinehurst?
Total Population of Pinehurst is 6,426.
What is the Total Male Population of Pinehurst?
Total Male Population of Pinehurst is 3,223.
What is the Total Female Population of Pinehurst?
Total Female Population of Pinehurst is 3,203.
What is the Ratio of Males per 100 Females in Pinehurst?
There are 100.62 Males per 100 Females in Pinehurst.
What is the Ratio of Females per 100 Males in Pinehurst?
There are 99.38 Females per 100 Males in Pinehurst.
What is the Median Population Age in Pinehurst?
Median Population Age in Pinehurst is 45.0 Years.
What is the Average Family Size in Pinehurst
Average Family Size in Pinehurst is 3.2 People.
What is the Average Household Size in Pinehurst
Average Household Size in Pinehurst is 2.8 People.
How Large is the Labor Force in Pinehurst?
There are 3,587 People in the Labor Forcein in Pinehurst.
What is the Percentage of People in the Labor Force in Pinehurst?
68.0% of People are in the Labor Force in Pinehurst.
What is the Unemployment Rate in Pinehurst?
Unemployment Rate in Pinehurst is 3.8%.