Cities with the Highest Percentage of French Canadian Population in Massachusetts
RELATED REPORTS & OPTIONS
French Canadian
Massachusetts
Compare Cities
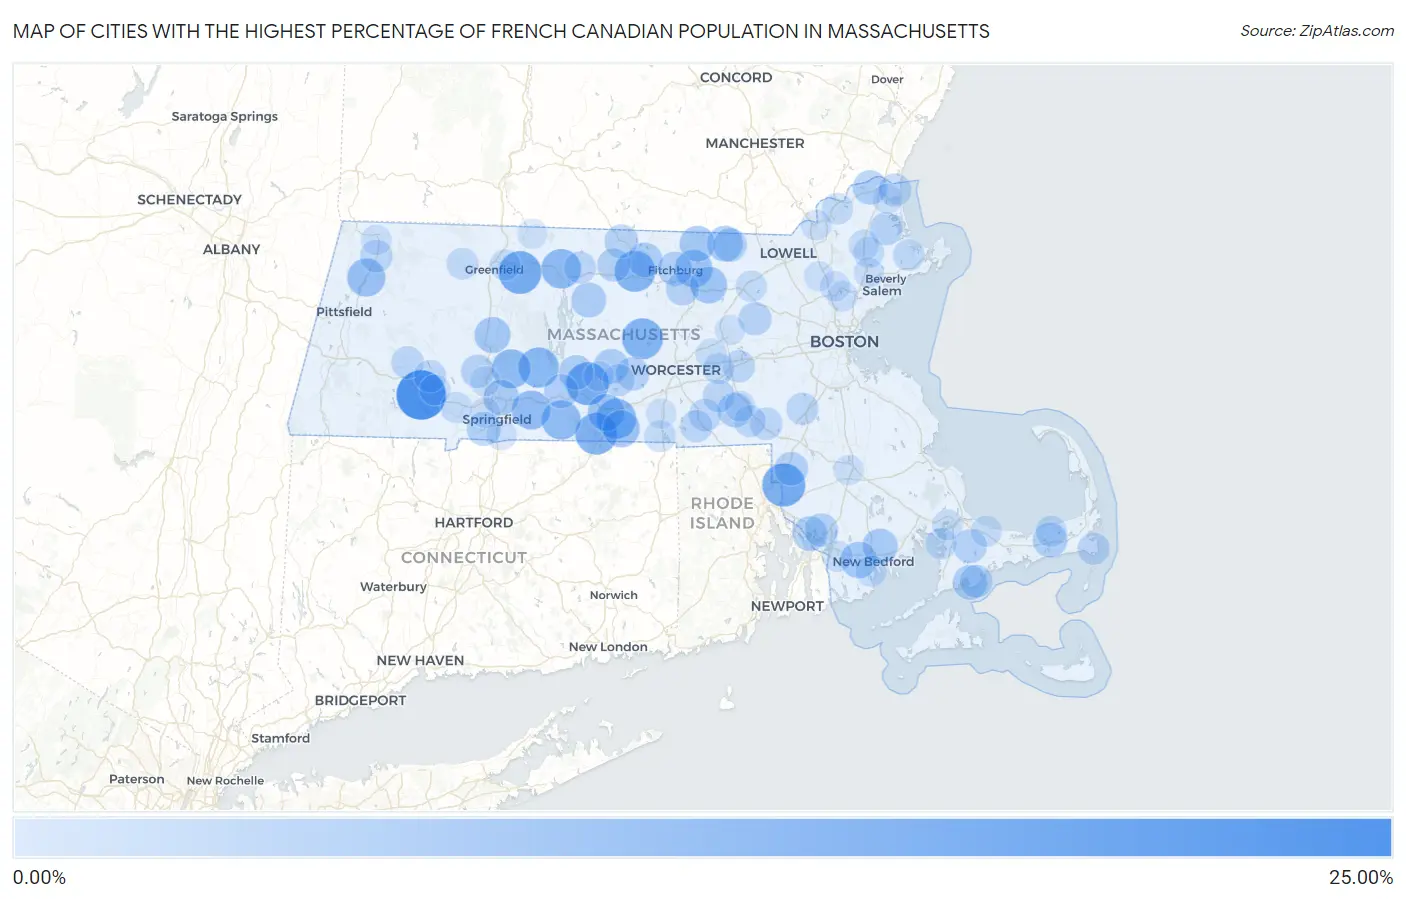
Map of Cities with the Highest Percentage of French Canadian Population in Massachusetts
0.00%
25.00%
Cities with the Highest Percentage of French Canadian Population in Massachusetts
| City | French Canadian | vs State | vs National | |
| 1. | Blandford | 20.06% | 3.14%(+16.9)#1 | 0.54%(+19.5)#56 |
| 2. | North Seekonk | 14.53% | 3.14%(+11.4)#2 | 0.54%(+14.0)#121 |
| 3. | Warren | 14.29% | 3.14%(+11.1)#3 | 0.54%(+13.7)#124 |
| 4. | Millers Falls | 14.23% | 3.14%(+11.1)#4 | 0.54%(+13.7)#127 |
| 5. | Holland | 13.36% | 3.14%(+10.2)#5 | 0.54%(+12.8)#139 |
| 6. | Rutland | 12.66% | 3.14%(+9.52)#6 | 0.54%(+12.1)#154 |
| 7. | Gardner | 12.59% | 3.14%(+9.45)#7 | 0.54%(+12.0)#155 |
| 8. | Oak Bluffs | 12.10% | 3.14%(+8.96)#8 | 0.54%(+11.6)#166 |
| 9. | Sturbridge | 12.02% | 3.14%(+8.88)#9 | 0.54%(+11.5)#172 |
| 10. | Belchertown | 12.01% | 3.14%(+8.87)#10 | 0.54%(+11.5)#173 |
| 11. | Orange | 11.53% | 3.14%(+8.38)#11 | 0.54%(+11.0)#191 |
| 12. | Monson Center | 11.12% | 3.14%(+7.98)#12 | 0.54%(+10.6)#202 |
| 13. | Granby | 11.05% | 3.14%(+7.91)#13 | 0.54%(+10.5)#206 |
| 14. | Wilbraham | 10.89% | 3.14%(+7.75)#14 | 0.54%(+10.3)#214 |
| 15. | Cheshire | 10.24% | 3.14%(+7.10)#15 | 0.54%(+9.69)#246 |
| 16. | Lunenburg | 9.82% | 3.14%(+6.68)#16 | 0.54%(+9.27)#267 |
| 17. | Fiskdale | 9.41% | 3.14%(+6.27)#17 | 0.54%(+8.86)#282 |
| 18. | Southbridge Town | 9.38% | 3.14%(+6.24)#18 | 0.54%(+8.84)#283 |
| 19. | Shirley | 9.20% | 3.14%(+6.06)#19 | 0.54%(+8.65)#300 |
| 20. | Smith Mills | 8.71% | 3.14%(+5.57)#20 | 0.54%(+8.17)#335 |
| 21. | Hatfield | 8.41% | 3.14%(+5.27)#21 | 0.54%(+7.87)#351 |
| 22. | Pepperell | 8.34% | 3.14%(+5.20)#22 | 0.54%(+7.80)#356 |
| 23. | Townsend | 8.22% | 3.14%(+5.08)#23 | 0.54%(+7.68)#362 |
| 24. | Chicopee | 8.13% | 3.14%(+4.99)#24 | 0.54%(+7.59)#373 |
| 25. | Acushnet Center | 7.90% | 3.14%(+4.76)#25 | 0.54%(+7.36)#386 |
| 26. | Petersham | 7.64% | 3.14%(+4.50)#26 | 0.54%(+7.09)#402 |
| 27. | Cedar Crest | 7.52% | 3.14%(+4.38)#27 | 0.54%(+6.98)#410 |
| 28. | North Brookfield | 7.47% | 3.14%(+4.33)#28 | 0.54%(+6.92)#419 |
| 29. | Ware | 7.44% | 3.14%(+4.30)#29 | 0.54%(+6.89)#423 |
| 30. | South Ashburnham | 7.44% | 3.14%(+4.29)#30 | 0.54%(+6.89)#424 |
| 31. | Ocean Grove | 7.43% | 3.14%(+4.29)#31 | 0.54%(+6.89)#426 |
| 32. | Hopedale | 7.40% | 3.14%(+4.26)#32 | 0.54%(+6.85)#432 |
| 33. | South Dennis | 7.35% | 3.14%(+4.21)#33 | 0.54%(+6.81)#438 |
| 34. | Seconsett Island | 7.30% | 3.14%(+4.16)#34 | 0.54%(+6.75)#441 |
| 35. | Amesbury Town | 7.17% | 3.14%(+4.03)#35 | 0.54%(+6.63)#455 |
| 36. | Fitchburg | 7.07% | 3.14%(+3.93)#36 | 0.54%(+6.52)#465 |
| 37. | Palmer Town | 7.00% | 3.14%(+3.85)#37 | 0.54%(+6.45)#470 |
| 38. | Agawam Town | 6.81% | 3.14%(+3.67)#38 | 0.54%(+6.27)#488 |
| 39. | East Pepperell | 6.70% | 3.14%(+3.56)#39 | 0.54%(+6.16)#501 |
| 40. | Attleboro | 6.63% | 3.14%(+3.49)#40 | 0.54%(+6.08)#509 |
| 41. | Forestdale | 6.57% | 3.14%(+3.43)#41 | 0.54%(+6.03)#514 |
| 42. | Winchendon | 6.48% | 3.14%(+3.34)#42 | 0.54%(+5.93)#524 |
| 43. | Spencer | 6.48% | 3.14%(+3.33)#43 | 0.54%(+5.93)#526 |
| 44. | Somerset | 6.42% | 3.14%(+3.28)#44 | 0.54%(+5.87)#529 |
| 45. | Baldwinville | 6.34% | 3.14%(+3.20)#45 | 0.54%(+5.80)#543 |
| 46. | Leominster | 6.33% | 3.14%(+3.18)#46 | 0.54%(+5.78)#547 |
| 47. | Easthampton Town | 6.22% | 3.14%(+3.07)#47 | 0.54%(+5.67)#566 |
| 48. | Maynard | 6.18% | 3.14%(+3.03)#48 | 0.54%(+5.63)#571 |
| 49. | Greenfield | 6.11% | 3.14%(+2.96)#49 | 0.54%(+5.56)#580 |
| 50. | Rowley | 6.09% | 3.14%(+2.95)#50 | 0.54%(+5.55)#582 |
| 51. | Salisbury | 6.00% | 3.14%(+2.86)#51 | 0.54%(+5.45)#587 |
| 52. | New Seabury | 5.83% | 3.14%(+2.69)#52 | 0.54%(+5.28)#605 |
| 53. | North Attleborough | 5.78% | 3.14%(+2.64)#53 | 0.54%(+5.24)#614 |
| 54. | Adams | 5.75% | 3.14%(+2.61)#54 | 0.54%(+5.21)#618 |
| 55. | Whitinsville | 5.71% | 3.14%(+2.56)#55 | 0.54%(+5.16)#626 |
| 56. | Franklin Town | 5.69% | 3.14%(+2.55)#56 | 0.54%(+5.15)#630 |
| 57. | Chester | 5.66% | 3.14%(+2.52)#57 | 0.54%(+5.12)#634 |
| 58. | Cordaville | 5.48% | 3.14%(+2.34)#58 | 0.54%(+4.93)#659 |
| 59. | East Douglas | 5.46% | 3.14%(+2.32)#59 | 0.54%(+4.92)#661 |
| 60. | Huntington | 5.43% | 3.14%(+2.29)#60 | 0.54%(+4.89)#672 |
| 61. | Walpole | 5.40% | 3.14%(+2.26)#61 | 0.54%(+4.85)#680 |
| 62. | Upton | 5.39% | 3.14%(+2.25)#62 | 0.54%(+4.85)#682 |
| 63. | Chatham | 5.38% | 3.14%(+2.23)#63 | 0.54%(+4.83)#684 |
| 64. | Athol | 5.28% | 3.14%(+2.14)#64 | 0.54%(+4.74)#695 |
| 65. | East Brookfield | 5.28% | 3.14%(+2.14)#65 | 0.54%(+4.73)#696 |
| 66. | Bellingham | 5.11% | 3.14%(+1.97)#66 | 0.54%(+4.57)#729 |
| 67. | Shelburne Falls | 5.06% | 3.14%(+1.92)#67 | 0.54%(+4.52)#737 |
| 68. | Essex | 5.05% | 3.14%(+1.91)#68 | 0.54%(+4.51)#740 |
| 69. | Webster | 4.88% | 3.14%(+1.73)#69 | 0.54%(+4.33)#767 |
| 70. | East Dennis | 4.80% | 3.14%(+1.66)#70 | 0.54%(+4.25)#781 |
| 71. | Haverhill | 4.78% | 3.14%(+1.64)#71 | 0.54%(+4.24)#783 |
| 72. | Westfield | 4.77% | 3.14%(+1.62)#72 | 0.54%(+4.22)#787 |
| 73. | Pocasset | 4.76% | 3.14%(+1.62)#73 | 0.54%(+4.21)#790 |
| 74. | Littleton Common | 4.67% | 3.14%(+1.53)#74 | 0.54%(+4.12)#810 |
| 75. | Bliss Corner | 4.67% | 3.14%(+1.53)#75 | 0.54%(+4.12)#811 |
| 76. | Westborough | 4.66% | 3.14%(+1.52)#76 | 0.54%(+4.11)#812 |
| 77. | Turners Falls | 4.53% | 3.14%(+1.39)#77 | 0.54%(+3.99)#840 |
| 78. | Topsfield | 4.47% | 3.14%(+1.32)#78 | 0.54%(+3.92)#852 |
| 79. | East Sandwich | 4.46% | 3.14%(+1.32)#79 | 0.54%(+3.92)#853 |
| 80. | North Westport | 4.38% | 3.14%(+1.24)#80 | 0.54%(+3.83)#872 |
| 81. | Russell | 4.36% | 3.14%(+1.22)#81 | 0.54%(+3.82)#875 |
| 82. | Northborough | 4.27% | 3.14%(+1.13)#82 | 0.54%(+3.72)#899 |
| 83. | Methuen Town | 4.21% | 3.14%(+1.07)#83 | 0.54%(+3.67)#918 |
| 84. | Buzzards Bay | 4.21% | 3.14%(+1.07)#84 | 0.54%(+3.67)#919 |
| 85. | Milford | 4.17% | 3.14%(+1.03)#85 | 0.54%(+3.63)#933 |
| 86. | Boxford | 4.13% | 3.14%(+0.986)#86 | 0.54%(+3.58)#943 |
| 87. | Wakefield | 4.11% | 3.14%(+0.969)#87 | 0.54%(+3.57)#945 |
| 88. | North Adams | 4.10% | 3.14%(+0.963)#88 | 0.54%(+3.56)#947 |
| 89. | West Springfield Town | 4.09% | 3.14%(+0.945)#89 | 0.54%(+3.54)#951 |
| 90. | Longmeadow | 4.06% | 3.14%(+0.919)#90 | 0.54%(+3.52)#958 |
| 91. | Danvers | 3.92% | 3.14%(+0.782)#91 | 0.54%(+3.38)#1,011 |
| 92. | Raynham Center | 3.90% | 3.14%(+0.761)#92 | 0.54%(+3.36)#1,017 |
| 93. | Reading | 3.88% | 3.14%(+0.735)#93 | 0.54%(+3.33)#1,023 |
| 94. | West Brookfield | 3.85% | 3.14%(+0.710)#94 | 0.54%(+3.31)#1,028 |
| 95. | Oxford | 3.83% | 3.14%(+0.685)#95 | 0.54%(+3.28)#1,033 |
| 96. | Hudson | 3.78% | 3.14%(+0.640)#96 | 0.54%(+3.24)#1,042 |
| 97. | Holyoke | 3.77% | 3.14%(+0.628)#97 | 0.54%(+3.22)#1,050 |
| 98. | Northfield | 3.74% | 3.14%(+0.603)#98 | 0.54%(+3.20)#1,053 |
| 99. | Wilmington | 3.72% | 3.14%(+0.576)#99 | 0.54%(+3.17)#1,061 |
| 100. | Newburyport | 3.72% | 3.14%(+0.574)#100 | 0.54%(+3.17)#1,062 |
Common Questions
What are the Top 10 Cities with the Highest Percentage of French Canadian Population in Massachusetts?
Top 10 Cities with the Highest Percentage of French Canadian Population in Massachusetts are:
#1
20.06%
#2
14.53%
#3
14.29%
#4
14.23%
#5
13.36%
#6
12.66%
#7
12.59%
#8
12.02%
#9
12.01%
#10
11.53%
What city has the Highest Percentage of French Canadian Population in Massachusetts?
Blandford has the Highest Percentage of French Canadian Population in Massachusetts with 20.06%.
What is the Percentage of French Canadian Population in the State of Massachusetts?
Percentage of French Canadian Population in Massachusetts is 3.14%.
What is the Percentage of French Canadian Population in the United States?
Percentage of French Canadian Population in the United States is 0.54%.