Cities with the Highest Percentage of Serbian Population in Massachusetts

RELATED REPORTS & OPTIONS

Serbian
Population
Families and Households
Female Fertility
Female Fertility (Unmarried)
Race (Community Size)
Race (Percentage)
Ancestry (Community Size)
AfghanAfricanAlaska NativeAlaskan AthabascanAlbanianAleutAlsatianAmericanApacheArabArapahoArgentineanArmenianAssyrian / Chaldean / SyriacAustralianAustrianBahamianBangladeshiBarbadianBasqueBelgianBelizeanBermudanBhutaneseBlackfeetBolivianBrazilianBritishBritish West IndianBulgarianBurmeseCajunCambodianCanadianCape VerdeanCarpatho RusynCelticCentral AmericanCentral American IndianCherokeeCheyenneChickasawChileanChineseChippewaChoctawColombianColvilleComancheCosta RicanCreeCreekCroatianCrowCubanCypriotCzechCzechoslovakianDanishDelawareDominicanDutchDutch West IndianEastern EuropeanEcuadorianEgyptianEnglishEstonianEthiopianEuropeanFijianFilipinoFinnishFrenchFrench American IndianFrench CanadianGermanGerman RussianGhanaianGreekGuamanian / ChamorroGuatemalanGuyaneseHaitianHmongHonduranHopiHoumaHungarianIcelanderIndian (Asian)IndonesianInupiatIranianIraqiIrishIroquoisIsraeliItalianJamaicanJapaneseJordanianKenyanKiowaKoreanLaotianLatvianLebaneseLiberianLithuanianLumbeeLuxembourgerMacedonianMalaysianMalteseMarshalleseMenomineeMexicanMexican American IndianMongolianMoroccanNative HawaiianNavajoNepaleseNew ZealanderNicaraguanNigerianNorthern EuropeanNorwegianOkinawanOsageOttawaPaiutePakistaniPalestinianPanamanianParaguayanPennsylvania GermanPeruvianPimaPolishPortuguesePotawatomiPuebloPuerto RicanPuget Sound SalishRomanianRussianSalvadoranSamoanScandinavianScotch-IrishScottishSeminoleSenegaleseSerbianShoshoneSierra LeoneanSiouxSlavicSlovakSloveneSomaliSouth AfricanSouth AmericanSouth American IndianSoviet UnionSpaniardSpanishSpanish AmericanSpanish American IndianSri LankanSubsaharan AfricanSudaneseSwedishSwissSyrianTaiwaneseThaiTlingit-HaidaTohono O'OdhamTonganTrinidadian and TobagonianTsimshianTurkishU.S. Virgin IslanderUgandanUkrainianUruguayanUteVenezuelanVietnameseWelshWest IndianYakamaYaquiYugoslavianYumanYup'ikZimbabwean
Ancestry (Percentage)
AfghanAfricanAlaska NativeAlaskan AthabascanAlbanianAleutAlsatianAmericanApacheArabArapahoArgentineanArmenianAssyrian / Chaldean / SyriacAustralianAustrianBahamianBangladeshiBarbadianBasqueBelgianBelizeanBermudanBhutaneseBlackfeetBolivianBrazilianBritishBritish West IndianBulgarianBurmeseCajunCambodianCanadianCape VerdeanCarpatho RusynCelticCentral AmericanCentral American IndianCherokeeCheyenneChickasawChileanChineseChippewaChoctawColombianColvilleComancheCosta RicanCreeCreekCroatianCrowCubanCypriotCzechCzechoslovakianDanishDelawareDominicanDutchDutch West IndianEastern EuropeanEcuadorianEgyptianEnglishEstonianEthiopianEuropeanFijianFilipinoFinnishFrenchFrench American IndianFrench CanadianGermanGerman RussianGhanaianGreekGuamanian / ChamorroGuatemalanGuyaneseHaitianHmongHonduranHopiHoumaHungarianIcelanderIndian (Asian)IndonesianInupiatIranianIraqiIrishIroquoisIsraeliItalianJamaicanJapaneseJordanianKenyanKiowaKoreanLaotianLatvianLebaneseLiberianLithuanianLumbeeLuxembourgerMacedonianMalaysianMalteseMarshalleseMenomineeMexicanMexican American IndianMongolianMoroccanNative HawaiianNavajoNepaleseNew ZealanderNicaraguanNigerianNorthern EuropeanNorwegianOkinawanOsageOttawaPaiutePakistaniPalestinianPanamanianParaguayanPennsylvania GermanPeruvianPimaPolishPortuguesePotawatomiPuebloPuerto RicanPuget Sound SalishRomanianRussianSalvadoranSamoanScandinavianScotch-IrishScottishSeminoleSenegaleseSerbianShoshoneSierra LeoneanSiouxSlavicSlovakSloveneSomaliSouth AfricanSouth AmericanSouth American IndianSoviet UnionSpaniardSpanishSpanish AmericanSpanish American IndianSri LankanSubsaharan AfricanSudaneseSwedishSwissSyrianTaiwaneseThaiTlingit-HaidaTohono O'OdhamTonganTrinidadian and TobagonianTsimshianTurkishU.S. Virgin IslanderUgandanUkrainianUruguayanUteVenezuelanVietnameseWelshWest IndianYakamaYaquiYugoslavianYumanYup'ikZimbabwean
Immigrant Origin (Total)
AfghanistanAfricaAlbaniaArgentinaArmeniaAsiaAustraliaAustriaAzoresBahamasBangladeshBarbadosBelarusBelgiumBelizeBoliviaBosnia and HerzegovinaBrazilBulgariaBurma / MyanmarCabo VerdeCambodiaCameroonCanadaCaribbeanCentral AmericaChileChinaColombiaCongoCosta RicaCroatiaCubaCzechoslovakiaDenmarkDominicaDominican RepublicEastern AfricaEastern AsiaEastern EuropeEcuadorEgyptEl SalvadorEnglandEritreaEthiopiaEuropeFijiFranceGermanyGhanaGreeceGrenadaGuatemalaGuyanaHaitiHondurasHong KongHungaryIndiaIndonesiaIranIraqIrelandIsraelItalyJamaicaJapanJordanKazakhstanKenyaKoreaKuwaitLaosLatin AmericaLatviaLebanonLiberiaLithuaniaMalaysiaMexicoMicronesiaMiddle AfricaMoldovaMoroccoNepalNetherlandsNicaraguaNigeriaNorth MacedoniaNorthern AfricaNorthern EuropeNorwayOceaniaPakistanPanamaPeruPhilippinesPolandPortugalRomaniaRussiaSaudi ArabiaScotlandSenegalSerbiaSierra LeoneSingaporeSomaliaSouth AfricaSouth AmericaSouth Central AsiaSouth Eastern AsiaSouthern EuropeSpainSri LankaSt. Vincent and the GrenadinesSudanSwedenSwitzerlandSyriaTaiwanThailandTrinidad and TobagoTurkeyUgandaUkraineUruguayUzbekistanVenezuelaVietnamWest IndiesWestern AfricaWestern AsiaWestern EuropeYemenZaireZimbabwe
Immigrant Origin (Percentage)
AfghanistanAfricaAlbaniaArgentinaArmeniaAsiaAustraliaAustriaAzoresBahamasBangladeshBarbadosBelarusBelgiumBelizeBoliviaBosnia and HerzegovinaBrazilBulgariaBurma / MyanmarCabo VerdeCambodiaCameroonCanadaCaribbeanCentral AmericaChileChinaColombiaCongoCosta RicaCroatiaCubaCzechoslovakiaDenmarkDominicaDominican RepublicEastern AfricaEastern AsiaEastern EuropeEcuadorEgyptEl SalvadorEnglandEritreaEthiopiaEuropeFijiFranceGermanyGhanaGreeceGrenadaGuatemalaGuyanaHaitiHondurasHong KongHungaryIndiaIndonesiaIranIraqIrelandIsraelItalyJamaicaJapanJordanKazakhstanKenyaKoreaKuwaitLaosLatin AmericaLatviaLebanonLiberiaLithuaniaMalaysiaMexicoMicronesiaMiddle AfricaMoldovaMoroccoNepalNetherlandsNicaraguaNigeriaNorth MacedoniaNorthern AfricaNorthern EuropeNorwayOceaniaPakistanPanamaPeruPhilippinesPolandPortugalRomaniaRussiaSaudi ArabiaScotlandSenegalSerbiaSierra LeoneSingaporeSomaliaSouth AfricaSouth AmericaSouth Central AsiaSouth Eastern AsiaSouthern EuropeSpainSri LankaSt. Vincent and the GrenadinesSudanSwedenSwitzerlandSyriaTaiwanThailandTrinidad and TobagoTurkeyUgandaUkraineUruguayUzbekistanVenezuelaVietnamWest IndiesWestern AfricaWestern AsiaWestern EuropeYemenZaireZimbabwe
Income
Income (Families)
Income (Households)
Poverty
Poverty (Families)
Unemployment
Employment Occupations
Employment Industries
Employer Class
Commute Time
Commute Means
School Enrollment
Education by Degree Field
Occupancy
Finances
Physical Characteristics
Massachusetts
Compare Cities
Comparison Subject

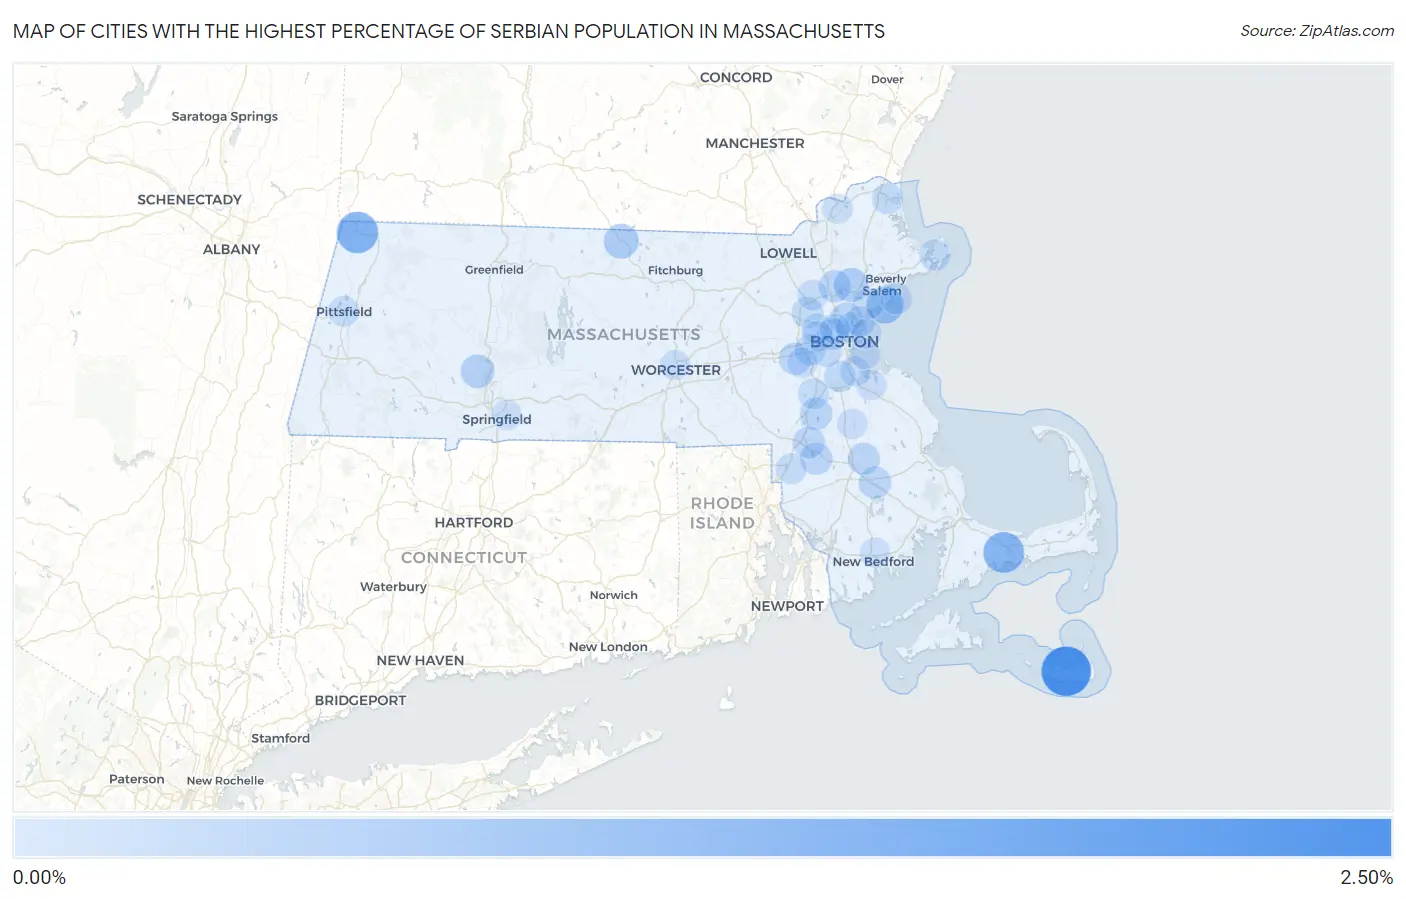
Map of Cities with the Highest Percentage of Serbian Population in Massachusetts

0.00%
2.50%
Cities with the Highest Percentage of Serbian Population in Massachusetts Map

Cities with the Highest Percentage of Serbian Population in Massachusetts

City Serbian vs State vs National
1.Nantucket2.01%0.052%(+1.96)#10.059%(+1.95)#106
2.Williamstown1.16%0.052%(+1.10)#20.059%(+1.10)#246
3.Barnstable Town1.09%0.052%(+1.04)#30.059%(+1.03)#268
4.Swampscott0.70%0.052%(+0.649)#40.059%(+0.642)#443
5.Winchendon0.47%0.052%(+0.419)#50.059%(+0.412)#647
6.Lynnfield0.41%0.052%(+0.358)#60.059%(+0.351)#732
7.Easthampton Town0.35%0.052%(+0.295)#70.059%(+0.288)#826
8.Sharon0.23%0.052%(+0.182)#80.059%(+0.175)#1,147
9.Norton Center0.23%0.052%(+0.181)#90.059%(+0.174)#1,152
10.Wellesley0.23%0.052%(+0.179)#100.059%(+0.172)#1,156
11.Middleborough Center0.23%0.052%(+0.179)#110.059%(+0.172)#1,160
12.Malden0.23%0.052%(+0.177)#120.059%(+0.170)#1,164
13.Reading0.23%0.052%(+0.177)#130.059%(+0.169)#1,168
14.Mansfield Center0.21%0.052%(+0.156)#140.059%(+0.149)#1,255
15.Bridgewater Town0.20%0.052%(+0.145)#150.059%(+0.138)#1,290
16.Cambridge0.15%0.052%(+0.103)#160.059%(+0.096)#1,496
17.Lexington0.13%0.052%(+0.083)#170.059%(+0.076)#1,585
18.Marblehead0.13%0.052%(+0.081)#180.059%(+0.074)#1,596
19.Milton0.12%0.052%(+0.071)#190.059%(+0.064)#1,653
20.Brookline0.12%0.052%(+0.068)#200.059%(+0.061)#1,675
21.Newton0.11%0.052%(+0.061)#210.059%(+0.054)#1,716
22.Norwood0.11%0.052%(+0.057)#220.059%(+0.050)#1,760
23.Gloucester0.10%0.052%(+0.052)#230.059%(+0.045)#1,795
24.Chelsea0.10%0.052%(+0.049)#240.059%(+0.042)#1,819
25.Newburyport0.098%0.052%(+0.046)#250.059%(+0.039)#1,836
26.Amherst0.096%0.052%(+0.044)#260.059%(+0.037)#1,853
27.Revere0.076%0.052%(+0.024)#270.059%(+0.017)#2,011
28.Boston0.068%0.052%(+0.016)#280.059%(+0.009)#2,091
29.Belmont0.067%0.052%(+0.015)#290.059%(+0.008)#2,102
30.Burlington0.065%0.052%(+0.013)#300.059%(+0.006)#2,118
31.Lynn0.061%0.052%(+0.009)#310.059%(+0.002)#2,158
32.Attleboro0.060%0.052%(+0.009)#320.059%(+0.002)#2,164
33.Pittsfield0.059%0.052%(+0.008)#330.059%(+0.001)#2,172
34.Winthrop Town0.053%0.052%(+0.001)#340.059%(-0.006)#2,221
35.Watertown Town0.048%0.052%(-0.003)#350.059%(-0.010)#2,267
36.Weymouth Town0.042%0.052%(-0.010)#360.059%(-0.017)#2,348
37.Brockton0.038%0.052%(-0.013)#370.059%(-0.021)#2,393
38.Needham0.034%0.052%(-0.017)#380.059%(-0.024)#2,457
39.Worcester0.033%0.052%(-0.019)#390.059%(-0.026)#2,470
40.Haverhill0.021%0.052%(-0.031)#400.059%(-0.038)#2,634
41.Quincy0.021%0.052%(-0.031)#410.059%(-0.038)#2,635
42.New Bedford0.0079%0.052%(-0.044)#420.059%(-0.051)#2,780
43.Somerville0.0062%0.052%(-0.045)#430.059%(-0.053)#2,802
44.Springfield0.0032%0.052%(-0.048)#440.059%(-0.056)#2,825

Common Questions

What are the Top 10 Cities with the Highest Percentage of Serbian Population in Massachusetts?
Top 10 Cities with the Highest Percentage of Serbian Population in Massachusetts are:
What city has the Highest Percentage of Serbian Population in Massachusetts?
Nantucket has the Highest Percentage of Serbian Population in Massachusetts with 2.01%.
What is the Percentage of Serbian Population in the State of Massachusetts?
Percentage of Serbian Population in Massachusetts is 0.052%.
What is the Percentage of Serbian Population in the United States?
Percentage of Serbian Population in the United States is 0.059%.