Cities with the Highest Percentage of Peruvian Population in Massachusetts
RELATED REPORTS & OPTIONS
Peruvian
Massachusetts
Compare Cities
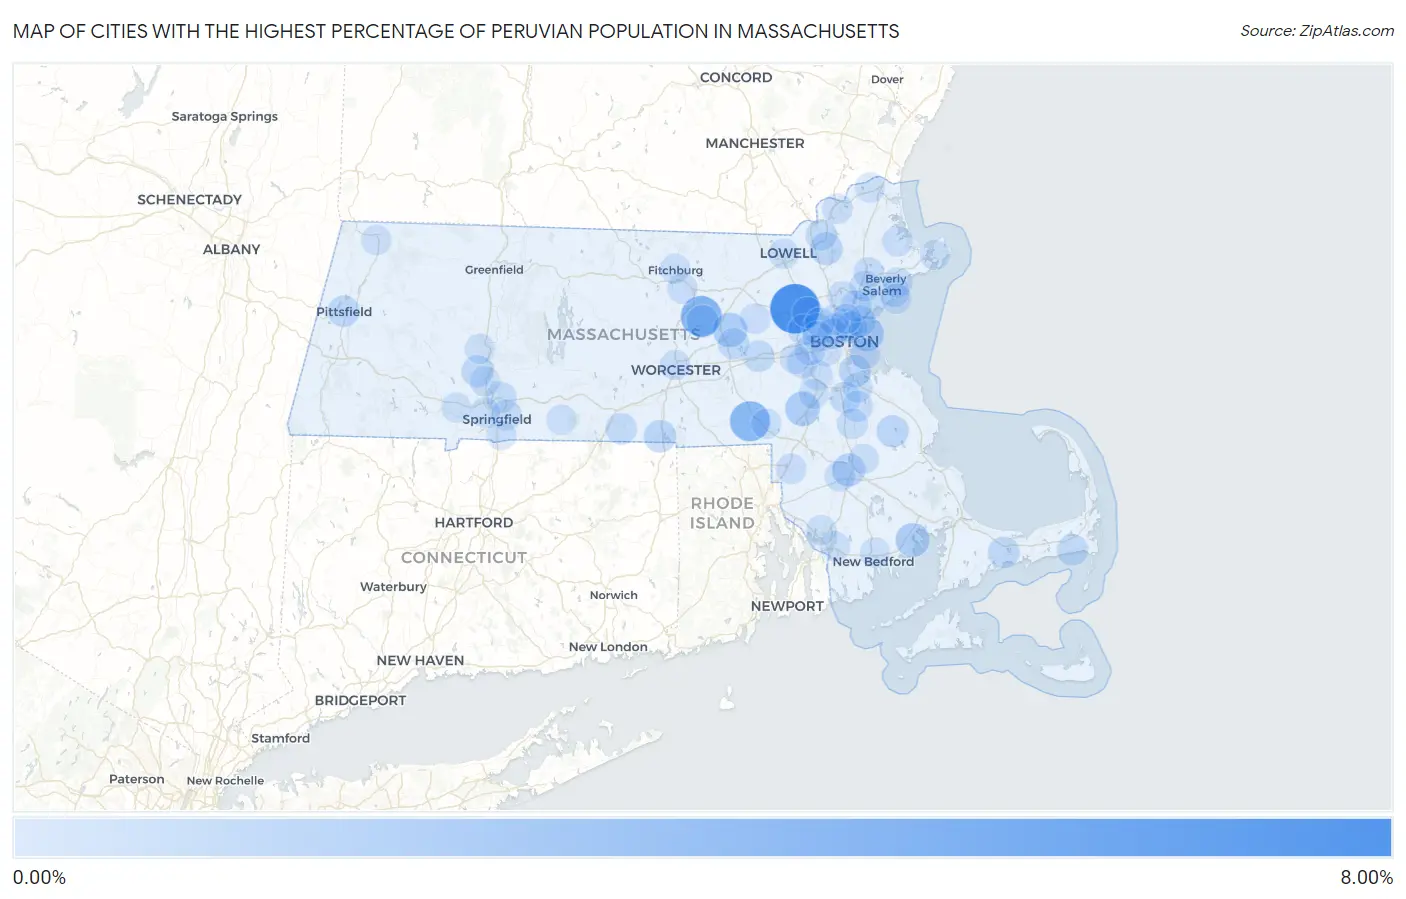
Map of Cities with the Highest Percentage of Peruvian Population in Massachusetts
0.00%
8.00%
Cities with the Highest Percentage of Peruvian Population in Massachusetts
| City | Peruvian | vs State | vs National | |
| 1. | Hanscom Afb | 6.84% | 0.17%(+6.67)#1 | 0.22%(+6.62)#39 |
| 2. | South Lancaster | 3.65% | 0.17%(+3.49)#2 | 0.22%(+3.44)#112 |
| 3. | Bellingham | 3.41% | 0.17%(+3.24)#3 | 0.22%(+3.19)#121 |
| 4. | Winthrop Town | 1.72% | 0.17%(+1.56)#4 | 0.22%(+1.51)#377 |
| 5. | Walpole | 1.54% | 0.17%(+1.37)#5 | 0.22%(+1.32)#427 |
| 6. | Hudson | 1.52% | 0.17%(+1.35)#6 | 0.22%(+1.30)#440 |
| 7. | Marion Center | 1.33% | 0.17%(+1.16)#7 | 0.22%(+1.11)#518 |
| 8. | Raynham Center | 0.99% | 0.17%(+0.818)#8 | 0.22%(+0.770)#702 |
| 9. | Andover | 0.85% | 0.17%(+0.682)#9 | 0.22%(+0.634)#812 |
| 10. | Webster | 0.81% | 0.17%(+0.640)#10 | 0.22%(+0.592)#847 |
| 11. | Clinton | 0.79% | 0.17%(+0.621)#11 | 0.22%(+0.573)#867 |
| 12. | Everett | 0.76% | 0.17%(+0.593)#12 | 0.22%(+0.545)#893 |
| 13. | Quincy | 0.70% | 0.17%(+0.530)#13 | 0.22%(+0.482)#966 |
| 14. | Hanson | 0.67% | 0.17%(+0.504)#14 | 0.22%(+0.456)#997 |
| 15. | Easthampton Town | 0.59% | 0.17%(+0.428)#15 | 0.22%(+0.380)#1,107 |
| 16. | Chelsea | 0.58% | 0.17%(+0.409)#16 | 0.22%(+0.361)#1,135 |
| 17. | Barnstable Town | 0.57% | 0.17%(+0.399)#17 | 0.22%(+0.351)#1,154 |
| 18. | Pittsfield | 0.53% | 0.17%(+0.361)#18 | 0.22%(+0.313)#1,229 |
| 19. | Lynn | 0.48% | 0.17%(+0.316)#19 | 0.22%(+0.268)#1,335 |
| 20. | Southbridge Town | 0.46% | 0.17%(+0.291)#20 | 0.22%(+0.243)#1,399 |
| 21. | Revere | 0.45% | 0.17%(+0.285)#21 | 0.22%(+0.237)#1,413 |
| 22. | Waltham | 0.45% | 0.17%(+0.284)#22 | 0.22%(+0.236)#1,415 |
| 23. | Harwich Port | 0.44% | 0.17%(+0.277)#23 | 0.22%(+0.229)#1,429 |
| 24. | Belmont | 0.44% | 0.17%(+0.270)#24 | 0.22%(+0.222)#1,445 |
| 25. | Framingham | 0.43% | 0.17%(+0.267)#25 | 0.22%(+0.219)#1,449 |
| 26. | Marlborough | 0.42% | 0.17%(+0.248)#26 | 0.22%(+0.200)#1,496 |
| 27. | Salem | 0.40% | 0.17%(+0.232)#27 | 0.22%(+0.184)#1,538 |
| 28. | Lawrence | 0.39% | 0.17%(+0.222)#28 | 0.22%(+0.174)#1,571 |
| 29. | Randolph Town | 0.35% | 0.17%(+0.182)#29 | 0.22%(+0.134)#1,676 |
| 30. | Chicopee | 0.32% | 0.17%(+0.150)#30 | 0.22%(+0.102)#1,764 |
| 31. | Needham | 0.28% | 0.17%(+0.117)#31 | 0.22%(+0.069)#1,885 |
| 32. | Holbrook | 0.26% | 0.17%(+0.097)#32 | 0.22%(+0.049)#1,970 |
| 33. | Saugus | 0.26% | 0.17%(+0.095)#33 | 0.22%(+0.047)#1,986 |
| 34. | Peabody | 0.26% | 0.17%(+0.091)#34 | 0.22%(+0.043)#2,006 |
| 35. | Lexington | 0.25% | 0.17%(+0.081)#35 | 0.22%(+0.033)#2,065 |
| 36. | Danvers | 0.24% | 0.17%(+0.073)#36 | 0.22%(+0.025)#2,099 |
| 37. | Amherst | 0.24% | 0.17%(+0.069)#37 | 0.22%(+0.021)#2,110 |
| 38. | Springfield | 0.23% | 0.17%(+0.061)#38 | 0.22%(+0.013)#2,144 |
| 39. | Brockton | 0.23% | 0.17%(+0.059)#39 | 0.22%(+0.011)#2,150 |
| 40. | Boston | 0.21% | 0.17%(+0.042)#40 | 0.22%(-0.006)#2,234 |
| 41. | Taunton | 0.21% | 0.17%(+0.038)#41 | 0.22%(-0.010)#2,259 |
| 42. | Somerville | 0.18% | 0.17%(+0.015)#42 | 0.22%(-0.033)#2,388 |
| 43. | Brookline | 0.17% | 0.17%(+0.003)#43 | 0.22%(-0.045)#2,449 |
| 44. | Ipswich | 0.16% | 0.17%(-0.003)#44 | 0.22%(-0.051)#2,481 |
| 45. | Cambridge | 0.16% | 0.17%(-0.005)#45 | 0.22%(-0.053)#2,494 |
| 46. | Haverhill | 0.15% | 0.17%(-0.014)#46 | 0.22%(-0.062)#2,563 |
| 47. | Dedham | 0.15% | 0.17%(-0.020)#47 | 0.22%(-0.068)#2,592 |
| 48. | Newton | 0.15% | 0.17%(-0.021)#48 | 0.22%(-0.069)#2,599 |
| 49. | Medford | 0.14% | 0.17%(-0.023)#49 | 0.22%(-0.071)#2,612 |
| 50. | Maynard | 0.14% | 0.17%(-0.027)#50 | 0.22%(-0.075)#2,630 |
| 51. | Watertown Town | 0.14% | 0.17%(-0.028)#51 | 0.22%(-0.076)#2,636 |
| 52. | Attleboro | 0.13% | 0.17%(-0.038)#52 | 0.22%(-0.086)#2,698 |
| 53. | Leominster | 0.12% | 0.17%(-0.043)#53 | 0.22%(-0.091)#2,742 |
| 54. | Holyoke | 0.12% | 0.17%(-0.047)#54 | 0.22%(-0.095)#2,766 |
| 55. | North Attleborough | 0.11% | 0.17%(-0.053)#55 | 0.22%(-0.101)#2,807 |
| 56. | Worcester | 0.11% | 0.17%(-0.062)#56 | 0.22%(-0.110)#2,859 |
| 57. | Wellesley | 0.097% | 0.17%(-0.070)#57 | 0.22%(-0.118)#2,923 |
| 58. | Wakefield | 0.096% | 0.17%(-0.071)#58 | 0.22%(-0.119)#2,932 |
| 59. | Norwood | 0.089% | 0.17%(-0.078)#59 | 0.22%(-0.126)#2,986 |
| 60. | Lowell | 0.086% | 0.17%(-0.081)#60 | 0.22%(-0.129)#3,009 |
| 61. | Beverly | 0.083% | 0.17%(-0.085)#61 | 0.22%(-0.133)#3,038 |
| 62. | Marblehead | 0.079% | 0.17%(-0.089)#62 | 0.22%(-0.137)#3,064 |
| 63. | Franklin Town | 0.076% | 0.17%(-0.091)#63 | 0.22%(-0.139)#3,088 |
| 64. | Braintree Town | 0.065% | 0.17%(-0.103)#64 | 0.22%(-0.151)#3,202 |
| 65. | Amesbury Town | 0.064% | 0.17%(-0.104)#65 | 0.22%(-0.152)#3,209 |
| 66. | Monson Center | 0.060% | 0.17%(-0.107)#66 | 0.22%(-0.155)#3,248 |
| 67. | Northampton | 0.057% | 0.17%(-0.111)#67 | 0.22%(-0.159)#3,274 |
| 68. | West Springfield Town | 0.056% | 0.17%(-0.112)#68 | 0.22%(-0.160)#3,287 |
| 69. | North Adams | 0.046% | 0.17%(-0.121)#69 | 0.22%(-0.169)#3,368 |
| 70. | Westfield | 0.042% | 0.17%(-0.126)#70 | 0.22%(-0.174)#3,410 |
| 71. | Fall River | 0.037% | 0.17%(-0.130)#71 | 0.22%(-0.178)#3,456 |
| 72. | Gloucester | 0.037% | 0.17%(-0.130)#72 | 0.22%(-0.178)#3,461 |
| 73. | Bridgewater Town | 0.032% | 0.17%(-0.136)#73 | 0.22%(-0.184)#3,507 |
| 74. | Longmeadow | 0.025% | 0.17%(-0.142)#74 | 0.22%(-0.190)#3,565 |
| 75. | Fitchburg | 0.024% | 0.17%(-0.143)#75 | 0.22%(-0.191)#3,576 |
| 76. | Arlington | 0.024% | 0.17%(-0.143)#76 | 0.22%(-0.191)#3,579 |
| 77. | Somerset | 0.022% | 0.17%(-0.145)#77 | 0.22%(-0.193)#3,593 |
| 78. | Malden | 0.017% | 0.17%(-0.150)#78 | 0.22%(-0.198)#3,640 |
| 79. | New Bedford | 0.0079% | 0.17%(-0.159)#79 | 0.22%(-0.207)#3,692 |
Common Questions
What are the Top 10 Cities with the Highest Percentage of Peruvian Population in Massachusetts?
Top 10 Cities with the Highest Percentage of Peruvian Population in Massachusetts are:
#1
6.84%
#2
3.65%
#3
3.41%
#4
1.72%
#5
1.54%
#6
1.52%
#7
1.33%
#8
0.99%
#9
0.85%
#10
0.81%
What city has the Highest Percentage of Peruvian Population in Massachusetts?
Hanscom AFB has the Highest Percentage of Peruvian Population in Massachusetts with 6.84%.
What is the Percentage of Peruvian Population in the State of Massachusetts?
Percentage of Peruvian Population in Massachusetts is 0.17%.
What is the Percentage of Peruvian Population in the United States?
Percentage of Peruvian Population in the United States is 0.22%.