Mansfield Center, MA Map & Demographics
Mansfield Center Map
Mansfield Center Overview
$52,452
PER CAPITA INCOME
$119,167
AVG FAMILY INCOME
$94,903
AVG HOUSEHOLD INCOME
40.1%
WAGE / INCOME GAP [ % ]
59.9¢/ $1
WAGE / INCOME GAP [ $ ]
0.41
INEQUALITY / GINI INDEX
7,690
TOTAL POPULATION
3,734
MALE POPULATION
3,956
FEMALE POPULATION
94.39
MALES / 100 FEMALES
105.95
FEMALES / 100 MALES
41.5
MEDIAN AGE
2.9
AVG FAMILY SIZE
2.4
AVG HOUSEHOLD SIZE
4,403
LABOR FORCE [ PEOPLE ]
70.5%
PERCENT IN LABOR FORCE
5.2%
UNEMPLOYMENT RATE
Income in Mansfield Center
Income Overview in Mansfield Center
Per Capita Income in Mansfield Center is $52,452, while median incomes of families and households are $119,167 and $94,903 respectively.
| Characteristic | Number | Measure |
| Per Capita Income | 7,690 | $52,452 |
| Median Family Income | 2,000 | $119,167 |
| Mean Family Income | 2,000 | $134,817 |
| Median Household Income | 3,259 | $94,903 |
| Mean Household Income | 3,259 | $123,444 |
| Income Deficit | 2,000 | $0 |
| Wage / Income Gap (%) | 7,690 | 40.09% |
| Wage / Income Gap ($) | 7,690 | 59.91¢ per $1 |
| Gini / Inequality Index | 7,690 | 0.41 |
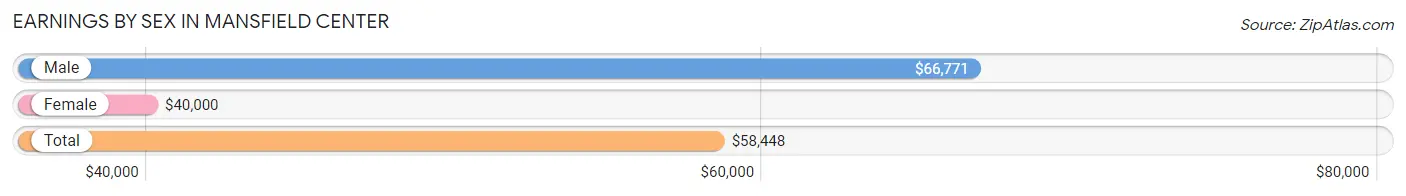
Earnings by Sex in Mansfield Center
Average Earnings in Mansfield Center are $58,448, $66,771 for men and $40,000 for women, a difference of 40.1%.
| Sex | Number | Average Earnings |
| Male | 2,325 (51.5%) | $66,771 |
| Female | 2,192 (48.5%) | $40,000 |
| Total | 4,517 (100.0%) | $58,448 |
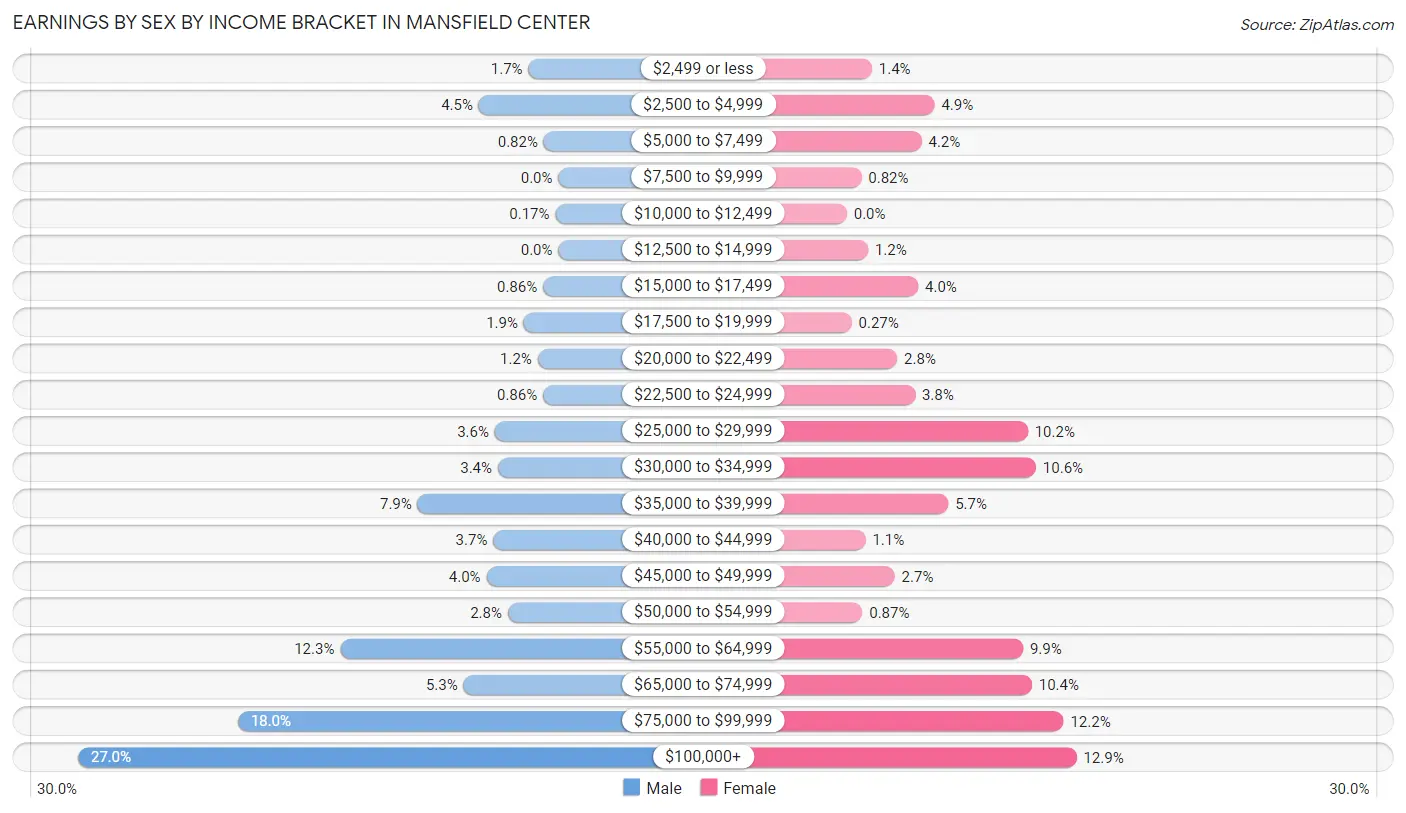
Earnings by Sex by Income Bracket in Mansfield Center
The most common earnings brackets in Mansfield Center are $100,000+ for men (628 | 27.0%) and $100,000+ for women (283 | 12.9%).
| Income | Male | Female |
| $2,499 or less | 39 (1.7%) | 31 (1.4%) |
| $2,500 to $4,999 | 104 (4.5%) | 108 (4.9%) |
| $5,000 to $7,499 | 19 (0.8%) | 92 (4.2%) |
| $7,500 to $9,999 | 0 (0.0%) | 18 (0.8%) |
| $10,000 to $12,499 | 4 (0.2%) | 0 (0.0%) |
| $12,500 to $14,999 | 0 (0.0%) | 26 (1.2%) |
| $15,000 to $17,499 | 20 (0.9%) | 88 (4.0%) |
| $17,500 to $19,999 | 45 (1.9%) | 6 (0.3%) |
| $20,000 to $22,499 | 27 (1.2%) | 62 (2.8%) |
| $22,500 to $24,999 | 20 (0.9%) | 84 (3.8%) |
| $25,000 to $29,999 | 83 (3.6%) | 223 (10.2%) |
| $30,000 to $34,999 | 79 (3.4%) | 233 (10.6%) |
| $35,000 to $39,999 | 184 (7.9%) | 125 (5.7%) |
| $40,000 to $44,999 | 85 (3.7%) | 23 (1.1%) |
| $45,000 to $49,999 | 94 (4.0%) | 59 (2.7%) |
| $50,000 to $54,999 | 66 (2.8%) | 19 (0.9%) |
| $55,000 to $64,999 | 285 (12.3%) | 217 (9.9%) |
| $65,000 to $74,999 | 124 (5.3%) | 228 (10.4%) |
| $75,000 to $99,999 | 419 (18.0%) | 267 (12.2%) |
| $100,000+ | 628 (27.0%) | 283 (12.9%) |
| Total | 2,325 (100.0%) | 2,192 (100.0%) |
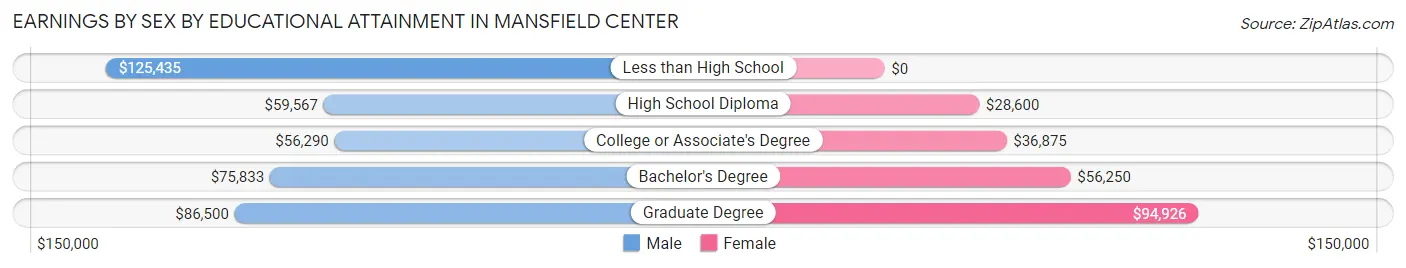
Earnings by Sex by Educational Attainment in Mansfield Center
Average earnings in Mansfield Center are $70,710 for men and $57,500 for women, a difference of 18.7%. Men with an educational attainment of less than high school enjoy the highest average annual earnings of $125,435, while those with college or associate's degree education earn the least with $56,290. Women with an educational attainment of graduate degree earn the most with the average annual earnings of $94,926, while those with high school diploma education have the smallest earnings of $28,600.
| Educational Attainment | Male Income | Female Income |
| Less than High School | $125,435 | $0 |
| High School Diploma | $59,567 | $28,600 |
| College or Associate's Degree | $56,290 | $36,875 |
| Bachelor's Degree | $75,833 | $56,250 |
| Graduate Degree | $86,500 | $94,926 |
| Total | $70,710 | $57,500 |
Family Income in Mansfield Center
Family Income Brackets in Mansfield Center
According to the Mansfield Center family income data, there are 476 families falling into the $100,000 to $149,999 income range, which is the most common income bracket and makes up 23.8% of all families.
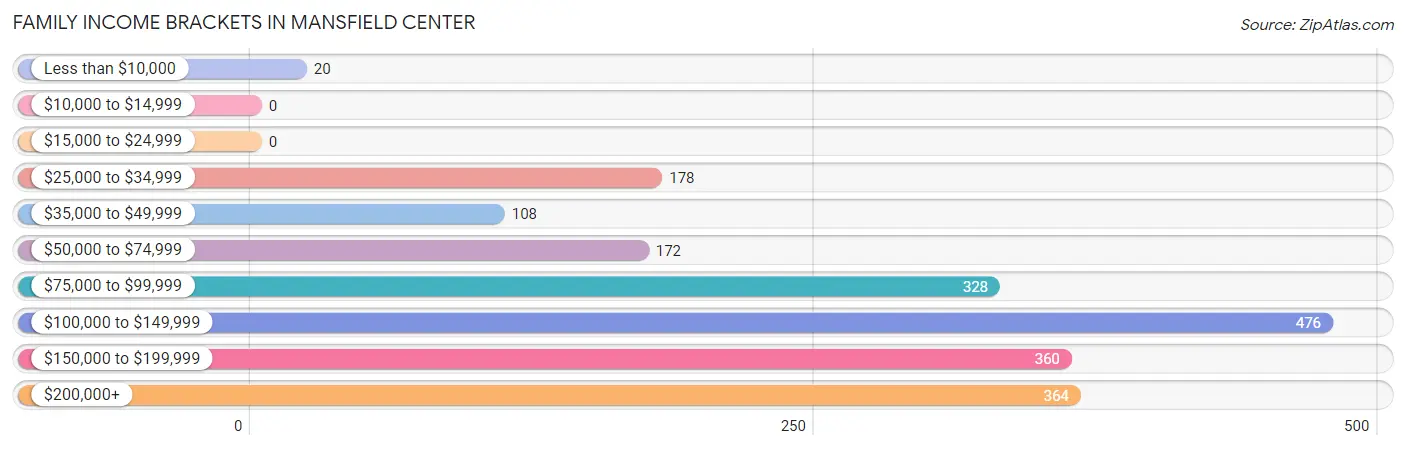
| Income Bracket | # Families | % Families |
| Less than $10,000 | 20 | 1.0% |
| $10,000 to $14,999 | 0 | 0.0% |
| $15,000 to $24,999 | 0 | 0.0% |
| $25,000 to $34,999 | 178 | 8.9% |
| $35,000 to $49,999 | 108 | 5.4% |
| $50,000 to $74,999 | 172 | 8.6% |
| $75,000 to $99,999 | 328 | 16.4% |
| $100,000 to $149,999 | 476 | 23.8% |
| $150,000 to $199,999 | 360 | 18.0% |
| $200,000+ | 364 | 18.2% |
Family Income by Famaliy Size in Mansfield Center
3-person families (431 | 21.5%) account for the highest median family income in Mansfield Center with $134,282 per family, while 2-person families (920 | 46.0%) have the highest median income of $50,809 per family member.
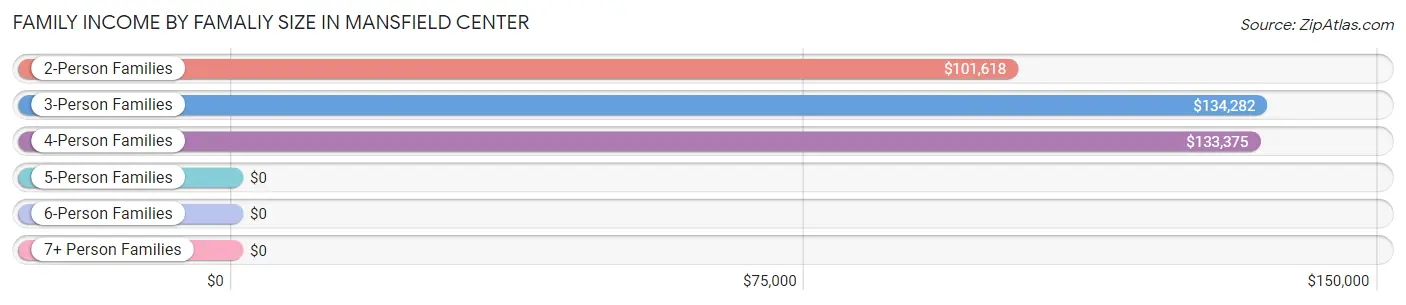
| Income Bracket | # Families | Median Income |
| 2-Person Families | 920 (46.0%) | $101,618 |
| 3-Person Families | 431 (21.5%) | $134,282 |
| 4-Person Families | 532 (26.6%) | $133,375 |
| 5-Person Families | 117 (5.9%) | $0 |
| 6-Person Families | 0 (0.0%) | $0 |
| 7+ Person Families | 0 (0.0%) | $0 |
| Total | 2,000 (100.0%) | $119,167 |
Family Income by Number of Earners in Mansfield Center
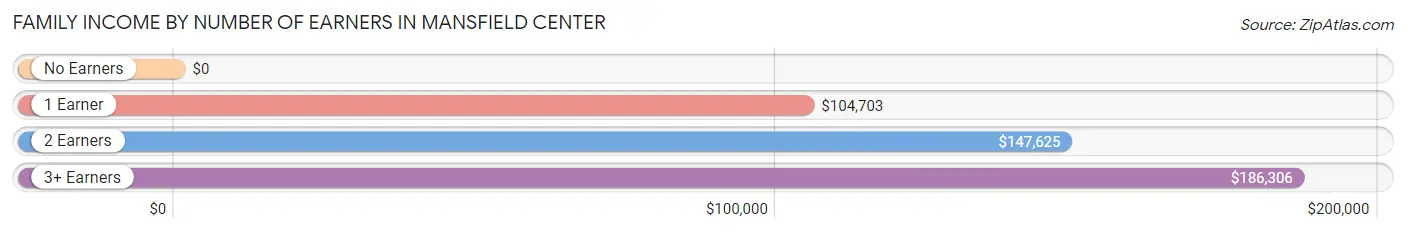
| Number of Earners | # Families | Median Income |
| No Earners | 312 (15.6%) | $0 |
| 1 Earner | 602 (30.1%) | $104,703 |
| 2 Earners | 813 (40.6%) | $147,625 |
| 3+ Earners | 273 (13.7%) | $186,306 |
| Total | 2,000 (100.0%) | $119,167 |
Household Income in Mansfield Center
Household Income Brackets in Mansfield Center
With 564 households falling in the category, the $75,000 to $99,999 income range is the most frequent in Mansfield Center, accounting for 17.3% of all households. In contrast, only 29 households (0.9%) fall into the $15,000 to $24,999 income bracket, making it the least populous group.
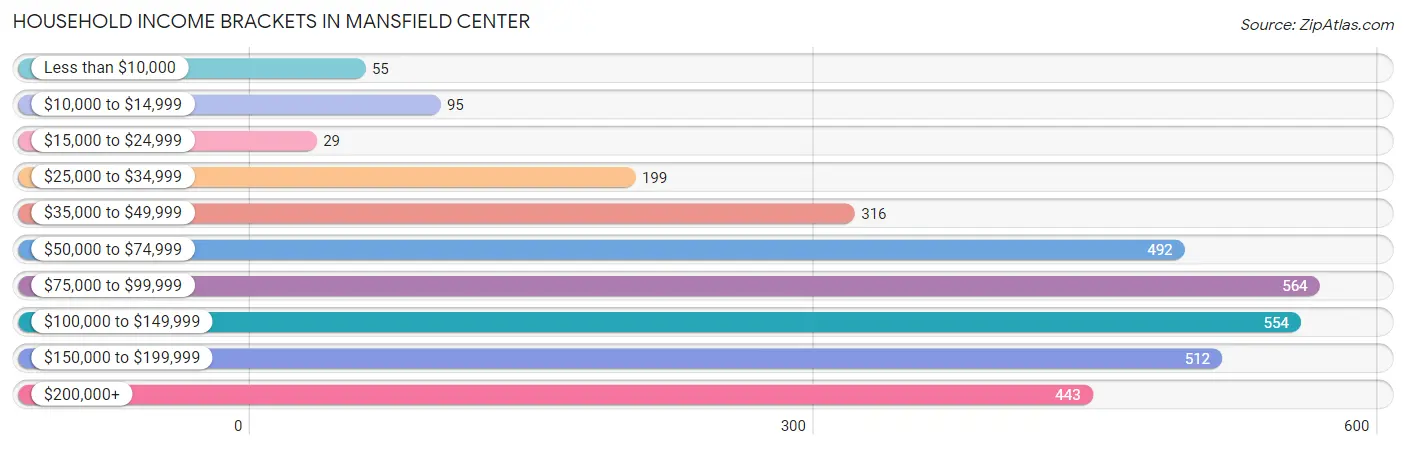
| Income Bracket | # Households | % Households |
| Less than $10,000 | 55 | 1.7% |
| $10,000 to $14,999 | 95 | 2.9% |
| $15,000 to $24,999 | 29 | 0.9% |
| $25,000 to $34,999 | 199 | 6.1% |
| $35,000 to $49,999 | 316 | 9.7% |
| $50,000 to $74,999 | 492 | 15.1% |
| $75,000 to $99,999 | 564 | 17.3% |
| $100,000 to $149,999 | 554 | 17.0% |
| $150,000 to $199,999 | 512 | 15.7% |
| $200,000+ | 443 | 13.6% |
Household Income by Householder Age in Mansfield Center
The median household income in Mansfield Center is $94,903, with the highest median household income of $104,831 found in the 45 to 64 years age bracket for the primary householder. A total of 1,346 households (41.3%) fall into this category. Meanwhile, the 15 to 24 years age bracket for the primary householder has the lowest median household income of $0, with 11 households (0.3%) in this group.
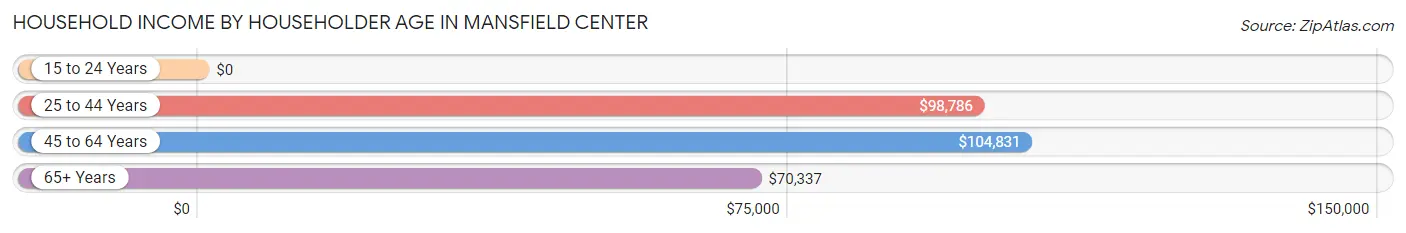
| Income Bracket | # Households | Median Income |
| 15 to 24 Years | 11 (0.3%) | $0 |
| 25 to 44 Years | 1,051 (32.3%) | $98,786 |
| 45 to 64 Years | 1,346 (41.3%) | $104,831 |
| 65+ Years | 851 (26.1%) | $70,337 |
| Total | 3,259 (100.0%) | $94,903 |
Poverty in Mansfield Center
Income Below Poverty by Sex and Age in Mansfield Center
With 4.5% poverty level for males and 2.0% for females among the residents of Mansfield Center, 35 to 44 year old males and 75 year old and over females are the most vulnerable to poverty, with 84 males (16.8%) and 31 females (8.7%) in their respective age groups living below the poverty level.
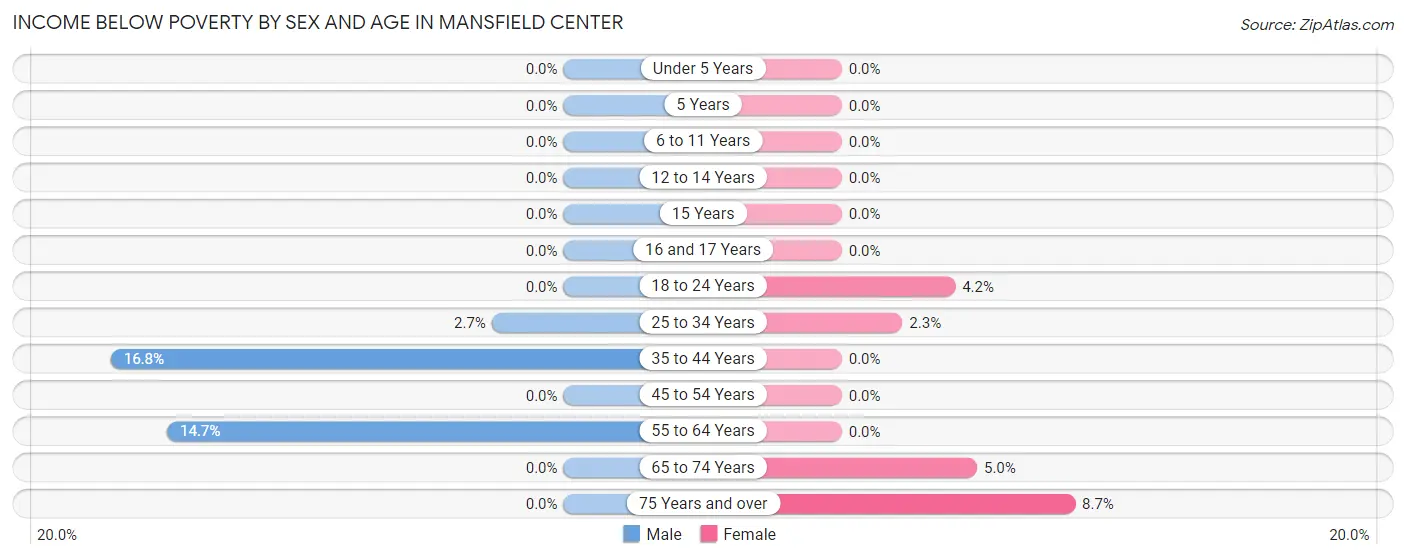
| Age Bracket | Male | Female |
| Under 5 Years | 0 (0.0%) | 0 (0.0%) |
| 5 Years | 0 (0.0%) | 0 (0.0%) |
| 6 to 11 Years | 0 (0.0%) | 0 (0.0%) |
| 12 to 14 Years | 0 (0.0%) | 0 (0.0%) |
| 15 Years | 0 (0.0%) | 0 (0.0%) |
| 16 and 17 Years | 0 (0.0%) | 0 (0.0%) |
| 18 to 24 Years | 0 (0.0%) | 11 (4.2%) |
| 25 to 34 Years | 19 (2.7%) | 15 (2.2%) |
| 35 to 44 Years | 84 (16.8%) | 0 (0.0%) |
| 45 to 54 Years | 0 (0.0%) | 0 (0.0%) |
| 55 to 64 Years | 65 (14.7%) | 0 (0.0%) |
| 65 to 74 Years | 0 (0.0%) | 22 (5.0%) |
| 75 Years and over | 0 (0.0%) | 31 (8.7%) |
| Total | 168 (4.5%) | 79 (2.0%) |
Income Above Poverty by Sex and Age in Mansfield Center
According to the poverty statistics in Mansfield Center, males aged under 5 years and females aged under 5 years are the age groups that are most secure financially, with 100.0% of males and 100.0% of females in these age groups living above the poverty line.
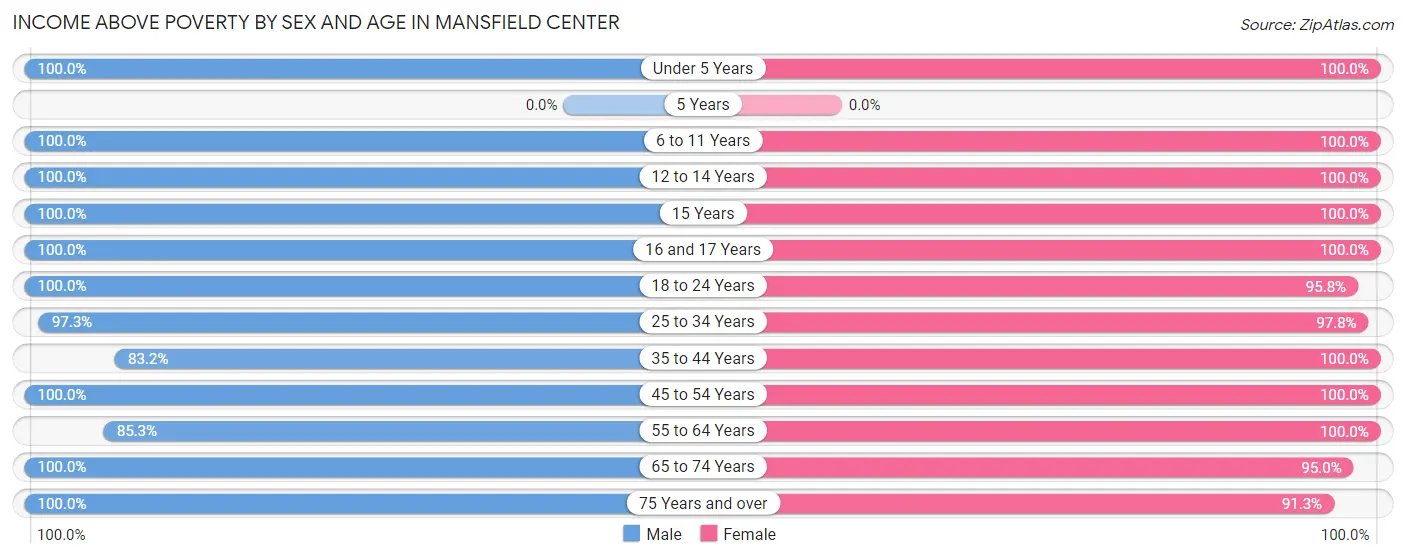
| Age Bracket | Male | Female |
| Under 5 Years | 167 (100.0%) | 169 (100.0%) |
| 5 Years | 0 (0.0%) | 0 (0.0%) |
| 6 to 11 Years | 514 (100.0%) | 374 (100.0%) |
| 12 to 14 Years | 41 (100.0%) | 88 (100.0%) |
| 15 Years | 46 (100.0%) | 45 (100.0%) |
| 16 and 17 Years | 25 (100.0%) | 61 (100.0%) |
| 18 to 24 Years | 196 (100.0%) | 250 (95.8%) |
| 25 to 34 Years | 694 (97.3%) | 651 (97.8%) |
| 35 to 44 Years | 416 (83.2%) | 441 (100.0%) |
| 45 to 54 Years | 668 (100.0%) | 513 (100.0%) |
| 55 to 64 Years | 377 (85.3%) | 533 (100.0%) |
| 65 to 74 Years | 298 (100.0%) | 416 (95.0%) |
| 75 Years and over | 109 (100.0%) | 327 (91.3%) |
| Total | 3,551 (95.5%) | 3,868 (98.0%) |
Income Below Poverty Among Married-Couple Families in Mansfield Center
The poverty statistics for married-couple families in Mansfield Center show that 1.3% or 19 of the total 1,488 families live below the poverty line. Families with no children have the highest poverty rate of 2.4%, comprising of 19 families. On the other hand, families with 1 or 2 children have the lowest poverty rate of 0.0%, which includes 0 families.
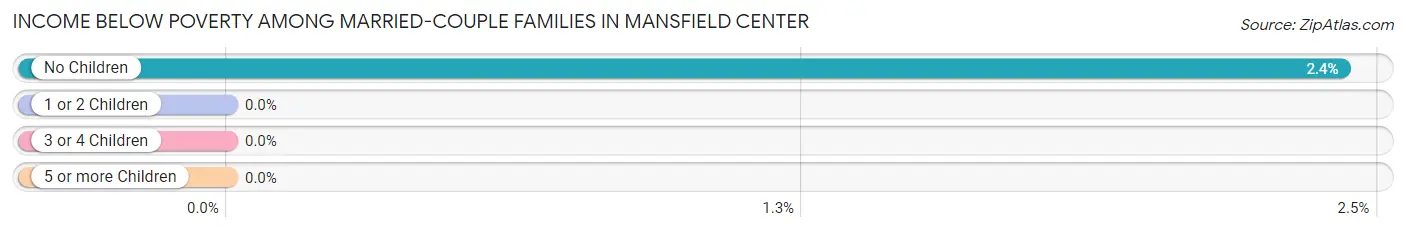
| Children | Above Poverty | Below Poverty |
| No Children | 767 (97.6%) | 19 (2.4%) |
| 1 or 2 Children | 645 (100.0%) | 0 (0.0%) |
| 3 or 4 Children | 57 (100.0%) | 0 (0.0%) |
| 5 or more Children | 0 (0.0%) | 0 (0.0%) |
| Total | 1,469 (98.7%) | 19 (1.3%) |
Income Below Poverty Among Single-Parent Households in Mansfield Center
| Children | Single Father | Single Mother |
| No Children | 0 (0.0%) | 0 (0.0%) |
| 1 or 2 Children | 0 (0.0%) | 0 (0.0%) |
| 3 or 4 Children | 0 (0.0%) | 0 (0.0%) |
| 5 or more Children | 0 (0.0%) | 0 (0.0%) |
| Total | 0 (0.0%) | 0 (0.0%) |
Income Below Poverty Among Married-Couple vs Single-Parent Households in Mansfield Center
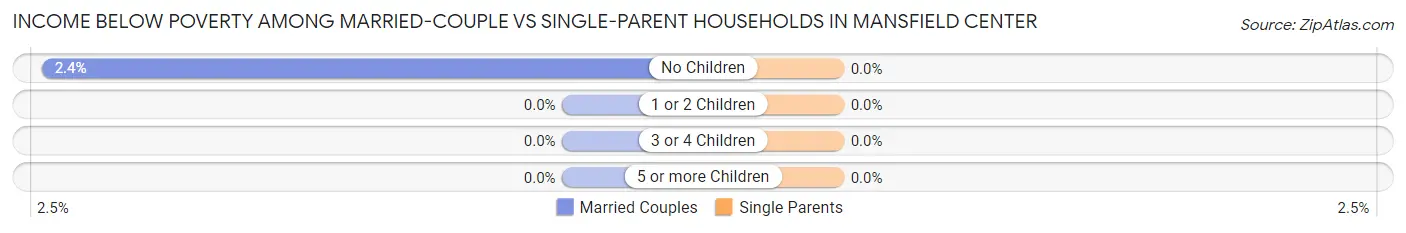
| Children | Married-Couple Families | Single-Parent Households |
| No Children | 19 (2.4%) | 0 (0.0%) |
| 1 or 2 Children | 0 (0.0%) | 0 (0.0%) |
| 3 or 4 Children | 0 (0.0%) | 0 (0.0%) |
| 5 or more Children | 0 (0.0%) | 0 (0.0%) |
| Total | 19 (1.3%) | 0 (0.0%) |
Race in Mansfield Center
The most populous races in Mansfield Center are White / Caucasian (6,426 | 83.6%), Asian (600 | 7.8%), and Two or more Races (510 | 6.6%).
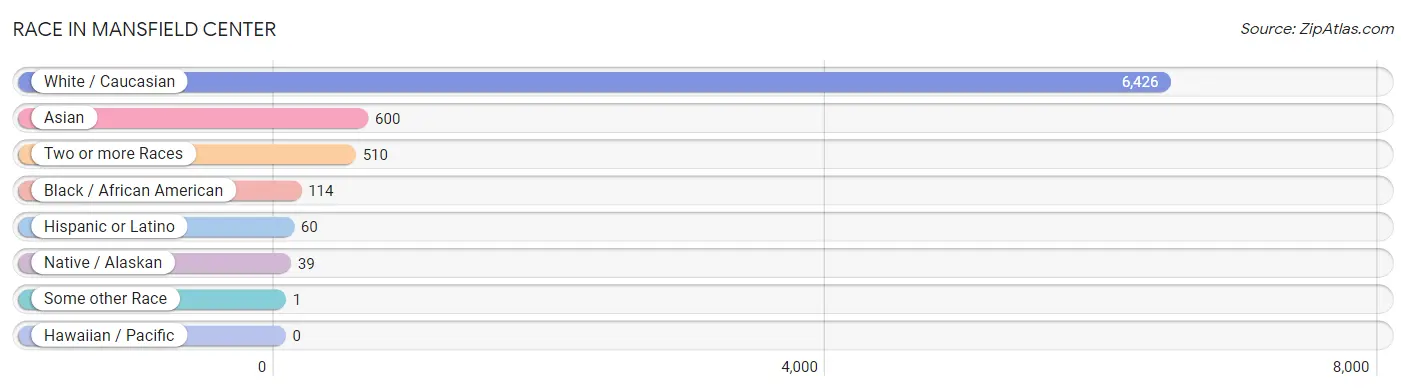
| Race | # Population | % Population |
| Asian | 600 | 7.8% |
| Black / African American | 114 | 1.5% |
| Hawaiian / Pacific | 0 | 0.0% |
| Hispanic or Latino | 60 | 0.8% |
| Native / Alaskan | 39 | 0.5% |
| White / Caucasian | 6,426 | 83.6% |
| Two or more Races | 510 | 6.6% |
| Some other Race | 1 | 0.0% |
| Total | 7,690 | 100.0% |
Ancestry in Mansfield Center
The most populous ancestries reported in Mansfield Center are Irish (2,494 | 32.4%), Italian (1,099 | 14.3%), English (662 | 8.6%), French (619 | 8.1%), and German (443 | 5.8%), together accounting for 69.1% of all Mansfield Center residents.
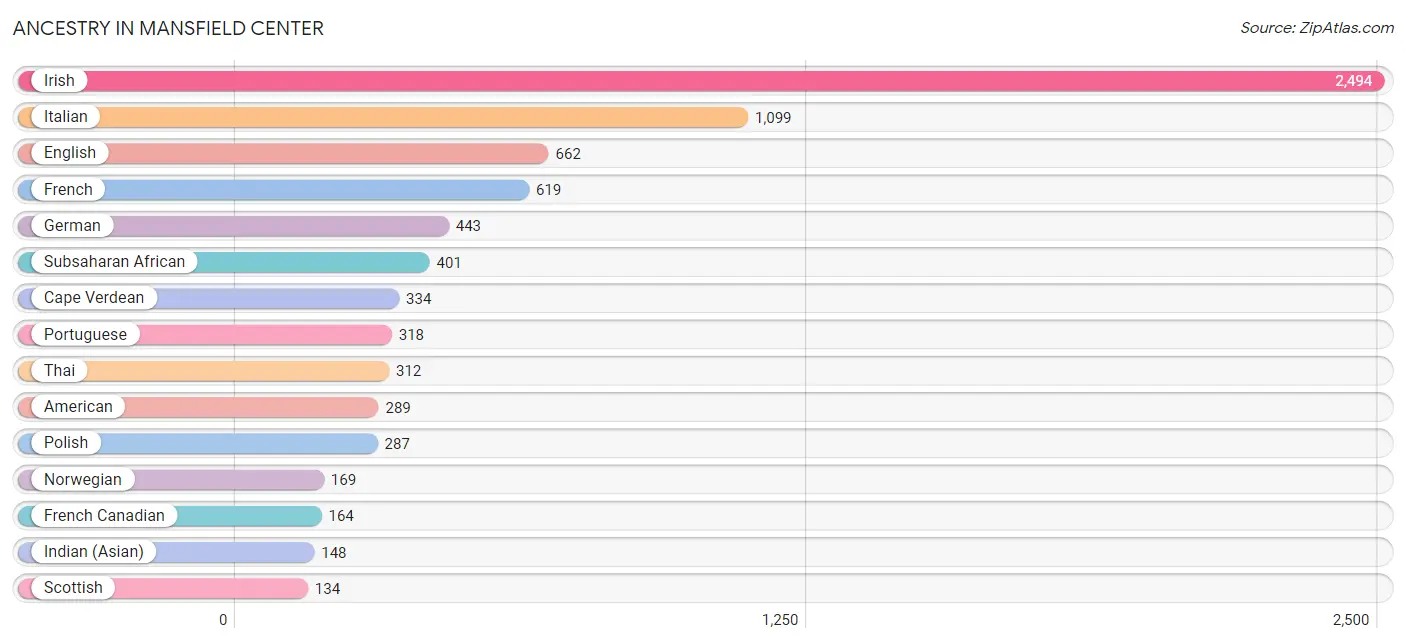
| Ancestry | # Population | % Population |
| African | 5 | 0.1% |
| American | 289 | 3.8% |
| Arab | 30 | 0.4% |
| Austrian | 16 | 0.2% |
| Bulgarian | 50 | 0.6% |
| Burmese | 16 | 0.2% |
| Canadian | 55 | 0.7% |
| Cape Verdean | 334 | 4.3% |
| Chilean | 39 | 0.5% |
| Cuban | 1 | 0.0% |
| Czech | 20 | 0.3% |
| Czechoslovakian | 42 | 0.5% |
| Dutch | 9 | 0.1% |
| Eastern European | 58 | 0.7% |
| English | 662 | 8.6% |
| European | 54 | 0.7% |
| Filipino | 41 | 0.5% |
| Finnish | 17 | 0.2% |
| French | 619 | 8.1% |
| French Canadian | 164 | 2.1% |
| German | 443 | 5.8% |
| Greek | 37 | 0.5% |
| Hungarian | 13 | 0.2% |
| Indian (Asian) | 148 | 1.9% |
| Irish | 2,494 | 32.4% |
| Italian | 1,099 | 14.3% |
| Korean | 89 | 1.2% |
| Lithuanian | 30 | 0.4% |
| Mexican | 20 | 0.3% |
| Norwegian | 169 | 2.2% |
| Pakistani | 32 | 0.4% |
| Polish | 287 | 3.7% |
| Portuguese | 318 | 4.1% |
| Russian | 53 | 0.7% |
| Scandinavian | 22 | 0.3% |
| Scotch-Irish | 70 | 0.9% |
| Scottish | 134 | 1.7% |
| Serbian | 16 | 0.2% |
| Sioux | 15 | 0.2% |
| Slovene | 69 | 0.9% |
| South American | 39 | 0.5% |
| South American Indian | 39 | 0.5% |
| Sri Lankan | 21 | 0.3% |
| Subsaharan African | 401 | 5.2% |
| Swedish | 132 | 1.7% |
| Syrian | 16 | 0.2% |
| Thai | 312 | 4.1% |
| Turkish | 22 | 0.3% |
| Ukrainian | 67 | 0.9% |
| Welsh | 61 | 0.8% | View All 50 Rows |
Immigrants in Mansfield Center
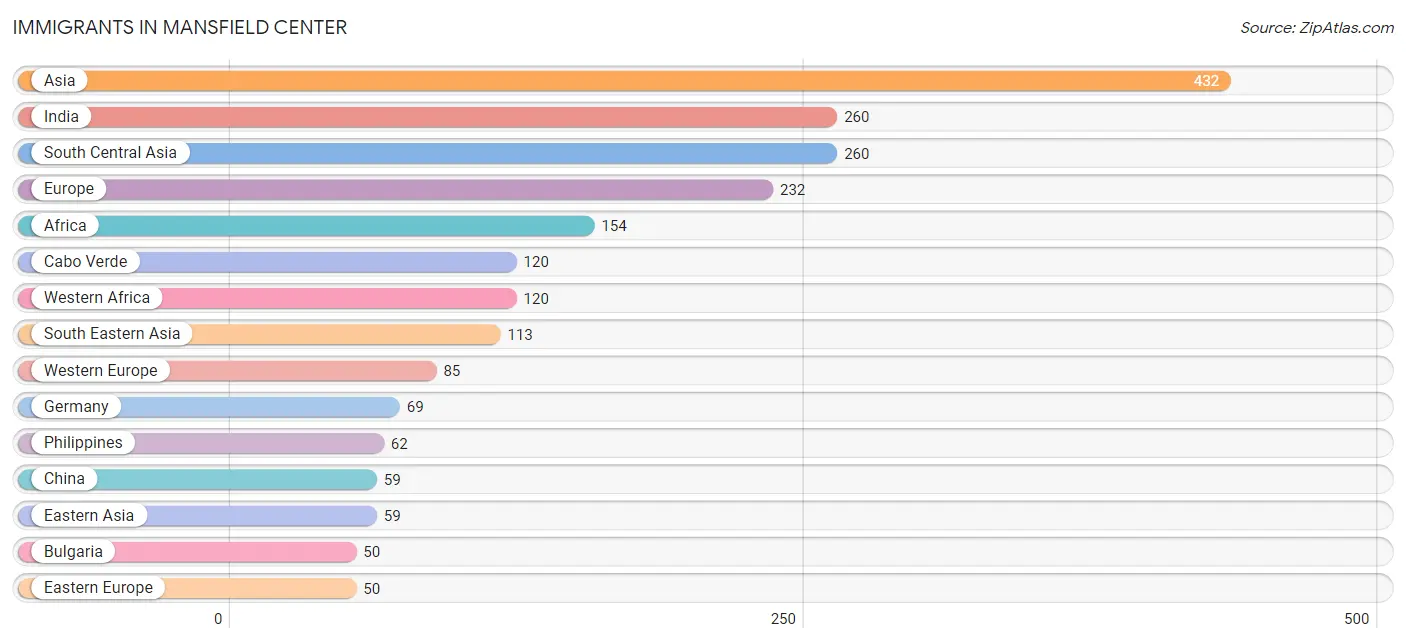
The most numerous immigrant groups reported in Mansfield Center came from Asia (432 | 5.6%), India (260 | 3.4%), South Central Asia (260 | 3.4%), Europe (232 | 3.0%), and Africa (154 | 2.0%), together accounting for 17.4% of all Mansfield Center residents.
| Immigration Origin | # Population | % Population |
| Africa | 154 | 2.0% |
| Asia | 432 | 5.6% |
| Austria | 16 | 0.2% |
| Bulgaria | 50 | 0.6% |
| Cabo Verde | 120 | 1.6% |
| Cameroon | 19 | 0.3% |
| Canada | 25 | 0.3% |
| China | 59 | 0.8% |
| Colombia | 21 | 0.3% |
| Eastern Asia | 59 | 0.8% |
| Eastern Europe | 50 | 0.6% |
| Europe | 232 | 3.0% |
| Germany | 69 | 0.9% |
| India | 260 | 3.4% |
| Italy | 25 | 0.3% |
| Latin America | 21 | 0.3% |
| Malaysia | 30 | 0.4% |
| Middle Africa | 34 | 0.4% |
| Northern Europe | 50 | 0.6% |
| Philippines | 62 | 0.8% |
| Portugal | 22 | 0.3% |
| South America | 21 | 0.3% |
| South Central Asia | 260 | 3.4% |
| South Eastern Asia | 113 | 1.5% |
| Southern Europe | 47 | 0.6% |
| Taiwan | 31 | 0.4% |
| Vietnam | 21 | 0.3% |
| Western Africa | 120 | 1.6% |
| Western Europe | 85 | 1.1% | View All 29 Rows |
Sex and Age in Mansfield Center
Sex and Age in Mansfield Center
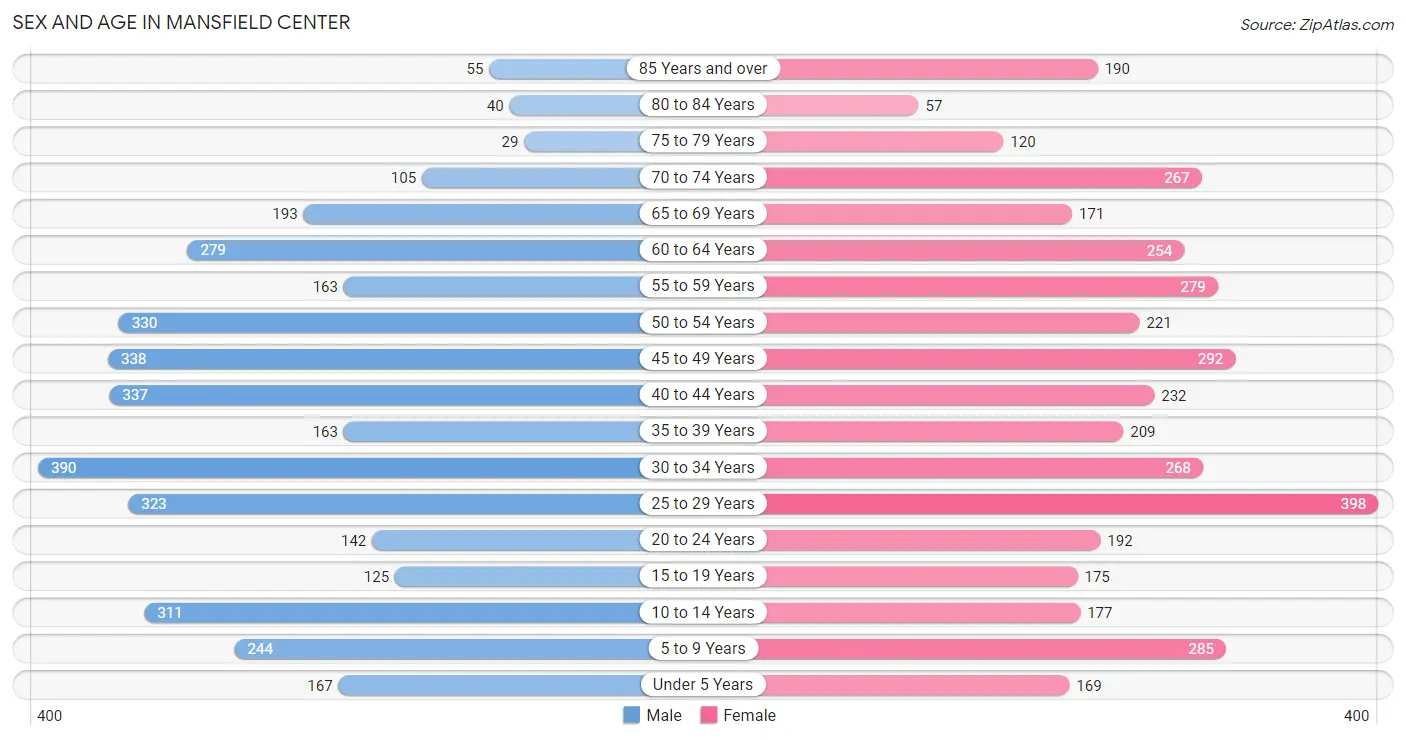
The most populous age groups in Mansfield Center are 30 to 34 Years (390 | 10.4%) for men and 25 to 29 Years (398 | 10.1%) for women.
| Age Bracket | Male | Female |
| Under 5 Years | 167 (4.5%) | 169 (4.3%) |
| 5 to 9 Years | 244 (6.5%) | 285 (7.2%) |
| 10 to 14 Years | 311 (8.3%) | 177 (4.5%) |
| 15 to 19 Years | 125 (3.4%) | 175 (4.4%) |
| 20 to 24 Years | 142 (3.8%) | 192 (4.9%) |
| 25 to 29 Years | 323 (8.6%) | 398 (10.1%) |
| 30 to 34 Years | 390 (10.4%) | 268 (6.8%) |
| 35 to 39 Years | 163 (4.4%) | 209 (5.3%) |
| 40 to 44 Years | 337 (9.0%) | 232 (5.9%) |
| 45 to 49 Years | 338 (9.0%) | 292 (7.4%) |
| 50 to 54 Years | 330 (8.8%) | 221 (5.6%) |
| 55 to 59 Years | 163 (4.4%) | 279 (7.0%) |
| 60 to 64 Years | 279 (7.5%) | 254 (6.4%) |
| 65 to 69 Years | 193 (5.2%) | 171 (4.3%) |
| 70 to 74 Years | 105 (2.8%) | 267 (6.8%) |
| 75 to 79 Years | 29 (0.8%) | 120 (3.0%) |
| 80 to 84 Years | 40 (1.1%) | 57 (1.4%) |
| 85 Years and over | 55 (1.5%) | 190 (4.8%) |
| Total | 3,734 (100.0%) | 3,956 (100.0%) |
Families and Households in Mansfield Center
Median Family Size in Mansfield Center
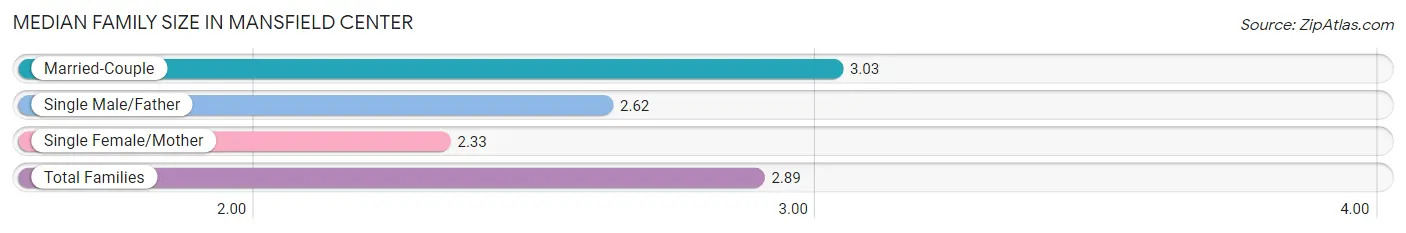
The median family size in Mansfield Center is 2.89 persons per family, with married-couple families (1,488 | 74.4%) accounting for the largest median family size of 3.03 persons per family. On the other hand, single female/mother families (277 | 13.9%) represent the smallest median family size with 2.33 persons per family.
| Family Type | # Families | Family Size |
| Married-Couple | 1,488 (74.4%) | 3.03 |
| Single Male/Father | 235 (11.7%) | 2.62 |
| Single Female/Mother | 277 (13.9%) | 2.33 |
| Total Families | 2,000 (100.0%) | 2.89 |
Median Household Size in Mansfield Center
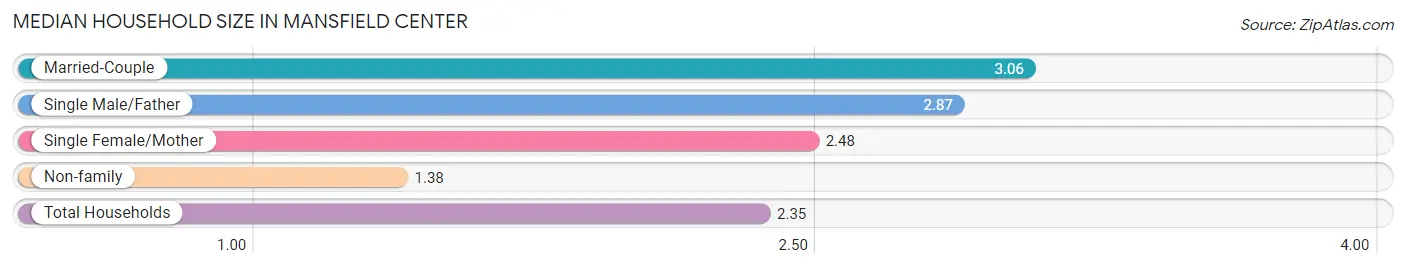
The median household size in Mansfield Center is 2.35 persons per household, with married-couple households (1,488 | 45.7%) accounting for the largest median household size of 3.06 persons per household. non-family households (1,259 | 38.6%) represent the smallest median household size with 1.38 persons per household.
| Household Type | # Households | Household Size |
| Married-Couple | 1,488 (45.7%) | 3.06 |
| Single Male/Father | 235 (7.2%) | 2.87 |
| Single Female/Mother | 277 (8.5%) | 2.48 |
| Non-family | 1,259 (38.6%) | 1.38 |
| Total Households | 3,259 (100.0%) | 2.35 |
Household Size by Marriage Status in Mansfield Center
Out of a total of 3,259 households in Mansfield Center, 2,000 (61.4%) are family households, while 1,259 (38.6%) are nonfamily households. The most numerous type of family households are 2-person households, comprising 898, and the most common type of nonfamily households are 1-person households, comprising 988.
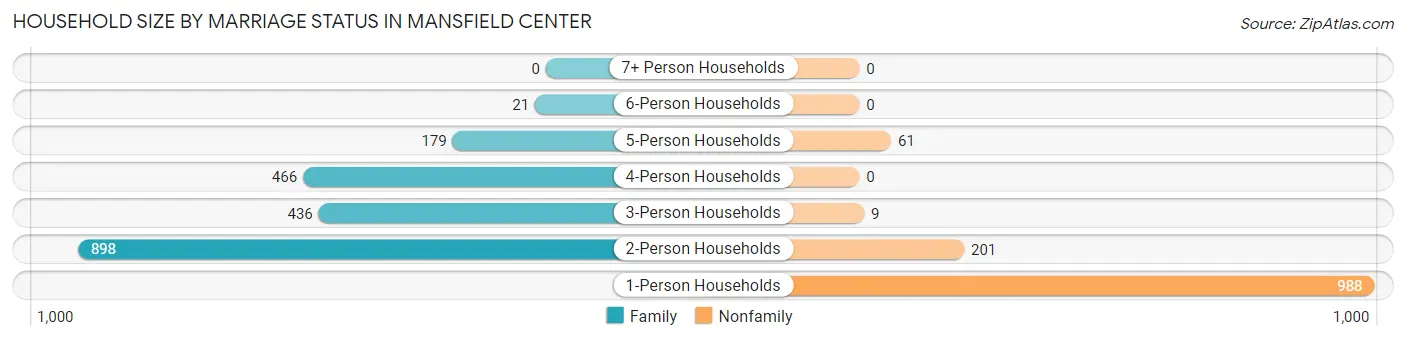
| Household Size | Family Households | Nonfamily Households |
| 1-Person Households | - | 988 (30.3%) |
| 2-Person Households | 898 (27.6%) | 201 (6.2%) |
| 3-Person Households | 436 (13.4%) | 9 (0.3%) |
| 4-Person Households | 466 (14.3%) | 0 (0.0%) |
| 5-Person Households | 179 (5.5%) | 61 (1.9%) |
| 6-Person Households | 21 (0.6%) | 0 (0.0%) |
| 7+ Person Households | 0 (0.0%) | 0 (0.0%) |
| Total | 2,000 (61.4%) | 1,259 (38.6%) |
Female Fertility in Mansfield Center
Fertility by Age in Mansfield Center
Average fertility rate in Mansfield Center is 43.0 births per 1,000 women. Women in the age bracket of 20 to 34 years have the highest fertility rate with 90.0 births per 1,000 women. Women in the age bracket of 20 to 34 years acount for 100.0% of all women with births.
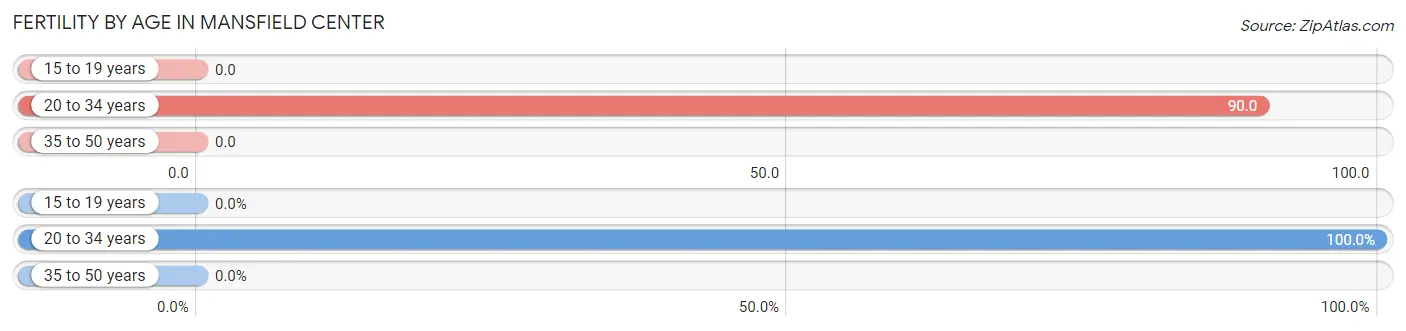
| Age Bracket | Women with Births | Births / 1,000 Women |
| 15 to 19 years | 0 (0.0%) | 0.0 |
| 20 to 34 years | 77 (100.0%) | 90.0 |
| 35 to 50 years | 0 (0.0%) | 0.0 |
| Total | 77 (100.0%) | 43.0 |
Fertility by Age by Marriage Status in Mansfield Center
74.0% of women with births (77) in Mansfield Center are married. The highest percentage of unmarried women with births falls into 20 to 34 years age bracket with 26.0% of them unmarried at the time of birth, while the lowest percentage of unmarried women with births belong to 20 to 34 years age bracket with 26.0% of them unmarried.
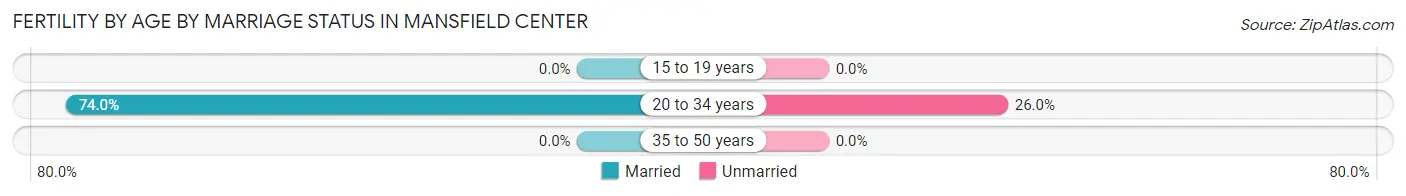
| Age Bracket | Married | Unmarried |
| 15 to 19 years | 0 (0.0%) | 0 (0.0%) |
| 20 to 34 years | 57 (74.0%) | 20 (26.0%) |
| 35 to 50 years | 0 (0.0%) | 0 (0.0%) |
| Total | 57 (74.0%) | 20 (26.0%) |
Fertility by Education in Mansfield Center
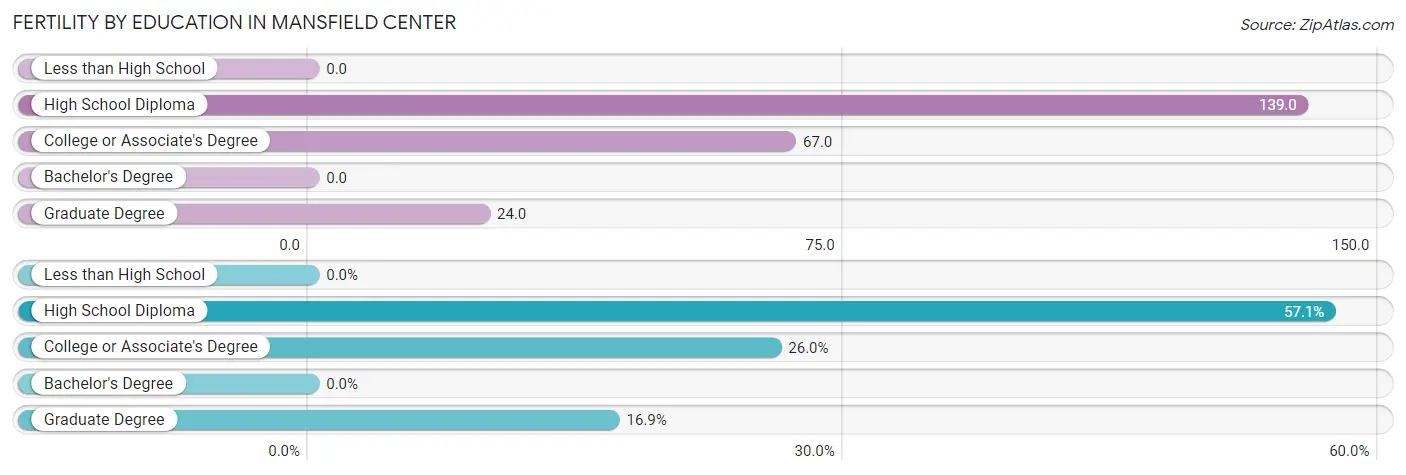
| Educational Attainment | Women with Births | Births / 1,000 Women |
| Less than High School | 0 (0.0%) | 0.0 |
| High School Diploma | 44 (57.1%) | 139.0 |
| College or Associate's Degree | 20 (26.0%) | 67.0 |
| Bachelor's Degree | 0 (0.0%) | 0.0 |
| Graduate Degree | 13 (16.9%) | 24.0 |
| Total | 77 (100.0%) | 43.0 |
Fertility by Education by Marriage Status in Mansfield Center
26.0% of women with births in Mansfield Center are unmarried. Women with the educational attainment of high school diploma are most likely to be married with 100.0% of them married at childbirth, while women with the educational attainment of college or associate's degree are least likely to be married with 100.0% of them unmarried at childbirth.
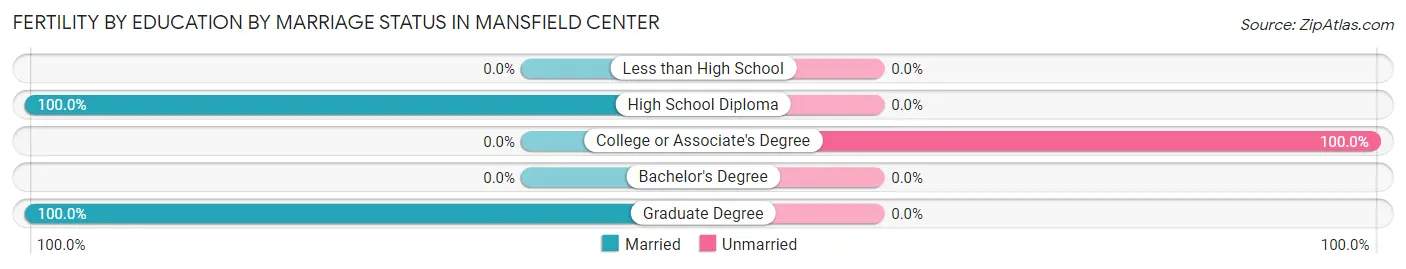
| Educational Attainment | Married | Unmarried |
| Less than High School | 0 (0.0%) | 0 (0.0%) |
| High School Diploma | 44 (100.0%) | 0 (0.0%) |
| College or Associate's Degree | 0 (0.0%) | 20 (100.0%) |
| Bachelor's Degree | 0 (0.0%) | 0 (0.0%) |
| Graduate Degree | 13 (100.0%) | 0 (0.0%) |
| Total | 57 (74.0%) | 20 (26.0%) |
Employment Characteristics in Mansfield Center
Employment by Class of Employer in Mansfield Center
Among the 4,095 employed individuals in Mansfield Center, private company employees (2,662 | 65.0%), not-for-profit organizations (506 | 12.4%), and local government employees (430 | 10.5%) make up the most common classes of employment.
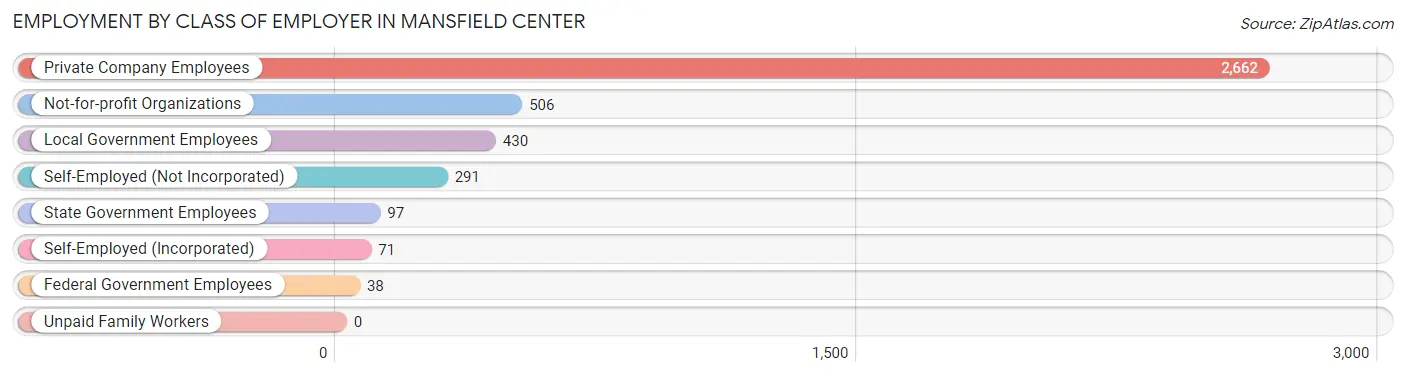
| Employer Class | # Employees | % Employees |
| Private Company Employees | 2,662 | 65.0% |
| Self-Employed (Incorporated) | 71 | 1.7% |
| Self-Employed (Not Incorporated) | 291 | 7.1% |
| Not-for-profit Organizations | 506 | 12.4% |
| Local Government Employees | 430 | 10.5% |
| State Government Employees | 97 | 2.4% |
| Federal Government Employees | 38 | 0.9% |
| Unpaid Family Workers | 0 | 0.0% |
| Total | 4,095 | 100.0% |
Employment Status by Age in Mansfield Center
According to the labor force statistics for Mansfield Center, out of the total population over 16 years of age (6,246), 70.5% or 4,403 individuals are in the labor force, with 5.2% or 229 of them unemployed. The age group with the highest labor force participation rate is 20 to 24 years, with 96.4% or 322 individuals in the labor force. Within the labor force, the 16 to 19 years age range has the highest percentage of unemployed individuals, with 39.8% or 33 of them being unemployed.
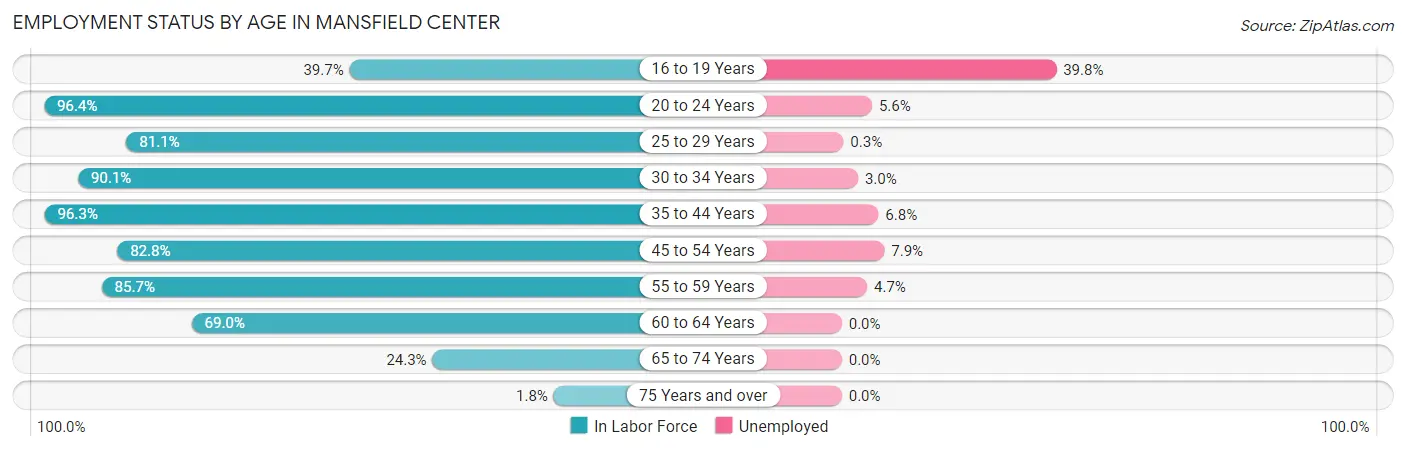
| Age Bracket | In Labor Force | Unemployed |
| 16 to 19 Years | 83 (39.7%) | 33 (39.8%) |
| 20 to 24 Years | 322 (96.4%) | 18 (5.6%) |
| 25 to 29 Years | 585 (81.1%) | 2 (0.3%) |
| 30 to 34 Years | 593 (90.1%) | 18 (3.0%) |
| 35 to 44 Years | 906 (96.3%) | 62 (6.8%) |
| 45 to 54 Years | 978 (82.8%) | 77 (7.9%) |
| 55 to 59 Years | 379 (85.7%) | 18 (4.7%) |
| 60 to 64 Years | 368 (69.0%) | 0 (0.0%) |
| 65 to 74 Years | 179 (24.3%) | 0 (0.0%) |
| 75 Years and over | 9 (1.8%) | 0 (0.0%) |
| Total | 4,403 (70.5%) | 229 (5.2%) |
Employment Status by Educational Attainment in Mansfield Center
According to labor force statistics for Mansfield Center, 85.1% of individuals (3,809) out of the total population between 25 and 64 years of age (4,476) are in the labor force, with 4.6% or 175 of them being unemployed. The group with the highest labor force participation rate are those with the educational attainment of college / associate degree, with 89.7% or 969 individuals in the labor force. Within the labor force, individuals with high school diploma education have the highest percentage of unemployment, with 9.4% or 80 of them being unemployed.
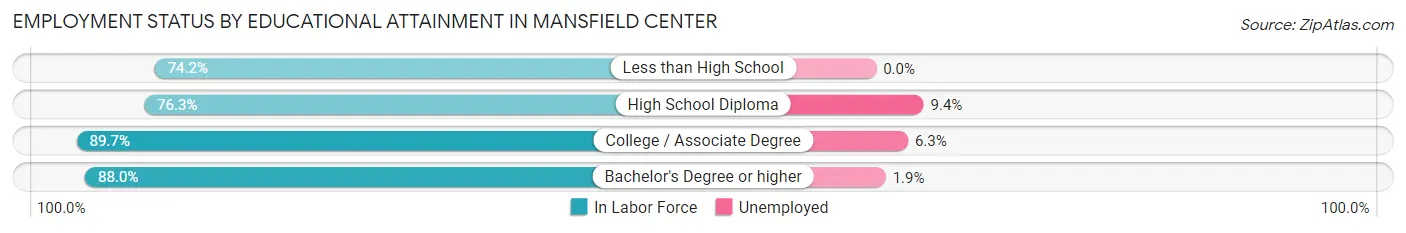
| Educational Attainment | In Labor Force | Unemployed |
| Less than High School | 98 (74.2%) | 0 (0.0%) |
| High School Diploma | 852 (76.3%) | 105 (9.4%) |
| College / Associate Degree | 969 (89.7%) | 68 (6.3%) |
| Bachelor's Degree or higher | 1,890 (88.0%) | 41 (1.9%) |
| Total | 3,809 (85.1%) | 206 (4.6%) |
Employment Occupations by Sex in Mansfield Center
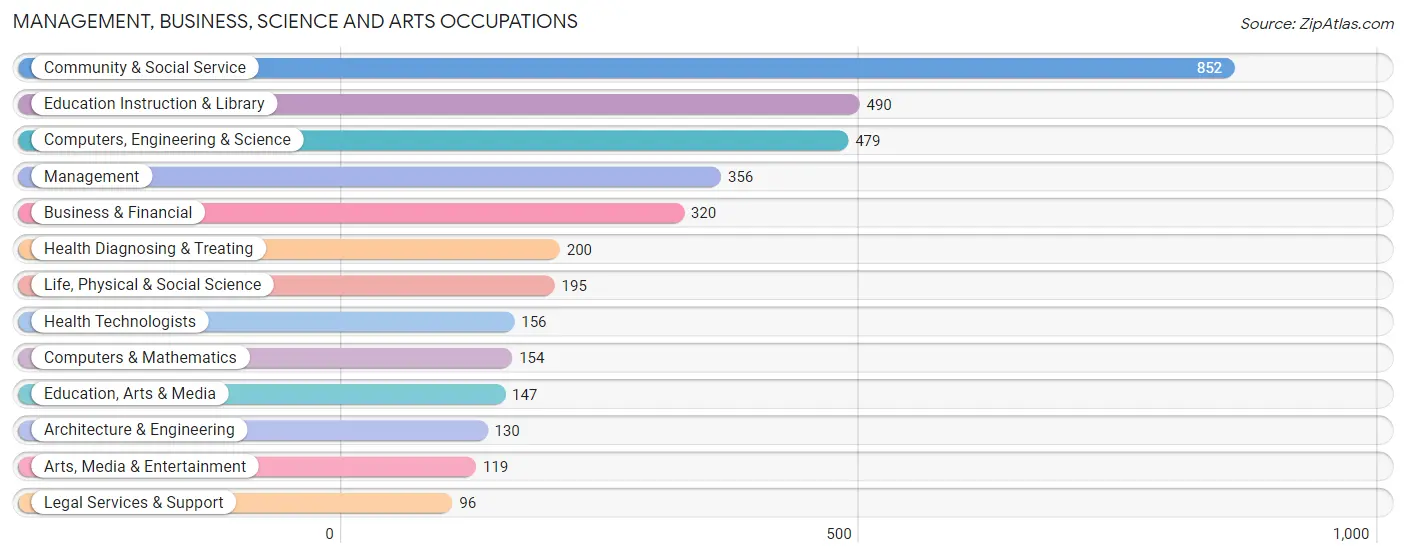
Management, Business, Science and Arts Occupations
The most common Management, Business, Science and Arts occupations in Mansfield Center are Community & Social Service (852 | 20.4%), Education Instruction & Library (490 | 11.7%), Computers, Engineering & Science (479 | 11.5%), Management (356 | 8.5%), and Business & Financial (320 | 7.7%).
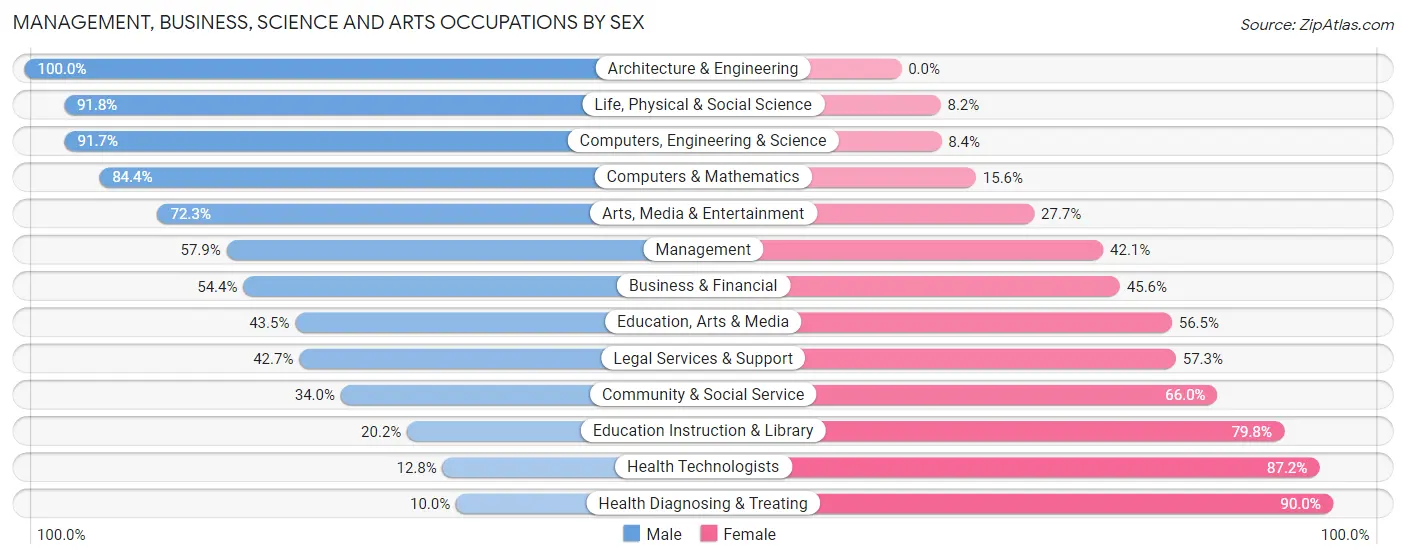
Management, Business, Science and Arts Occupations by Sex
Within the Management, Business, Science and Arts occupations in Mansfield Center, the most male-oriented occupations are Architecture & Engineering (100.0%), Life, Physical & Social Science (91.8%), and Computers, Engineering & Science (91.6%), while the most female-oriented occupations are Health Diagnosing & Treating (90.0%), Health Technologists (87.2%), and Education Instruction & Library (79.8%).
| Occupation | Male | Female |
| Management | 206 (57.9%) | 150 (42.1%) |
| Business & Financial | 174 (54.4%) | 146 (45.6%) |
| Computers, Engineering & Science | 439 (91.6%) | 40 (8.4%) |
| Computers & Mathematics | 130 (84.4%) | 24 (15.6%) |
| Architecture & Engineering | 130 (100.0%) | 0 (0.0%) |
| Life, Physical & Social Science | 179 (91.8%) | 16 (8.2%) |
| Community & Social Service | 290 (34.0%) | 562 (66.0%) |
| Education, Arts & Media | 64 (43.5%) | 83 (56.5%) |
| Legal Services & Support | 41 (42.7%) | 55 (57.3%) |
| Education Instruction & Library | 99 (20.2%) | 391 (79.8%) |
| Arts, Media & Entertainment | 86 (72.3%) | 33 (27.7%) |
| Health Diagnosing & Treating | 20 (10.0%) | 180 (90.0%) |
| Health Technologists | 20 (12.8%) | 136 (87.2%) |
| Total (Category) | 1,129 (51.2%) | 1,078 (48.8%) |
| Total (Overall) | 2,306 (55.2%) | 1,868 (44.8%) |
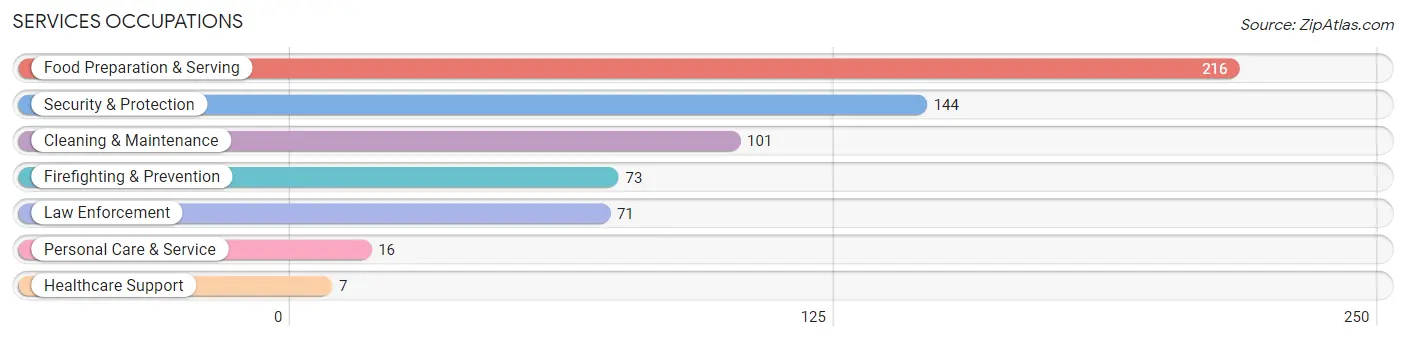
Services Occupations
The most common Services occupations in Mansfield Center are Food Preparation & Serving (216 | 5.2%), Security & Protection (144 | 3.5%), Cleaning & Maintenance (101 | 2.4%), Firefighting & Prevention (73 | 1.8%), and Law Enforcement (71 | 1.7%).
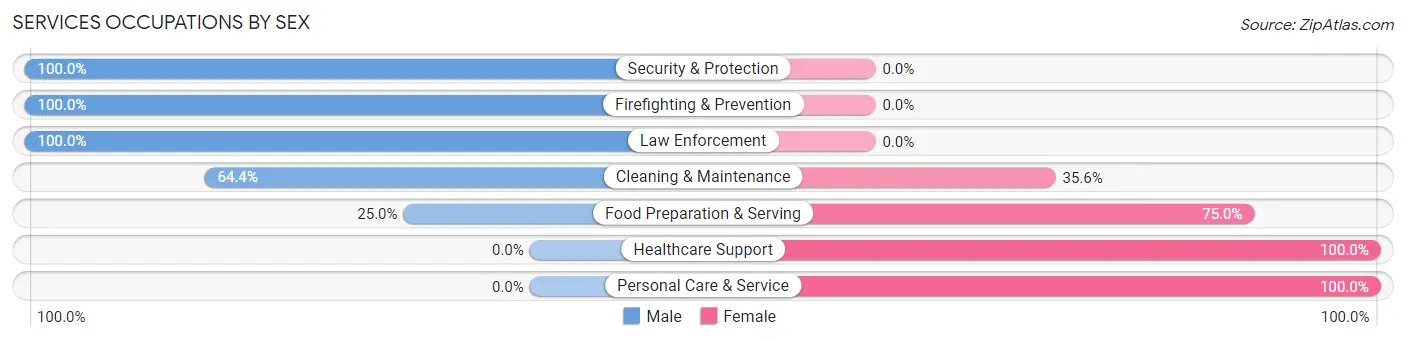
Services Occupations by Sex
Within the Services occupations in Mansfield Center, the most male-oriented occupations are Security & Protection (100.0%), Firefighting & Prevention (100.0%), and Law Enforcement (100.0%), while the most female-oriented occupations are Healthcare Support (100.0%), Personal Care & Service (100.0%), and Food Preparation & Serving (75.0%).
| Occupation | Male | Female |
| Healthcare Support | 0 (0.0%) | 7 (100.0%) |
| Security & Protection | 144 (100.0%) | 0 (0.0%) |
| Firefighting & Prevention | 73 (100.0%) | 0 (0.0%) |
| Law Enforcement | 71 (100.0%) | 0 (0.0%) |
| Food Preparation & Serving | 54 (25.0%) | 162 (75.0%) |
| Cleaning & Maintenance | 65 (64.4%) | 36 (35.6%) |
| Personal Care & Service | 0 (0.0%) | 16 (100.0%) |
| Total (Category) | 263 (54.3%) | 221 (45.7%) |
| Total (Overall) | 2,306 (55.2%) | 1,868 (44.8%) |
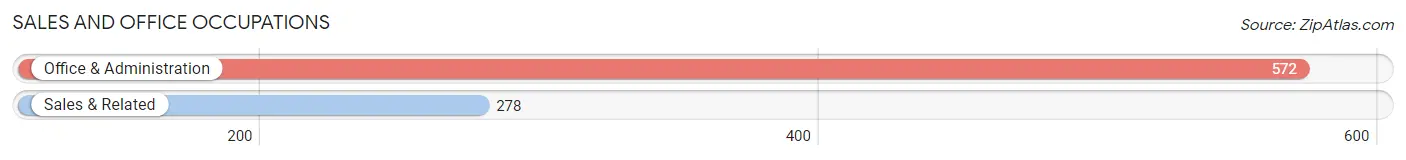
Sales and Office Occupations
The most common Sales and Office occupations in Mansfield Center are Office & Administration (572 | 13.7%), and Sales & Related (278 | 6.7%).
Sales and Office Occupations by Sex
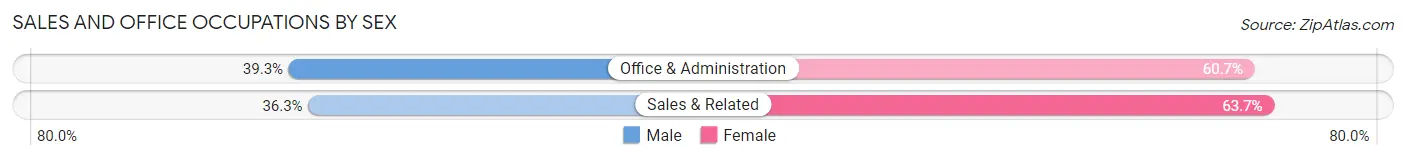
| Occupation | Male | Female |
| Sales & Related | 101 (36.3%) | 177 (63.7%) |
| Office & Administration | 225 (39.3%) | 347 (60.7%) |
| Total (Category) | 326 (38.4%) | 524 (61.7%) |
| Total (Overall) | 2,306 (55.2%) | 1,868 (44.8%) |
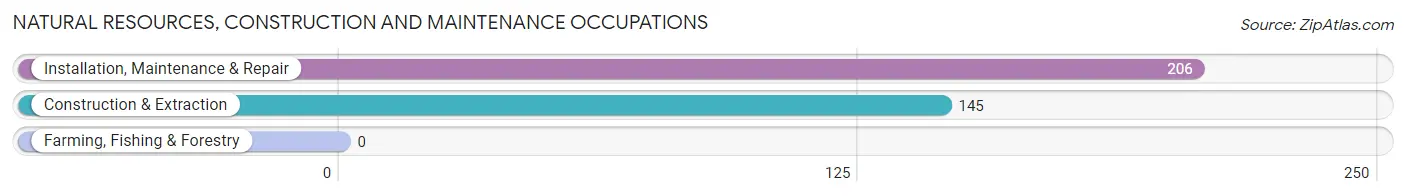
Natural Resources, Construction and Maintenance Occupations
The most common Natural Resources, Construction and Maintenance occupations in Mansfield Center are Installation, Maintenance & Repair (206 | 4.9%), and Construction & Extraction (145 | 3.5%).
Natural Resources, Construction and Maintenance Occupations by Sex
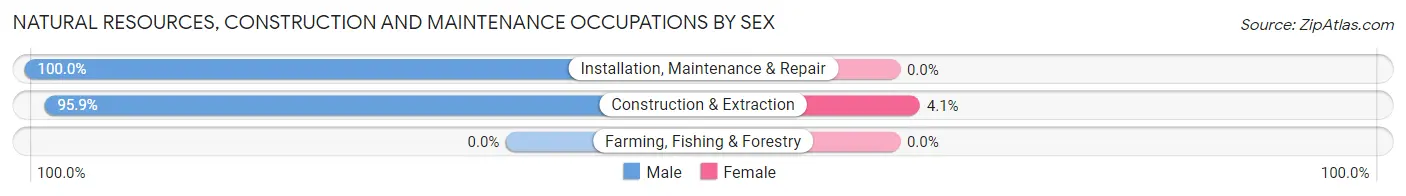
| Occupation | Male | Female |
| Farming, Fishing & Forestry | 0 (0.0%) | 0 (0.0%) |
| Construction & Extraction | 139 (95.9%) | 6 (4.1%) |
| Installation, Maintenance & Repair | 206 (100.0%) | 0 (0.0%) |
| Total (Category) | 345 (98.3%) | 6 (1.7%) |
| Total (Overall) | 2,306 (55.2%) | 1,868 (44.8%) |
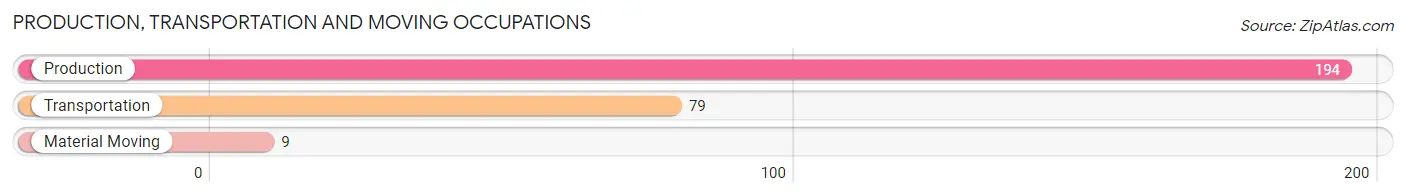
Production, Transportation and Moving Occupations
The most common Production, Transportation and Moving occupations in Mansfield Center are Production (194 | 4.6%), Transportation (79 | 1.9%), and Material Moving (9 | 0.2%).
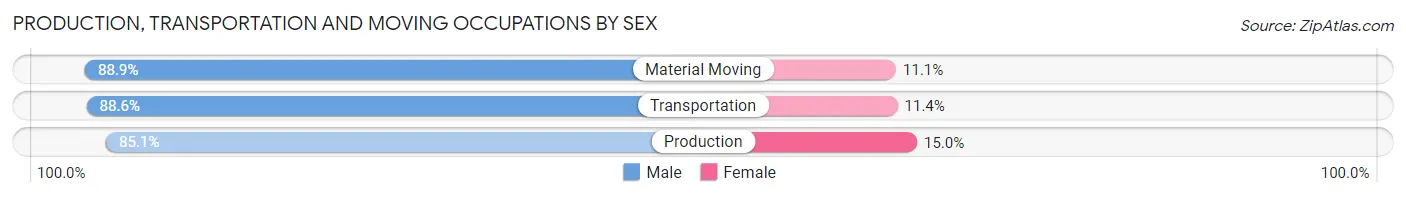
Production, Transportation and Moving Occupations by Sex
| Occupation | Male | Female |
| Production | 165 (85.1%) | 29 (14.9%) |
| Transportation | 70 (88.6%) | 9 (11.4%) |
| Material Moving | 8 (88.9%) | 1 (11.1%) |
| Total (Category) | 243 (86.2%) | 39 (13.8%) |
| Total (Overall) | 2,306 (55.2%) | 1,868 (44.8%) |
Employment Industries by Sex in Mansfield Center
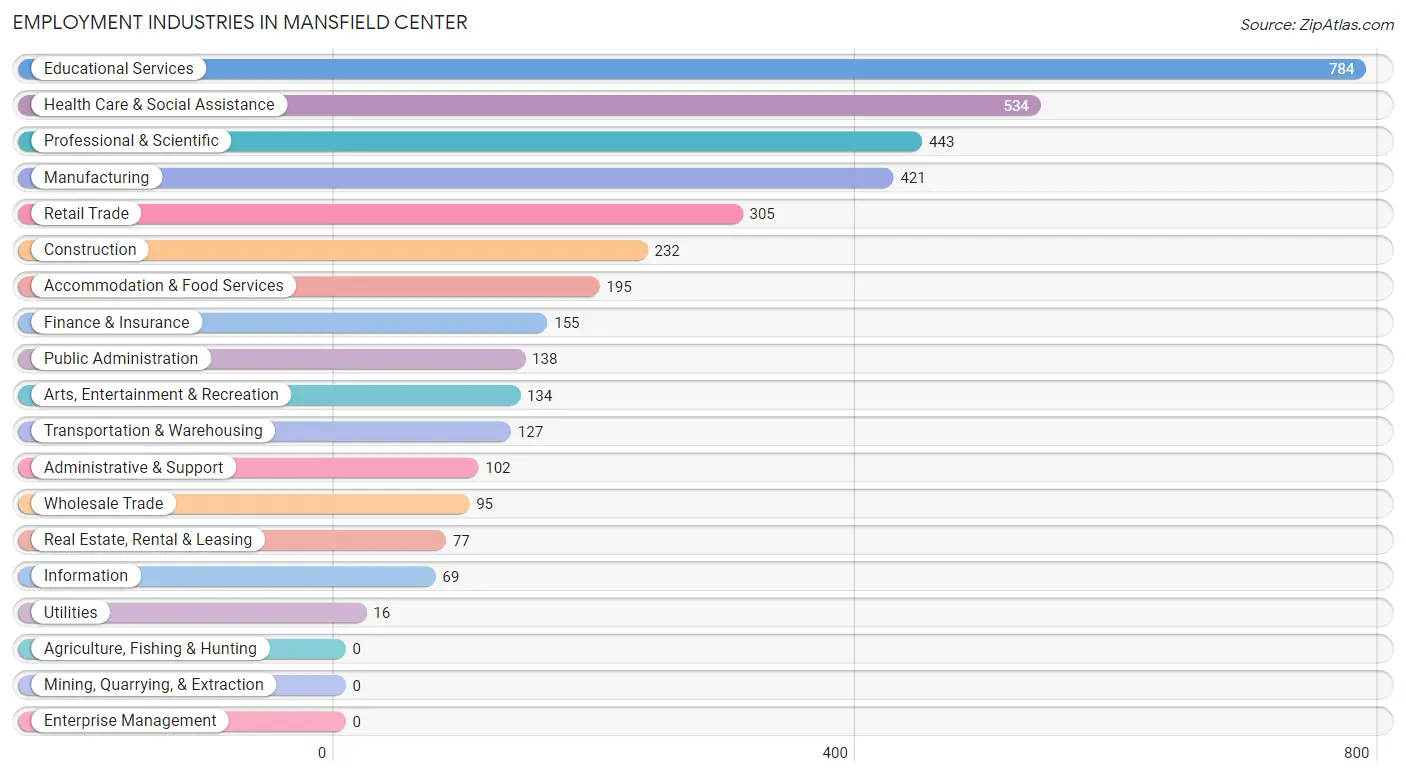
Employment Industries in Mansfield Center
The major employment industries in Mansfield Center include Educational Services (784 | 18.8%), Health Care & Social Assistance (534 | 12.8%), Professional & Scientific (443 | 10.6%), Manufacturing (421 | 10.1%), and Retail Trade (305 | 7.3%).
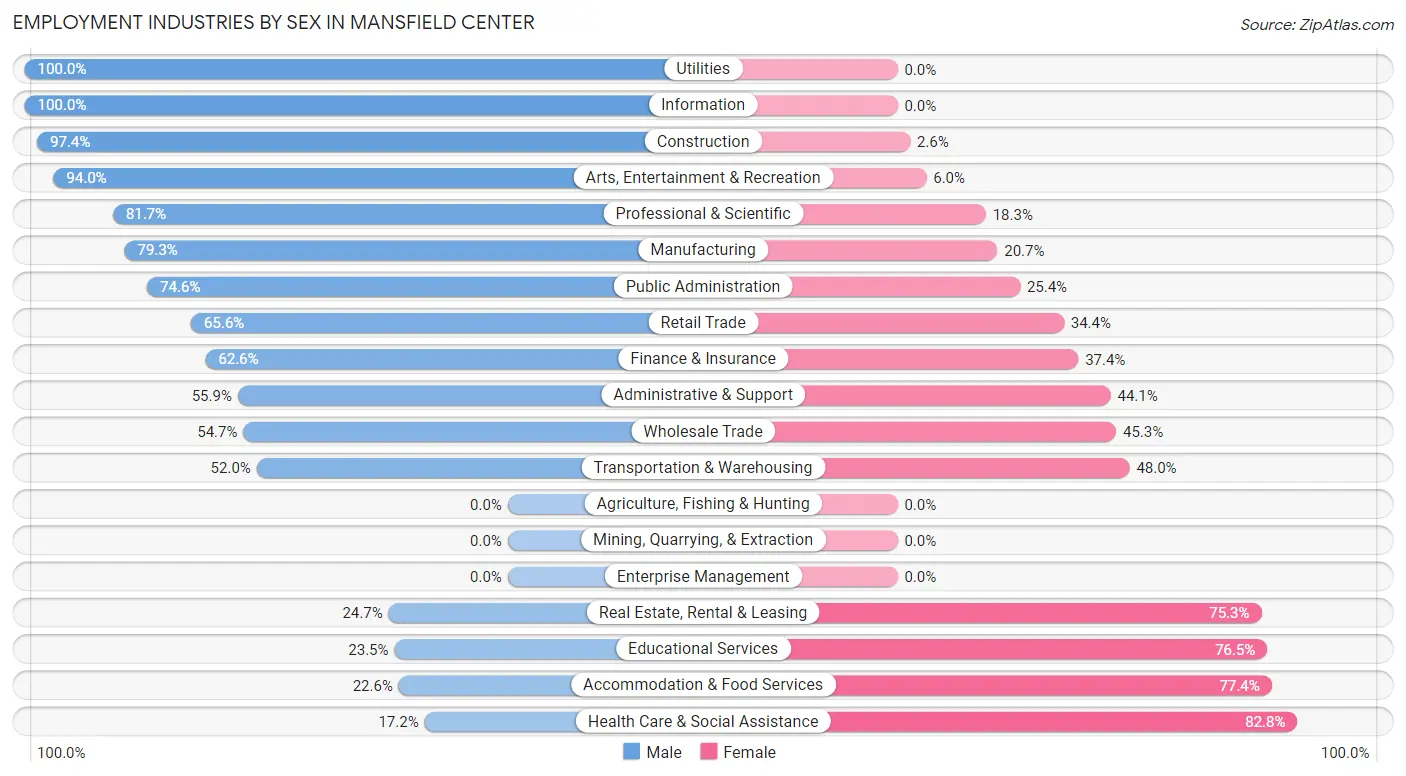
Employment Industries by Sex in Mansfield Center
The Mansfield Center industries that see more men than women are Utilities (100.0%), Information (100.0%), and Construction (97.4%), whereas the industries that tend to have a higher number of women are Health Care & Social Assistance (82.8%), Accommodation & Food Services (77.4%), and Educational Services (76.5%).
| Industry | Male | Female |
| Agriculture, Fishing & Hunting | 0 (0.0%) | 0 (0.0%) |
| Mining, Quarrying, & Extraction | 0 (0.0%) | 0 (0.0%) |
| Construction | 226 (97.4%) | 6 (2.6%) |
| Manufacturing | 334 (79.3%) | 87 (20.7%) |
| Wholesale Trade | 52 (54.7%) | 43 (45.3%) |
| Retail Trade | 200 (65.6%) | 105 (34.4%) |
| Transportation & Warehousing | 66 (52.0%) | 61 (48.0%) |
| Utilities | 16 (100.0%) | 0 (0.0%) |
| Information | 69 (100.0%) | 0 (0.0%) |
| Finance & Insurance | 97 (62.6%) | 58 (37.4%) |
| Real Estate, Rental & Leasing | 19 (24.7%) | 58 (75.3%) |
| Professional & Scientific | 362 (81.7%) | 81 (18.3%) |
| Enterprise Management | 0 (0.0%) | 0 (0.0%) |
| Administrative & Support | 57 (55.9%) | 45 (44.1%) |
| Educational Services | 184 (23.5%) | 600 (76.5%) |
| Health Care & Social Assistance | 92 (17.2%) | 442 (82.8%) |
| Arts, Entertainment & Recreation | 126 (94.0%) | 8 (6.0%) |
| Accommodation & Food Services | 44 (22.6%) | 151 (77.4%) |
| Public Administration | 103 (74.6%) | 35 (25.4%) |
| Total | 2,306 (55.2%) | 1,868 (44.8%) |
Education in Mansfield Center
School Enrollment in Mansfield Center
The most common levels of schooling among the 1,705 students in Mansfield Center are elementary school (439 | 25.8%), middle school (407 | 23.9%), and high school (280 | 16.4%).
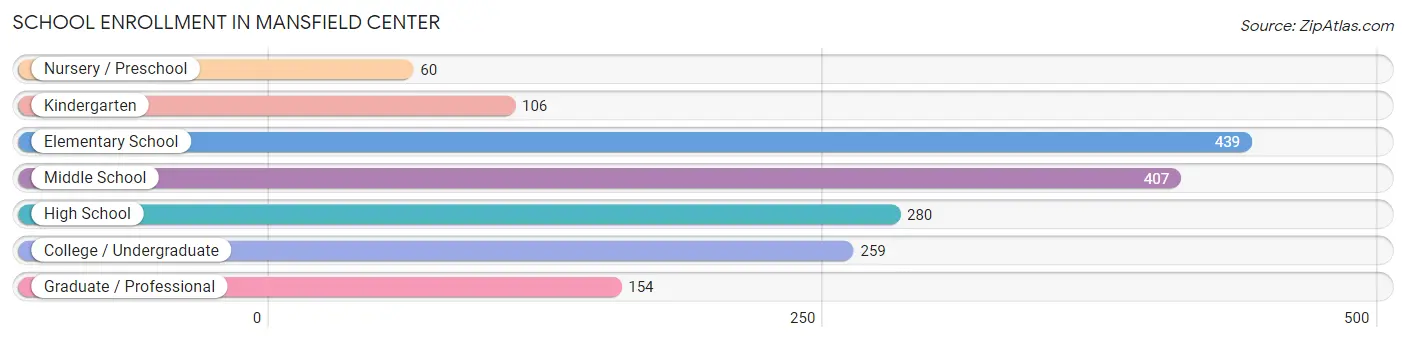
| School Level | # Students | % Students |
| Nursery / Preschool | 60 | 3.5% |
| Kindergarten | 106 | 6.2% |
| Elementary School | 439 | 25.8% |
| Middle School | 407 | 23.9% |
| High School | 280 | 16.4% |
| College / Undergraduate | 259 | 15.2% |
| Graduate / Professional | 154 | 9.0% |
| Total | 1,705 | 100.0% |
School Enrollment by Age by Funding Source in Mansfield Center
Out of a total of 1,705 students who are enrolled in schools in Mansfield Center, 351 (20.6%) attend a private institution, while the remaining 1,354 (79.4%) are enrolled in public schools. The age group of 3 to 4 year olds has the highest likelihood of being enrolled in private schools, with 43 (71.7% in the age bracket) enrolled. Conversely, the age group of 15 to 17 year olds has the lowest likelihood of being enrolled in a private school, with 177 (100.0% in the age bracket) attending a public institution.
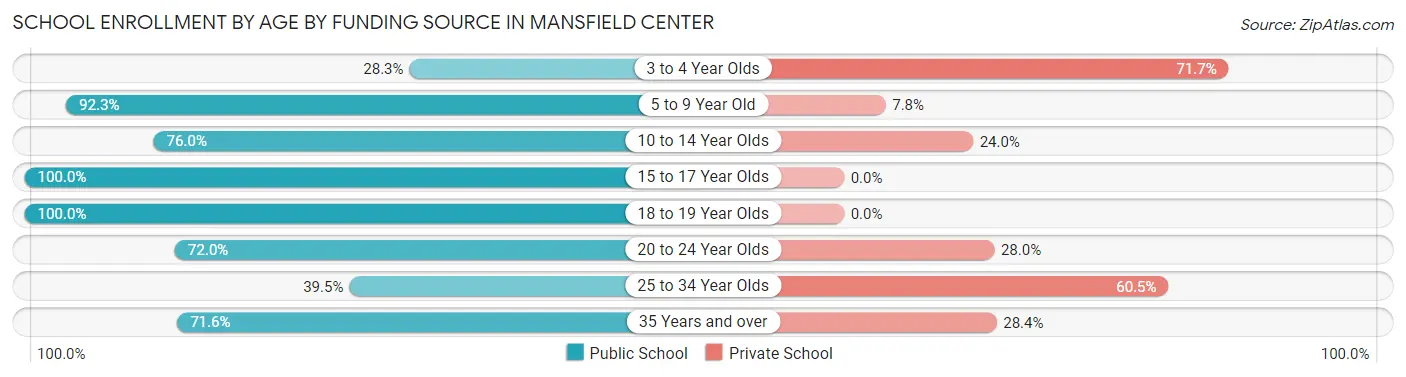
| Age Bracket | Public School | Private School |
| 3 to 4 Year Olds | 17 (28.3%) | 43 (71.7%) |
| 5 to 9 Year Old | 488 (92.2%) | 41 (7.7%) |
| 10 to 14 Year Olds | 354 (76.0%) | 112 (24.0%) |
| 15 to 17 Year Olds | 177 (100.0%) | 0 (0.0%) |
| 18 to 19 Year Olds | 67 (100.0%) | 0 (0.0%) |
| 20 to 24 Year Olds | 126 (72.0%) | 49 (28.0%) |
| 25 to 34 Year Olds | 51 (39.5%) | 78 (60.5%) |
| 35 Years and over | 73 (71.6%) | 29 (28.4%) |
| Total | 1,354 (79.4%) | 351 (20.6%) |
Educational Attainment by Field of Study in Mansfield Center
Social sciences (365 | 12.6%), business (322 | 11.1%), education (318 | 10.9%), literature & languages (290 | 10.0%), and engineering (283 | 9.7%) are the most common fields of study among 2,906 individuals in Mansfield Center who have obtained a bachelor's degree or higher.
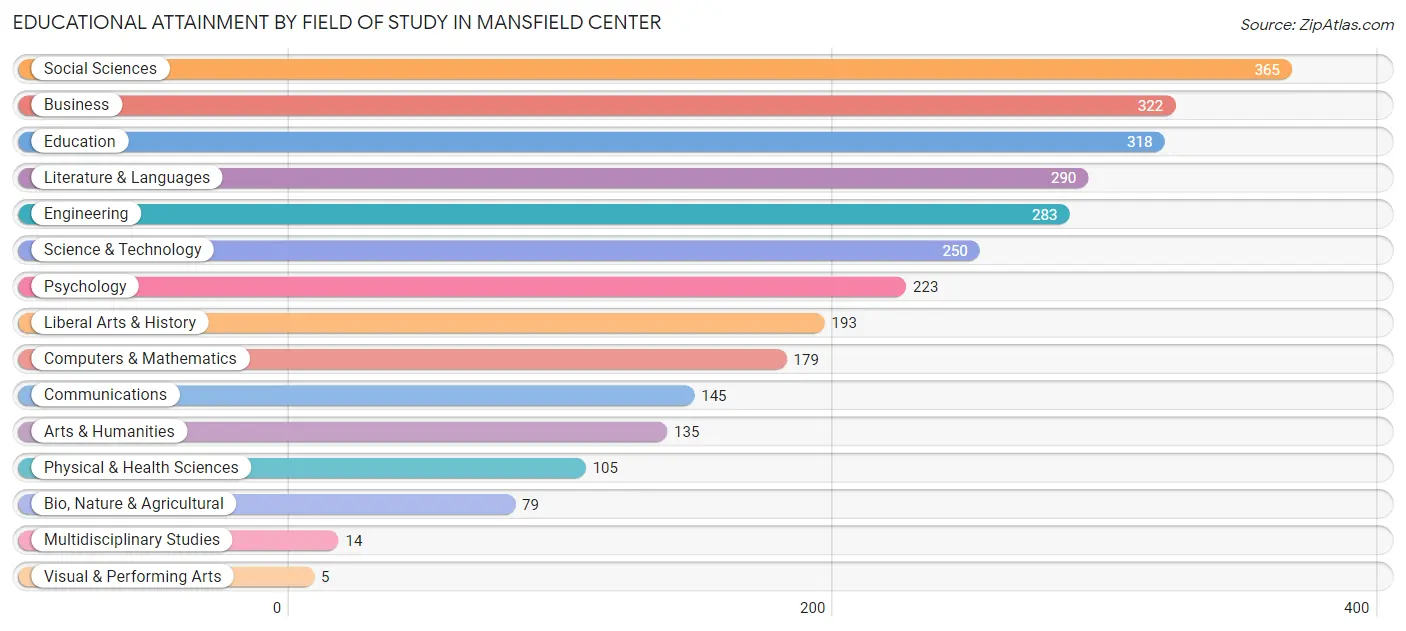
| Field of Study | # Graduates | % Graduates |
| Computers & Mathematics | 179 | 6.2% |
| Bio, Nature & Agricultural | 79 | 2.7% |
| Physical & Health Sciences | 105 | 3.6% |
| Psychology | 223 | 7.7% |
| Social Sciences | 365 | 12.6% |
| Engineering | 283 | 9.7% |
| Multidisciplinary Studies | 14 | 0.5% |
| Science & Technology | 250 | 8.6% |
| Business | 322 | 11.1% |
| Education | 318 | 10.9% |
| Literature & Languages | 290 | 10.0% |
| Liberal Arts & History | 193 | 6.6% |
| Visual & Performing Arts | 5 | 0.2% |
| Communications | 145 | 5.0% |
| Arts & Humanities | 135 | 4.6% |
| Total | 2,906 | 100.0% |
Transportation & Commute in Mansfield Center
Vehicle Availability by Sex in Mansfield Center
The most prevalent vehicle ownership categories in Mansfield Center are males with 2 vehicles (1,100, accounting for 48.6%) and females with 2 vehicles (743, making up 60.1%).
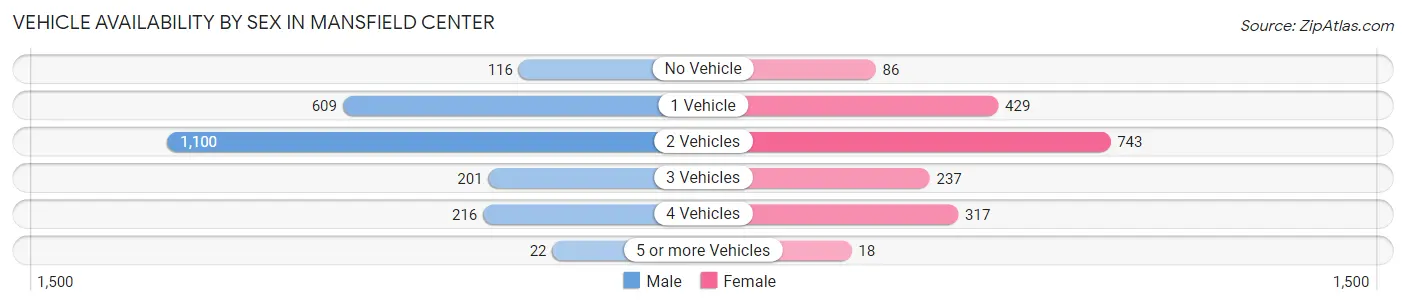
| Vehicles Available | Male | Female |
| No Vehicle | 116 (5.1%) | 86 (4.7%) |
| 1 Vehicle | 609 (26.9%) | 429 (23.4%) |
| 2 Vehicles | 1,100 (48.6%) | 743 (40.6%) |
| 3 Vehicles | 201 (8.9%) | 237 (13.0%) |
| 4 Vehicles | 216 (9.5%) | 317 (17.3%) |
| 5 or more Vehicles | 22 (1.0%) | 18 (1.0%) |
| Total | 2,264 (100.0%) | 1,830 (100.0%) |
Commute Time in Mansfield Center
The most frequently occuring commute durations in Mansfield Center are 20 to 24 minutes (690 commuters, 19.3%), 30 to 34 minutes (615 commuters, 17.2%), and 10 to 14 minutes (476 commuters, 13.3%).
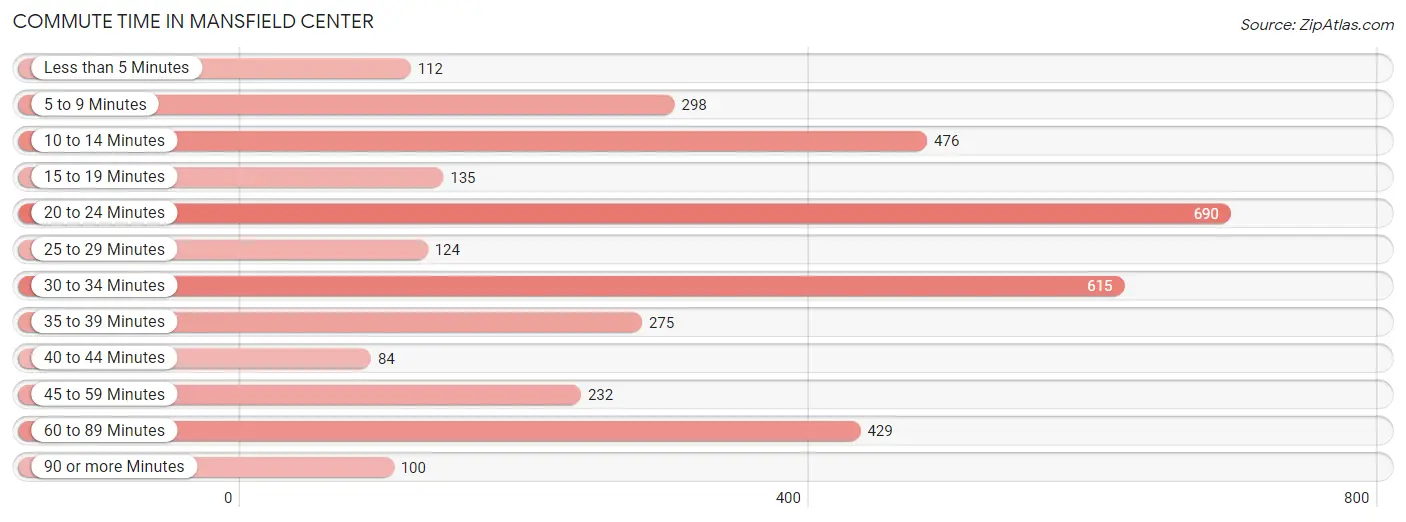
| Commute Time | # Commuters | % Commuters |
| Less than 5 Minutes | 112 | 3.1% |
| 5 to 9 Minutes | 298 | 8.4% |
| 10 to 14 Minutes | 476 | 13.3% |
| 15 to 19 Minutes | 135 | 3.8% |
| 20 to 24 Minutes | 690 | 19.3% |
| 25 to 29 Minutes | 124 | 3.5% |
| 30 to 34 Minutes | 615 | 17.2% |
| 35 to 39 Minutes | 275 | 7.7% |
| 40 to 44 Minutes | 84 | 2.4% |
| 45 to 59 Minutes | 232 | 6.5% |
| 60 to 89 Minutes | 429 | 12.0% |
| 90 or more Minutes | 100 | 2.8% |
Commute Time by Sex in Mansfield Center
The most common commute times in Mansfield Center are 20 to 24 minutes (400 commuters, 21.0%) for males and 30 to 34 minutes (387 commuters, 23.3%) for females.
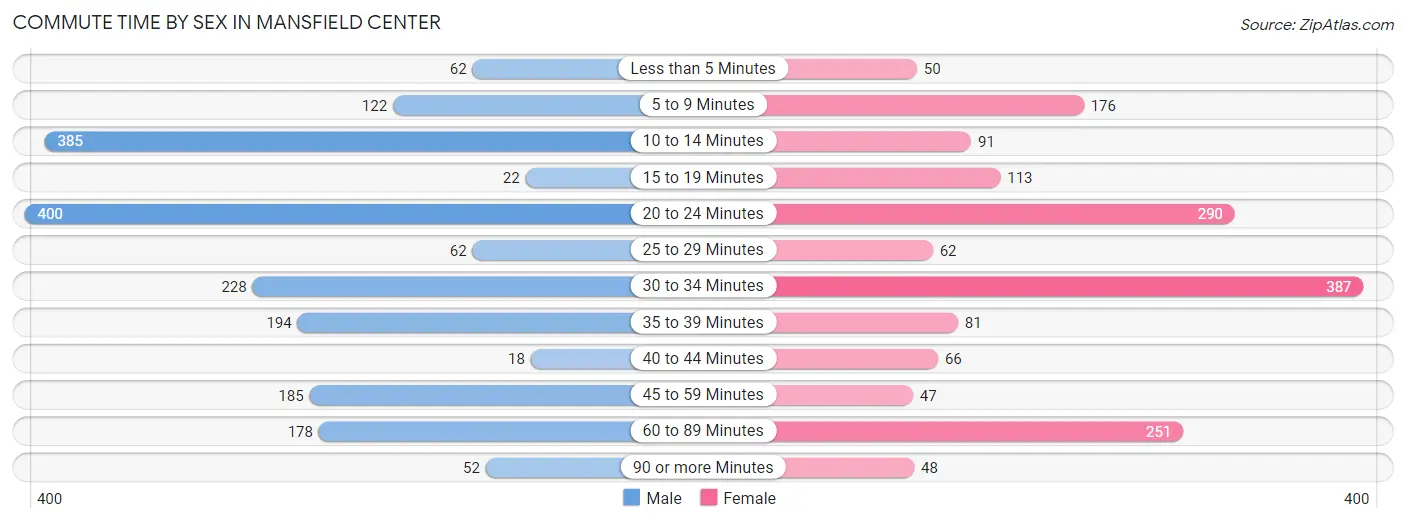
| Commute Time | Male | Female |
| Less than 5 Minutes | 62 (3.3%) | 50 (3.0%) |
| 5 to 9 Minutes | 122 (6.4%) | 176 (10.6%) |
| 10 to 14 Minutes | 385 (20.2%) | 91 (5.5%) |
| 15 to 19 Minutes | 22 (1.1%) | 113 (6.8%) |
| 20 to 24 Minutes | 400 (21.0%) | 290 (17.4%) |
| 25 to 29 Minutes | 62 (3.3%) | 62 (3.7%) |
| 30 to 34 Minutes | 228 (11.9%) | 387 (23.3%) |
| 35 to 39 Minutes | 194 (10.2%) | 81 (4.9%) |
| 40 to 44 Minutes | 18 (0.9%) | 66 (4.0%) |
| 45 to 59 Minutes | 185 (9.7%) | 47 (2.8%) |
| 60 to 89 Minutes | 178 (9.3%) | 251 (15.1%) |
| 90 or more Minutes | 52 (2.7%) | 48 (2.9%) |
Time of Departure to Work by Sex in Mansfield Center
The most frequent times of departure to work in Mansfield Center are 8:00 AM to 8:29 AM (293, 15.4%) for males and 7:00 AM to 7:29 AM (356, 21.4%) for females.
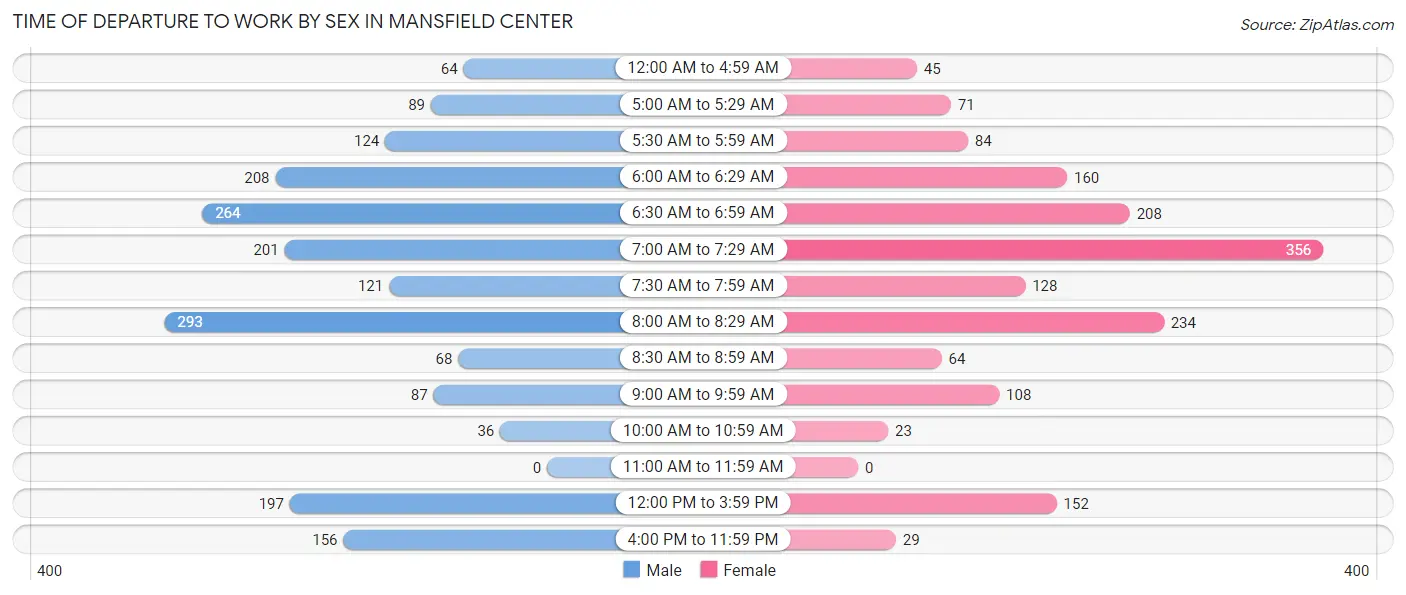
| Time of Departure | Male | Female |
| 12:00 AM to 4:59 AM | 64 (3.4%) | 45 (2.7%) |
| 5:00 AM to 5:29 AM | 89 (4.7%) | 71 (4.3%) |
| 5:30 AM to 5:59 AM | 124 (6.5%) | 84 (5.1%) |
| 6:00 AM to 6:29 AM | 208 (10.9%) | 160 (9.6%) |
| 6:30 AM to 6:59 AM | 264 (13.8%) | 208 (12.5%) |
| 7:00 AM to 7:29 AM | 201 (10.5%) | 356 (21.4%) |
| 7:30 AM to 7:59 AM | 121 (6.3%) | 128 (7.7%) |
| 8:00 AM to 8:29 AM | 293 (15.4%) | 234 (14.1%) |
| 8:30 AM to 8:59 AM | 68 (3.6%) | 64 (3.8%) |
| 9:00 AM to 9:59 AM | 87 (4.6%) | 108 (6.5%) |
| 10:00 AM to 10:59 AM | 36 (1.9%) | 23 (1.4%) |
| 11:00 AM to 11:59 AM | 0 (0.0%) | 0 (0.0%) |
| 12:00 PM to 3:59 PM | 197 (10.3%) | 152 (9.1%) |
| 4:00 PM to 11:59 PM | 156 (8.2%) | 29 (1.7%) |
| Total | 1,908 (100.0%) | 1,662 (100.0%) |
Housing Occupancy in Mansfield Center
Occupancy by Ownership in Mansfield Center
Of the total 3,259 dwellings in Mansfield Center, owner-occupied units account for 1,985 (60.9%), while renter-occupied units make up 1,274 (39.1%).
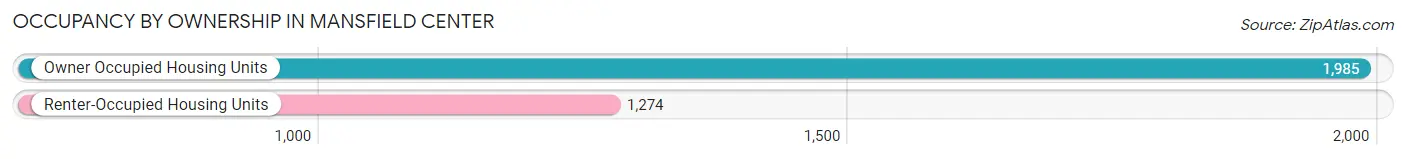
| Occupancy | # Housing Units | % Housing Units |
| Owner Occupied Housing Units | 1,985 | 60.9% |
| Renter-Occupied Housing Units | 1,274 | 39.1% |
| Total Occupied Housing Units | 3,259 | 100.0% |
Occupancy by Household Size in Mansfield Center
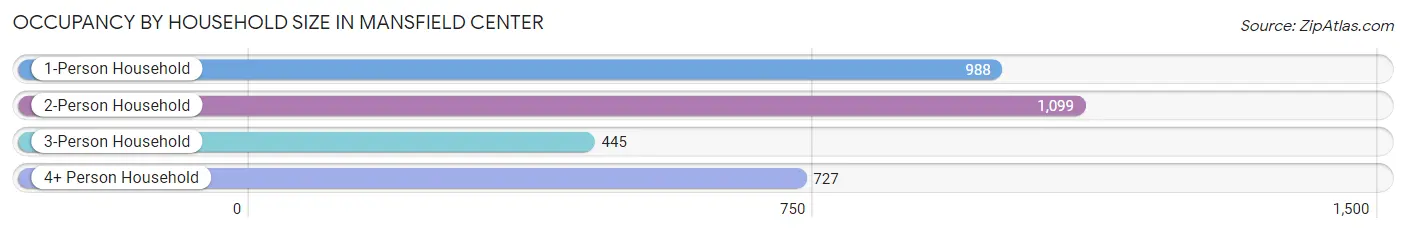
| Household Size | # Housing Units | % Housing Units |
| 1-Person Household | 988 | 30.3% |
| 2-Person Household | 1,099 | 33.7% |
| 3-Person Household | 445 | 13.7% |
| 4+ Person Household | 727 | 22.3% |
| Total Housing Units | 3,259 | 100.0% |
Occupancy by Ownership by Household Size in Mansfield Center
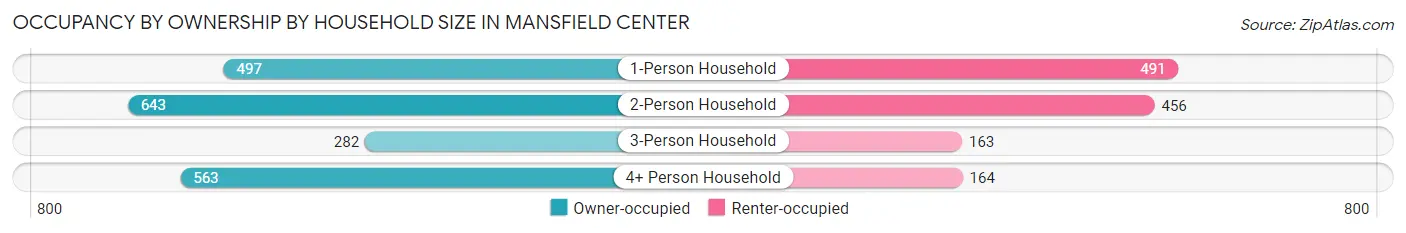
| Household Size | Owner-occupied | Renter-occupied |
| 1-Person Household | 497 (50.3%) | 491 (49.7%) |
| 2-Person Household | 643 (58.5%) | 456 (41.5%) |
| 3-Person Household | 282 (63.4%) | 163 (36.6%) |
| 4+ Person Household | 563 (77.4%) | 164 (22.6%) |
| Total Housing Units | 1,985 (60.9%) | 1,274 (39.1%) |
Occupancy by Educational Attainment in Mansfield Center
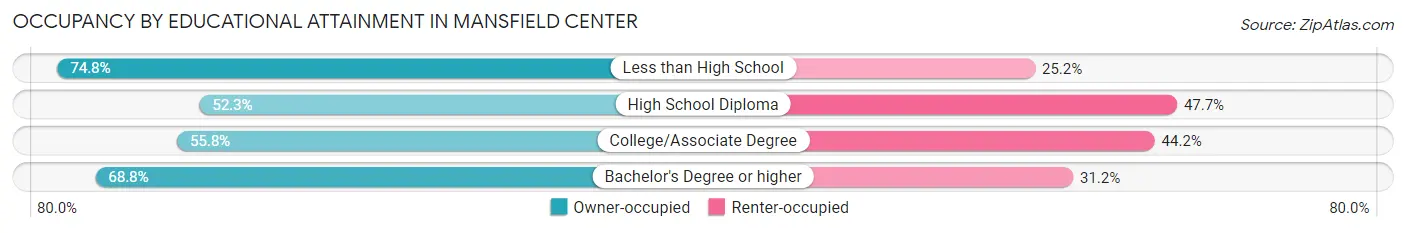
| Household Size | Owner-occupied | Renter-occupied |
| Less than High School | 92 (74.8%) | 31 (25.2%) |
| High School Diploma | 411 (52.3%) | 375 (47.7%) |
| College/Associate Degree | 579 (55.8%) | 458 (44.2%) |
| Bachelor's Degree or higher | 903 (68.8%) | 410 (31.2%) |
Occupancy by Age of Householder in Mansfield Center
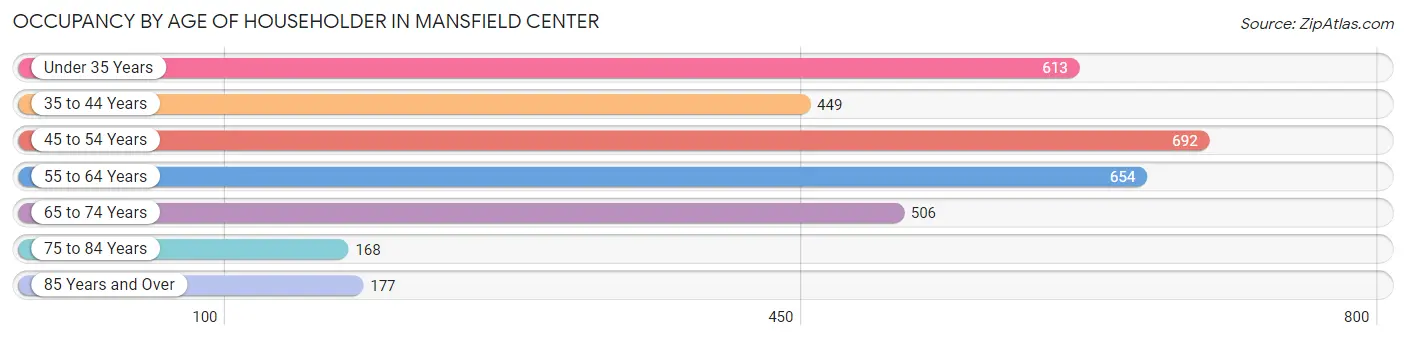
| Age Bracket | # Households | % Households |
| Under 35 Years | 613 | 18.8% |
| 35 to 44 Years | 449 | 13.8% |
| 45 to 54 Years | 692 | 21.2% |
| 55 to 64 Years | 654 | 20.1% |
| 65 to 74 Years | 506 | 15.5% |
| 75 to 84 Years | 168 | 5.1% |
| 85 Years and Over | 177 | 5.4% |
| Total | 3,259 | 100.0% |
Housing Finances in Mansfield Center
Median Income by Occupancy in Mansfield Center
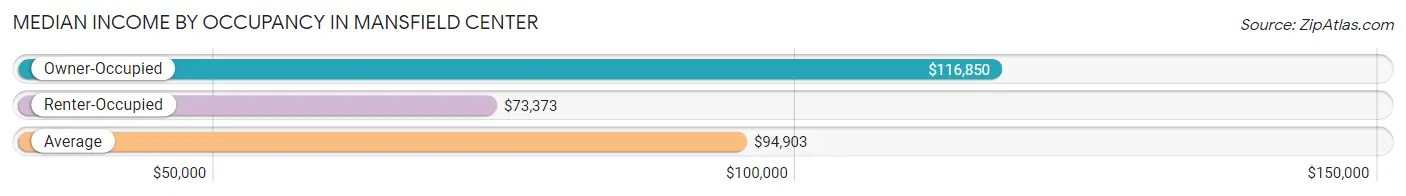
| Occupancy Type | # Households | Median Income |
| Owner-Occupied | 1,985 (60.9%) | $116,850 |
| Renter-Occupied | 1,274 (39.1%) | $73,373 |
| Average | 3,259 (100.0%) | $94,903 |
Occupancy by Householder Income Bracket in Mansfield Center
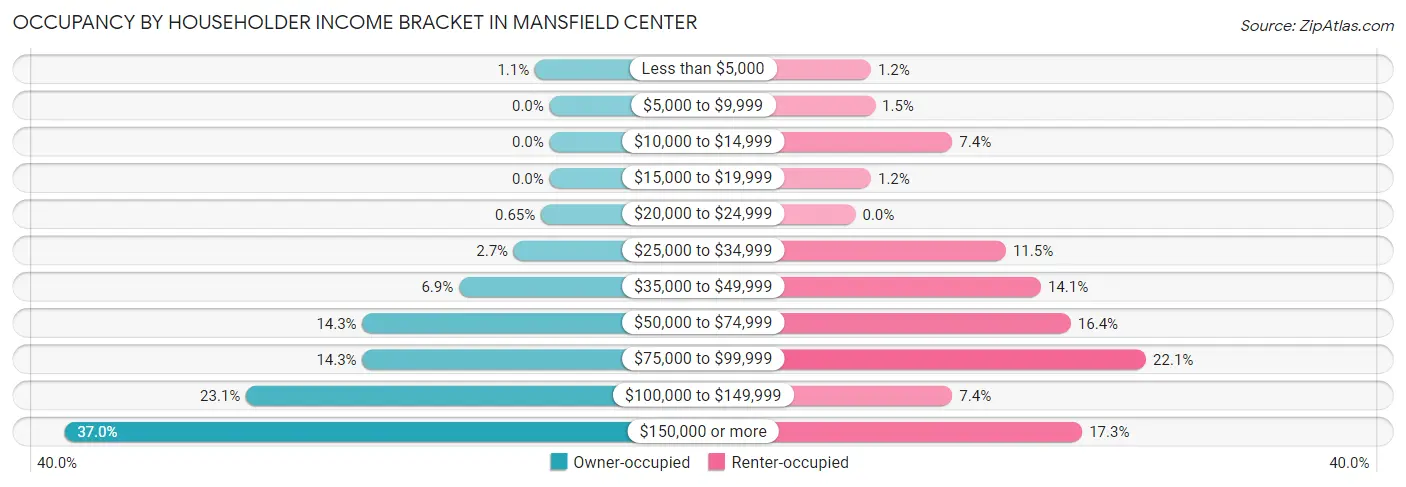
| Income Bracket | Owner-occupied | Renter-occupied |
| Less than $5,000 | 22 (1.1%) | 15 (1.2%) |
| $5,000 to $9,999 | 0 (0.0%) | 19 (1.5%) |
| $10,000 to $14,999 | 0 (0.0%) | 94 (7.4%) |
| $15,000 to $19,999 | 0 (0.0%) | 15 (1.2%) |
| $20,000 to $24,999 | 13 (0.6%) | 0 (0.0%) |
| $25,000 to $34,999 | 54 (2.7%) | 146 (11.5%) |
| $35,000 to $49,999 | 137 (6.9%) | 180 (14.1%) |
| $50,000 to $74,999 | 283 (14.3%) | 209 (16.4%) |
| $75,000 to $99,999 | 283 (14.3%) | 282 (22.1%) |
| $100,000 to $149,999 | 459 (23.1%) | 94 (7.4%) |
| $150,000 or more | 734 (37.0%) | 220 (17.3%) |
| Total | 1,985 (100.0%) | 1,274 (100.0%) |
Monthly Housing Cost Tiers in Mansfield Center
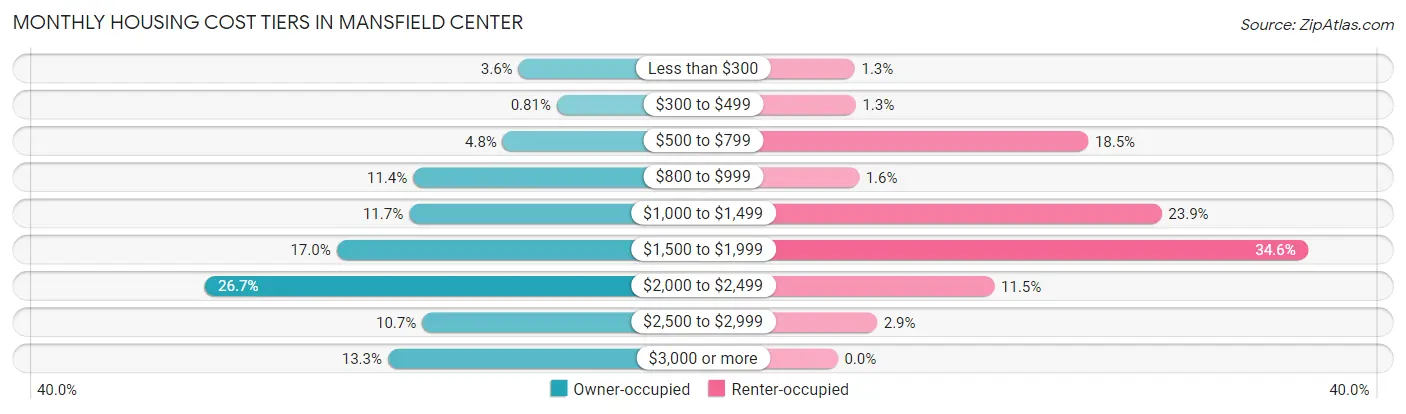
| Monthly Cost | Owner-occupied | Renter-occupied |
| Less than $300 | 72 (3.6%) | 16 (1.3%) |
| $300 to $499 | 16 (0.8%) | 17 (1.3%) |
| $500 to $799 | 95 (4.8%) | 235 (18.4%) |
| $800 to $999 | 226 (11.4%) | 20 (1.6%) |
| $1,000 to $1,499 | 232 (11.7%) | 304 (23.9%) |
| $1,500 to $1,999 | 338 (17.0%) | 441 (34.6%) |
| $2,000 to $2,499 | 530 (26.7%) | 147 (11.5%) |
| $2,500 to $2,999 | 213 (10.7%) | 37 (2.9%) |
| $3,000 or more | 263 (13.3%) | 0 (0.0%) |
| Total | 1,985 (100.0%) | 1,274 (100.0%) |
Physical Housing Characteristics in Mansfield Center
Housing Structures in Mansfield Center
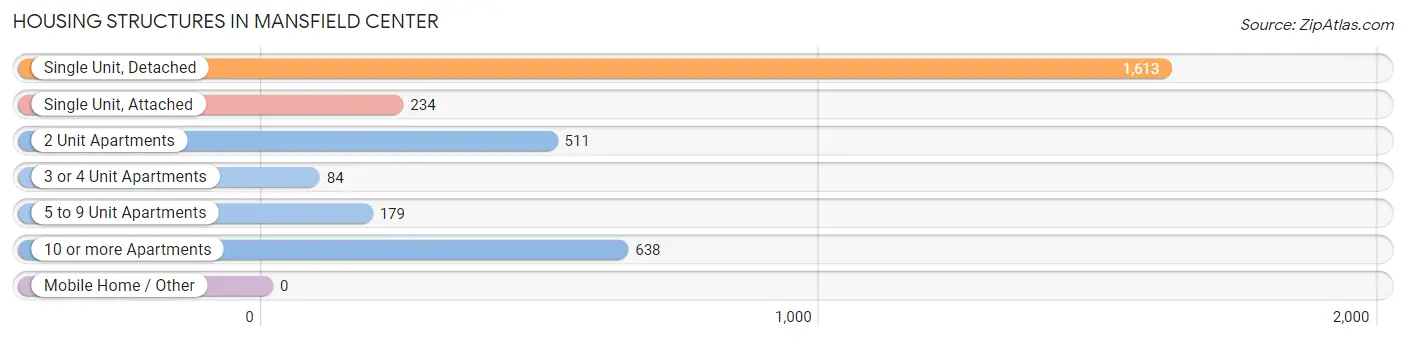
| Structure Type | # Housing Units | % Housing Units |
| Single Unit, Detached | 1,613 | 49.5% |
| Single Unit, Attached | 234 | 7.2% |
| 2 Unit Apartments | 511 | 15.7% |
| 3 or 4 Unit Apartments | 84 | 2.6% |
| 5 to 9 Unit Apartments | 179 | 5.5% |
| 10 or more Apartments | 638 | 19.6% |
| Mobile Home / Other | 0 | 0.0% |
| Total | 3,259 | 100.0% |
Housing Structures by Occupancy in Mansfield Center
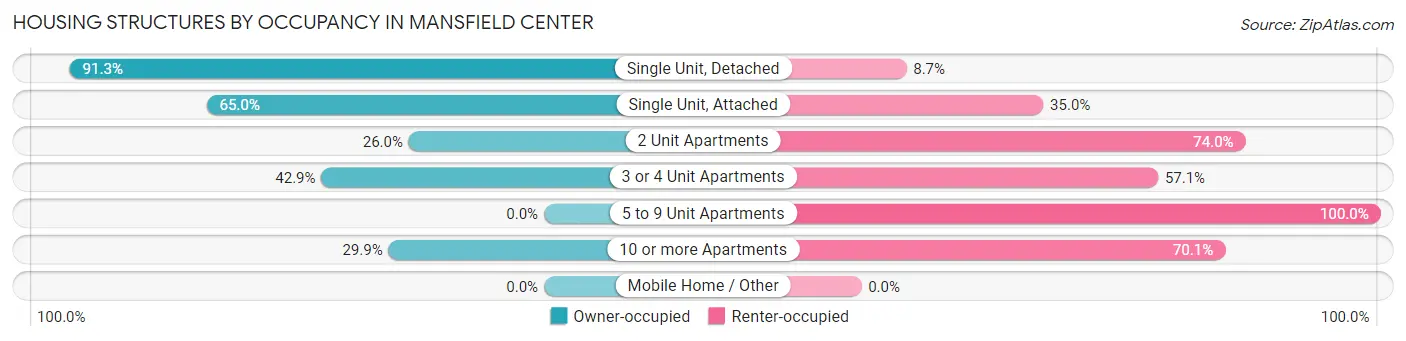
| Structure Type | Owner-occupied | Renter-occupied |
| Single Unit, Detached | 1,473 (91.3%) | 140 (8.7%) |
| Single Unit, Attached | 152 (65.0%) | 82 (35.0%) |
| 2 Unit Apartments | 133 (26.0%) | 378 (74.0%) |
| 3 or 4 Unit Apartments | 36 (42.9%) | 48 (57.1%) |
| 5 to 9 Unit Apartments | 0 (0.0%) | 179 (100.0%) |
| 10 or more Apartments | 191 (29.9%) | 447 (70.1%) |
| Mobile Home / Other | 0 (0.0%) | 0 (0.0%) |
| Total | 1,985 (60.9%) | 1,274 (39.1%) |
Housing Structures by Number of Rooms in Mansfield Center
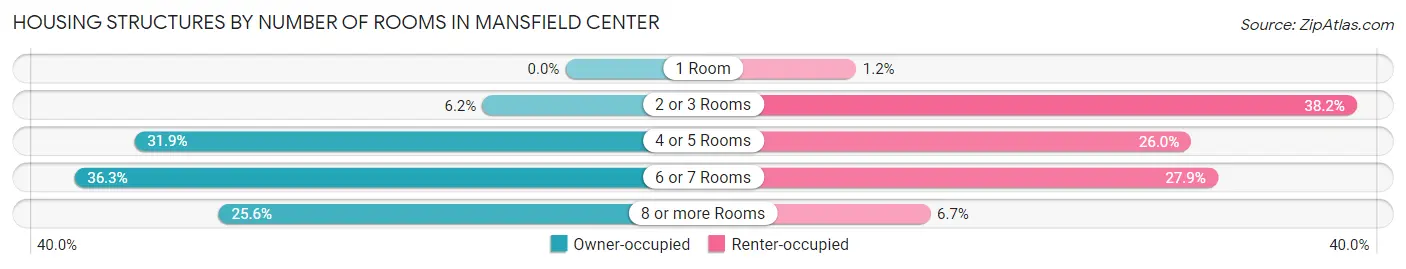
| Number of Rooms | Owner-occupied | Renter-occupied |
| 1 Room | 0 (0.0%) | 15 (1.2%) |
| 2 or 3 Rooms | 122 (6.1%) | 487 (38.2%) |
| 4 or 5 Rooms | 633 (31.9%) | 331 (26.0%) |
| 6 or 7 Rooms | 721 (36.3%) | 356 (27.9%) |
| 8 or more Rooms | 509 (25.6%) | 85 (6.7%) |
| Total | 1,985 (100.0%) | 1,274 (100.0%) |
Housing Structure by Heating Type in Mansfield Center
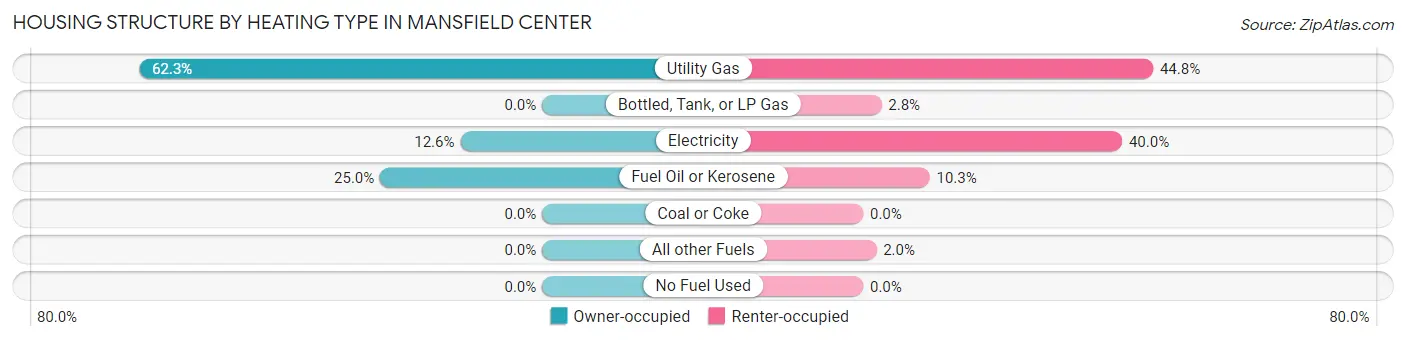
| Heating Type | Owner-occupied | Renter-occupied |
| Utility Gas | 1,237 (62.3%) | 571 (44.8%) |
| Bottled, Tank, or LP Gas | 0 (0.0%) | 36 (2.8%) |
| Electricity | 251 (12.6%) | 510 (40.0%) |
| Fuel Oil or Kerosene | 497 (25.0%) | 131 (10.3%) |
| Coal or Coke | 0 (0.0%) | 0 (0.0%) |
| All other Fuels | 0 (0.0%) | 26 (2.0%) |
| No Fuel Used | 0 (0.0%) | 0 (0.0%) |
| Total | 1,985 (100.0%) | 1,274 (100.0%) |
Household Vehicle Usage in Mansfield Center
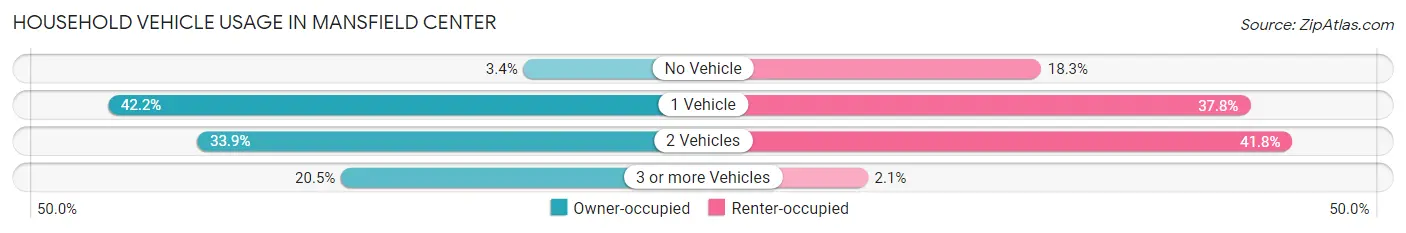
| Vehicles per Household | Owner-occupied | Renter-occupied |
| No Vehicle | 68 (3.4%) | 233 (18.3%) |
| 1 Vehicle | 838 (42.2%) | 482 (37.8%) |
| 2 Vehicles | 673 (33.9%) | 532 (41.8%) |
| 3 or more Vehicles | 406 (20.4%) | 27 (2.1%) |
| Total | 1,985 (100.0%) | 1,274 (100.0%) |
Real Estate & Mortgages in Mansfield Center
Real Estate and Mortgage Overview in Mansfield Center
| Characteristic | Without Mortgage | With Mortgage |
| Housing Units | 576 | 1,409 |
| Median Property Value | $400,900 | $454,600 |
| Median Household Income | $86,500 | $572 |
| Monthly Housing Costs | $874 | $263 |
| Real Estate Taxes | $5,907 | $0 |
Property Value by Mortgage Status in Mansfield Center
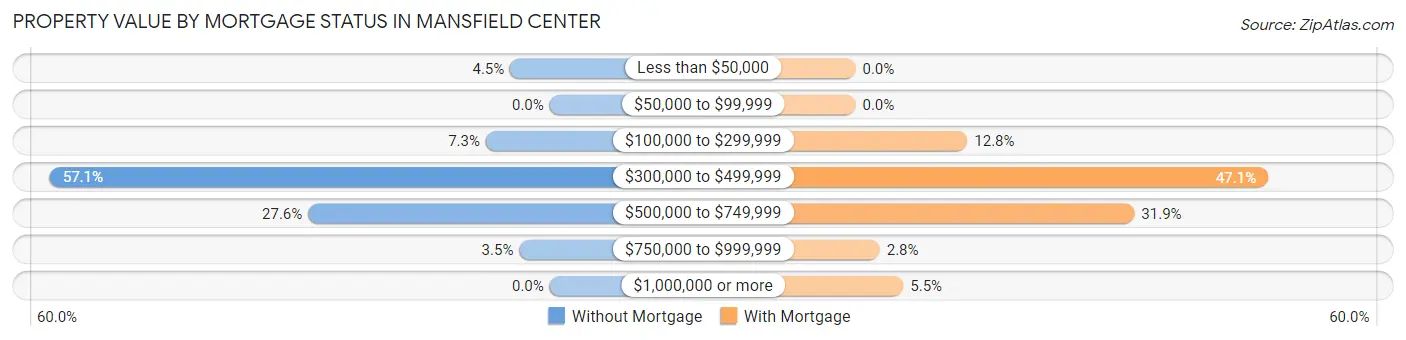
| Property Value | Without Mortgage | With Mortgage |
| Less than $50,000 | 26 (4.5%) | 0 (0.0%) |
| $50,000 to $99,999 | 0 (0.0%) | 0 (0.0%) |
| $100,000 to $299,999 | 42 (7.3%) | 180 (12.8%) |
| $300,000 to $499,999 | 329 (57.1%) | 664 (47.1%) |
| $500,000 to $749,999 | 159 (27.6%) | 449 (31.9%) |
| $750,000 to $999,999 | 20 (3.5%) | 39 (2.8%) |
| $1,000,000 or more | 0 (0.0%) | 77 (5.5%) |
| Total | 576 (100.0%) | 1,409 (100.0%) |
Household Income by Mortgage Status in Mansfield Center
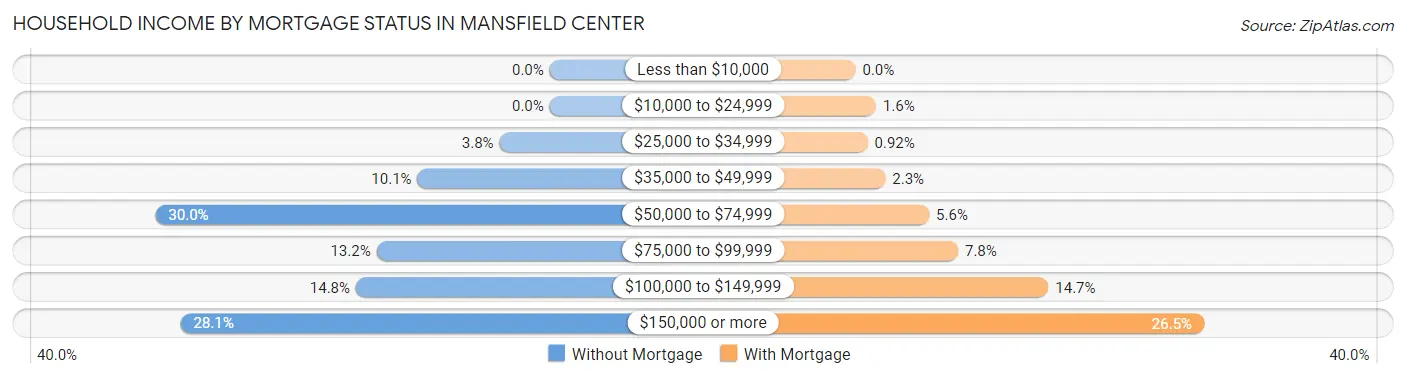
| Household Income | Without Mortgage | With Mortgage |
| Less than $10,000 | 0 (0.0%) | 0 (0.0%) |
| $10,000 to $24,999 | 0 (0.0%) | 22 (1.6%) |
| $25,000 to $34,999 | 22 (3.8%) | 13 (0.9%) |
| $35,000 to $49,999 | 58 (10.1%) | 32 (2.3%) |
| $50,000 to $74,999 | 173 (30.0%) | 79 (5.6%) |
| $75,000 to $99,999 | 76 (13.2%) | 110 (7.8%) |
| $100,000 to $149,999 | 85 (14.8%) | 207 (14.7%) |
| $150,000 or more | 162 (28.1%) | 374 (26.5%) |
| Total | 576 (100.0%) | 1,409 (100.0%) |
Property Value to Household Income Ratio in Mansfield Center
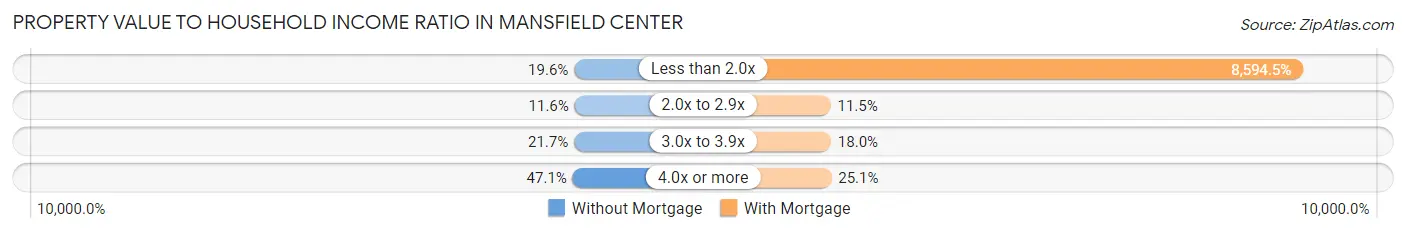
| Value-to-Income Ratio | Without Mortgage | With Mortgage |
| Less than 2.0x | 113 (19.6%) | 121,097 (8,594.5%) |
| 2.0x to 2.9x | 67 (11.6%) | 162 (11.5%) |
| 3.0x to 3.9x | 125 (21.7%) | 253 (18.0%) |
| 4.0x or more | 271 (47.0%) | 353 (25.1%) |
| Total | 576 (100.0%) | 1,409 (100.0%) |
Real Estate Taxes by Mortgage Status in Mansfield Center
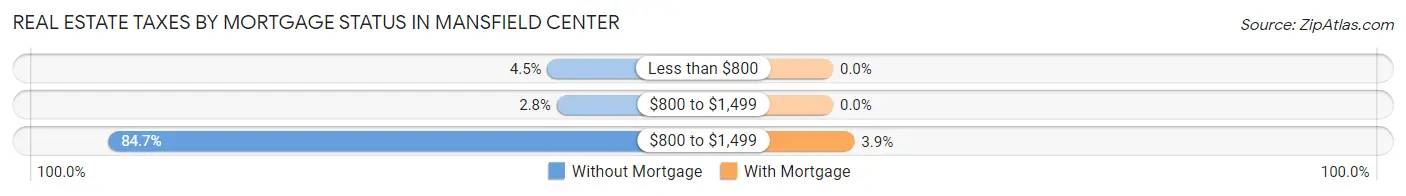
| Property Taxes | Without Mortgage | With Mortgage |
| Less than $800 | 26 (4.5%) | 0 (0.0%) |
| $800 to $1,499 | 16 (2.8%) | 0 (0.0%) |
| $800 to $1,499 | 488 (84.7%) | 55 (3.9%) |
| Total | 576 (100.0%) | 1,409 (100.0%) |
Health & Disability in Mansfield Center
Health Insurance Coverage by Age in Mansfield Center
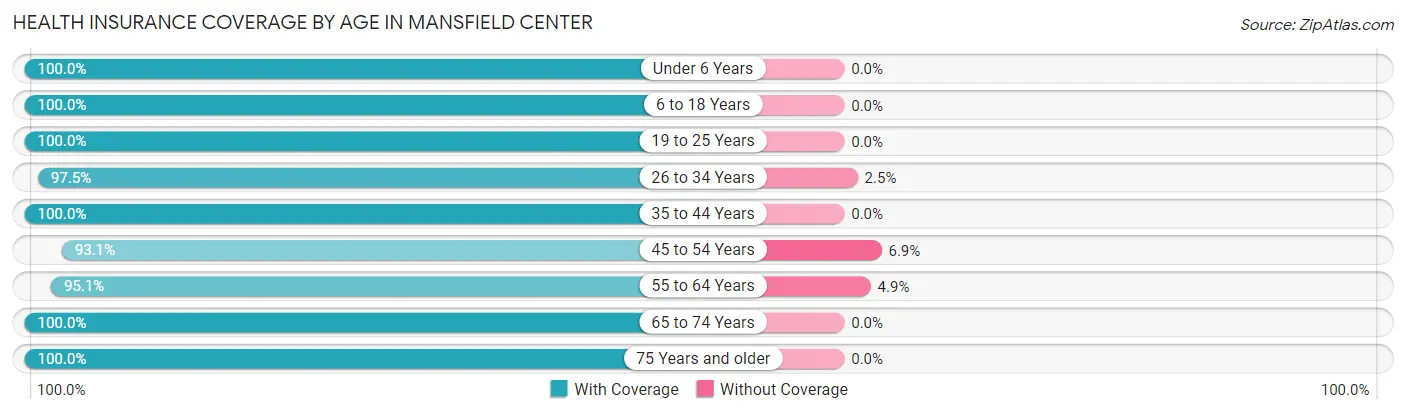
| Age Bracket | With Coverage | Without Coverage |
| Under 6 Years | 336 (100.0%) | 0 (0.0%) |
| 6 to 18 Years | 1,299 (100.0%) | 0 (0.0%) |
| 19 to 25 Years | 368 (100.0%) | 0 (0.0%) |
| 26 to 34 Years | 1,329 (97.5%) | 34 (2.5%) |
| 35 to 44 Years | 941 (100.0%) | 0 (0.0%) |
| 45 to 54 Years | 1,099 (93.1%) | 82 (6.9%) |
| 55 to 64 Years | 927 (95.1%) | 48 (4.9%) |
| 65 to 74 Years | 736 (100.0%) | 0 (0.0%) |
| 75 Years and older | 467 (100.0%) | 0 (0.0%) |
| Total | 7,502 (97.9%) | 164 (2.1%) |
Health Insurance Coverage by Citizenship Status in Mansfield Center
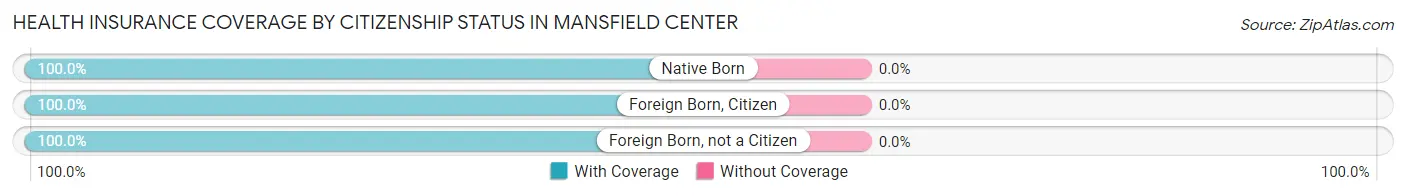
| Citizenship Status | With Coverage | Without Coverage |
| Native Born | 336 (100.0%) | 0 (0.0%) |
| Foreign Born, Citizen | 1,299 (100.0%) | 0 (0.0%) |
| Foreign Born, not a Citizen | 368 (100.0%) | 0 (0.0%) |
Health Insurance Coverage by Household Income in Mansfield Center
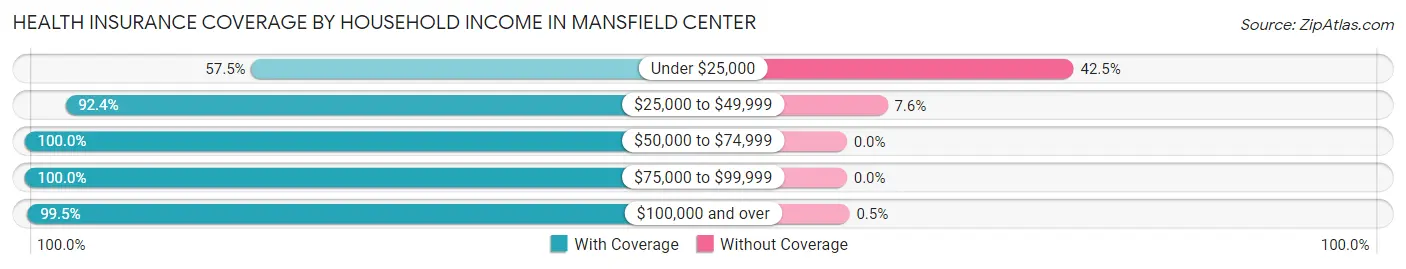
| Household Income | With Coverage | Without Coverage |
| Under $25,000 | 111 (57.5%) | 82 (42.5%) |
| $25,000 to $49,999 | 740 (92.4%) | 61 (7.6%) |
| $50,000 to $74,999 | 726 (100.0%) | 0 (0.0%) |
| $75,000 to $99,999 | 1,702 (100.0%) | 0 (0.0%) |
| $100,000 and over | 4,208 (99.5%) | 21 (0.5%) |
Public vs Private Health Insurance Coverage by Age in Mansfield Center
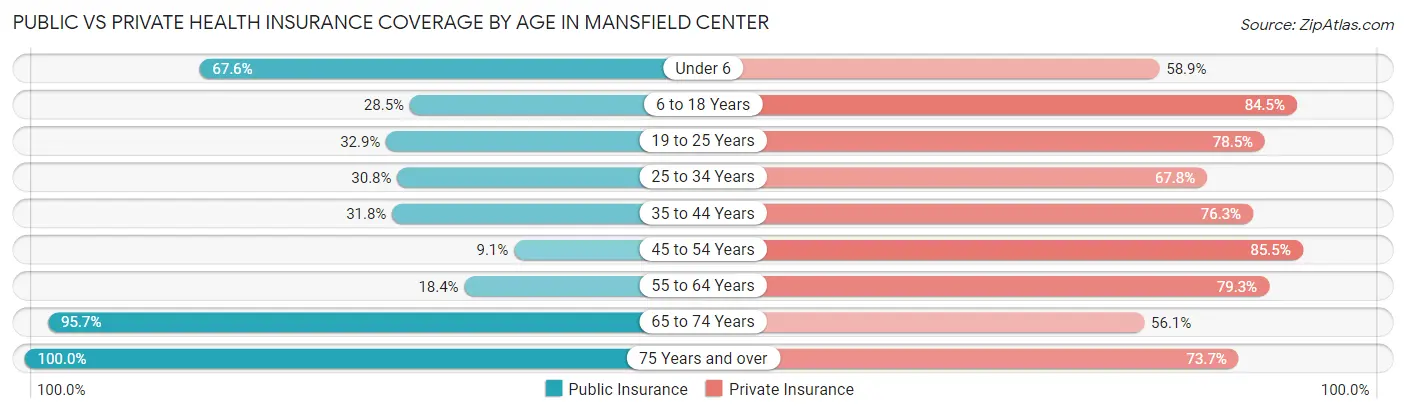
| Age Bracket | Public Insurance | Private Insurance |
| Under 6 | 227 (67.6%) | 198 (58.9%) |
| 6 to 18 Years | 370 (28.5%) | 1,097 (84.5%) |
| 19 to 25 Years | 121 (32.9%) | 289 (78.5%) |
| 25 to 34 Years | 420 (30.8%) | 924 (67.8%) |
| 35 to 44 Years | 299 (31.8%) | 718 (76.3%) |
| 45 to 54 Years | 108 (9.1%) | 1,010 (85.5%) |
| 55 to 64 Years | 179 (18.4%) | 773 (79.3%) |
| 65 to 74 Years | 704 (95.7%) | 413 (56.1%) |
| 75 Years and over | 467 (100.0%) | 344 (73.7%) |
| Total | 2,895 (37.8%) | 5,766 (75.2%) |
Disability Status by Sex by Age in Mansfield Center
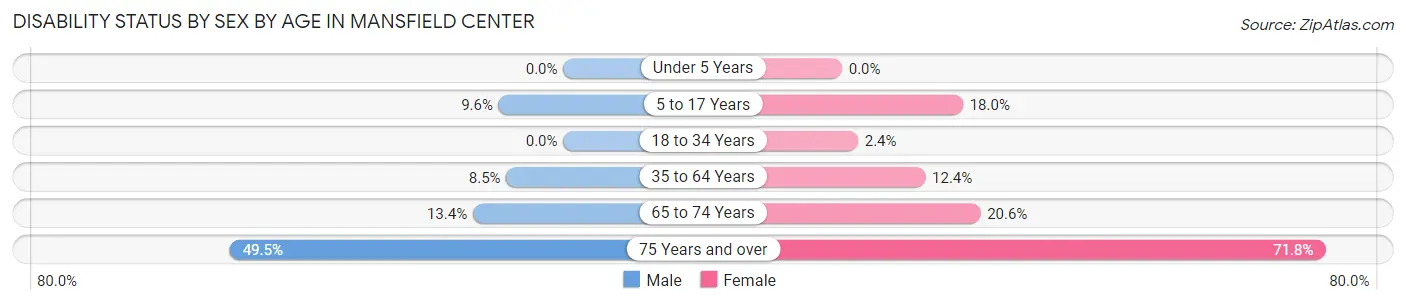
| Age Bracket | Male | Female |
| Under 5 Years | 0 (0.0%) | 0 (0.0%) |
| 5 to 17 Years | 60 (9.6%) | 102 (18.0%) |
| 18 to 34 Years | 0 (0.0%) | 22 (2.4%) |
| 35 to 64 Years | 136 (8.5%) | 184 (12.4%) |
| 65 to 74 Years | 40 (13.4%) | 90 (20.5%) |
| 75 Years and over | 54 (49.5%) | 257 (71.8%) |
Disability Class by Sex by Age in Mansfield Center
Disability Class: Hearing Difficulty
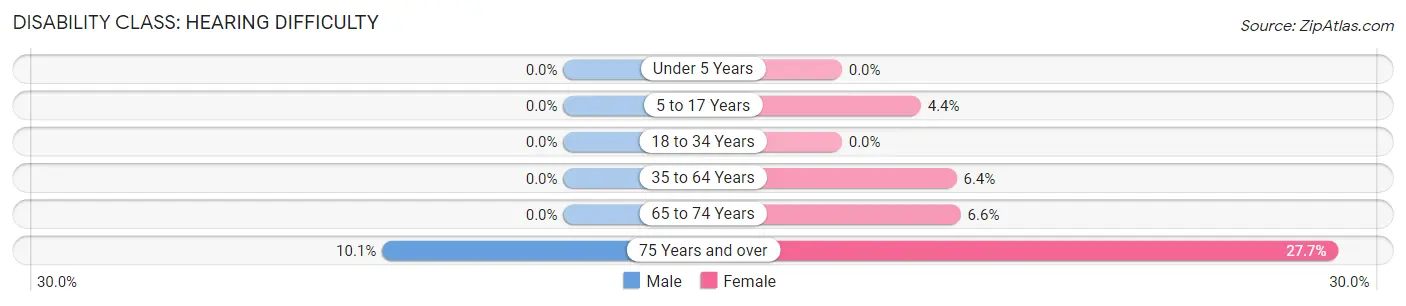
| Age Bracket | Male | Female |
| Under 5 Years | 0 (0.0%) | 0 (0.0%) |
| 5 to 17 Years | 0 (0.0%) | 25 (4.4%) |
| 18 to 34 Years | 0 (0.0%) | 0 (0.0%) |
| 35 to 64 Years | 0 (0.0%) | 95 (6.4%) |
| 65 to 74 Years | 0 (0.0%) | 29 (6.6%) |
| 75 Years and over | 11 (10.1%) | 99 (27.7%) |
Disability Class: Vision Difficulty
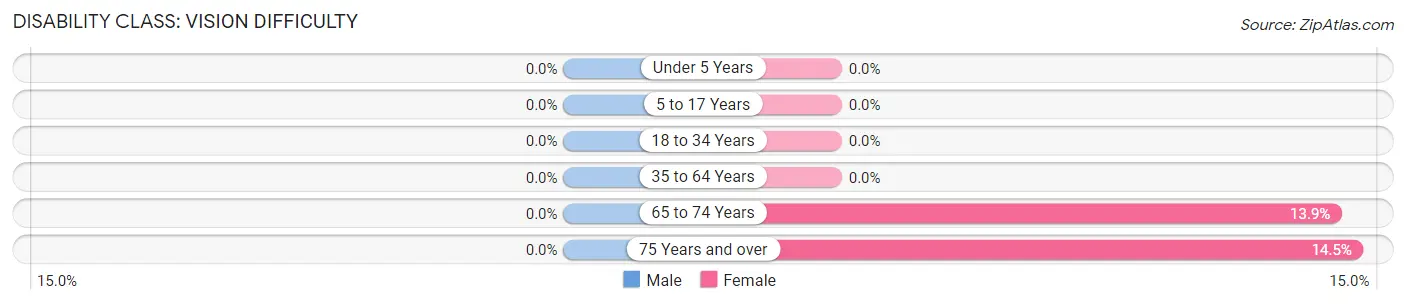
| Age Bracket | Male | Female |
| Under 5 Years | 0 (0.0%) | 0 (0.0%) |
| 5 to 17 Years | 0 (0.0%) | 0 (0.0%) |
| 18 to 34 Years | 0 (0.0%) | 0 (0.0%) |
| 35 to 64 Years | 0 (0.0%) | 0 (0.0%) |
| 65 to 74 Years | 0 (0.0%) | 61 (13.9%) |
| 75 Years and over | 0 (0.0%) | 52 (14.5%) |
Disability Class: Cognitive Difficulty
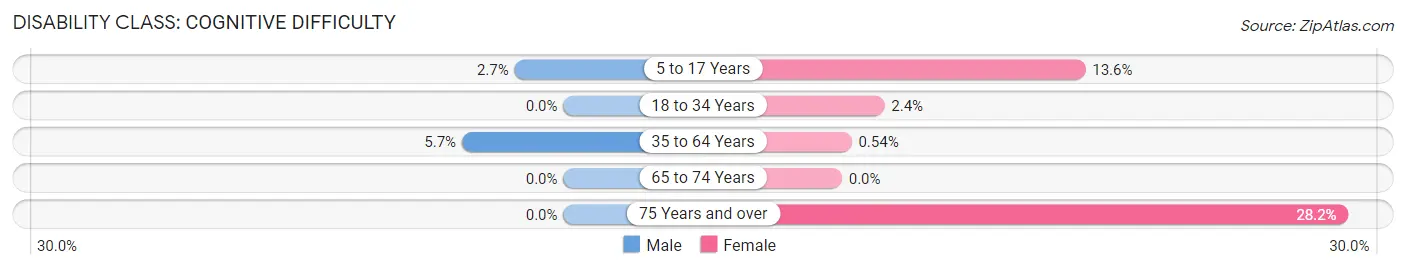
| Age Bracket | Male | Female |
| 5 to 17 Years | 17 (2.7%) | 77 (13.6%) |
| 18 to 34 Years | 0 (0.0%) | 22 (2.4%) |
| 35 to 64 Years | 91 (5.7%) | 8 (0.5%) |
| 65 to 74 Years | 0 (0.0%) | 0 (0.0%) |
| 75 Years and over | 0 (0.0%) | 101 (28.2%) |
Disability Class: Ambulatory Difficulty
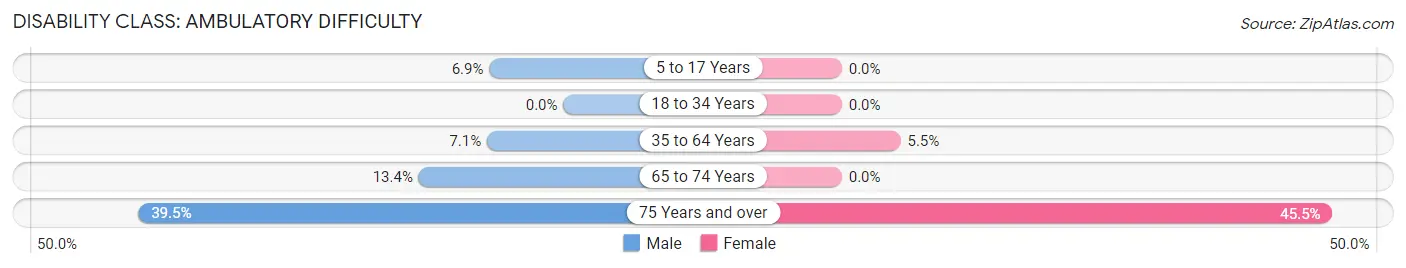
| Age Bracket | Male | Female |
| 5 to 17 Years | 43 (6.9%) | 0 (0.0%) |
| 18 to 34 Years | 0 (0.0%) | 0 (0.0%) |
| 35 to 64 Years | 114 (7.1%) | 81 (5.4%) |
| 65 to 74 Years | 40 (13.4%) | 0 (0.0%) |
| 75 Years and over | 43 (39.5%) | 163 (45.5%) |
Disability Class: Self-Care Difficulty
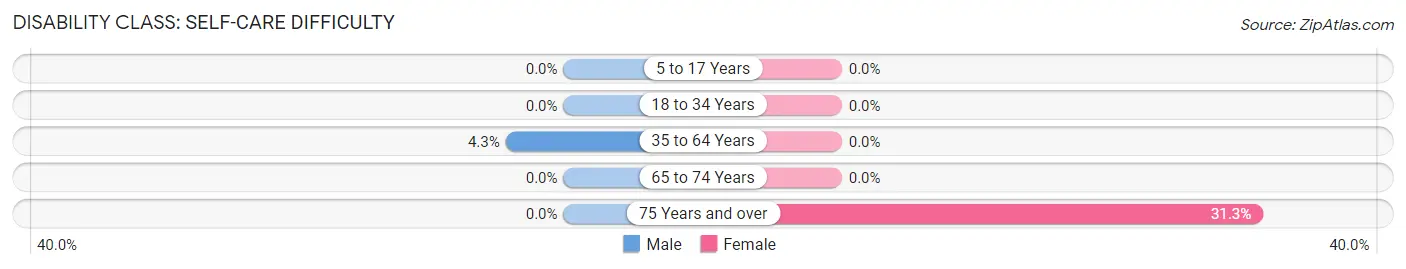
| Age Bracket | Male | Female |
| 5 to 17 Years | 0 (0.0%) | 0 (0.0%) |
| 18 to 34 Years | 0 (0.0%) | 0 (0.0%) |
| 35 to 64 Years | 69 (4.3%) | 0 (0.0%) |
| 65 to 74 Years | 0 (0.0%) | 0 (0.0%) |
| 75 Years and over | 0 (0.0%) | 112 (31.3%) |
Technology Access in Mansfield Center
Computing Device Access in Mansfield Center
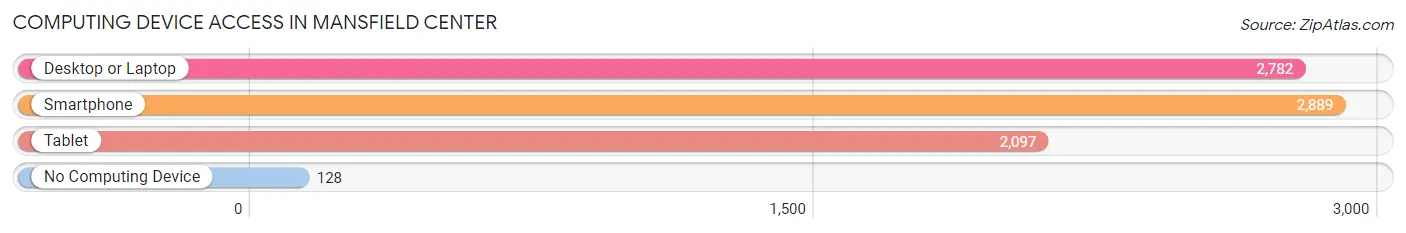
| Device Type | # Households | % Households |
| Desktop or Laptop | 2,782 | 85.4% |
| Smartphone | 2,889 | 88.6% |
| Tablet | 2,097 | 64.3% |
| No Computing Device | 128 | 3.9% |
| Total | 3,259 | 100.0% |
Internet Access in Mansfield Center
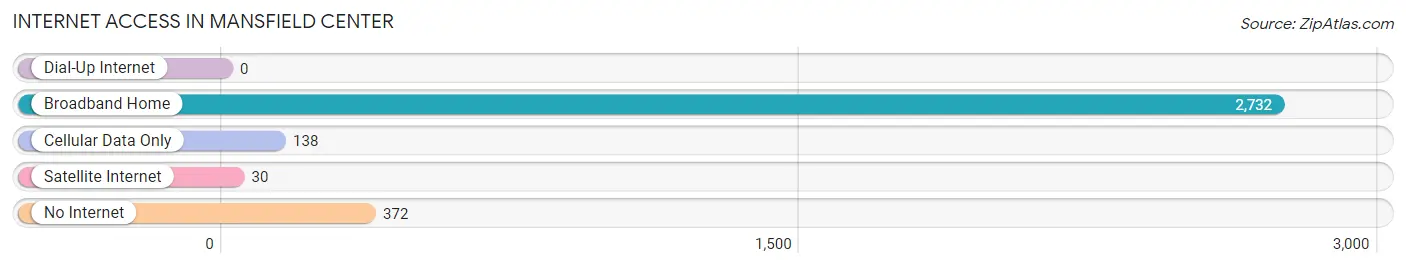
| Internet Type | # Households | % Households |
| Dial-Up Internet | 0 | 0.0% |
| Broadband Home | 2,732 | 83.8% |
| Cellular Data Only | 138 | 4.2% |
| Satellite Internet | 30 | 0.9% |
| No Internet | 372 | 11.4% |
| Total | 3,259 | 100.0% |
Mansfield Center Summary
Mansfield Center is a small town located in Bristol County, Massachusetts. It is situated in the southeastern part of the state, about 20 miles south of Boston. The town has a population of approximately 8,000 people and covers an area of 8.3 square miles.
History
Mansfield Center was first settled in 1658 by a group of settlers from Rehoboth, Massachusetts. The town was originally known as “Mansfield” and was incorporated in 1775. The town was named after William Mansfield, a prominent local landowner.
In the late 19th century, Mansfield Center was a thriving agricultural community. The town was home to several farms, including the Mansfield Farm, which was owned by the Mansfield family. The town also had several mills, including a grist mill, a saw mill, and a paper mill.
In the early 20th century, the town began to experience a period of growth and development. The town was home to several factories, including the Mansfield Shoe Company, which was founded in 1910. The town also had several stores, including a general store, a hardware store, and a grocery store.
Geography
Mansfield Center is located in southeastern Massachusetts, about 20 miles south of Boston. The town is situated in the Taunton River Valley, which is part of the larger Narragansett Bay watershed. The town is bordered by Norton to the north, Easton to the east, Foxborough to the south, and Attleboro to the west.
The town is mostly flat, with some rolling hills in the northern part of town. The highest point in town is located at the intersection of East Street and North Street, which is approximately 200 feet above sea level. The town is located in a temperate climate zone, with hot summers and cold winters.
Economy
Mansfield Center is a primarily residential community, with a small commercial sector. The town is home to several small businesses, including restaurants, retail stores, and professional services. The town is also home to several industrial parks, which are home to a variety of manufacturing and technology companies.
The town is also home to several educational institutions, including Mansfield High School, Mansfield Middle School, and Mansfield Elementary School. The town is also home to several parks and recreational facilities, including the Mansfield Town Common, which is a popular spot for outdoor activities.
Demographics
As of the 2010 census, the population of Mansfield Center was 8,073. The racial makeup of the town was 94.3% White, 1.7% African American, 0.3% Native American, 1.2% Asian, 0.1% Pacific Islander, 1.2% from other races, and 1.4% from two or more races. Hispanic or Latino of any race were 3.2% of the population.
The median household income in Mansfield Center was $76,944, and the median family income was $90,917. The per capita income for the town was $35,945. About 4.2% of families and 5.3% of the population were below the poverty line, including 6.2% of those under age 18 and 4.2% of those age 65 or over.
Common Questions
What is Per Capita Income in Mansfield Center?
Per Capita income in Mansfield Center is $52,452.
What is the Median Family Income in Mansfield Center?
Median Family Income in Mansfield Center is $119,167.
What is the Median Household income in Mansfield Center?
Median Household Income in Mansfield Center is $94,903.
What is Income or Wage Gap in Mansfield Center?
Income or Wage Gap in Mansfield Center is 40.1%.
Women in Mansfield Center earn 59.9 cents for every dollar earned by a man.
What is Inequality or Gini Index in Mansfield Center?
Inequality or Gini Index in Mansfield Center is 0.41.
What is the Total Population of Mansfield Center?
Total Population of Mansfield Center is 7,690.
What is the Total Male Population of Mansfield Center?
Total Male Population of Mansfield Center is 3,734.
What is the Total Female Population of Mansfield Center?
Total Female Population of Mansfield Center is 3,956.
What is the Ratio of Males per 100 Females in Mansfield Center?
There are 94.39 Males per 100 Females in Mansfield Center.
What is the Ratio of Females per 100 Males in Mansfield Center?
There are 105.95 Females per 100 Males in Mansfield Center.
What is the Median Population Age in Mansfield Center?
Median Population Age in Mansfield Center is 41.5 Years.
What is the Average Family Size in Mansfield Center
Average Family Size in Mansfield Center is 2.9 People.
What is the Average Household Size in Mansfield Center
Average Household Size in Mansfield Center is 2.4 People.
How Large is the Labor Force in Mansfield Center?
There are 4,403 People in the Labor Forcein in Mansfield Center.
What is the Percentage of People in the Labor Force in Mansfield Center?
70.5% of People are in the Labor Force in Mansfield Center.
What is the Unemployment Rate in Mansfield Center?
Unemployment Rate in Mansfield Center is 5.2%.