Agawam Town, MA Map & Demographics
Agawam Town Map
Agawam Town Overview
$43,172
PER CAPITA INCOME
$107,401
AVG FAMILY INCOME
$80,809
AVG HOUSEHOLD INCOME
18.5%
WAGE / INCOME GAP [ % ]
81.5¢/ $1
WAGE / INCOME GAP [ $ ]
$7,226
FAMILY INCOME DEFICIT
0.44
INEQUALITY / GINI INDEX
28,606
TOTAL POPULATION
14,029
MALE POPULATION
14,577
FEMALE POPULATION
96.24
MALES / 100 FEMALES
103.91
FEMALES / 100 MALES
46.0
MEDIAN AGE
3.0
AVG FAMILY SIZE
2.4
AVG HOUSEHOLD SIZE
15,595
LABOR FORCE [ PEOPLE ]
64.8%
PERCENT IN LABOR FORCE
5.2%
UNEMPLOYMENT RATE
Income in Agawam Town
Income Overview in Agawam Town
Per Capita Income in Agawam Town is $43,172, while median incomes of families and households are $107,401 and $80,809 respectively.
| Characteristic | Number | Measure |
| Per Capita Income | 28,606 | $43,172 |
| Median Family Income | 7,335 | $107,401 |
| Mean Family Income | 7,335 | $129,223 |
| Median Household Income | 11,577 | $80,809 |
| Mean Household Income | 11,577 | $105,071 |
| Income Deficit | 7,335 | $7,226 |
| Wage / Income Gap (%) | 28,606 | 18.46% |
| Wage / Income Gap ($) | 28,606 | 81.54¢ per $1 |
| Gini / Inequality Index | 28,606 | 0.44 |
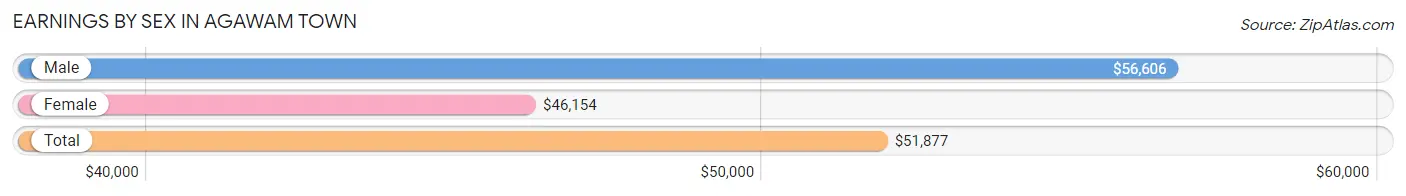
Earnings by Sex in Agawam Town
Average Earnings in Agawam Town are $51,877, $56,606 for men and $46,154 for women, a difference of 18.5%.
| Sex | Number | Average Earnings |
| Male | 8,176 (50.7%) | $56,606 |
| Female | 7,934 (49.2%) | $46,154 |
| Total | 16,110 (100.0%) | $51,877 |
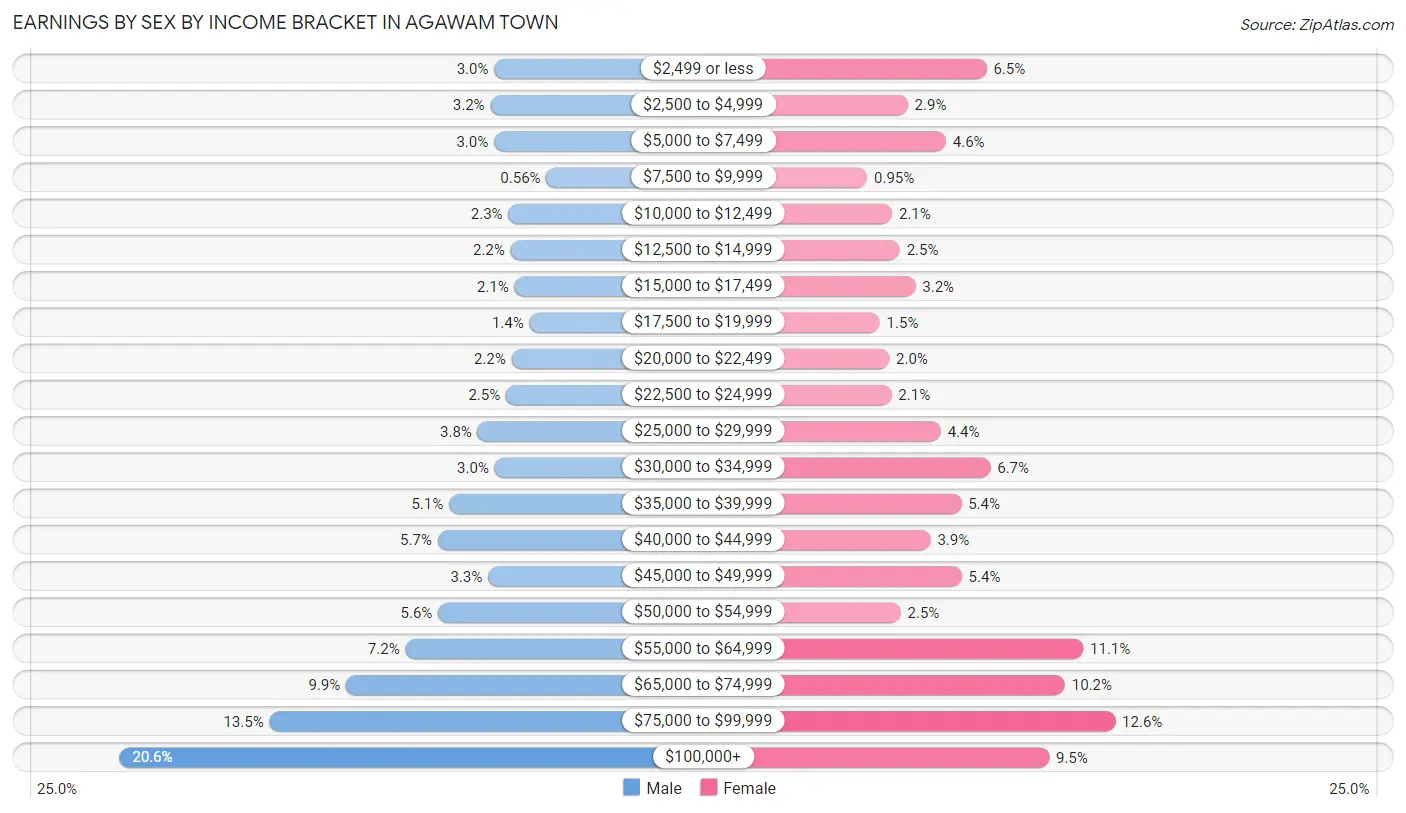
Earnings by Sex by Income Bracket in Agawam Town
The most common earnings brackets in Agawam Town are $100,000+ for men (1,681 | 20.6%) and $75,000 to $99,999 for women (997 | 12.6%).
| Income | Male | Female |
| $2,499 or less | 245 (3.0%) | 519 (6.5%) |
| $2,500 to $4,999 | 260 (3.2%) | 226 (2.9%) |
| $5,000 to $7,499 | 246 (3.0%) | 368 (4.6%) |
| $7,500 to $9,999 | 46 (0.6%) | 75 (0.9%) |
| $10,000 to $12,499 | 191 (2.3%) | 168 (2.1%) |
| $12,500 to $14,999 | 183 (2.2%) | 197 (2.5%) |
| $15,000 to $17,499 | 168 (2.1%) | 255 (3.2%) |
| $17,500 to $19,999 | 110 (1.3%) | 122 (1.5%) |
| $20,000 to $22,499 | 179 (2.2%) | 157 (2.0%) |
| $22,500 to $24,999 | 200 (2.5%) | 166 (2.1%) |
| $25,000 to $29,999 | 309 (3.8%) | 349 (4.4%) |
| $30,000 to $34,999 | 244 (3.0%) | 533 (6.7%) |
| $35,000 to $39,999 | 419 (5.1%) | 425 (5.4%) |
| $40,000 to $44,999 | 462 (5.7%) | 311 (3.9%) |
| $45,000 to $49,999 | 269 (3.3%) | 427 (5.4%) |
| $50,000 to $54,999 | 460 (5.6%) | 200 (2.5%) |
| $55,000 to $64,999 | 585 (7.2%) | 878 (11.1%) |
| $65,000 to $74,999 | 813 (9.9%) | 810 (10.2%) |
| $75,000 to $99,999 | 1,106 (13.5%) | 997 (12.6%) |
| $100,000+ | 1,681 (20.6%) | 751 (9.5%) |
| Total | 8,176 (100.0%) | 7,934 (100.0%) |
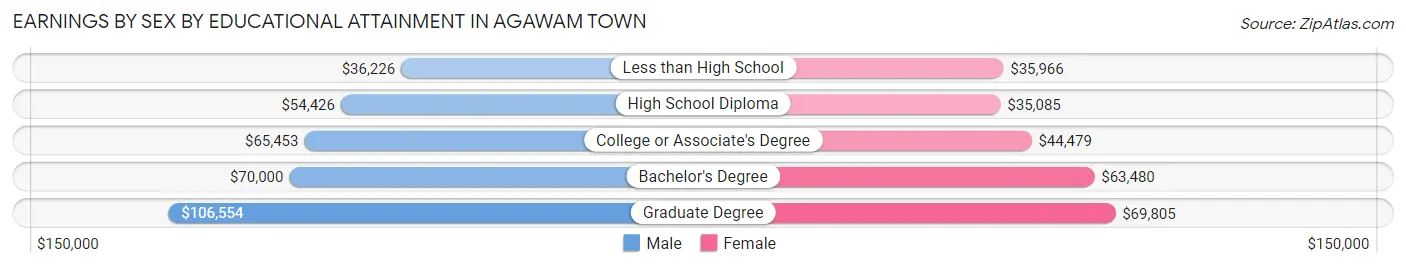
Earnings by Sex by Educational Attainment in Agawam Town
Average earnings in Agawam Town are $62,884 for men and $55,124 for women, a difference of 12.3%. Men with an educational attainment of graduate degree enjoy the highest average annual earnings of $106,554, while those with less than high school education earn the least with $36,226. Women with an educational attainment of graduate degree earn the most with the average annual earnings of $69,805, while those with high school diploma education have the smallest earnings of $35,085.
| Educational Attainment | Male Income | Female Income |
| Less than High School | $36,226 | $35,966 |
| High School Diploma | $54,426 | $35,085 |
| College or Associate's Degree | $65,453 | $44,479 |
| Bachelor's Degree | $70,000 | $63,480 |
| Graduate Degree | $106,554 | $69,805 |
| Total | $62,884 | $55,124 |
Family Income in Agawam Town
Family Income Brackets in Agawam Town
According to the Agawam Town family income data, there are 1,716 families falling into the $100,000 to $149,999 income range, which is the most common income bracket and makes up 23.4% of all families. Conversely, the $10,000 to $14,999 income bracket is the least frequent group with only 29 families (0.4%) belonging to this category.
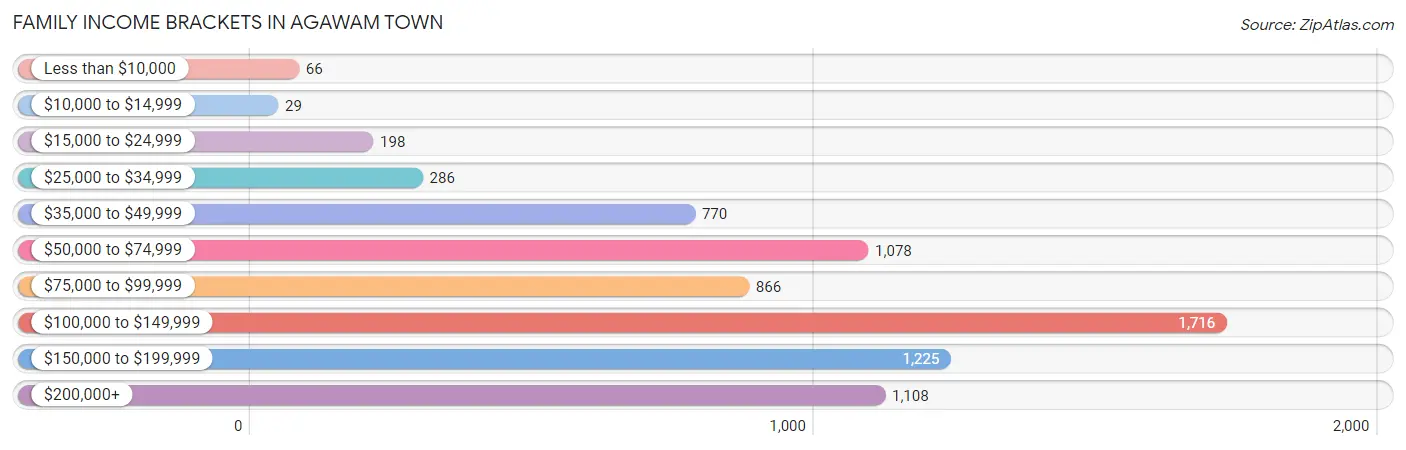
| Income Bracket | # Families | % Families |
| Less than $10,000 | 66 | 0.9% |
| $10,000 to $14,999 | 29 | 0.4% |
| $15,000 to $24,999 | 198 | 2.7% |
| $25,000 to $34,999 | 286 | 3.9% |
| $35,000 to $49,999 | 770 | 10.5% |
| $50,000 to $74,999 | 1,078 | 14.7% |
| $75,000 to $99,999 | 866 | 11.8% |
| $100,000 to $149,999 | 1,716 | 23.4% |
| $150,000 to $199,999 | 1,225 | 16.7% |
| $200,000+ | 1,108 | 15.1% |
Family Income by Famaliy Size in Agawam Town
6-person families (126 | 1.7%) account for the highest median family income in Agawam Town with $225,625 per family, while 2-person families (3,666 | 50.0%) have the highest median income of $38,672 per family member.
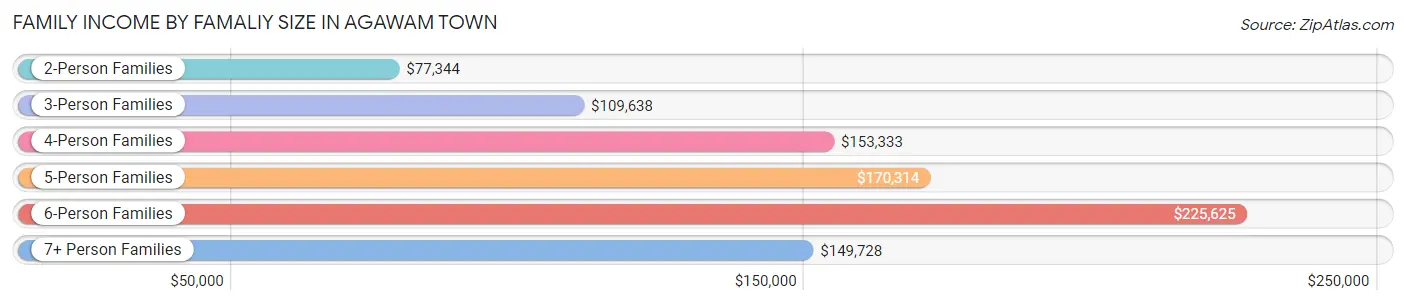
| Income Bracket | # Families | Median Income |
| 2-Person Families | 3,666 (50.0%) | $77,344 |
| 3-Person Families | 1,372 (18.7%) | $109,638 |
| 4-Person Families | 1,440 (19.6%) | $153,333 |
| 5-Person Families | 654 (8.9%) | $170,314 |
| 6-Person Families | 126 (1.7%) | $225,625 |
| 7+ Person Families | 77 (1.1%) | $149,728 |
| Total | 7,335 (100.0%) | $107,401 |
Family Income by Number of Earners in Agawam Town
The median family income in Agawam Town is $107,401, with families comprising 3+ earners (1,423) having the highest median family income of $180,583, while families with no earners (1,079) have the lowest median family income of $51,418, accounting for 19.4% and 14.7% of families, respectively.
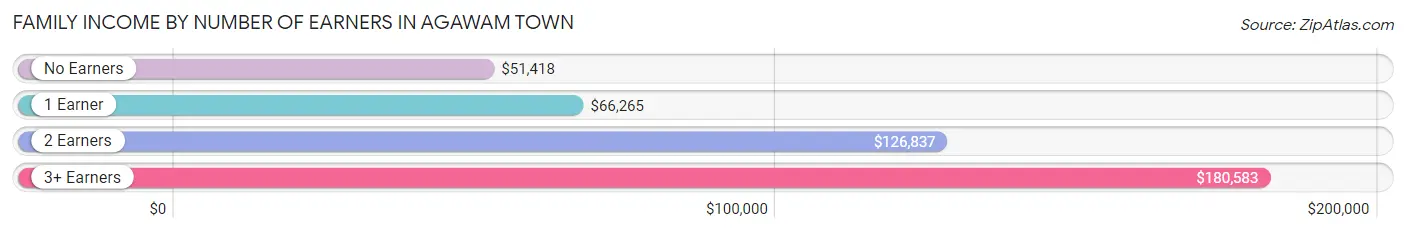
| Number of Earners | # Families | Median Income |
| No Earners | 1,079 (14.7%) | $51,418 |
| 1 Earner | 1,921 (26.2%) | $66,265 |
| 2 Earners | 2,912 (39.7%) | $126,837 |
| 3+ Earners | 1,423 (19.4%) | $180,583 |
| Total | 7,335 (100.0%) | $107,401 |
Household Income in Agawam Town
Household Income Brackets in Agawam Town
With 2,315 households falling in the category, the $100,000 to $149,999 income range is the most frequent in Agawam Town, accounting for 20.0% of all households. In contrast, only 370 households (3.2%) fall into the $10,000 to $14,999 income bracket, making it the least populous group.
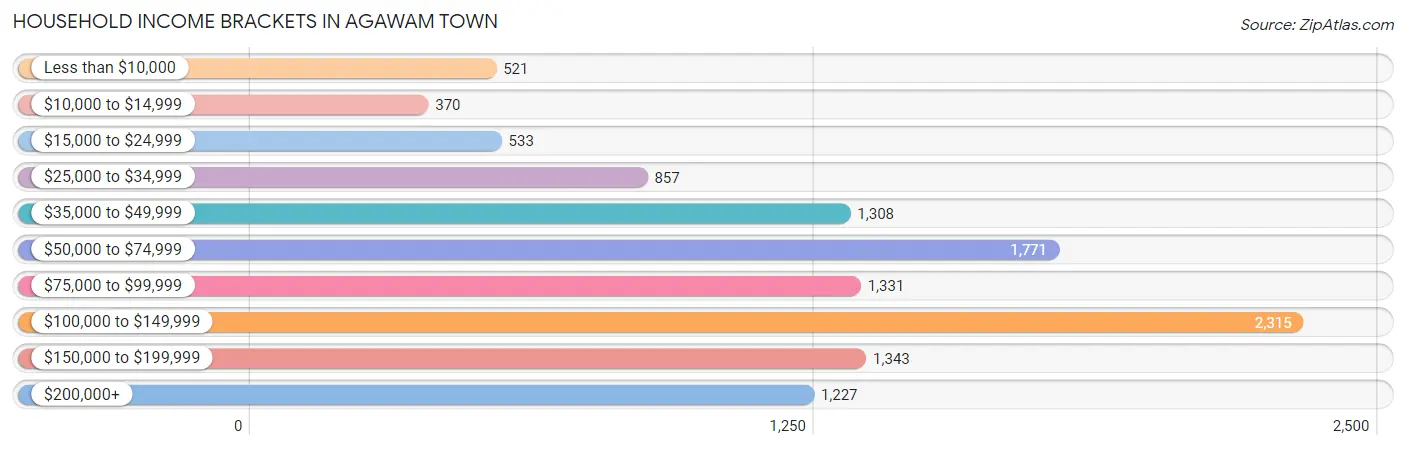
| Income Bracket | # Households | % Households |
| Less than $10,000 | 521 | 4.5% |
| $10,000 to $14,999 | 370 | 3.2% |
| $15,000 to $24,999 | 533 | 4.6% |
| $25,000 to $34,999 | 857 | 7.4% |
| $35,000 to $49,999 | 1,308 | 11.3% |
| $50,000 to $74,999 | 1,771 | 15.3% |
| $75,000 to $99,999 | 1,331 | 11.5% |
| $100,000 to $149,999 | 2,315 | 20.0% |
| $150,000 to $199,999 | 1,343 | 11.6% |
| $200,000+ | 1,227 | 10.6% |
Household Income by Householder Age in Agawam Town
The median household income in Agawam Town is $80,809, with the highest median household income of $106,838 found in the 45 to 64 years age bracket for the primary householder. A total of 4,746 households (41.0%) fall into this category. Meanwhile, the 65+ years age bracket for the primary householder has the lowest median household income of $51,331, with 3,805 households (32.9%) in this group.
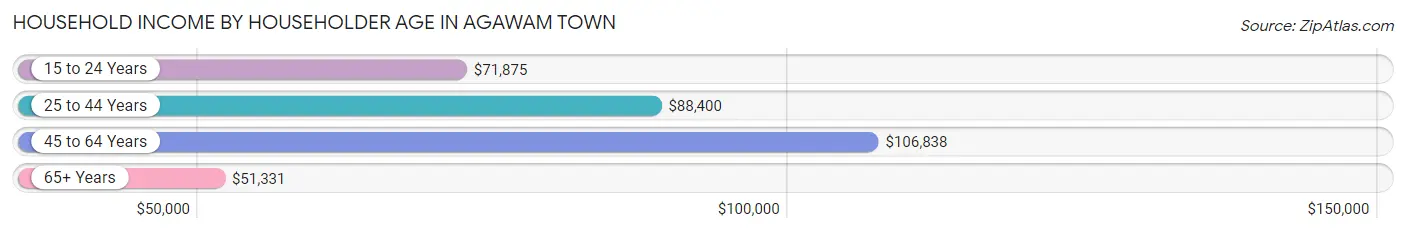
| Income Bracket | # Households | Median Income |
| 15 to 24 Years | 142 (1.2%) | $71,875 |
| 25 to 44 Years | 2,884 (24.9%) | $88,400 |
| 45 to 64 Years | 4,746 (41.0%) | $106,838 |
| 65+ Years | 3,805 (32.9%) | $51,331 |
| Total | 11,577 (100.0%) | $80,809 |
Poverty in Agawam Town
Income Below Poverty by Sex and Age in Agawam Town
With 5.4% poverty level for males and 7.6% for females among the residents of Agawam Town, 25 to 34 year old males and under 5 year old females are the most vulnerable to poverty, with 219 males (11.3%) and 95 females (15.3%) in their respective age groups living below the poverty level.
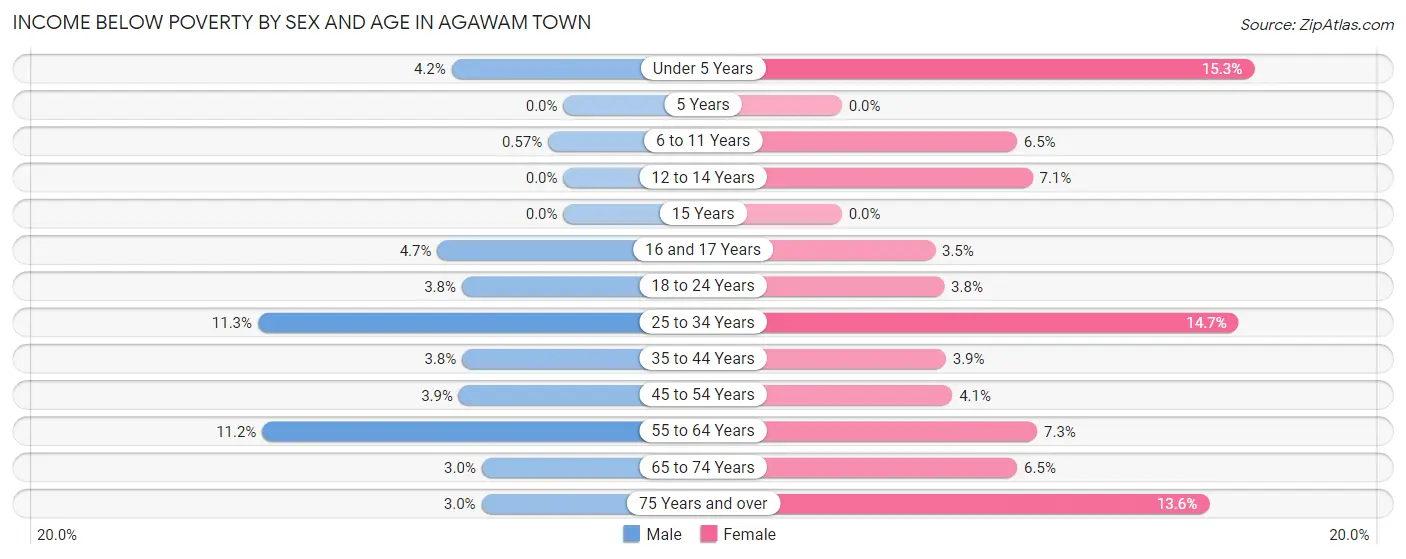
| Age Bracket | Male | Female |
| Under 5 Years | 25 (4.2%) | 95 (15.3%) |
| 5 Years | 0 (0.0%) | 0 (0.0%) |
| 6 to 11 Years | 5 (0.6%) | 39 (6.5%) |
| 12 to 14 Years | 0 (0.0%) | 38 (7.1%) |
| 15 Years | 0 (0.0%) | 0 (0.0%) |
| 16 and 17 Years | 14 (4.7%) | 8 (3.5%) |
| 18 to 24 Years | 36 (3.8%) | 47 (3.8%) |
| 25 to 34 Years | 219 (11.3%) | 202 (14.7%) |
| 35 to 44 Years | 58 (3.8%) | 70 (3.9%) |
| 45 to 54 Years | 80 (3.9%) | 83 (4.1%) |
| 55 to 64 Years | 237 (11.2%) | 166 (7.2%) |
| 65 to 74 Years | 45 (3.0%) | 108 (6.5%) |
| 75 Years and over | 30 (3.0%) | 221 (13.6%) |
| Total | 749 (5.4%) | 1,077 (7.6%) |
Income Above Poverty by Sex and Age in Agawam Town
According to the poverty statistics in Agawam Town, males aged 5 years and females aged 5 years are the age groups that are most secure financially, with 100.0% of males and 100.0% of females in these age groups living above the poverty line.
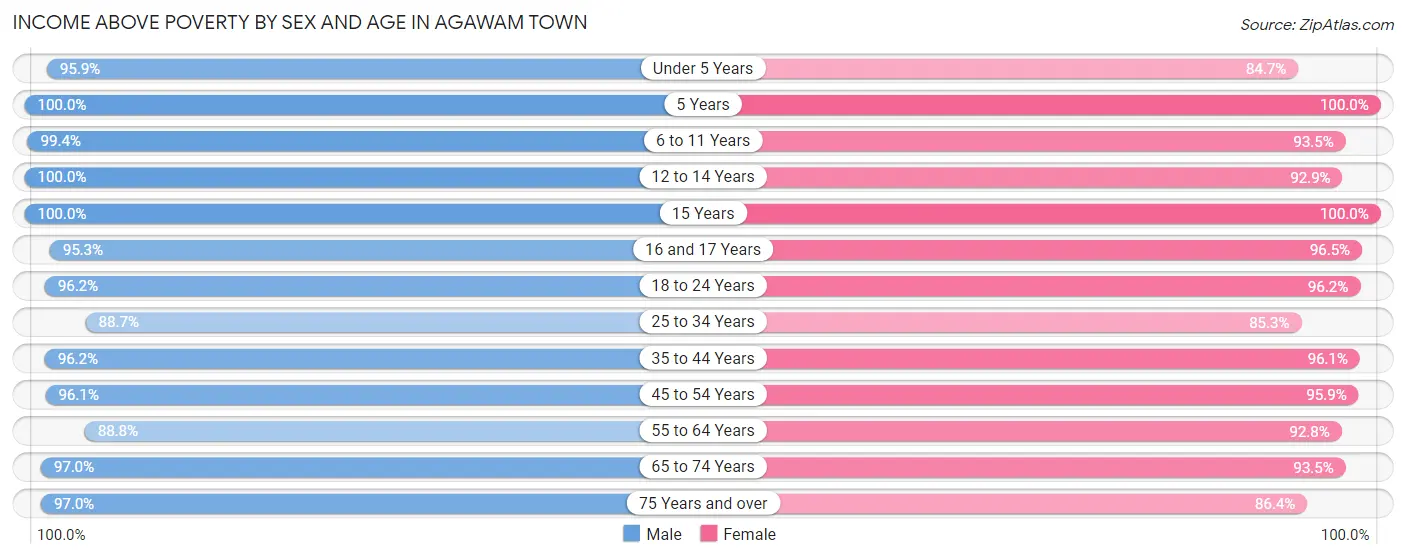
| Age Bracket | Male | Female |
| Under 5 Years | 577 (95.9%) | 526 (84.7%) |
| 5 Years | 198 (100.0%) | 79 (100.0%) |
| 6 to 11 Years | 865 (99.4%) | 561 (93.5%) |
| 12 to 14 Years | 466 (100.0%) | 499 (92.9%) |
| 15 Years | 294 (100.0%) | 144 (100.0%) |
| 16 and 17 Years | 285 (95.3%) | 223 (96.5%) |
| 18 to 24 Years | 918 (96.2%) | 1,190 (96.2%) |
| 25 to 34 Years | 1,712 (88.7%) | 1,169 (85.3%) |
| 35 to 44 Years | 1,483 (96.2%) | 1,743 (96.1%) |
| 45 to 54 Years | 1,984 (96.1%) | 1,943 (95.9%) |
| 55 to 64 Years | 1,883 (88.8%) | 2,124 (92.7%) |
| 65 to 74 Years | 1,440 (97.0%) | 1,550 (93.5%) |
| 75 Years and over | 956 (97.0%) | 1,400 (86.4%) |
| Total | 13,061 (94.6%) | 13,151 (92.4%) |
Income Below Poverty Among Married-Couple Families in Agawam Town
The poverty statistics for married-couple families in Agawam Town show that 1.6% or 93 of the total 5,661 families live below the poverty line. Families with no children have the highest poverty rate of 1.8%, comprising of 66 families. On the other hand, families with 3 or 4 children have the lowest poverty rate of 0.0%, which includes 0 families.
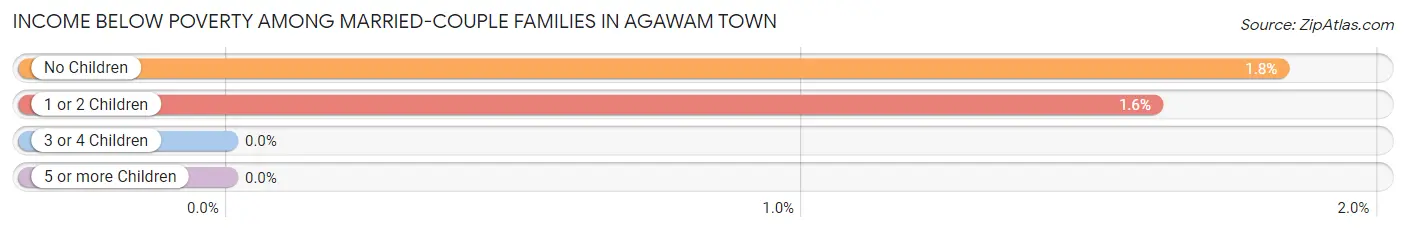
| Children | Above Poverty | Below Poverty |
| No Children | 3,543 (98.2%) | 66 (1.8%) |
| 1 or 2 Children | 1,649 (98.4%) | 27 (1.6%) |
| 3 or 4 Children | 358 (100.0%) | 0 (0.0%) |
| 5 or more Children | 18 (100.0%) | 0 (0.0%) |
| Total | 5,568 (98.4%) | 93 (1.6%) |
Income Below Poverty Among Single-Parent Households in Agawam Town
According to the poverty data in Agawam Town, 11.0% or 53 single-father households and 4.5% or 54 single-mother households are living below the poverty line. Among single-father households, those with 1 or 2 children have the highest poverty rate, with 53 households (29.1%) experiencing poverty. Likewise, among single-mother households, those with 3 or 4 children have the highest poverty rate, with 26 households (61.9%) falling below the poverty line.
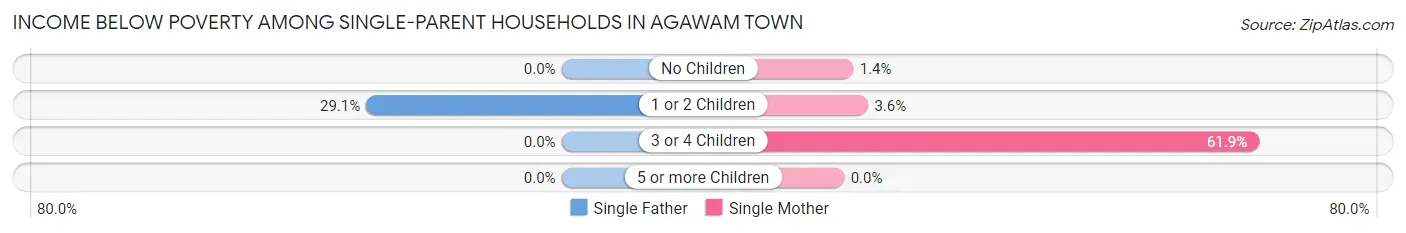
| Children | Single Father | Single Mother |
| No Children | 0 (0.0%) | 8 (1.4%) |
| 1 or 2 Children | 53 (29.1%) | 20 (3.5%) |
| 3 or 4 Children | 0 (0.0%) | 26 (61.9%) |
| 5 or more Children | 0 (0.0%) | 0 (0.0%) |
| Total | 53 (11.0%) | 54 (4.5%) |
Income Below Poverty Among Married-Couple vs Single-Parent Households in Agawam Town
The poverty data for Agawam Town shows that 93 of the married-couple family households (1.6%) and 107 of the single-parent households (6.4%) are living below the poverty level. Within the married-couple family households, those with no children have the highest poverty rate, with 66 households (1.8%) falling below the poverty line. Among the single-parent households, those with 3 or 4 children have the highest poverty rate, with 26 household (61.9%) living below poverty.
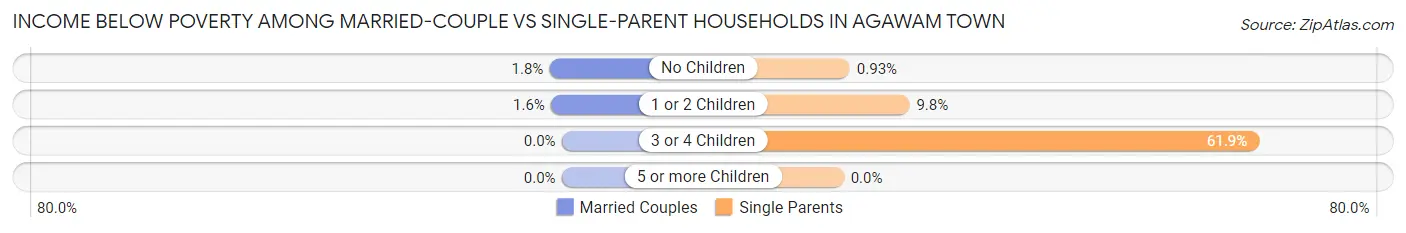
| Children | Married-Couple Families | Single-Parent Households |
| No Children | 66 (1.8%) | 8 (0.9%) |
| 1 or 2 Children | 27 (1.6%) | 73 (9.8%) |
| 3 or 4 Children | 0 (0.0%) | 26 (61.9%) |
| 5 or more Children | 0 (0.0%) | 0 (0.0%) |
| Total | 93 (1.6%) | 107 (6.4%) |
Race in Agawam Town
The most populous races in Agawam Town are White / Caucasian (26,105 | 91.3%), Hispanic or Latino (1,621 | 5.7%), and Two or more Races (954 | 3.3%).
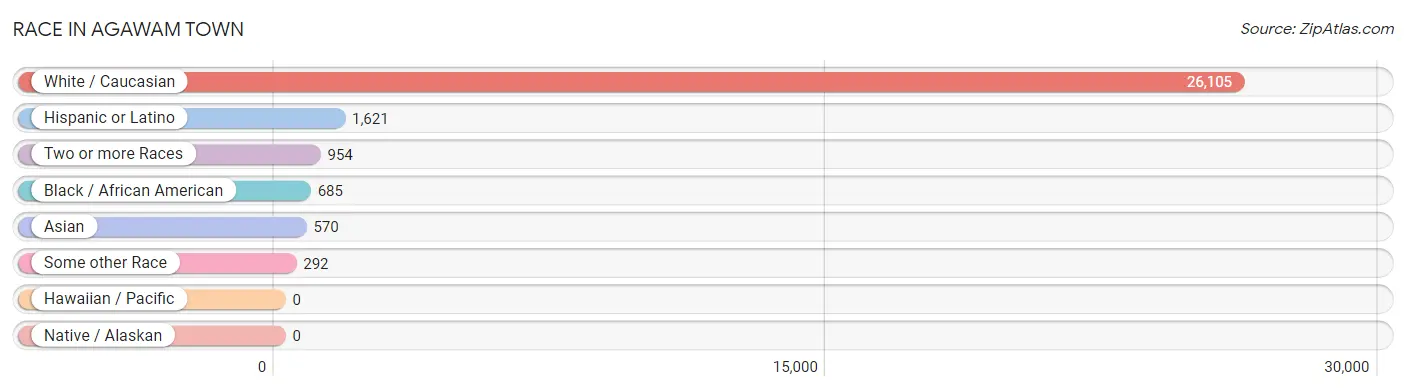
| Race | # Population | % Population |
| Asian | 570 | 2.0% |
| Black / African American | 685 | 2.4% |
| Hawaiian / Pacific | 0 | 0.0% |
| Hispanic or Latino | 1,621 | 5.7% |
| Native / Alaskan | 0 | 0.0% |
| White / Caucasian | 26,105 | 91.3% |
| Two or more Races | 954 | 3.3% |
| Some other Race | 292 | 1.0% |
| Total | 28,606 | 100.0% |
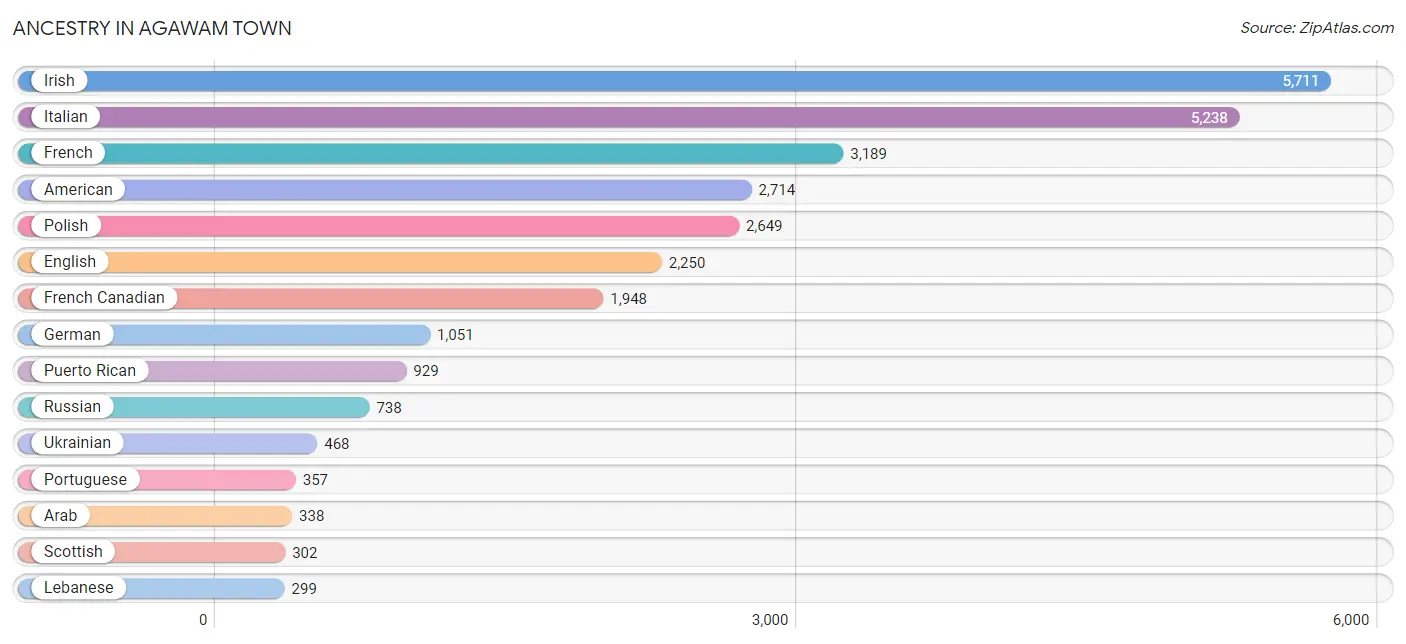
Ancestry in Agawam Town
The most populous ancestries reported in Agawam Town are Irish (5,711 | 20.0%), Italian (5,238 | 18.3%), French (3,189 | 11.2%), American (2,714 | 9.5%), and Polish (2,649 | 9.3%), together accounting for 68.2% of all Agawam Town residents.
| Ancestry | # Population | % Population |
| Albanian | 27 | 0.1% |
| American | 2,714 | 9.5% |
| Arab | 338 | 1.2% |
| Argentinean | 106 | 0.4% |
| Armenian | 25 | 0.1% |
| Belgian | 15 | 0.1% |
| Bhutanese | 63 | 0.2% |
| Blackfeet | 67 | 0.2% |
| Brazilian | 29 | 0.1% |
| British | 24 | 0.1% |
| Burmese | 132 | 0.5% |
| Canadian | 219 | 0.8% |
| Central American | 61 | 0.2% |
| Cherokee | 86 | 0.3% |
| Colombian | 78 | 0.3% |
| Croatian | 15 | 0.1% |
| Cuban | 82 | 0.3% |
| Czech | 77 | 0.3% |
| Danish | 36 | 0.1% |
| Dominican | 92 | 0.3% |
| Dutch | 107 | 0.4% |
| Eastern European | 52 | 0.2% |
| English | 2,250 | 7.9% |
| European | 187 | 0.6% |
| Finnish | 45 | 0.2% |
| French | 3,189 | 11.2% |
| French Canadian | 1,948 | 6.8% |
| German | 1,051 | 3.7% |
| Ghanaian | 12 | 0.0% |
| Greek | 295 | 1.0% |
| Hungarian | 73 | 0.3% |
| Indian (Asian) | 170 | 0.6% |
| Irish | 5,711 | 20.0% |
| Italian | 5,238 | 18.3% |
| Jamaican | 179 | 0.6% |
| Kenyan | 4 | 0.0% |
| Korean | 39 | 0.1% |
| Laotian | 18 | 0.1% |
| Lebanese | 299 | 1.1% |
| Liberian | 38 | 0.1% |
| Lithuanian | 102 | 0.4% |
| Mexican | 235 | 0.8% |
| Nigerian | 112 | 0.4% |
| Norwegian | 173 | 0.6% |
| Pakistani | 25 | 0.1% |
| Polish | 2,649 | 9.3% |
| Portuguese | 357 | 1.3% |
| Puerto Rican | 929 | 3.3% |
| Romanian | 23 | 0.1% |
| Russian | 738 | 2.6% |
| Salvadoran | 41 | 0.1% |
| Samoan | 8 | 0.0% |
| Scandinavian | 147 | 0.5% |
| Scotch-Irish | 108 | 0.4% |
| Scottish | 302 | 1.1% |
| Senegalese | 22 | 0.1% |
| Slovak | 16 | 0.1% |
| South American | 184 | 0.6% |
| Spaniard | 12 | 0.0% |
| Sri Lankan | 21 | 0.1% |
| Subsaharan African | 159 | 0.6% |
| Swedish | 269 | 0.9% |
| Swiss | 91 | 0.3% |
| Syrian | 39 | 0.1% |
| Thai | 190 | 0.7% |
| Trinidadian and Tobagonian | 5 | 0.0% |
| Turkish | 125 | 0.4% |
| Ukrainian | 468 | 1.6% |
| Welsh | 67 | 0.2% | View All 69 Rows |
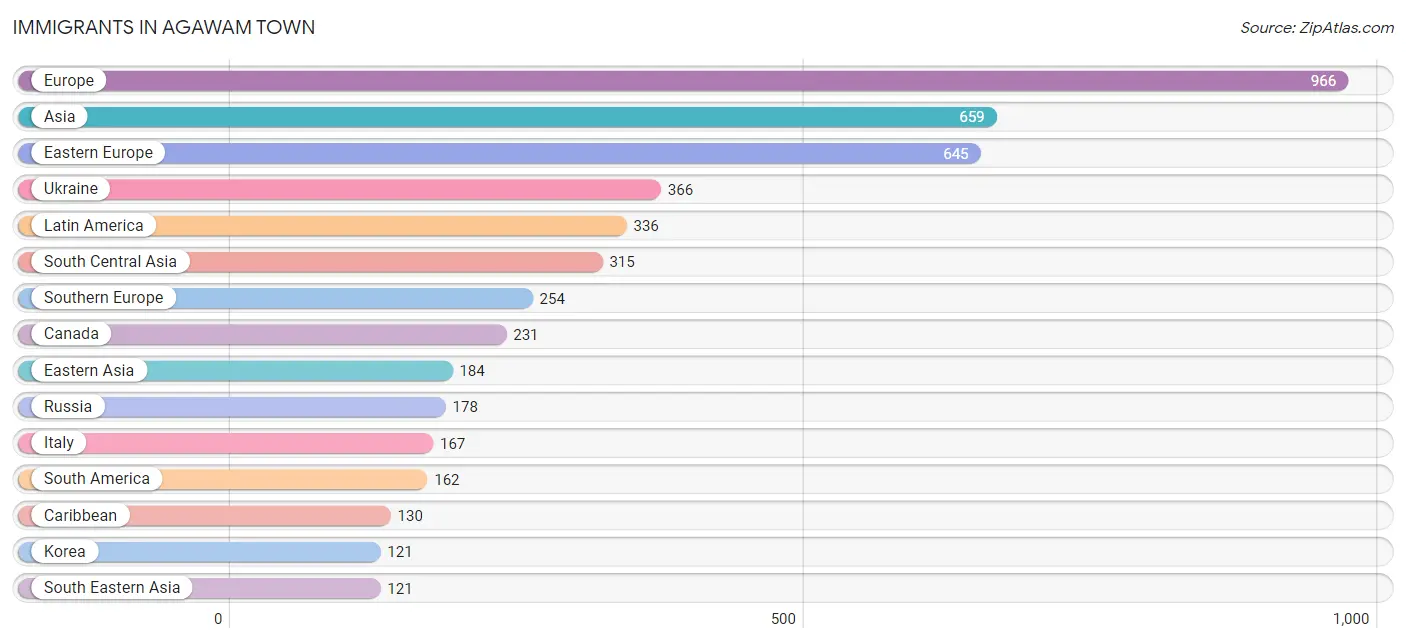
Immigrants in Agawam Town
The most numerous immigrant groups reported in Agawam Town came from Europe (966 | 3.4%), Asia (659 | 2.3%), Eastern Europe (645 | 2.2%), Ukraine (366 | 1.3%), and Latin America (336 | 1.2%), together accounting for 10.4% of all Agawam Town residents.
| Immigration Origin | # Population | % Population |
| Africa | 64 | 0.2% |
| Albania | 9 | 0.0% |
| Argentina | 97 | 0.3% |
| Asia | 659 | 2.3% |
| Belarus | 10 | 0.0% |
| Brazil | 29 | 0.1% |
| Canada | 231 | 0.8% |
| Caribbean | 130 | 0.4% |
| Central America | 44 | 0.2% |
| China | 63 | 0.2% |
| Colombia | 30 | 0.1% |
| Cuba | 14 | 0.1% |
| Eastern Asia | 184 | 0.6% |
| Eastern Europe | 645 | 2.2% |
| El Salvador | 16 | 0.1% |
| England | 4 | 0.0% |
| Europe | 966 | 3.4% |
| France | 11 | 0.0% |
| Germany | 12 | 0.0% |
| Ghana | 12 | 0.0% |
| Greece | 15 | 0.1% |
| Guyana | 6 | 0.0% |
| Hong Kong | 11 | 0.0% |
| India | 95 | 0.3% |
| Indonesia | 18 | 0.1% |
| Ireland | 2 | 0.0% |
| Italy | 167 | 0.6% |
| Jamaica | 111 | 0.4% |
| Kazakhstan | 13 | 0.1% |
| Korea | 121 | 0.4% |
| Latin America | 336 | 1.2% |
| Liberia | 9 | 0.0% |
| Mexico | 28 | 0.1% |
| Moldova | 23 | 0.1% |
| Nigeria | 21 | 0.1% |
| Northern Europe | 44 | 0.2% |
| Pakistan | 13 | 0.1% |
| Philippines | 28 | 0.1% |
| Poland | 41 | 0.1% |
| Portugal | 72 | 0.3% |
| Russia | 178 | 0.6% |
| Senegal | 22 | 0.1% |
| South America | 162 | 0.6% |
| South Central Asia | 315 | 1.1% |
| South Eastern Asia | 121 | 0.4% |
| Southern Europe | 254 | 0.9% |
| Thailand | 25 | 0.1% |
| Trinidad and Tobago | 5 | 0.0% |
| Turkey | 39 | 0.1% |
| Ukraine | 366 | 1.3% |
| Uzbekistan | 58 | 0.2% |
| Vietnam | 50 | 0.2% |
| Western Africa | 64 | 0.2% |
| Western Asia | 39 | 0.1% |
| Western Europe | 23 | 0.1% | View All 55 Rows |
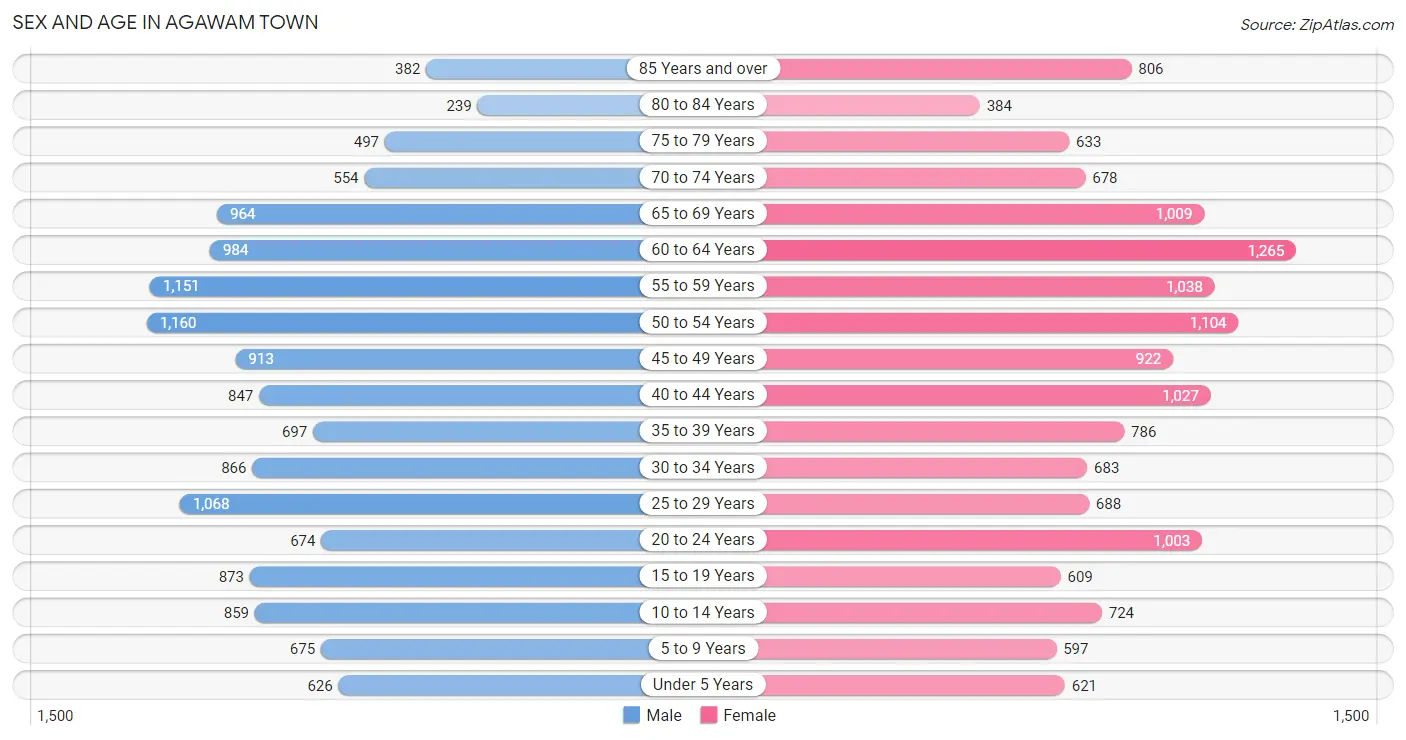
Sex and Age in Agawam Town
Sex and Age in Agawam Town
The most populous age groups in Agawam Town are 50 to 54 Years (1,160 | 8.3%) for men and 60 to 64 Years (1,265 | 8.7%) for women.
| Age Bracket | Male | Female |
| Under 5 Years | 626 (4.5%) | 621 (4.3%) |
| 5 to 9 Years | 675 (4.8%) | 597 (4.1%) |
| 10 to 14 Years | 859 (6.1%) | 724 (5.0%) |
| 15 to 19 Years | 873 (6.2%) | 609 (4.2%) |
| 20 to 24 Years | 674 (4.8%) | 1,003 (6.9%) |
| 25 to 29 Years | 1,068 (7.6%) | 688 (4.7%) |
| 30 to 34 Years | 866 (6.2%) | 683 (4.7%) |
| 35 to 39 Years | 697 (5.0%) | 786 (5.4%) |
| 40 to 44 Years | 847 (6.0%) | 1,027 (7.0%) |
| 45 to 49 Years | 913 (6.5%) | 922 (6.3%) |
| 50 to 54 Years | 1,160 (8.3%) | 1,104 (7.6%) |
| 55 to 59 Years | 1,151 (8.2%) | 1,038 (7.1%) |
| 60 to 64 Years | 984 (7.0%) | 1,265 (8.7%) |
| 65 to 69 Years | 964 (6.9%) | 1,009 (6.9%) |
| 70 to 74 Years | 554 (4.0%) | 678 (4.6%) |
| 75 to 79 Years | 497 (3.5%) | 633 (4.3%) |
| 80 to 84 Years | 239 (1.7%) | 384 (2.6%) |
| 85 Years and over | 382 (2.7%) | 806 (5.5%) |
| Total | 14,029 (100.0%) | 14,577 (100.0%) |
Families and Households in Agawam Town
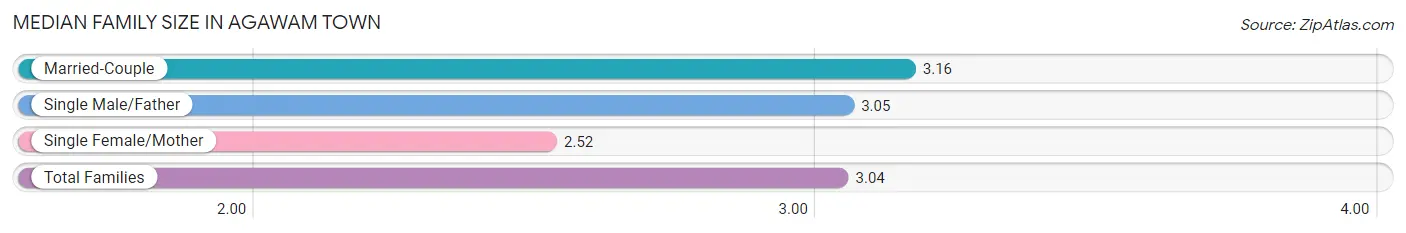
Median Family Size in Agawam Town
The median family size in Agawam Town is 3.04 persons per family, with married-couple families (5,661 | 77.2%) accounting for the largest median family size of 3.16 persons per family. On the other hand, single female/mother families (1,192 | 16.3%) represent the smallest median family size with 2.52 persons per family.
| Family Type | # Families | Family Size |
| Married-Couple | 5,661 (77.2%) | 3.16 |
| Single Male/Father | 482 (6.6%) | 3.05 |
| Single Female/Mother | 1,192 (16.3%) | 2.52 |
| Total Families | 7,335 (100.0%) | 3.04 |
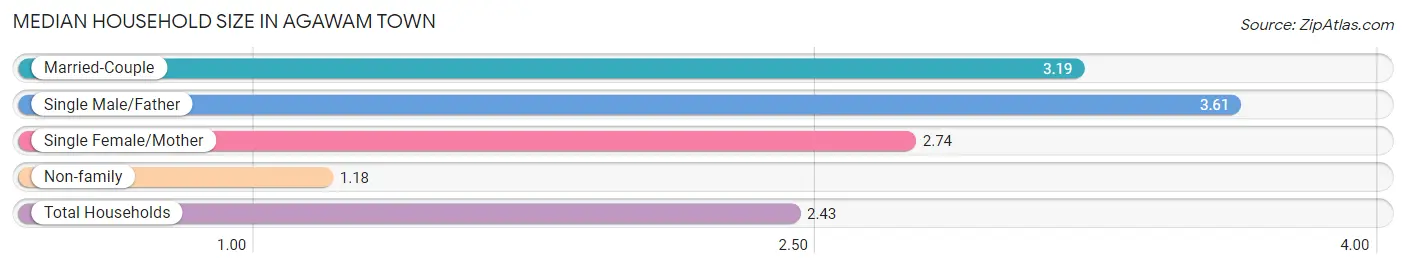
Median Household Size in Agawam Town
The median household size in Agawam Town is 2.43 persons per household, with single male/father households (482 | 4.2%) accounting for the largest median household size of 3.61 persons per household. non-family households (4,242 | 36.6%) represent the smallest median household size with 1.18 persons per household.
| Household Type | # Households | Household Size |
| Married-Couple | 5,661 (48.9%) | 3.19 |
| Single Male/Father | 482 (4.2%) | 3.61 |
| Single Female/Mother | 1,192 (10.3%) | 2.74 |
| Non-family | 4,242 (36.6%) | 1.18 |
| Total Households | 11,577 (100.0%) | 2.43 |
Household Size by Marriage Status in Agawam Town
Out of a total of 11,577 households in Agawam Town, 7,335 (63.4%) are family households, while 4,242 (36.6%) are nonfamily households. The most numerous type of family households are 2-person households, comprising 3,411, and the most common type of nonfamily households are 1-person households, comprising 3,456.
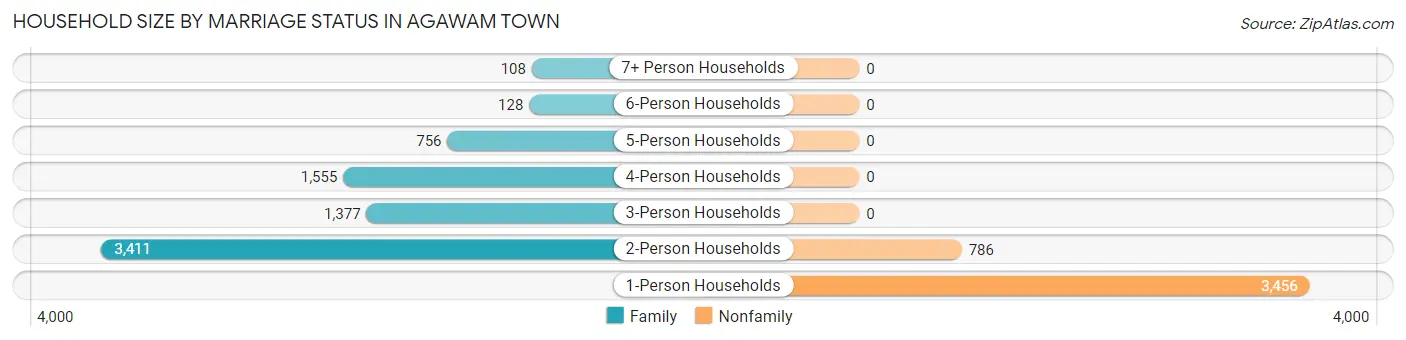
| Household Size | Family Households | Nonfamily Households |
| 1-Person Households | - | 3,456 (29.8%) |
| 2-Person Households | 3,411 (29.5%) | 786 (6.8%) |
| 3-Person Households | 1,377 (11.9%) | 0 (0.0%) |
| 4-Person Households | 1,555 (13.4%) | 0 (0.0%) |
| 5-Person Households | 756 (6.5%) | 0 (0.0%) |
| 6-Person Households | 128 (1.1%) | 0 (0.0%) |
| 7+ Person Households | 108 (0.9%) | 0 (0.0%) |
| Total | 7,335 (63.4%) | 4,242 (36.6%) |
Female Fertility in Agawam Town
Fertility by Age in Agawam Town
Average fertility rate in Agawam Town is 37.0 births per 1,000 women. Women in the age bracket of 20 to 34 years have the highest fertility rate with 47.0 births per 1,000 women. Women in the age bracket of 20 to 34 years acount for 50.9% of all women with births.
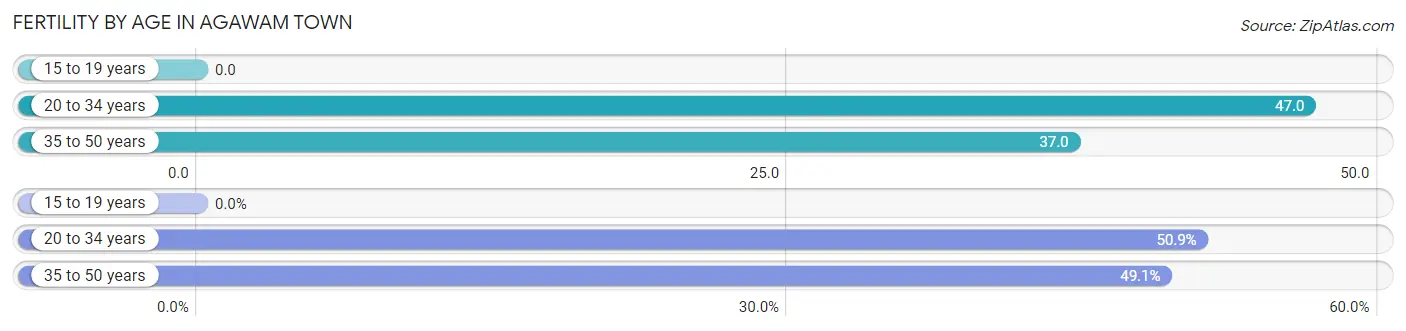
| Age Bracket | Women with Births | Births / 1,000 Women |
| 15 to 19 years | 0 (0.0%) | 0.0 |
| 20 to 34 years | 111 (50.9%) | 47.0 |
| 35 to 50 years | 107 (49.1%) | 37.0 |
| Total | 218 (100.0%) | 37.0 |
Fertility by Age by Marriage Status in Agawam Town
49.5% of women with births (218) in Agawam Town are married. The highest percentage of unmarried women with births falls into 20 to 34 years age bracket with 59.5% of them unmarried at the time of birth, while the lowest percentage of unmarried women with births belong to 35 to 50 years age bracket with 41.1% of them unmarried.
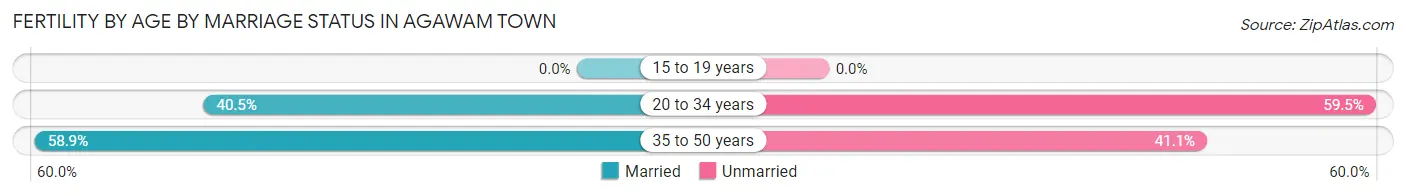
| Age Bracket | Married | Unmarried |
| 15 to 19 years | 0 (0.0%) | 0 (0.0%) |
| 20 to 34 years | 45 (40.5%) | 66 (59.5%) |
| 35 to 50 years | 63 (58.9%) | 44 (41.1%) |
| Total | 108 (49.5%) | 110 (50.5%) |
Fertility by Education in Agawam Town
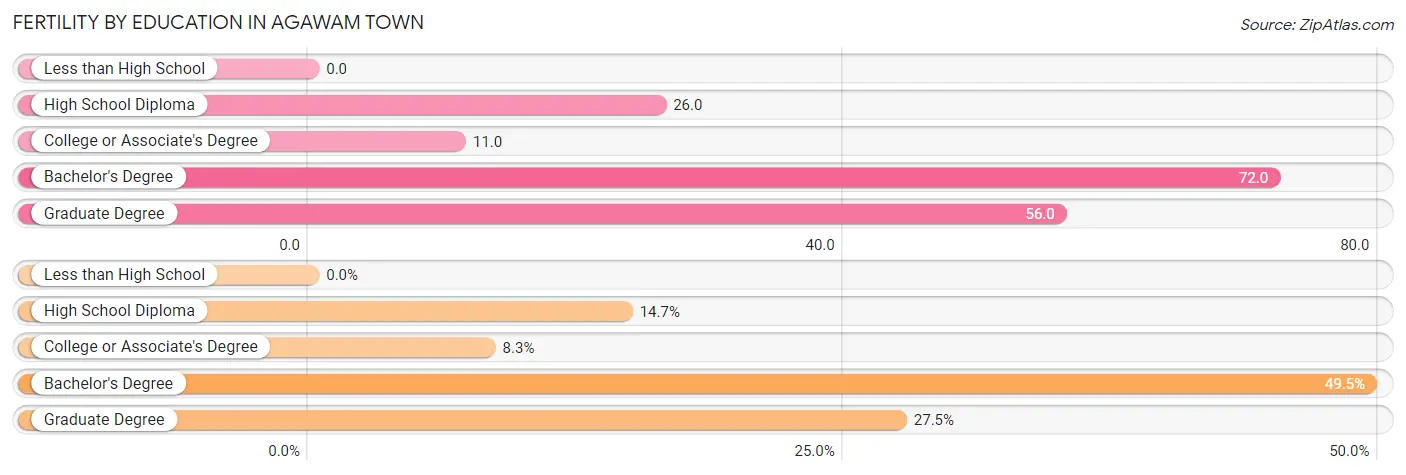
| Educational Attainment | Women with Births | Births / 1,000 Women |
| Less than High School | 0 (0.0%) | 0.0 |
| High School Diploma | 32 (14.7%) | 26.0 |
| College or Associate's Degree | 18 (8.3%) | 11.0 |
| Bachelor's Degree | 108 (49.5%) | 72.0 |
| Graduate Degree | 60 (27.5%) | 56.0 |
| Total | 218 (100.0%) | 37.0 |
Fertility by Education by Marriage Status in Agawam Town
50.5% of women with births in Agawam Town are unmarried. Women with the educational attainment of college or associate's degree are most likely to be married with 100.0% of them married at childbirth, while women with the educational attainment of graduate degree are least likely to be married with 73.3% of them unmarried at childbirth.
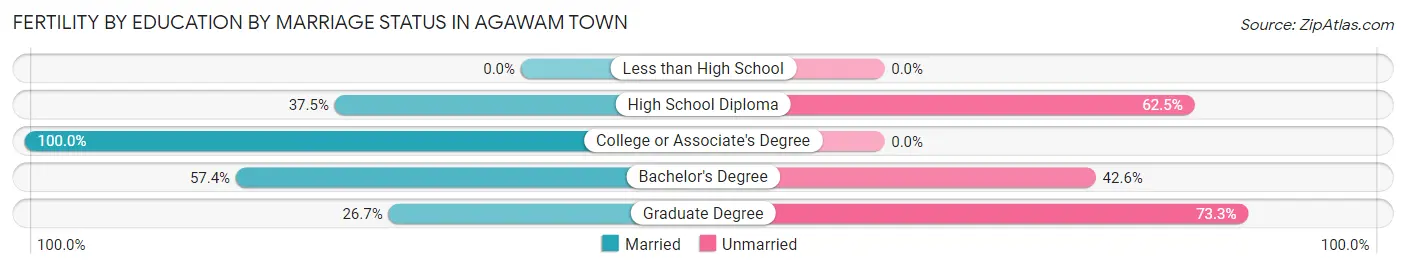
| Educational Attainment | Married | Unmarried |
| Less than High School | 0 (0.0%) | 0 (0.0%) |
| High School Diploma | 12 (37.5%) | 20 (62.5%) |
| College or Associate's Degree | 18 (100.0%) | 0 (0.0%) |
| Bachelor's Degree | 62 (57.4%) | 46 (42.6%) |
| Graduate Degree | 16 (26.7%) | 44 (73.3%) |
| Total | 108 (49.5%) | 110 (50.5%) |
Employment Characteristics in Agawam Town
Employment by Class of Employer in Agawam Town
Among the 14,571 employed individuals in Agawam Town, private company employees (10,029 | 68.8%), local government employees (1,606 | 11.0%), and not-for-profit organizations (1,056 | 7.2%) make up the most common classes of employment.
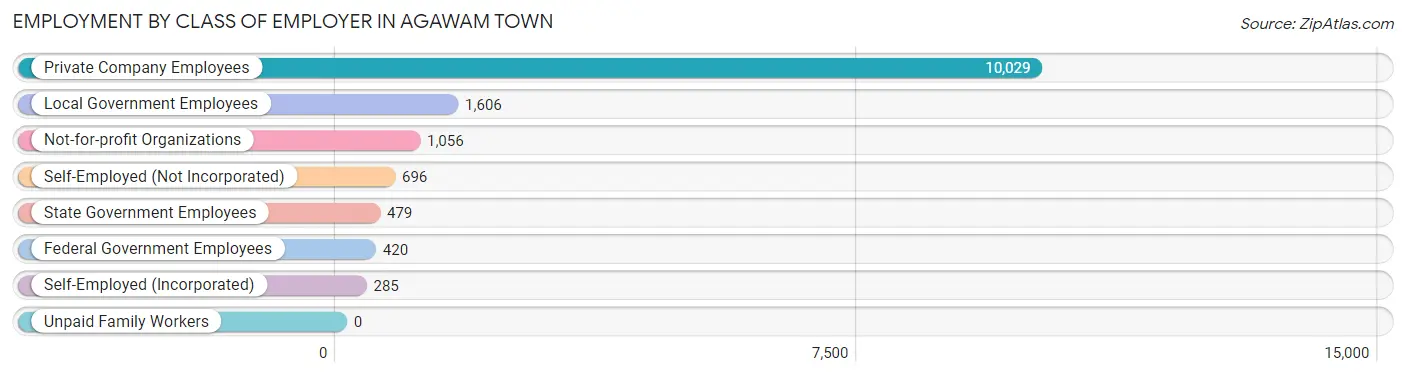
| Employer Class | # Employees | % Employees |
| Private Company Employees | 10,029 | 68.8% |
| Self-Employed (Incorporated) | 285 | 2.0% |
| Self-Employed (Not Incorporated) | 696 | 4.8% |
| Not-for-profit Organizations | 1,056 | 7.2% |
| Local Government Employees | 1,606 | 11.0% |
| State Government Employees | 479 | 3.3% |
| Federal Government Employees | 420 | 2.9% |
| Unpaid Family Workers | 0 | 0.0% |
| Total | 14,571 | 100.0% |
Employment Status by Age in Agawam Town
According to the labor force statistics for Agawam Town, out of the total population over 16 years of age (24,066), 64.8% or 15,595 individuals are in the labor force, with 5.2% or 811 of them unemployed. The age group with the highest labor force participation rate is 25 to 29 years, with 91.8% or 1,612 individuals in the labor force. Within the labor force, the 25 to 29 years age range has the highest percentage of unemployed individuals, with 13.2% or 213 of them being unemployed.
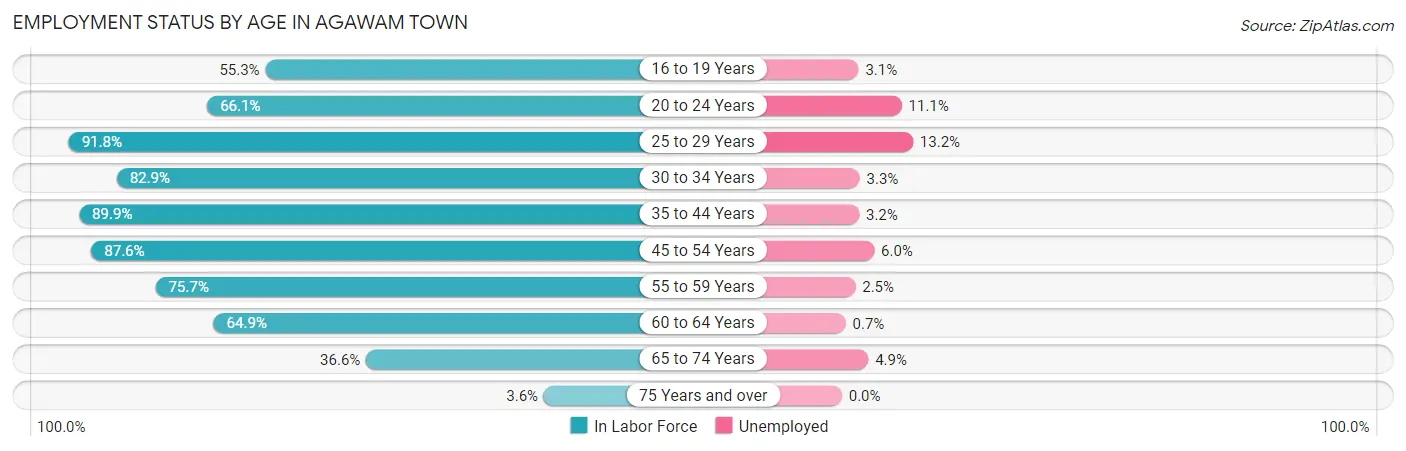
| Age Bracket | In Labor Force | Unemployed |
| 16 to 19 Years | 577 (55.3%) | 18 (3.1%) |
| 20 to 24 Years | 1,108 (66.1%) | 123 (11.1%) |
| 25 to 29 Years | 1,612 (91.8%) | 213 (13.2%) |
| 30 to 34 Years | 1,284 (82.9%) | 42 (3.3%) |
| 35 to 44 Years | 3,018 (89.9%) | 97 (3.2%) |
| 45 to 54 Years | 3,591 (87.6%) | 215 (6.0%) |
| 55 to 59 Years | 1,657 (75.7%) | 41 (2.5%) |
| 60 to 64 Years | 1,460 (64.9%) | 10 (0.7%) |
| 65 to 74 Years | 1,173 (36.6%) | 57 (4.9%) |
| 75 Years and over | 106 (3.6%) | 0 (0.0%) |
| Total | 15,595 (64.8%) | 811 (5.2%) |
Employment Status by Educational Attainment in Agawam Town
According to labor force statistics for Agawam Town, 83.1% of individuals (12,630) out of the total population between 25 and 64 years of age (15,199) are in the labor force, with 4.9% or 619 of them being unemployed. The group with the highest labor force participation rate are those with the educational attainment of bachelor's degree or higher, with 91.1% or 5,166 individuals in the labor force. Within the labor force, individuals with less than high school education have the highest percentage of unemployment, with 15.1% or 68 of them being unemployed.
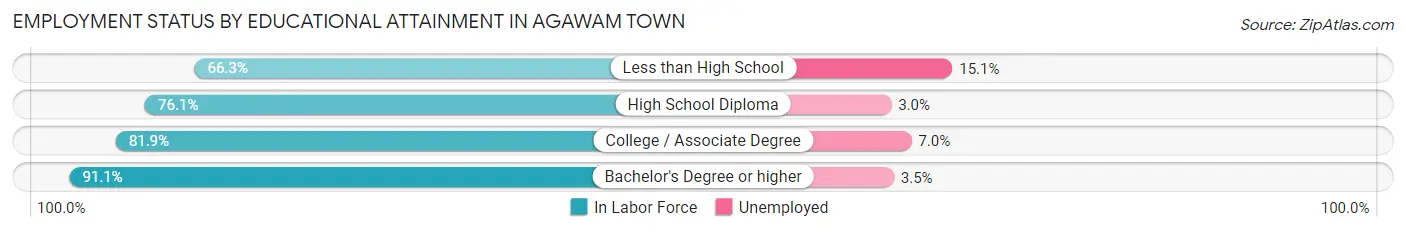
| Educational Attainment | In Labor Force | Unemployed |
| Less than High School | 451 (66.3%) | 103 (15.1%) |
| High School Diploma | 3,152 (76.1%) | 124 (3.0%) |
| College / Associate Degree | 3,854 (81.9%) | 329 (7.0%) |
| Bachelor's Degree or higher | 5,166 (91.1%) | 198 (3.5%) |
| Total | 12,630 (83.1%) | 745 (4.9%) |
Employment Occupations by Sex in Agawam Town
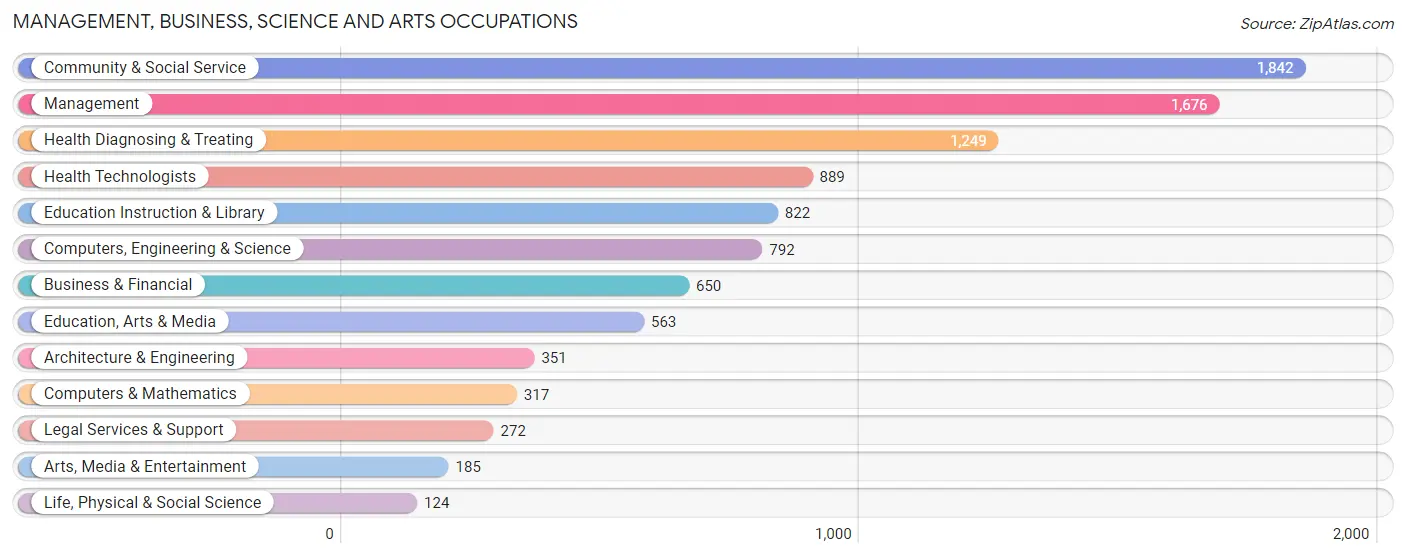
Management, Business, Science and Arts Occupations
The most common Management, Business, Science and Arts occupations in Agawam Town are Community & Social Service (1,842 | 12.5%), Management (1,676 | 11.4%), Health Diagnosing & Treating (1,249 | 8.5%), Health Technologists (889 | 6.0%), and Education Instruction & Library (822 | 5.6%).
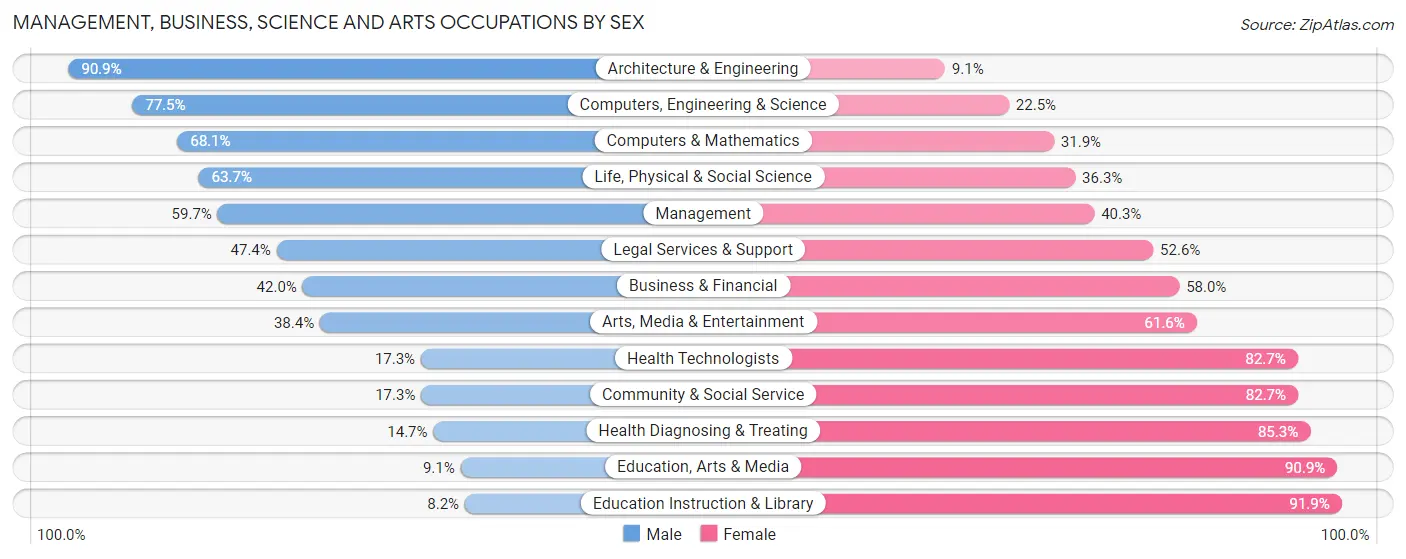
Management, Business, Science and Arts Occupations by Sex
Within the Management, Business, Science and Arts occupations in Agawam Town, the most male-oriented occupations are Architecture & Engineering (90.9%), Computers, Engineering & Science (77.5%), and Computers & Mathematics (68.1%), while the most female-oriented occupations are Education Instruction & Library (91.8%), Education, Arts & Media (90.9%), and Health Diagnosing & Treating (85.3%).
| Occupation | Male | Female |
| Management | 1,001 (59.7%) | 675 (40.3%) |
| Business & Financial | 273 (42.0%) | 377 (58.0%) |
| Computers, Engineering & Science | 614 (77.5%) | 178 (22.5%) |
| Computers & Mathematics | 216 (68.1%) | 101 (31.9%) |
| Architecture & Engineering | 319 (90.9%) | 32 (9.1%) |
| Life, Physical & Social Science | 79 (63.7%) | 45 (36.3%) |
| Community & Social Service | 318 (17.3%) | 1,524 (82.7%) |
| Education, Arts & Media | 51 (9.1%) | 512 (90.9%) |
| Legal Services & Support | 129 (47.4%) | 143 (52.6%) |
| Education Instruction & Library | 67 (8.2%) | 755 (91.8%) |
| Arts, Media & Entertainment | 71 (38.4%) | 114 (61.6%) |
| Health Diagnosing & Treating | 184 (14.7%) | 1,065 (85.3%) |
| Health Technologists | 154 (17.3%) | 735 (82.7%) |
| Total (Category) | 2,390 (38.5%) | 3,819 (61.5%) |
| Total (Overall) | 7,593 (51.6%) | 7,126 (48.4%) |
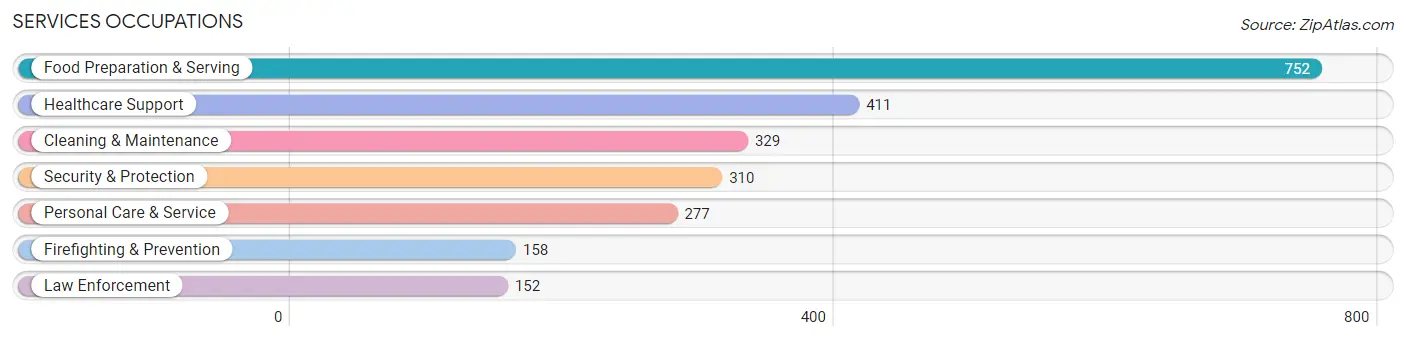
Services Occupations
The most common Services occupations in Agawam Town are Food Preparation & Serving (752 | 5.1%), Healthcare Support (411 | 2.8%), Cleaning & Maintenance (329 | 2.2%), Security & Protection (310 | 2.1%), and Personal Care & Service (277 | 1.9%).
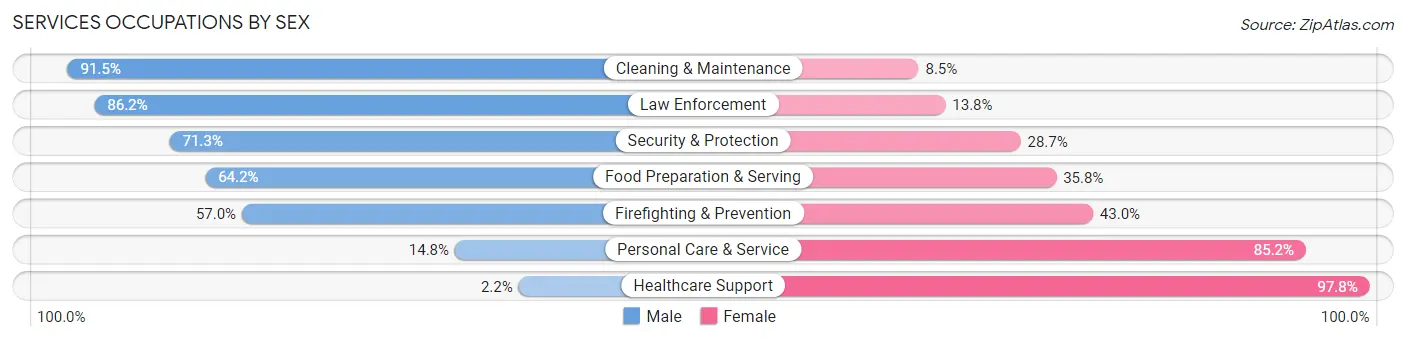
Services Occupations by Sex
Within the Services occupations in Agawam Town, the most male-oriented occupations are Cleaning & Maintenance (91.5%), Law Enforcement (86.2%), and Security & Protection (71.3%), while the most female-oriented occupations are Healthcare Support (97.8%), Personal Care & Service (85.2%), and Firefighting & Prevention (43.0%).
| Occupation | Male | Female |
| Healthcare Support | 9 (2.2%) | 402 (97.8%) |
| Security & Protection | 221 (71.3%) | 89 (28.7%) |
| Firefighting & Prevention | 90 (57.0%) | 68 (43.0%) |
| Law Enforcement | 131 (86.2%) | 21 (13.8%) |
| Food Preparation & Serving | 483 (64.2%) | 269 (35.8%) |
| Cleaning & Maintenance | 301 (91.5%) | 28 (8.5%) |
| Personal Care & Service | 41 (14.8%) | 236 (85.2%) |
| Total (Category) | 1,055 (50.7%) | 1,024 (49.2%) |
| Total (Overall) | 7,593 (51.6%) | 7,126 (48.4%) |
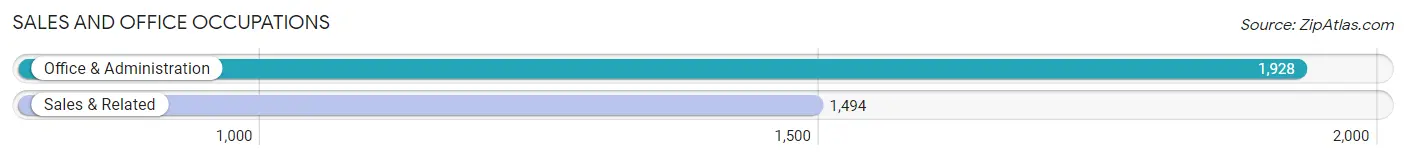
Sales and Office Occupations
The most common Sales and Office occupations in Agawam Town are Office & Administration (1,928 | 13.1%), and Sales & Related (1,494 | 10.2%).
Sales and Office Occupations by Sex
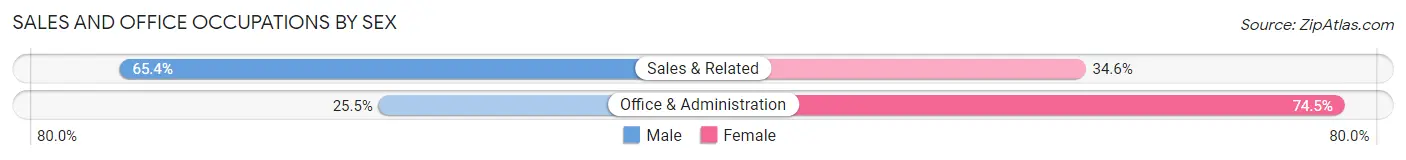
| Occupation | Male | Female |
| Sales & Related | 977 (65.4%) | 517 (34.6%) |
| Office & Administration | 492 (25.5%) | 1,436 (74.5%) |
| Total (Category) | 1,469 (42.9%) | 1,953 (57.1%) |
| Total (Overall) | 7,593 (51.6%) | 7,126 (48.4%) |
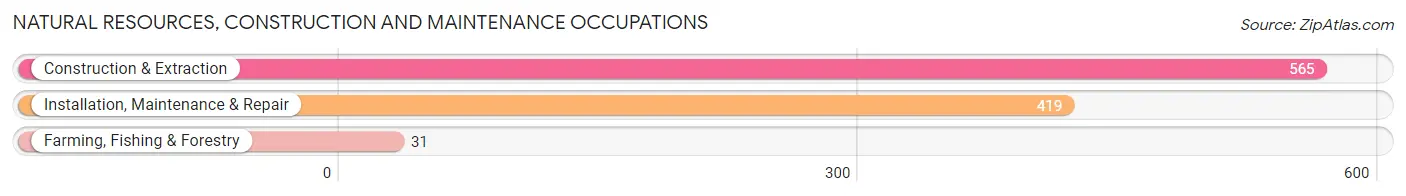
Natural Resources, Construction and Maintenance Occupations
The most common Natural Resources, Construction and Maintenance occupations in Agawam Town are Construction & Extraction (565 | 3.8%), Installation, Maintenance & Repair (419 | 2.9%), and Farming, Fishing & Forestry (31 | 0.2%).
Natural Resources, Construction and Maintenance Occupations by Sex
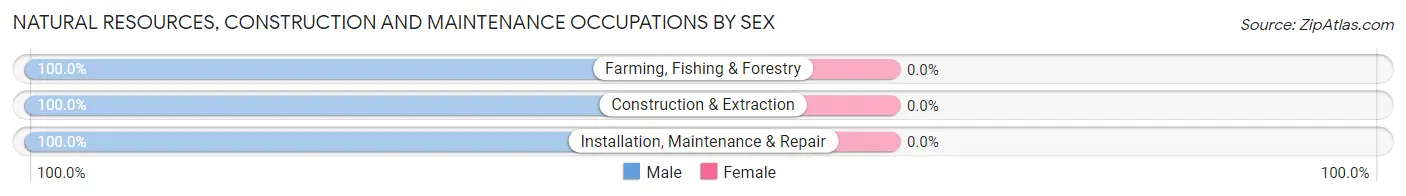
| Occupation | Male | Female |
| Farming, Fishing & Forestry | 31 (100.0%) | 0 (0.0%) |
| Construction & Extraction | 565 (100.0%) | 0 (0.0%) |
| Installation, Maintenance & Repair | 419 (100.0%) | 0 (0.0%) |
| Total (Category) | 1,015 (100.0%) | 0 (0.0%) |
| Total (Overall) | 7,593 (51.6%) | 7,126 (48.4%) |
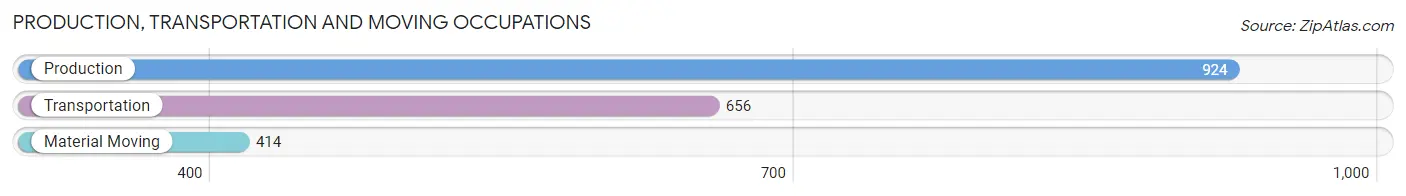
Production, Transportation and Moving Occupations
The most common Production, Transportation and Moving occupations in Agawam Town are Production (924 | 6.3%), Transportation (656 | 4.5%), and Material Moving (414 | 2.8%).
Production, Transportation and Moving Occupations by Sex
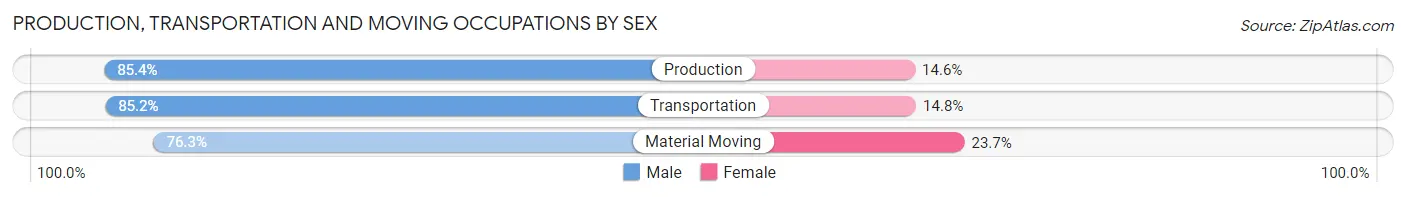
| Occupation | Male | Female |
| Production | 789 (85.4%) | 135 (14.6%) |
| Transportation | 559 (85.2%) | 97 (14.8%) |
| Material Moving | 316 (76.3%) | 98 (23.7%) |
| Total (Category) | 1,664 (83.5%) | 330 (16.6%) |
| Total (Overall) | 7,593 (51.6%) | 7,126 (48.4%) |
Employment Industries by Sex in Agawam Town
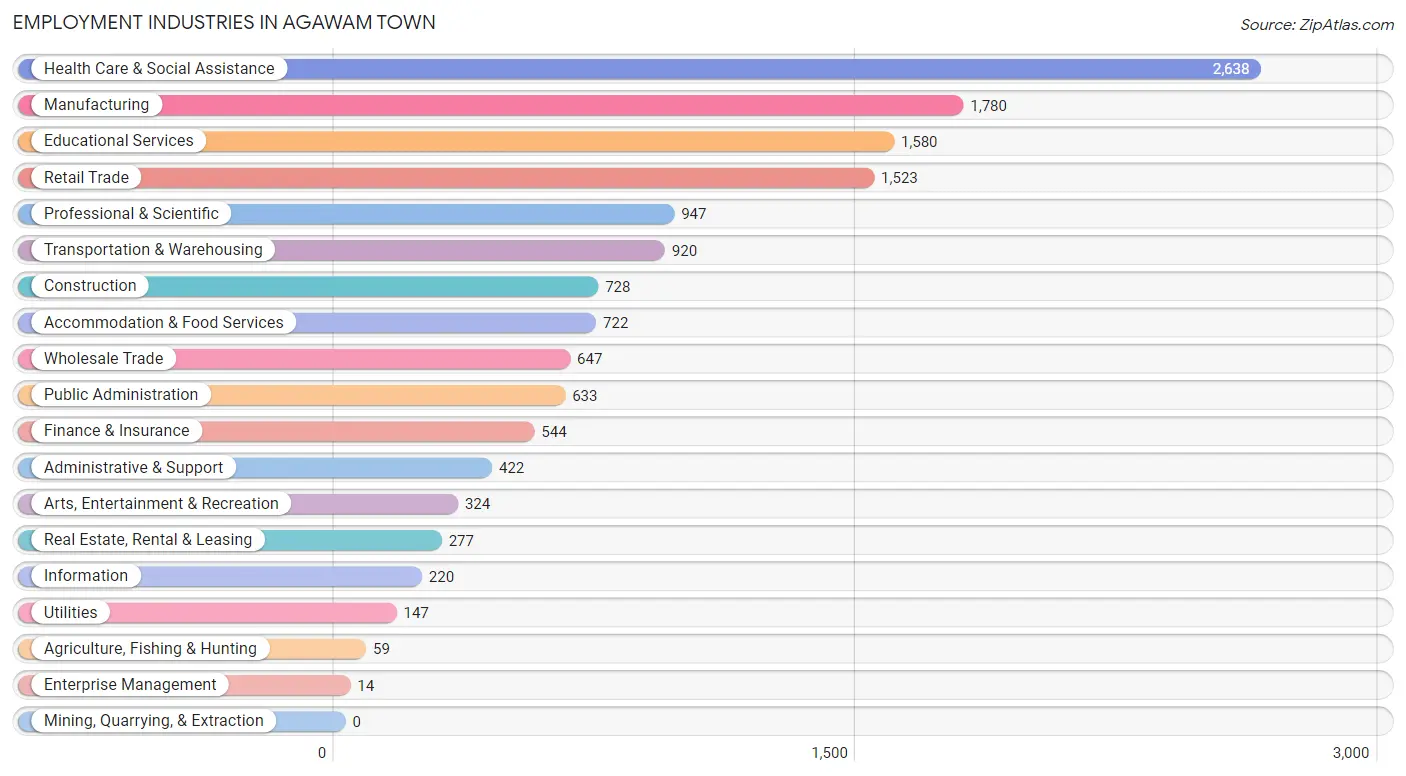
Employment Industries in Agawam Town
The major employment industries in Agawam Town include Health Care & Social Assistance (2,638 | 17.9%), Manufacturing (1,780 | 12.1%), Educational Services (1,580 | 10.7%), Retail Trade (1,523 | 10.3%), and Professional & Scientific (947 | 6.4%).
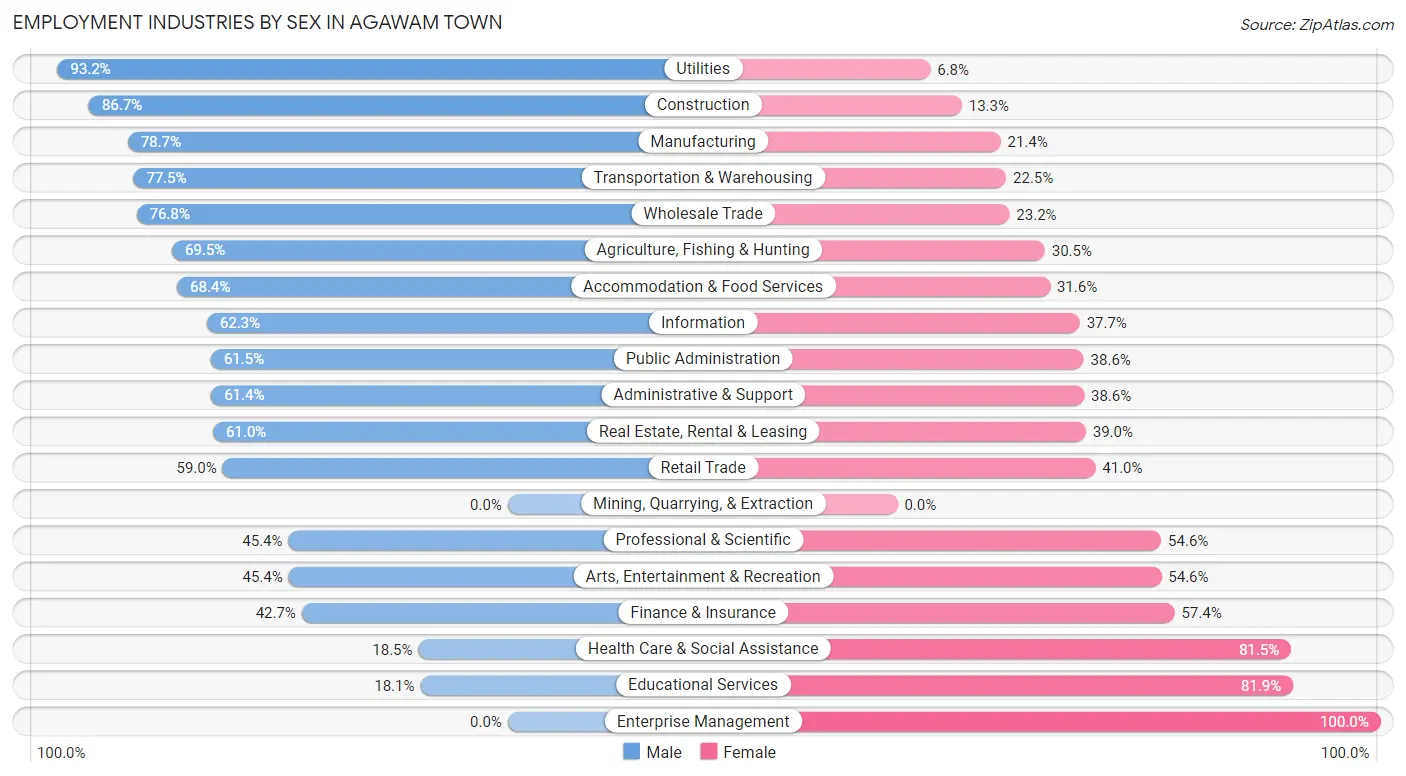
Employment Industries by Sex in Agawam Town
The Agawam Town industries that see more men than women are Utilities (93.2%), Construction (86.7%), and Manufacturing (78.6%), whereas the industries that tend to have a higher number of women are Enterprise Management (100.0%), Educational Services (81.9%), and Health Care & Social Assistance (81.5%).
| Industry | Male | Female |
| Agriculture, Fishing & Hunting | 41 (69.5%) | 18 (30.5%) |
| Mining, Quarrying, & Extraction | 0 (0.0%) | 0 (0.0%) |
| Construction | 631 (86.7%) | 97 (13.3%) |
| Manufacturing | 1,400 (78.6%) | 380 (21.3%) |
| Wholesale Trade | 497 (76.8%) | 150 (23.2%) |
| Retail Trade | 899 (59.0%) | 624 (41.0%) |
| Transportation & Warehousing | 713 (77.5%) | 207 (22.5%) |
| Utilities | 137 (93.2%) | 10 (6.8%) |
| Information | 137 (62.3%) | 83 (37.7%) |
| Finance & Insurance | 232 (42.6%) | 312 (57.4%) |
| Real Estate, Rental & Leasing | 169 (61.0%) | 108 (39.0%) |
| Professional & Scientific | 430 (45.4%) | 517 (54.6%) |
| Enterprise Management | 0 (0.0%) | 14 (100.0%) |
| Administrative & Support | 259 (61.4%) | 163 (38.6%) |
| Educational Services | 286 (18.1%) | 1,294 (81.9%) |
| Health Care & Social Assistance | 488 (18.5%) | 2,150 (81.5%) |
| Arts, Entertainment & Recreation | 147 (45.4%) | 177 (54.6%) |
| Accommodation & Food Services | 494 (68.4%) | 228 (31.6%) |
| Public Administration | 389 (61.5%) | 244 (38.6%) |
| Total | 7,593 (51.6%) | 7,126 (48.4%) |
Education in Agawam Town
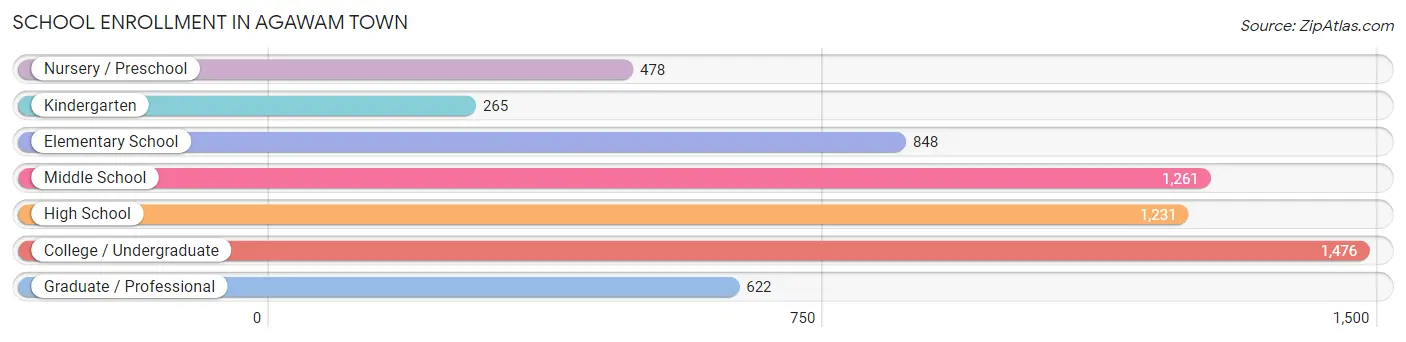
School Enrollment in Agawam Town
The most common levels of schooling among the 6,181 students in Agawam Town are college / undergraduate (1,476 | 23.9%), middle school (1,261 | 20.4%), and high school (1,231 | 19.9%).
| School Level | # Students | % Students |
| Nursery / Preschool | 478 | 7.7% |
| Kindergarten | 265 | 4.3% |
| Elementary School | 848 | 13.7% |
| Middle School | 1,261 | 20.4% |
| High School | 1,231 | 19.9% |
| College / Undergraduate | 1,476 | 23.9% |
| Graduate / Professional | 622 | 10.1% |
| Total | 6,181 | 100.0% |
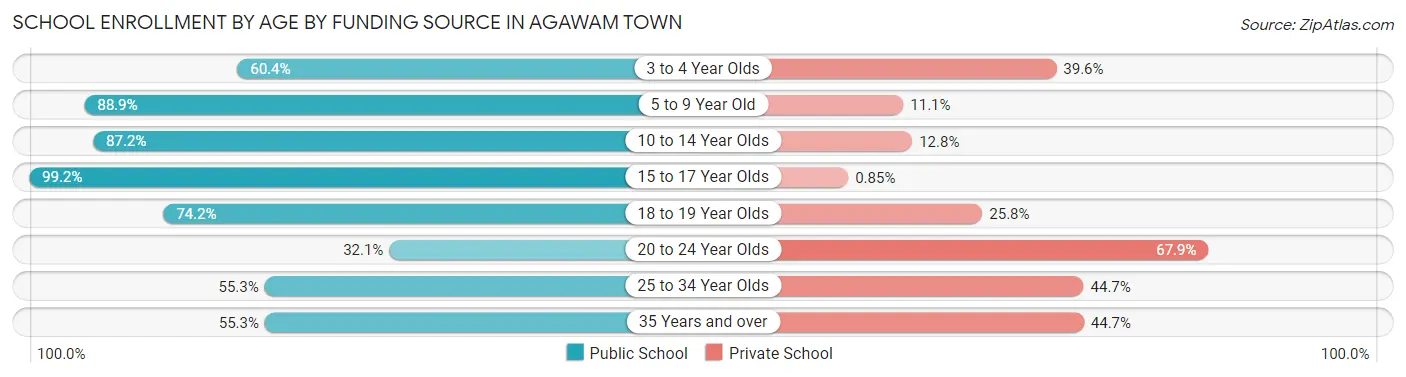
School Enrollment by Age by Funding Source in Agawam Town
Out of a total of 6,181 students who are enrolled in schools in Agawam Town, 1,595 (25.8%) attend a private institution, while the remaining 4,586 (74.2%) are enrolled in public schools. The age group of 20 to 24 year olds has the highest likelihood of being enrolled in private schools, with 637 (67.9% in the age bracket) enrolled. Conversely, the age group of 15 to 17 year olds has the lowest likelihood of being enrolled in a private school, with 937 (99.2% in the age bracket) attending a public institution.
| Age Bracket | Public School | Private School |
| 3 to 4 Year Olds | 221 (60.4%) | 145 (39.6%) |
| 5 to 9 Year Old | 1,031 (88.9%) | 129 (11.1%) |
| 10 to 14 Year Olds | 1,353 (87.2%) | 198 (12.8%) |
| 15 to 17 Year Olds | 937 (99.2%) | 8 (0.9%) |
| 18 to 19 Year Olds | 267 (74.2%) | 93 (25.8%) |
| 20 to 24 Year Olds | 301 (32.1%) | 637 (67.9%) |
| 25 to 34 Year Olds | 250 (55.3%) | 202 (44.7%) |
| 35 Years and over | 226 (55.3%) | 183 (44.7%) |
| Total | 4,586 (74.2%) | 1,595 (25.8%) |
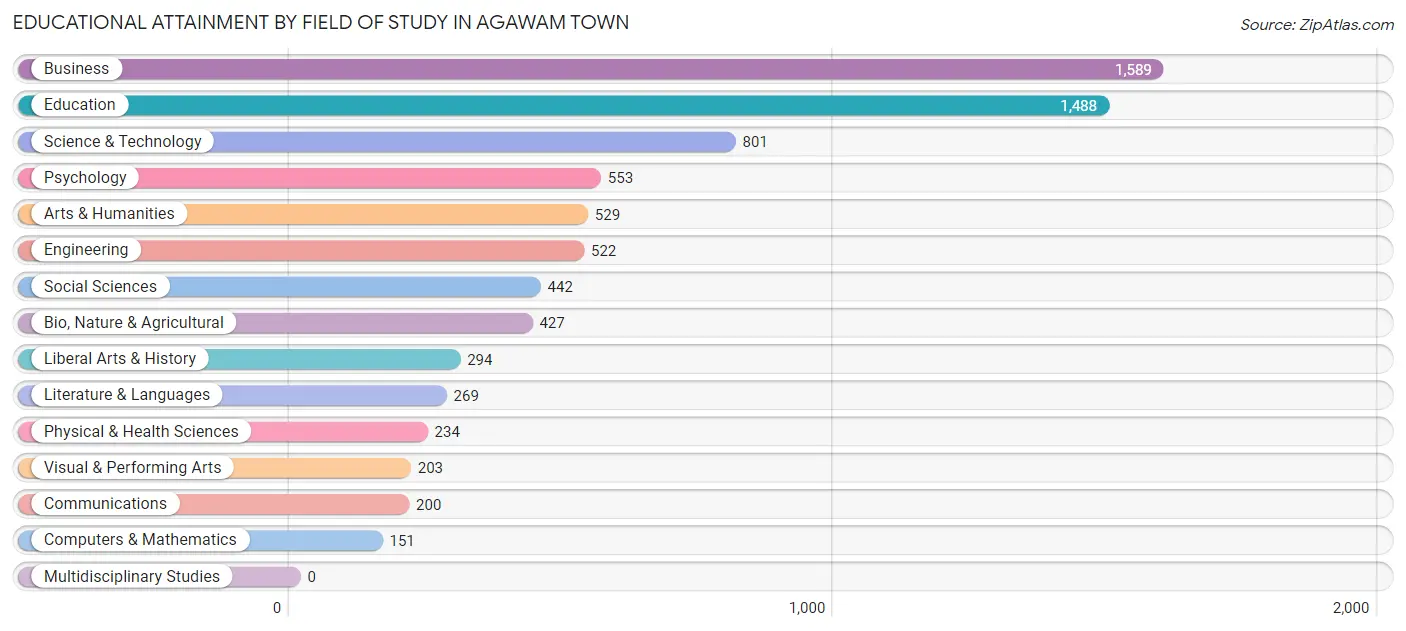
Educational Attainment by Field of Study in Agawam Town
Business (1,589 | 20.6%), education (1,488 | 19.3%), science & technology (801 | 10.4%), psychology (553 | 7.2%), and arts & humanities (529 | 6.9%) are the most common fields of study among 7,702 individuals in Agawam Town who have obtained a bachelor's degree or higher.
| Field of Study | # Graduates | % Graduates |
| Computers & Mathematics | 151 | 2.0% |
| Bio, Nature & Agricultural | 427 | 5.5% |
| Physical & Health Sciences | 234 | 3.0% |
| Psychology | 553 | 7.2% |
| Social Sciences | 442 | 5.7% |
| Engineering | 522 | 6.8% |
| Multidisciplinary Studies | 0 | 0.0% |
| Science & Technology | 801 | 10.4% |
| Business | 1,589 | 20.6% |
| Education | 1,488 | 19.3% |
| Literature & Languages | 269 | 3.5% |
| Liberal Arts & History | 294 | 3.8% |
| Visual & Performing Arts | 203 | 2.6% |
| Communications | 200 | 2.6% |
| Arts & Humanities | 529 | 6.9% |
| Total | 7,702 | 100.0% |
Transportation & Commute in Agawam Town
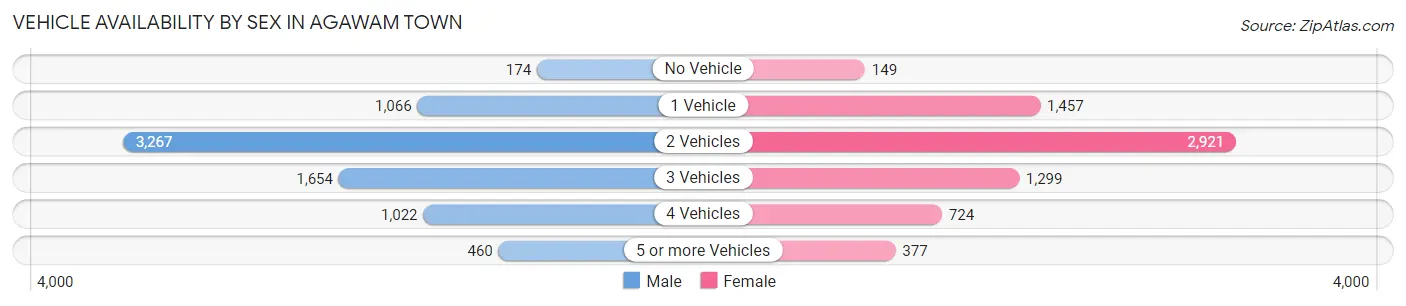
Vehicle Availability by Sex in Agawam Town
The most prevalent vehicle ownership categories in Agawam Town are males with 2 vehicles (3,267, accounting for 42.7%) and females with 2 vehicles (2,921, making up 47.2%).
| Vehicles Available | Male | Female |
| No Vehicle | 174 (2.3%) | 149 (2.1%) |
| 1 Vehicle | 1,066 (14.0%) | 1,457 (21.0%) |
| 2 Vehicles | 3,267 (42.7%) | 2,921 (42.2%) |
| 3 Vehicles | 1,654 (21.6%) | 1,299 (18.8%) |
| 4 Vehicles | 1,022 (13.4%) | 724 (10.4%) |
| 5 or more Vehicles | 460 (6.0%) | 377 (5.4%) |
| Total | 7,643 (100.0%) | 6,927 (100.0%) |
Commute Time in Agawam Town
The most frequently occuring commute durations in Agawam Town are 15 to 19 minutes (2,980 commuters, 22.5%), 20 to 24 minutes (2,546 commuters, 19.2%), and 10 to 14 minutes (1,886 commuters, 14.2%).
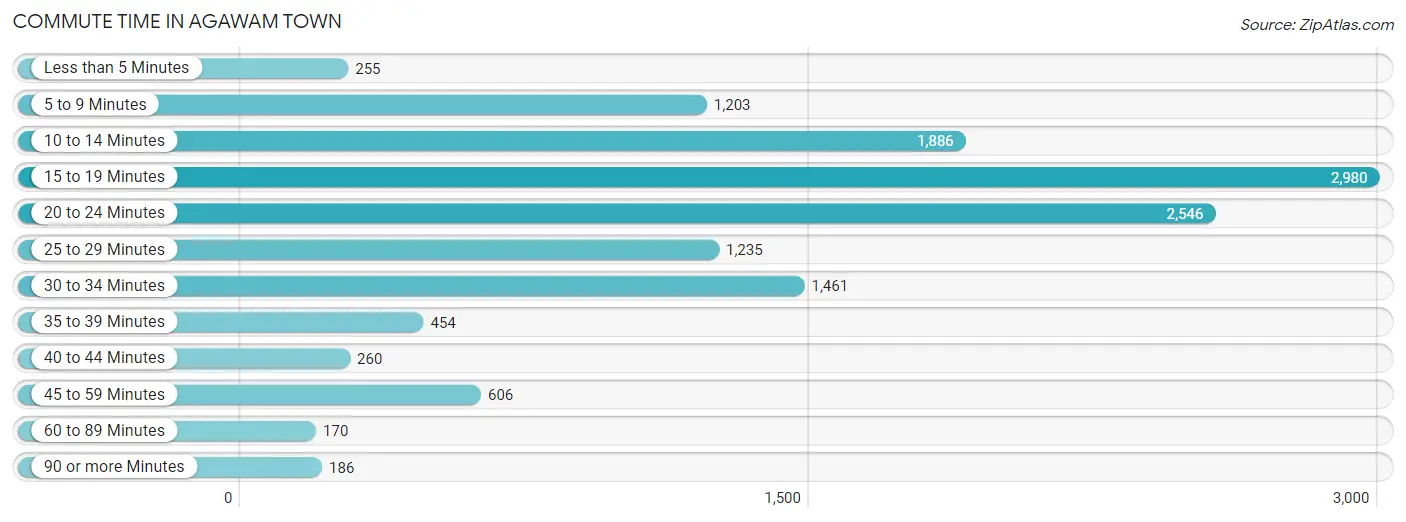
| Commute Time | # Commuters | % Commuters |
| Less than 5 Minutes | 255 | 1.9% |
| 5 to 9 Minutes | 1,203 | 9.1% |
| 10 to 14 Minutes | 1,886 | 14.2% |
| 15 to 19 Minutes | 2,980 | 22.5% |
| 20 to 24 Minutes | 2,546 | 19.2% |
| 25 to 29 Minutes | 1,235 | 9.3% |
| 30 to 34 Minutes | 1,461 | 11.0% |
| 35 to 39 Minutes | 454 | 3.4% |
| 40 to 44 Minutes | 260 | 2.0% |
| 45 to 59 Minutes | 606 | 4.6% |
| 60 to 89 Minutes | 170 | 1.3% |
| 90 or more Minutes | 186 | 1.4% |
Commute Time by Sex in Agawam Town
The most common commute times in Agawam Town are 15 to 19 minutes (1,542 commuters, 22.2%) for males and 20 to 24 minutes (1,469 commuters, 23.3%) for females.
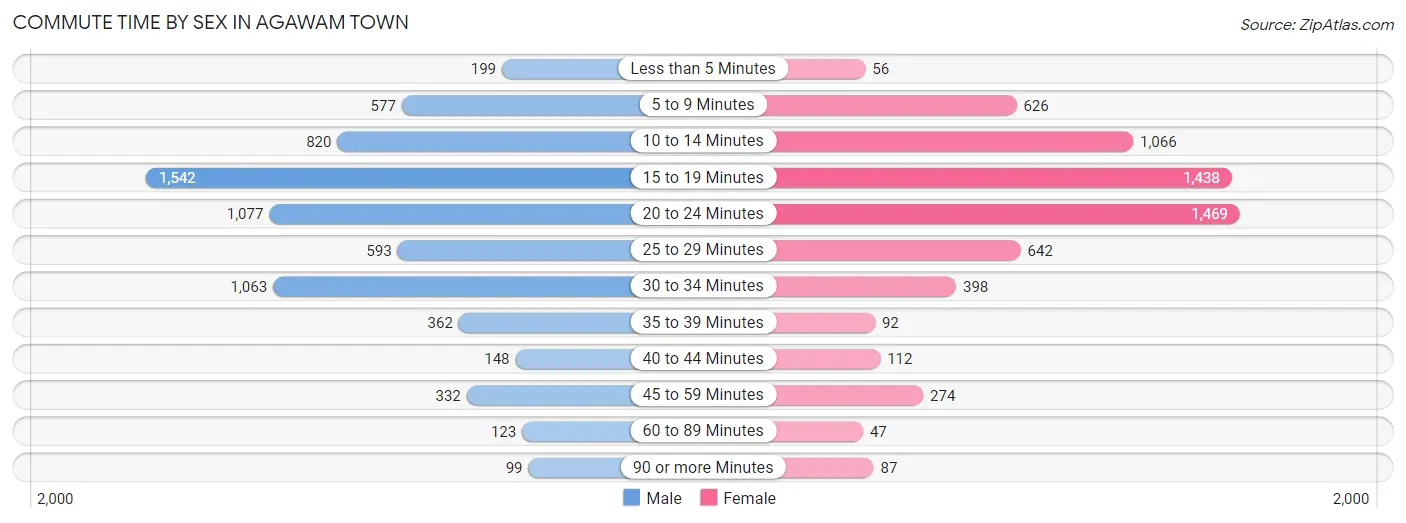
| Commute Time | Male | Female |
| Less than 5 Minutes | 199 (2.9%) | 56 (0.9%) |
| 5 to 9 Minutes | 577 (8.3%) | 626 (9.9%) |
| 10 to 14 Minutes | 820 (11.8%) | 1,066 (16.9%) |
| 15 to 19 Minutes | 1,542 (22.2%) | 1,438 (22.8%) |
| 20 to 24 Minutes | 1,077 (15.5%) | 1,469 (23.3%) |
| 25 to 29 Minutes | 593 (8.6%) | 642 (10.2%) |
| 30 to 34 Minutes | 1,063 (15.3%) | 398 (6.3%) |
| 35 to 39 Minutes | 362 (5.2%) | 92 (1.5%) |
| 40 to 44 Minutes | 148 (2.1%) | 112 (1.8%) |
| 45 to 59 Minutes | 332 (4.8%) | 274 (4.3%) |
| 60 to 89 Minutes | 123 (1.8%) | 47 (0.7%) |
| 90 or more Minutes | 99 (1.4%) | 87 (1.4%) |
Time of Departure to Work by Sex in Agawam Town
The most frequent times of departure to work in Agawam Town are 7:00 AM to 7:29 AM (1,188, 17.1%) for males and 7:30 AM to 7:59 AM (1,069, 17.0%) for females.
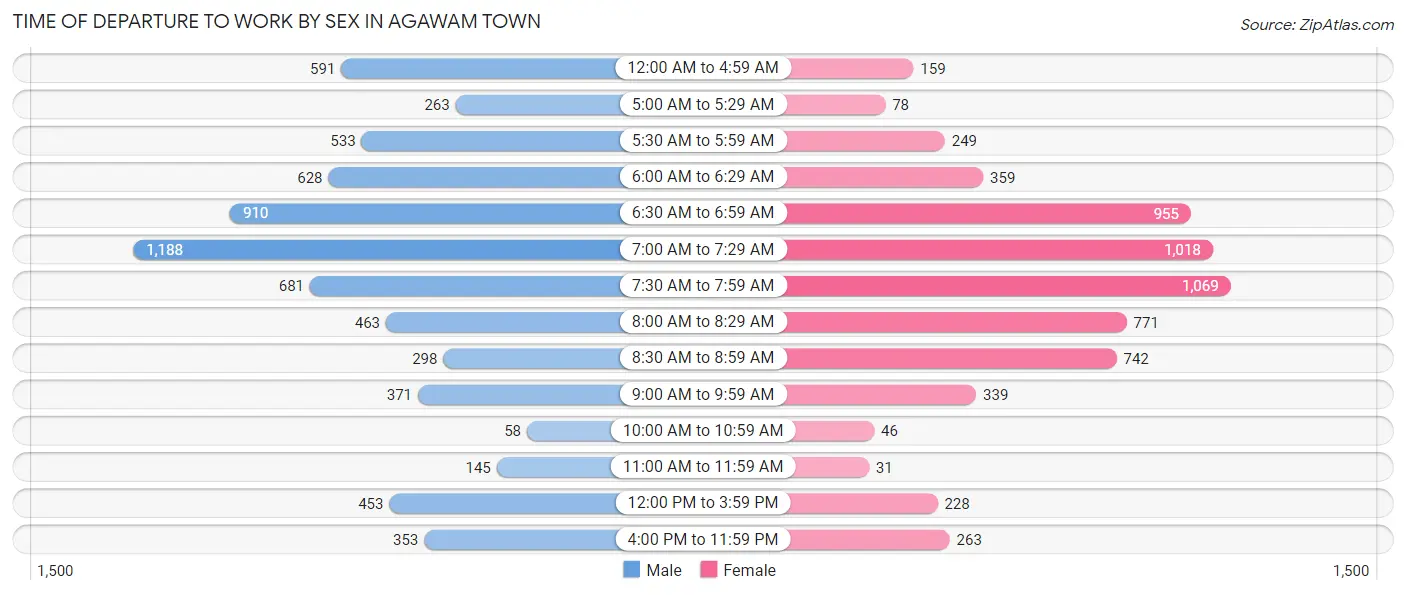
| Time of Departure | Male | Female |
| 12:00 AM to 4:59 AM | 591 (8.5%) | 159 (2.5%) |
| 5:00 AM to 5:29 AM | 263 (3.8%) | 78 (1.2%) |
| 5:30 AM to 5:59 AM | 533 (7.7%) | 249 (4.0%) |
| 6:00 AM to 6:29 AM | 628 (9.1%) | 359 (5.7%) |
| 6:30 AM to 6:59 AM | 910 (13.1%) | 955 (15.1%) |
| 7:00 AM to 7:29 AM | 1,188 (17.1%) | 1,018 (16.1%) |
| 7:30 AM to 7:59 AM | 681 (9.8%) | 1,069 (17.0%) |
| 8:00 AM to 8:29 AM | 463 (6.7%) | 771 (12.2%) |
| 8:30 AM to 8:59 AM | 298 (4.3%) | 742 (11.8%) |
| 9:00 AM to 9:59 AM | 371 (5.3%) | 339 (5.4%) |
| 10:00 AM to 10:59 AM | 58 (0.8%) | 46 (0.7%) |
| 11:00 AM to 11:59 AM | 145 (2.1%) | 31 (0.5%) |
| 12:00 PM to 3:59 PM | 453 (6.5%) | 228 (3.6%) |
| 4:00 PM to 11:59 PM | 353 (5.1%) | 263 (4.2%) |
| Total | 6,935 (100.0%) | 6,307 (100.0%) |
Housing Occupancy in Agawam Town
Occupancy by Ownership in Agawam Town
Of the total 11,577 dwellings in Agawam Town, owner-occupied units account for 8,614 (74.4%), while renter-occupied units make up 2,963 (25.6%).
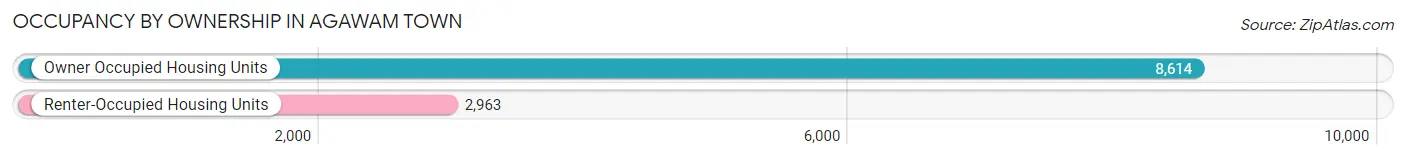
| Occupancy | # Housing Units | % Housing Units |
| Owner Occupied Housing Units | 8,614 | 74.4% |
| Renter-Occupied Housing Units | 2,963 | 25.6% |
| Total Occupied Housing Units | 11,577 | 100.0% |
Occupancy by Household Size in Agawam Town
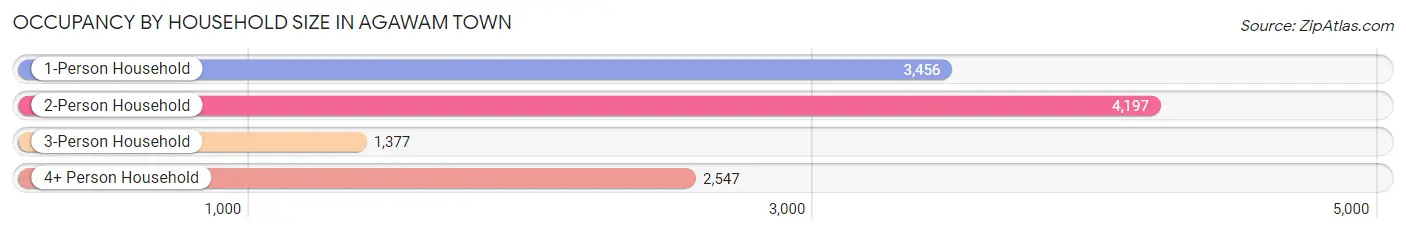
| Household Size | # Housing Units | % Housing Units |
| 1-Person Household | 3,456 | 29.8% |
| 2-Person Household | 4,197 | 36.2% |
| 3-Person Household | 1,377 | 11.9% |
| 4+ Person Household | 2,547 | 22.0% |
| Total Housing Units | 11,577 | 100.0% |
Occupancy by Ownership by Household Size in Agawam Town
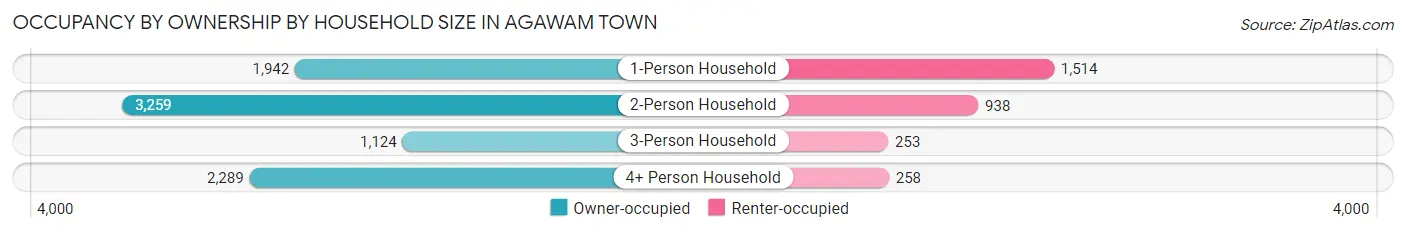
| Household Size | Owner-occupied | Renter-occupied |
| 1-Person Household | 1,942 (56.2%) | 1,514 (43.8%) |
| 2-Person Household | 3,259 (77.6%) | 938 (22.4%) |
| 3-Person Household | 1,124 (81.6%) | 253 (18.4%) |
| 4+ Person Household | 2,289 (89.9%) | 258 (10.1%) |
| Total Housing Units | 8,614 (74.4%) | 2,963 (25.6%) |
Occupancy by Educational Attainment in Agawam Town
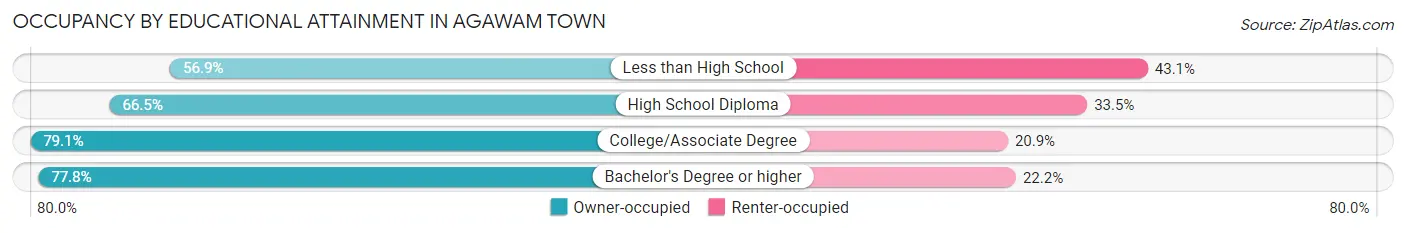
| Household Size | Owner-occupied | Renter-occupied |
| Less than High School | 243 (56.9%) | 184 (43.1%) |
| High School Diploma | 2,091 (66.5%) | 1,052 (33.5%) |
| College/Associate Degree | 3,031 (79.1%) | 801 (20.9%) |
| Bachelor's Degree or higher | 3,249 (77.8%) | 926 (22.2%) |
Occupancy by Age of Householder in Agawam Town
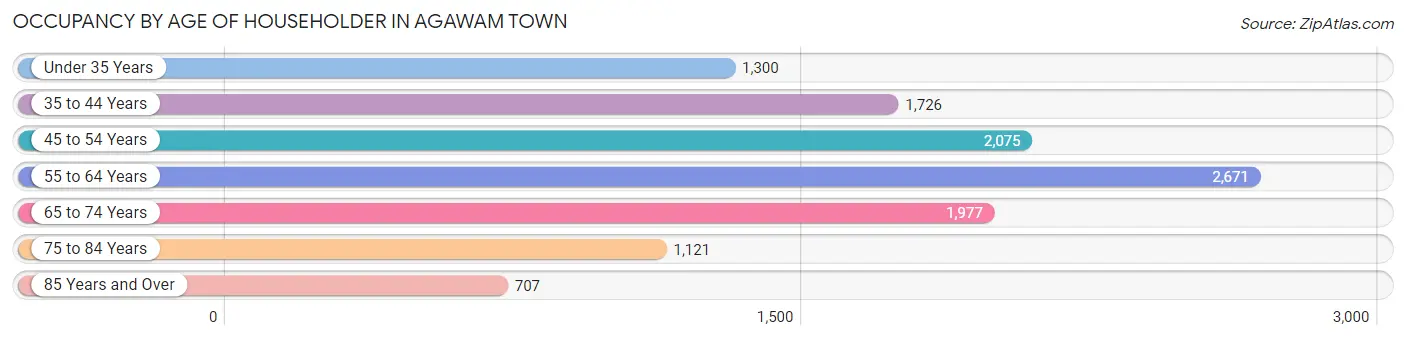
| Age Bracket | # Households | % Households |
| Under 35 Years | 1,300 | 11.2% |
| 35 to 44 Years | 1,726 | 14.9% |
| 45 to 54 Years | 2,075 | 17.9% |
| 55 to 64 Years | 2,671 | 23.1% |
| 65 to 74 Years | 1,977 | 17.1% |
| 75 to 84 Years | 1,121 | 9.7% |
| 85 Years and Over | 707 | 6.1% |
| Total | 11,577 | 100.0% |
Housing Finances in Agawam Town
Median Income by Occupancy in Agawam Town
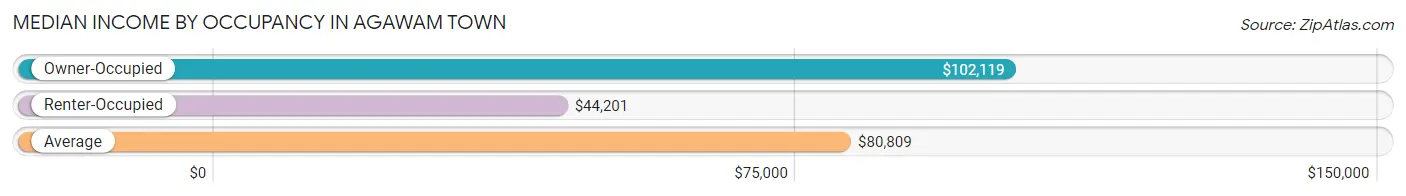
| Occupancy Type | # Households | Median Income |
| Owner-Occupied | 8,614 (74.4%) | $102,119 |
| Renter-Occupied | 2,963 (25.6%) | $44,201 |
| Average | 11,577 (100.0%) | $80,809 |
Occupancy by Householder Income Bracket in Agawam Town
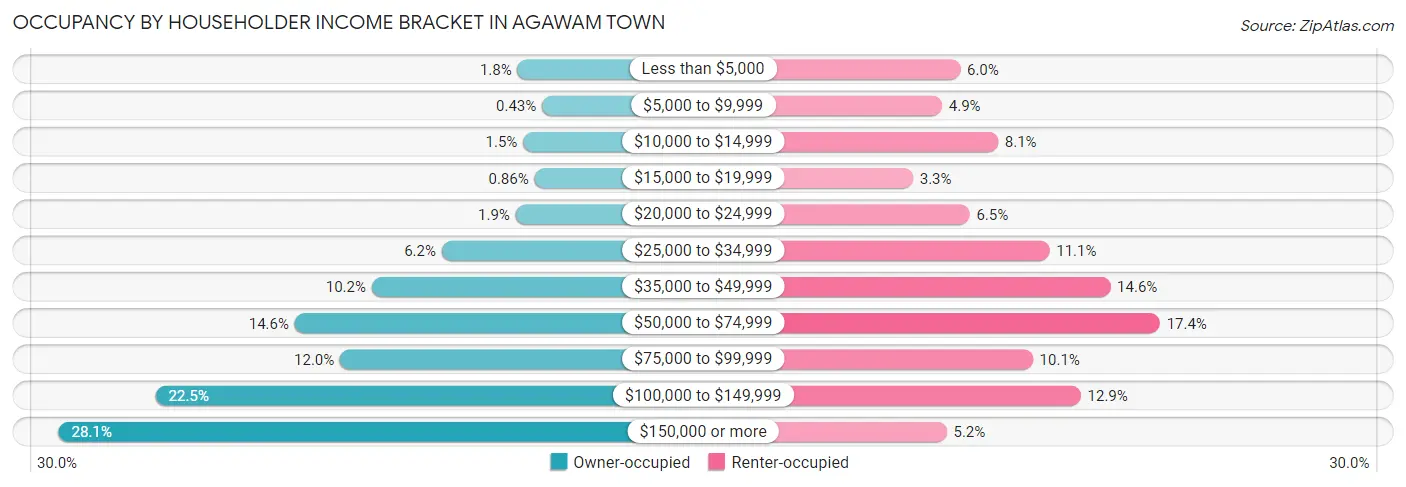
| Income Bracket | Owner-occupied | Renter-occupied |
| Less than $5,000 | 158 (1.8%) | 177 (6.0%) |
| $5,000 to $9,999 | 37 (0.4%) | 146 (4.9%) |
| $10,000 to $14,999 | 130 (1.5%) | 241 (8.1%) |
| $15,000 to $19,999 | 74 (0.9%) | 97 (3.3%) |
| $20,000 to $24,999 | 167 (1.9%) | 193 (6.5%) |
| $25,000 to $34,999 | 531 (6.2%) | 328 (11.1%) |
| $35,000 to $49,999 | 875 (10.2%) | 431 (14.5%) |
| $50,000 to $74,999 | 1,254 (14.6%) | 515 (17.4%) |
| $75,000 to $99,999 | 1,031 (12.0%) | 300 (10.1%) |
| $100,000 to $149,999 | 1,940 (22.5%) | 381 (12.9%) |
| $150,000 or more | 2,417 (28.1%) | 154 (5.2%) |
| Total | 8,614 (100.0%) | 2,963 (100.0%) |
Monthly Housing Cost Tiers in Agawam Town
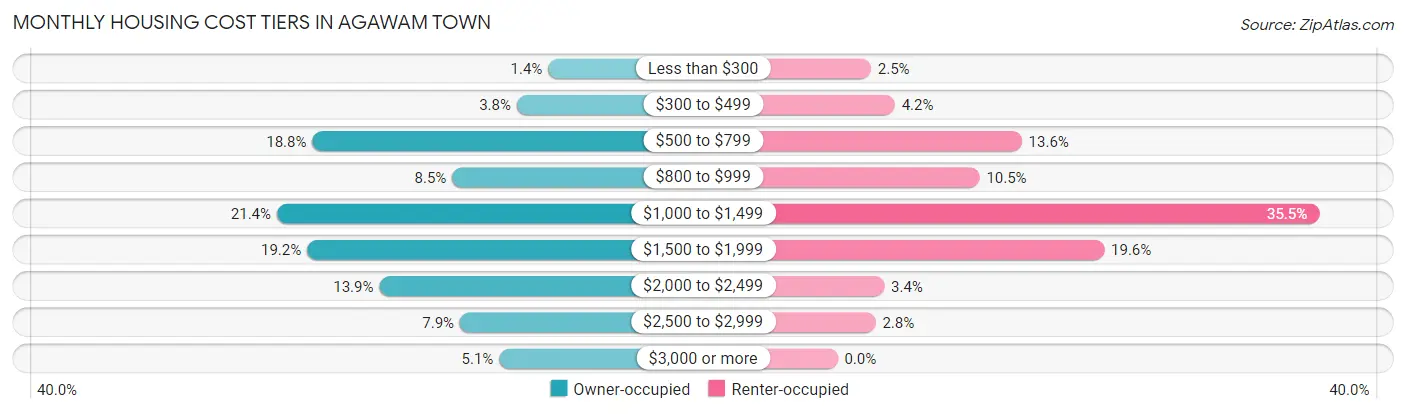
| Monthly Cost | Owner-occupied | Renter-occupied |
| Less than $300 | 124 (1.4%) | 73 (2.5%) |
| $300 to $499 | 323 (3.7%) | 125 (4.2%) |
| $500 to $799 | 1,620 (18.8%) | 402 (13.6%) |
| $800 to $999 | 733 (8.5%) | 310 (10.5%) |
| $1,000 to $1,499 | 1,845 (21.4%) | 1,051 (35.5%) |
| $1,500 to $1,999 | 1,654 (19.2%) | 582 (19.6%) |
| $2,000 to $2,499 | 1,196 (13.9%) | 102 (3.4%) |
| $2,500 to $2,999 | 684 (7.9%) | 83 (2.8%) |
| $3,000 or more | 435 (5.1%) | 0 (0.0%) |
| Total | 8,614 (100.0%) | 2,963 (100.0%) |
Physical Housing Characteristics in Agawam Town
Housing Structures in Agawam Town
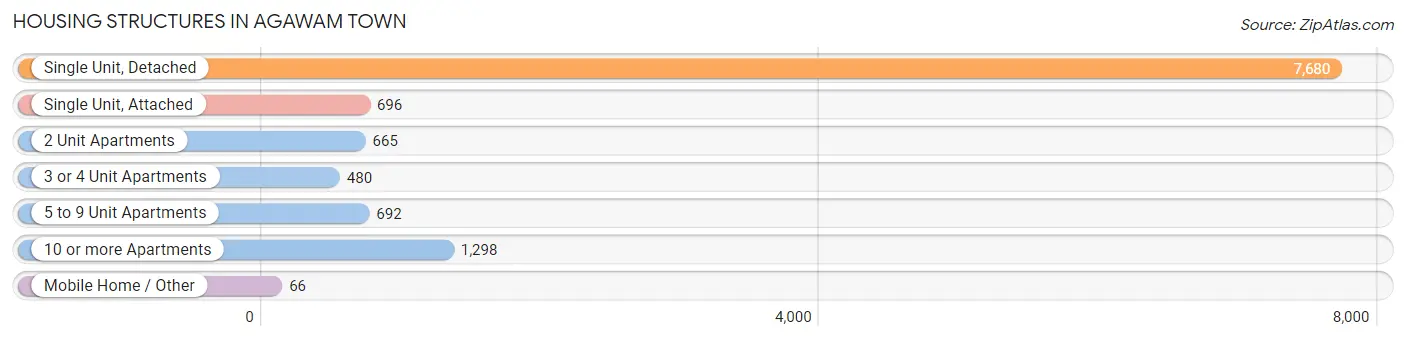
| Structure Type | # Housing Units | % Housing Units |
| Single Unit, Detached | 7,680 | 66.3% |
| Single Unit, Attached | 696 | 6.0% |
| 2 Unit Apartments | 665 | 5.7% |
| 3 or 4 Unit Apartments | 480 | 4.2% |
| 5 to 9 Unit Apartments | 692 | 6.0% |
| 10 or more Apartments | 1,298 | 11.2% |
| Mobile Home / Other | 66 | 0.6% |
| Total | 11,577 | 100.0% |
Housing Structures by Occupancy in Agawam Town
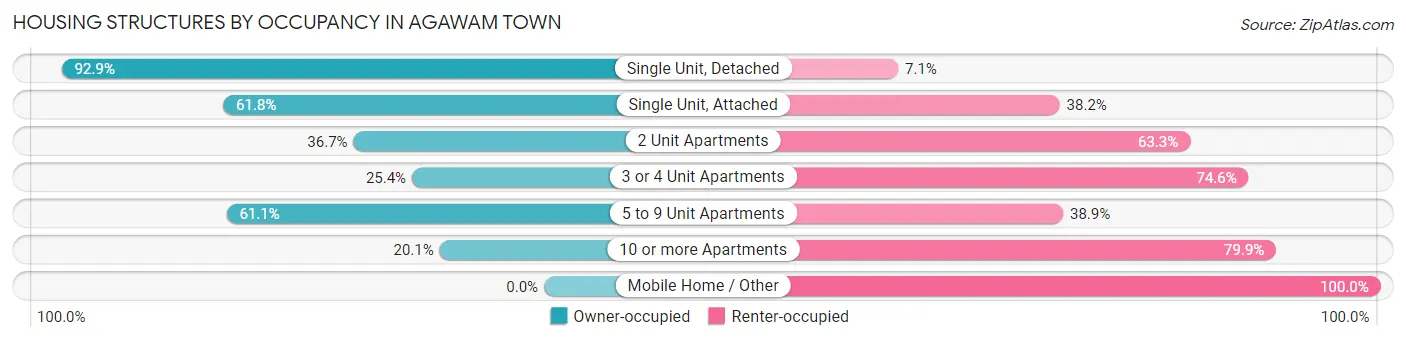
| Structure Type | Owner-occupied | Renter-occupied |
| Single Unit, Detached | 7,134 (92.9%) | 546 (7.1%) |
| Single Unit, Attached | 430 (61.8%) | 266 (38.2%) |
| 2 Unit Apartments | 244 (36.7%) | 421 (63.3%) |
| 3 or 4 Unit Apartments | 122 (25.4%) | 358 (74.6%) |
| 5 to 9 Unit Apartments | 423 (61.1%) | 269 (38.9%) |
| 10 or more Apartments | 261 (20.1%) | 1,037 (79.9%) |
| Mobile Home / Other | 0 (0.0%) | 66 (100.0%) |
| Total | 8,614 (74.4%) | 2,963 (25.6%) |
Housing Structures by Number of Rooms in Agawam Town
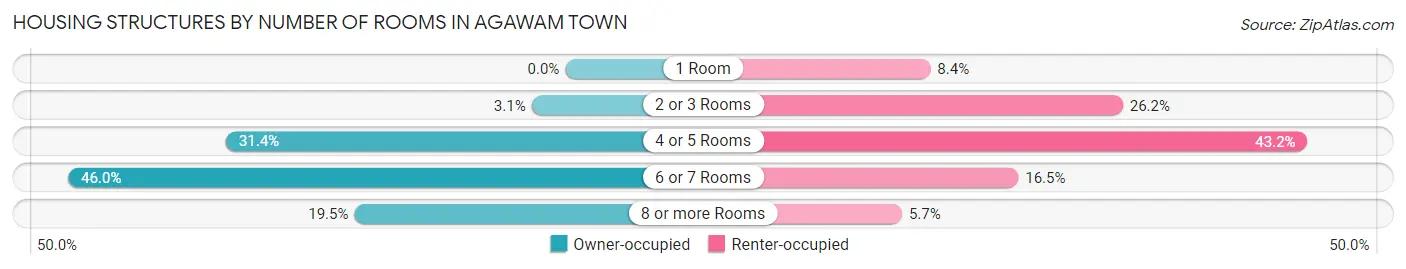
| Number of Rooms | Owner-occupied | Renter-occupied |
| 1 Room | 0 (0.0%) | 248 (8.4%) |
| 2 or 3 Rooms | 269 (3.1%) | 775 (26.2%) |
| 4 or 5 Rooms | 2,703 (31.4%) | 1,281 (43.2%) |
| 6 or 7 Rooms | 3,961 (46.0%) | 489 (16.5%) |
| 8 or more Rooms | 1,681 (19.5%) | 170 (5.7%) |
| Total | 8,614 (100.0%) | 2,963 (100.0%) |
Housing Structure by Heating Type in Agawam Town
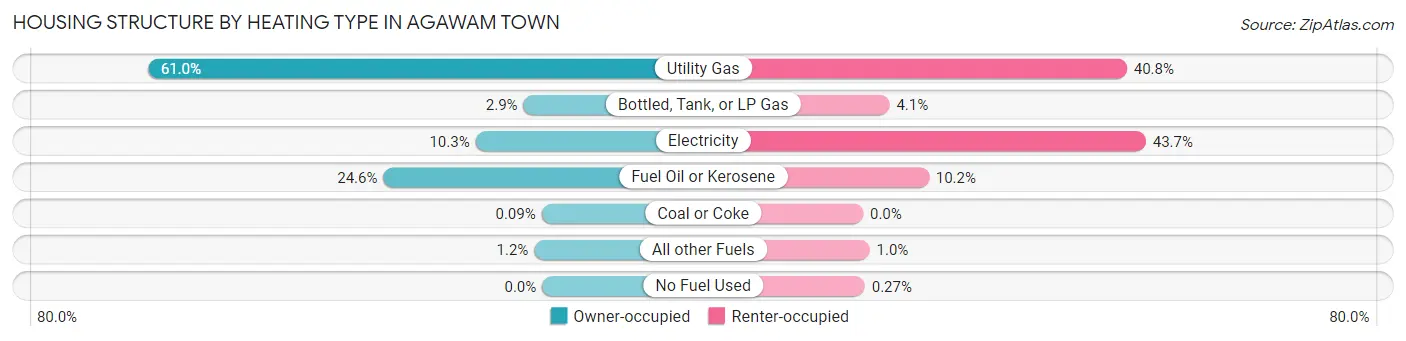
| Heating Type | Owner-occupied | Renter-occupied |
| Utility Gas | 5,250 (61.0%) | 1,208 (40.8%) |
| Bottled, Tank, or LP Gas | 249 (2.9%) | 121 (4.1%) |
| Electricity | 887 (10.3%) | 1,295 (43.7%) |
| Fuel Oil or Kerosene | 2,115 (24.5%) | 301 (10.2%) |
| Coal or Coke | 8 (0.1%) | 0 (0.0%) |
| All other Fuels | 105 (1.2%) | 30 (1.0%) |
| No Fuel Used | 0 (0.0%) | 8 (0.3%) |
| Total | 8,614 (100.0%) | 2,963 (100.0%) |
Household Vehicle Usage in Agawam Town
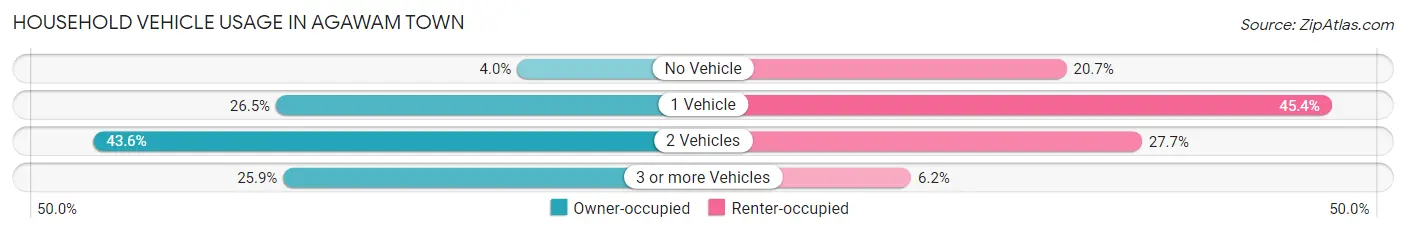
| Vehicles per Household | Owner-occupied | Renter-occupied |
| No Vehicle | 346 (4.0%) | 613 (20.7%) |
| 1 Vehicle | 2,286 (26.5%) | 1,346 (45.4%) |
| 2 Vehicles | 3,754 (43.6%) | 821 (27.7%) |
| 3 or more Vehicles | 2,228 (25.9%) | 183 (6.2%) |
| Total | 8,614 (100.0%) | 2,963 (100.0%) |
Real Estate & Mortgages in Agawam Town
Real Estate and Mortgage Overview in Agawam Town
| Characteristic | Without Mortgage | With Mortgage |
| Housing Units | 3,148 | 5,466 |
| Median Property Value | $260,500 | $277,900 |
| Median Household Income | $71,396 | $1,941 |
| Monthly Housing Costs | $744 | $435 |
| Real Estate Taxes | $3,779 | $136 |
Property Value by Mortgage Status in Agawam Town
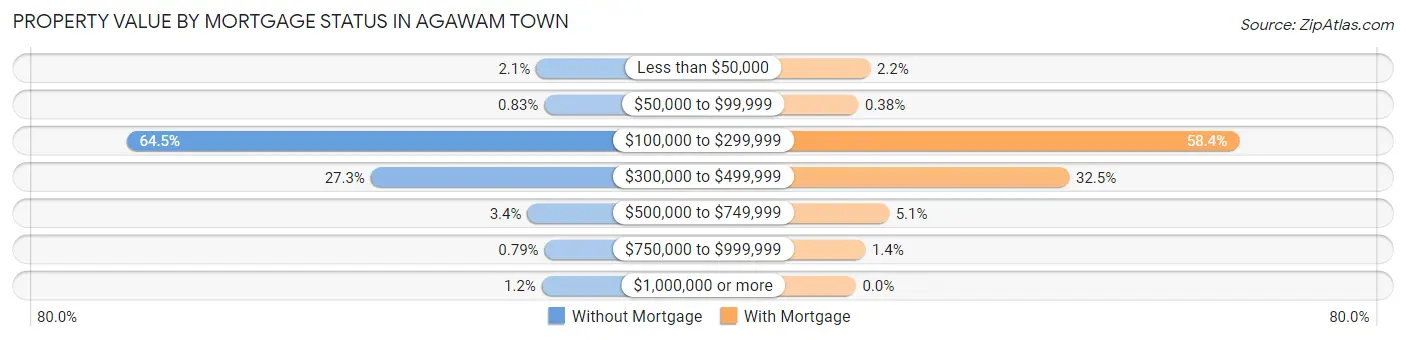
| Property Value | Without Mortgage | With Mortgage |
| Less than $50,000 | 65 (2.1%) | 120 (2.2%) |
| $50,000 to $99,999 | 26 (0.8%) | 21 (0.4%) |
| $100,000 to $299,999 | 2,029 (64.4%) | 3,193 (58.4%) |
| $300,000 to $499,999 | 858 (27.3%) | 1,778 (32.5%) |
| $500,000 to $749,999 | 107 (3.4%) | 276 (5.1%) |
| $750,000 to $999,999 | 25 (0.8%) | 78 (1.4%) |
| $1,000,000 or more | 38 (1.2%) | 0 (0.0%) |
| Total | 3,148 (100.0%) | 5,466 (100.0%) |
Household Income by Mortgage Status in Agawam Town
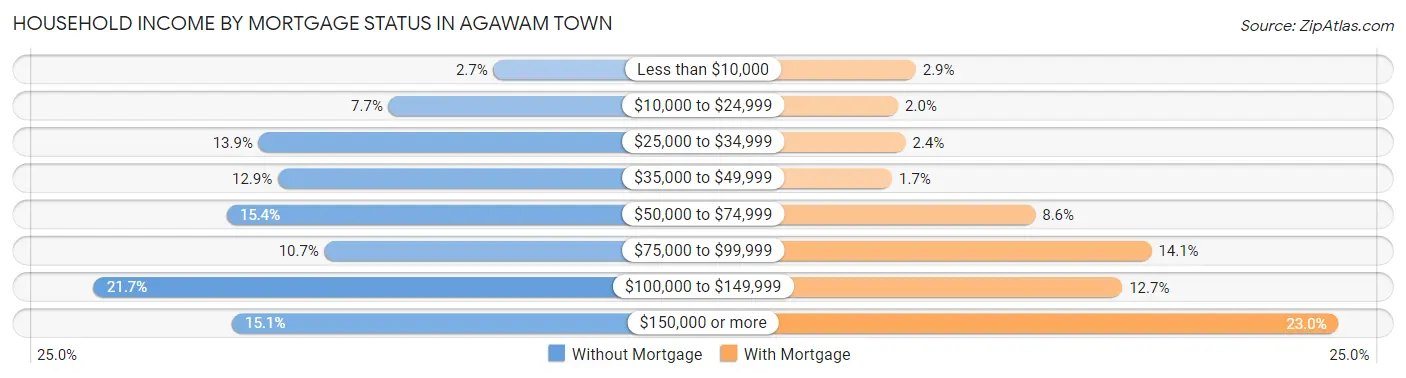
| Household Income | Without Mortgage | With Mortgage |
| Less than $10,000 | 84 (2.7%) | 157 (2.9%) |
| $10,000 to $24,999 | 241 (7.7%) | 111 (2.0%) |
| $25,000 to $34,999 | 436 (13.9%) | 130 (2.4%) |
| $35,000 to $49,999 | 407 (12.9%) | 95 (1.7%) |
| $50,000 to $74,999 | 484 (15.4%) | 468 (8.6%) |
| $75,000 to $99,999 | 337 (10.7%) | 770 (14.1%) |
| $100,000 to $149,999 | 683 (21.7%) | 694 (12.7%) |
| $150,000 or more | 476 (15.1%) | 1,257 (23.0%) |
| Total | 3,148 (100.0%) | 5,466 (100.0%) |
Property Value to Household Income Ratio in Agawam Town
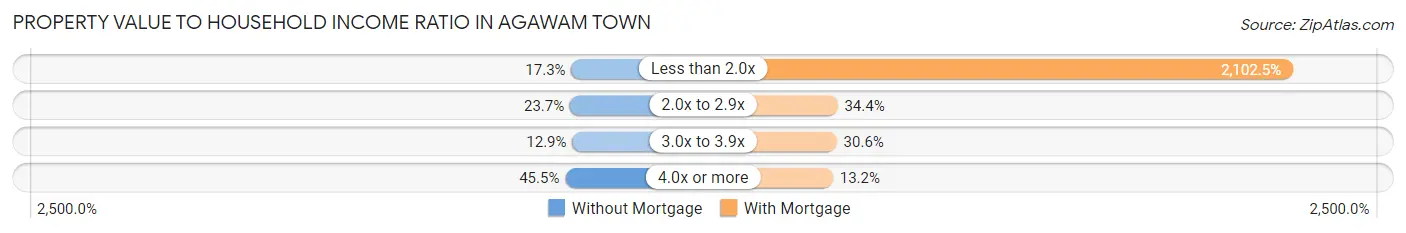
| Value-to-Income Ratio | Without Mortgage | With Mortgage |
| Less than 2.0x | 546 (17.3%) | 114,924 (2,102.5%) |
| 2.0x to 2.9x | 745 (23.7%) | 1,878 (34.4%) |
| 3.0x to 3.9x | 405 (12.9%) | 1,671 (30.6%) |
| 4.0x or more | 1,432 (45.5%) | 720 (13.2%) |
| Total | 3,148 (100.0%) | 5,466 (100.0%) |
Real Estate Taxes by Mortgage Status in Agawam Town
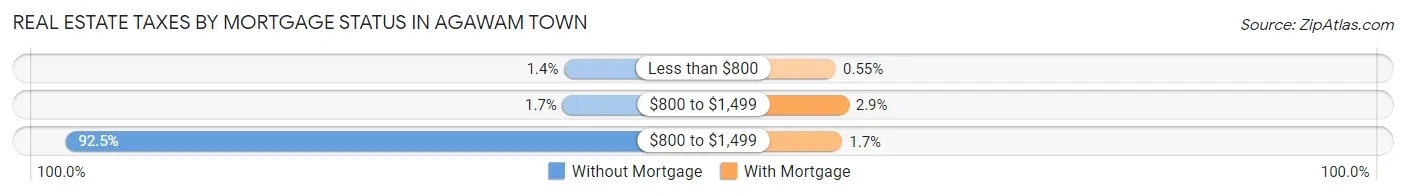
| Property Taxes | Without Mortgage | With Mortgage |
| Less than $800 | 45 (1.4%) | 30 (0.5%) |
| $800 to $1,499 | 54 (1.7%) | 157 (2.9%) |
| $800 to $1,499 | 2,913 (92.5%) | 93 (1.7%) |
| Total | 3,148 (100.0%) | 5,466 (100.0%) |
Health & Disability in Agawam Town
Health Insurance Coverage by Age in Agawam Town
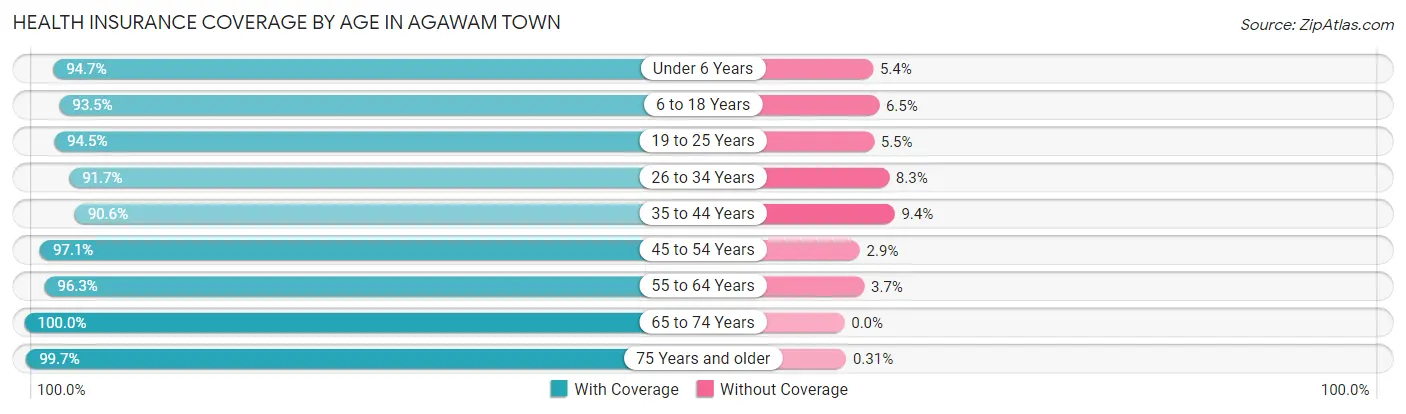
| Age Bracket | With Coverage | Without Coverage |
| Under 6 Years | 1,469 (94.7%) | 83 (5.3%) |
| 6 to 18 Years | 3,541 (93.5%) | 245 (6.5%) |
| 19 to 25 Years | 2,132 (94.5%) | 124 (5.5%) |
| 26 to 34 Years | 2,687 (91.7%) | 244 (8.3%) |
| 35 to 44 Years | 3,031 (90.6%) | 313 (9.4%) |
| 45 to 54 Years | 3,961 (97.1%) | 117 (2.9%) |
| 55 to 64 Years | 4,247 (96.3%) | 163 (3.7%) |
| 65 to 74 Years | 3,143 (100.0%) | 0 (0.0%) |
| 75 Years and older | 2,599 (99.7%) | 8 (0.3%) |
| Total | 26,810 (95.4%) | 1,297 (4.6%) |
Health Insurance Coverage by Citizenship Status in Agawam Town
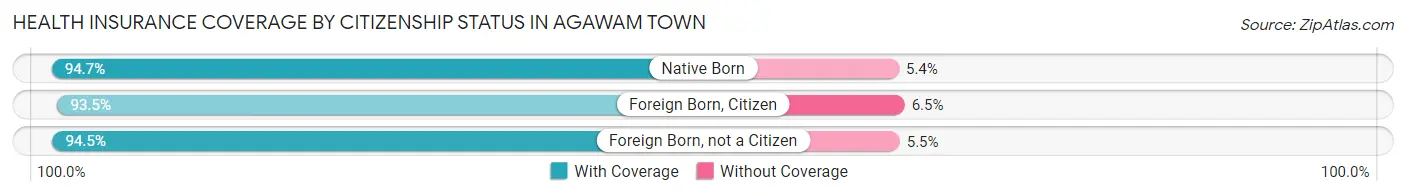
| Citizenship Status | With Coverage | Without Coverage |
| Native Born | 1,469 (94.7%) | 83 (5.3%) |
| Foreign Born, Citizen | 3,541 (93.5%) | 245 (6.5%) |
| Foreign Born, not a Citizen | 2,132 (94.5%) | 124 (5.5%) |
Health Insurance Coverage by Household Income in Agawam Town
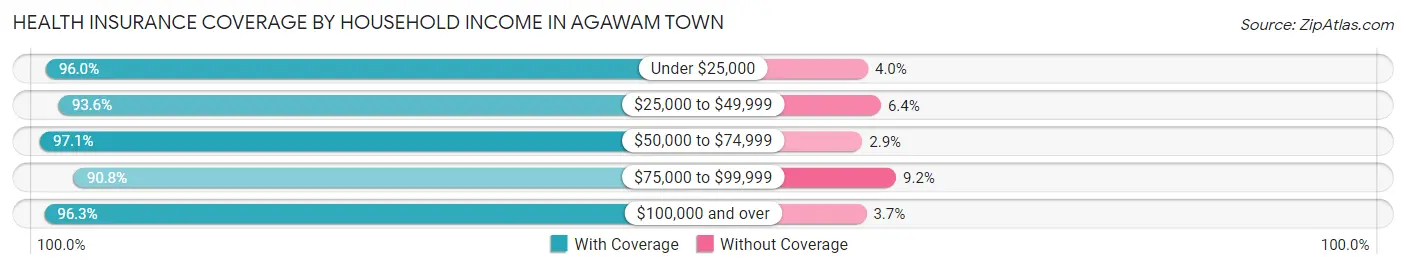
| Household Income | With Coverage | Without Coverage |
| Under $25,000 | 1,834 (96.0%) | 76 (4.0%) |
| $25,000 to $49,999 | 3,609 (93.6%) | 247 (6.4%) |
| $50,000 to $74,999 | 3,363 (97.1%) | 101 (2.9%) |
| $75,000 to $99,999 | 2,880 (90.8%) | 293 (9.2%) |
| $100,000 and over | 15,065 (96.3%) | 577 (3.7%) |
Public vs Private Health Insurance Coverage by Age in Agawam Town
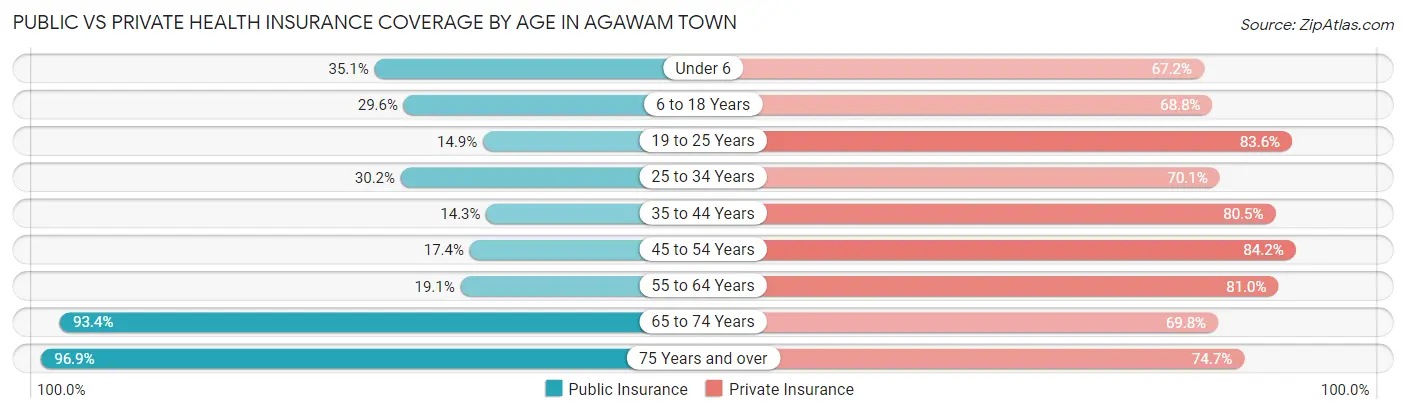
| Age Bracket | Public Insurance | Private Insurance |
| Under 6 | 544 (35.0%) | 1,043 (67.2%) |
| 6 to 18 Years | 1,121 (29.6%) | 2,604 (68.8%) |
| 19 to 25 Years | 336 (14.9%) | 1,885 (83.6%) |
| 25 to 34 Years | 884 (30.2%) | 2,055 (70.1%) |
| 35 to 44 Years | 478 (14.3%) | 2,691 (80.5%) |
| 45 to 54 Years | 708 (17.4%) | 3,435 (84.2%) |
| 55 to 64 Years | 842 (19.1%) | 3,573 (81.0%) |
| 65 to 74 Years | 2,936 (93.4%) | 2,194 (69.8%) |
| 75 Years and over | 2,526 (96.9%) | 1,946 (74.7%) |
| Total | 10,375 (36.9%) | 21,426 (76.2%) |
Disability Status by Sex by Age in Agawam Town
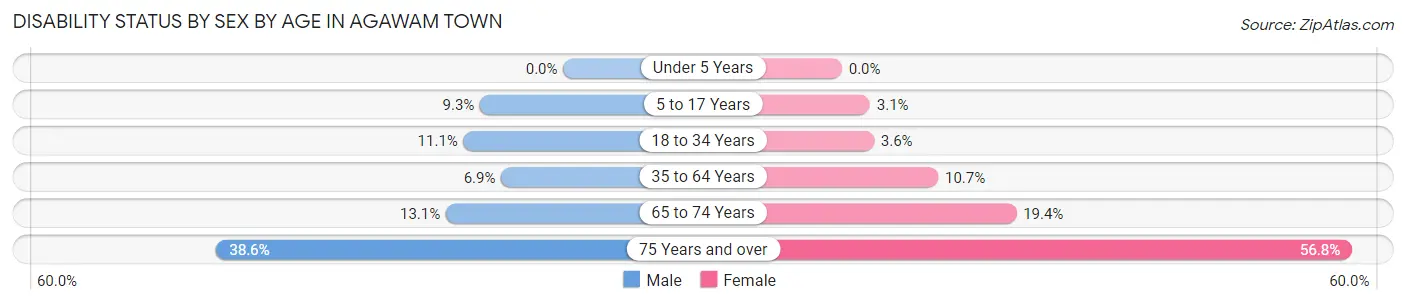
| Age Bracket | Male | Female |
| Under 5 Years | 0 (0.0%) | 0 (0.0%) |
| 5 to 17 Years | 197 (9.3%) | 53 (3.1%) |
| 18 to 34 Years | 316 (11.1%) | 93 (3.6%) |
| 35 to 64 Years | 394 (6.9%) | 657 (10.7%) |
| 65 to 74 Years | 194 (13.1%) | 322 (19.4%) |
| 75 Years and over | 381 (38.6%) | 921 (56.8%) |
Disability Class by Sex by Age in Agawam Town
Disability Class: Hearing Difficulty
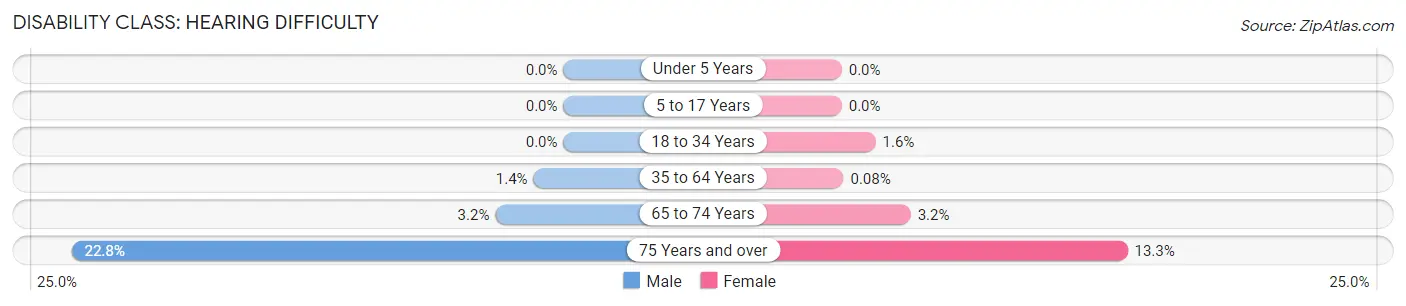
| Age Bracket | Male | Female |
| Under 5 Years | 0 (0.0%) | 0 (0.0%) |
| 5 to 17 Years | 0 (0.0%) | 0 (0.0%) |
| 18 to 34 Years | 0 (0.0%) | 41 (1.6%) |
| 35 to 64 Years | 79 (1.4%) | 5 (0.1%) |
| 65 to 74 Years | 47 (3.2%) | 53 (3.2%) |
| 75 Years and over | 225 (22.8%) | 215 (13.3%) |
Disability Class: Vision Difficulty
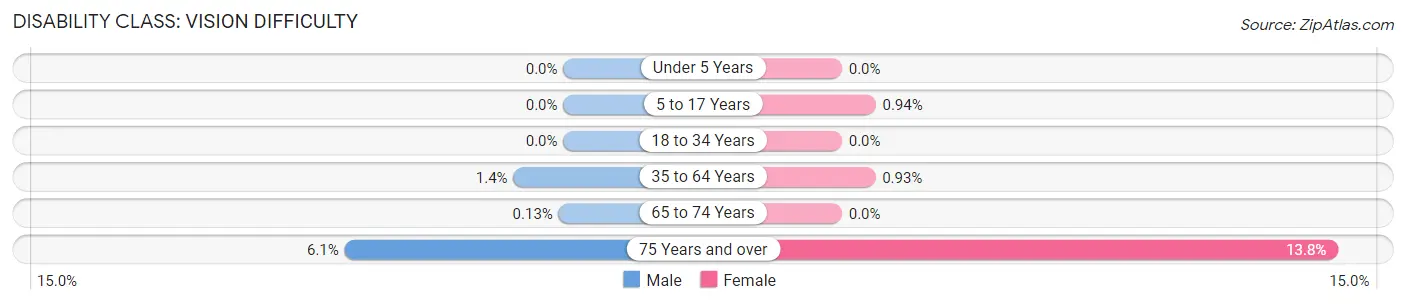
| Age Bracket | Male | Female |
| Under 5 Years | 0 (0.0%) | 0 (0.0%) |
| 5 to 17 Years | 0 (0.0%) | 16 (0.9%) |
| 18 to 34 Years | 0 (0.0%) | 0 (0.0%) |
| 35 to 64 Years | 79 (1.4%) | 57 (0.9%) |
| 65 to 74 Years | 2 (0.1%) | 0 (0.0%) |
| 75 Years and over | 60 (6.1%) | 224 (13.8%) |
Disability Class: Cognitive Difficulty
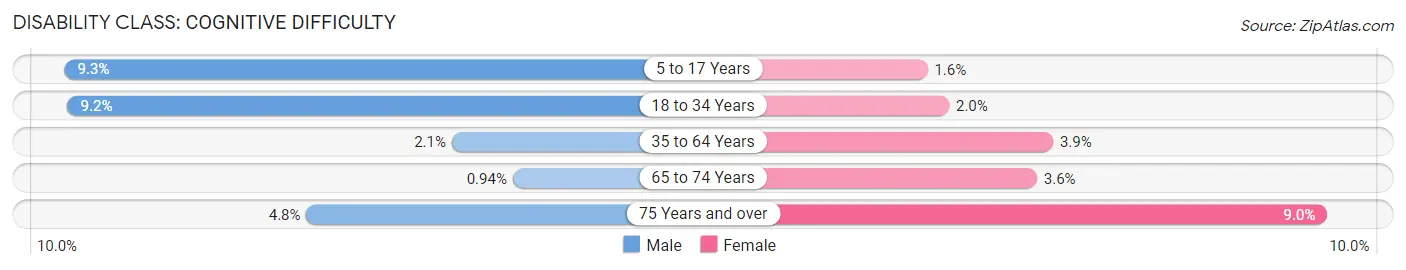
| Age Bracket | Male | Female |
| 5 to 17 Years | 197 (9.3%) | 27 (1.6%) |
| 18 to 34 Years | 262 (9.2%) | 52 (2.0%) |
| 35 to 64 Years | 118 (2.1%) | 240 (3.9%) |
| 65 to 74 Years | 14 (0.9%) | 60 (3.6%) |
| 75 Years and over | 47 (4.8%) | 146 (9.0%) |
Disability Class: Ambulatory Difficulty
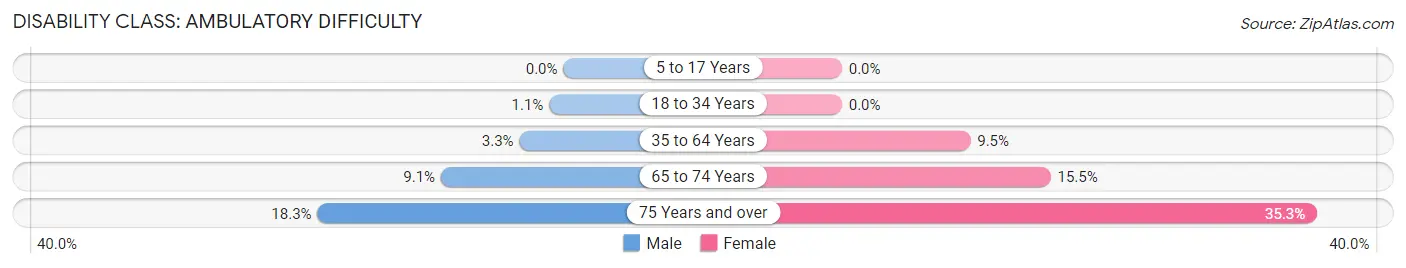
| Age Bracket | Male | Female |
| 5 to 17 Years | 0 (0.0%) | 0 (0.0%) |
| 18 to 34 Years | 30 (1.1%) | 0 (0.0%) |
| 35 to 64 Years | 186 (3.3%) | 585 (9.5%) |
| 65 to 74 Years | 135 (9.1%) | 257 (15.5%) |
| 75 Years and over | 180 (18.3%) | 572 (35.3%) |
Disability Class: Self-Care Difficulty
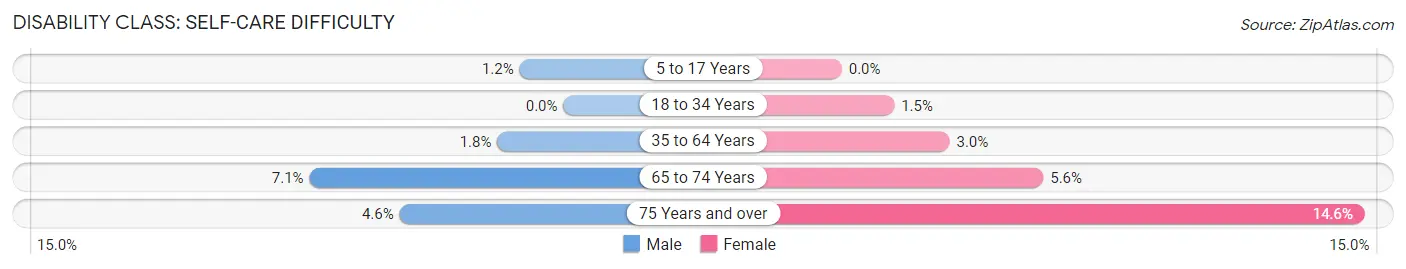
| Age Bracket | Male | Female |
| 5 to 17 Years | 26 (1.2%) | 0 (0.0%) |
| 18 to 34 Years | 0 (0.0%) | 38 (1.5%) |
| 35 to 64 Years | 105 (1.8%) | 184 (3.0%) |
| 65 to 74 Years | 105 (7.1%) | 93 (5.6%) |
| 75 Years and over | 45 (4.6%) | 236 (14.6%) |
Technology Access in Agawam Town
Computing Device Access in Agawam Town
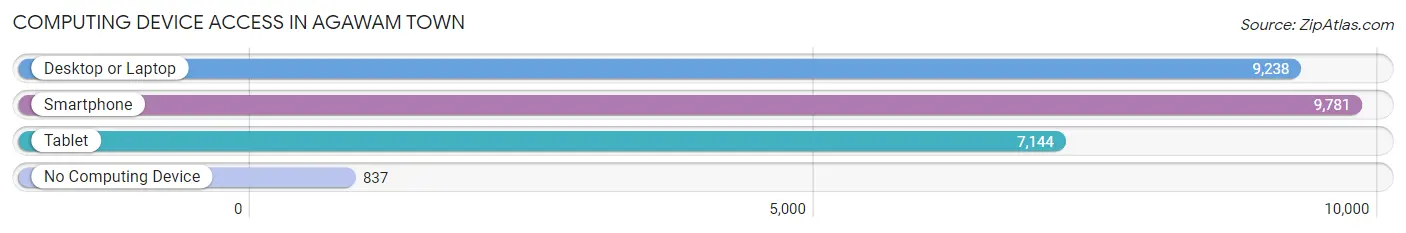
| Device Type | # Households | % Households |
| Desktop or Laptop | 9,238 | 79.8% |
| Smartphone | 9,781 | 84.5% |
| Tablet | 7,144 | 61.7% |
| No Computing Device | 837 | 7.2% |
| Total | 11,577 | 100.0% |
Internet Access in Agawam Town
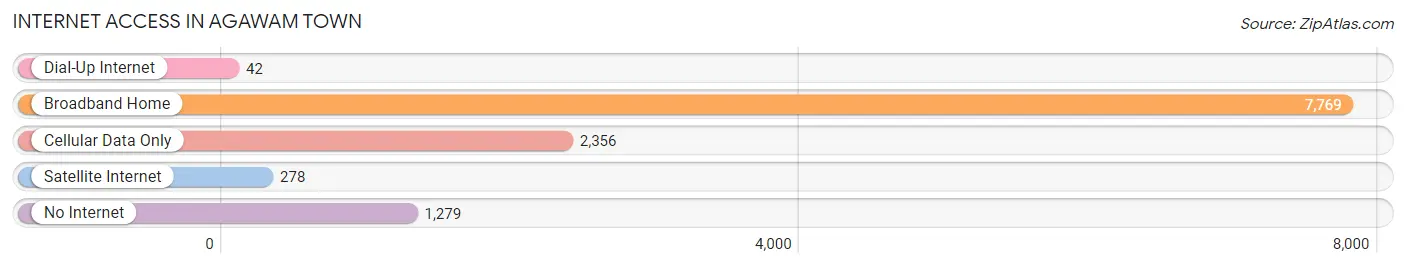
| Internet Type | # Households | % Households |
| Dial-Up Internet | 42 | 0.4% |
| Broadband Home | 7,769 | 67.1% |
| Cellular Data Only | 2,356 | 20.3% |
| Satellite Internet | 278 | 2.4% |
| No Internet | 1,279 | 11.1% |
| Total | 11,577 | 100.0% |
Agawam Town Summary
Agawam Town, MA is a town located in Hampden County, Massachusetts. It is situated on the eastern bank of the Connecticut River, just north of Springfield. The town has a population of approximately 28,000 people, making it the second largest town in Hampden County.
Agawam Town was first settled in 1636 by settlers from the Plymouth Colony. The town was originally known as "Rocksbury" and was part of the Agawam Plantation. The town was officially incorporated in 1775 and was named after the Agawam Indians, who were the original inhabitants of the area.
Geography
Agawam Town is located in the Pioneer Valley region of Massachusetts. It is bordered by the towns of West Springfield to the north, Longmeadow to the east, Wilbraham to the south, and Southwick to the west. The town is situated on the eastern bank of the Connecticut River, just north of Springfield. The town has a total area of 16.3 square miles, of which 15.9 square miles is land and 0.4 square miles is water.
The town is located in the Connecticut River Valley, which is characterized by rolling hills and valleys. The town is home to several parks and recreational areas, including the Agawam Town Common, the Agawam Town Beach, and the Agawam Town Forest.
Economy
Agawam Town is home to a variety of businesses and industries. The town is home to several large employers, including the Six Flags New England amusement park, the Agawam Industrial Park, and the Agawam Mall. The town is also home to several smaller businesses, including restaurants, retail stores, and professional services.
Agawam Town is also home to several educational institutions, including the Agawam Public Schools, the Agawam High School, and the Agawam Technical Institute.
Demographics
As of the 2010 census, Agawam Town had a population of 28,438 people. The racial makeup of the town was 87.3% White, 5.2% African American, 0.4% Native American, 2.3% Asian, 0.1% Pacific Islander, 2.2% from other races, and 2.5% from two or more races. Hispanic or Latino of any race were 5.2% of the population.
The median income for a household in Agawam Town was $60,945, and the median income for a family was $71,945. The per capita income for the town was $27,945. About 4.3% of families and 5.7% of the population were below the poverty line, including 6.7% of those under age 18 and 5.2% of those age 65 or over.
Agawam Town is a diverse community with a variety of cultures and backgrounds. The town is home to a variety of religious institutions, including churches, synagogues, and mosques. The town is also home to a variety of cultural organizations, including the Agawam Cultural Council and the Agawam Historical Society.
Common Questions
What is Per Capita Income in Agawam Town?
Per Capita income in Agawam Town is $43,172.
What is the Median Family Income in Agawam Town?
Median Family Income in Agawam Town is $107,401.
What is the Median Household income in Agawam Town?
Median Household Income in Agawam Town is $80,809.
What is Income or Wage Gap in Agawam Town?
Income or Wage Gap in Agawam Town is 18.5%.
Women in Agawam Town earn 81.5 cents for every dollar earned by a man.
What is Family Income Deficit in Agawam Town?
Family Income Deficit in Agawam Town is $7,226.
Families that are below poverty line in Agawam Town earn $7,226 less on average than the poverty threshold level.
What is Inequality or Gini Index in Agawam Town?
Inequality or Gini Index in Agawam Town is 0.44.
What is the Total Population of Agawam Town?
Total Population of Agawam Town is 28,606.
What is the Total Male Population of Agawam Town?
Total Male Population of Agawam Town is 14,029.
What is the Total Female Population of Agawam Town?
Total Female Population of Agawam Town is 14,577.
What is the Ratio of Males per 100 Females in Agawam Town?
There are 96.24 Males per 100 Females in Agawam Town.
What is the Ratio of Females per 100 Males in Agawam Town?
There are 103.91 Females per 100 Males in Agawam Town.
What is the Median Population Age in Agawam Town?
Median Population Age in Agawam Town is 46.0 Years.
What is the Average Family Size in Agawam Town
Average Family Size in Agawam Town is 3.0 People.
What is the Average Household Size in Agawam Town
Average Household Size in Agawam Town is 2.4 People.
How Large is the Labor Force in Agawam Town?
There are 15,595 People in the Labor Forcein in Agawam Town.
What is the Percentage of People in the Labor Force in Agawam Town?
64.8% of People are in the Labor Force in Agawam Town.
What is the Unemployment Rate in Agawam Town?
Unemployment Rate in Agawam Town is 5.2%.