Norwood, MA Map & Demographics
Norwood Map
Norwood Overview
$59,459
PER CAPITA INCOME
$124,455
AVG FAMILY INCOME
$98,653
AVG HOUSEHOLD INCOME
24.7%
WAGE / INCOME GAP [ % ]
75.3¢/ $1
WAGE / INCOME GAP [ $ ]
0.48
INEQUALITY / GINI INDEX
31,343
TOTAL POPULATION
15,499
MALE POPULATION
15,844
FEMALE POPULATION
97.82
MALES / 100 FEMALES
102.23
FEMALES / 100 MALES
39.0
MEDIAN AGE
3.0
AVG FAMILY SIZE
2.4
AVG HOUSEHOLD SIZE
18,597
LABOR FORCE [ PEOPLE ]
72.3%
PERCENT IN LABOR FORCE
3.6%
UNEMPLOYMENT RATE
Norwood Zip Codes
Income in Norwood
Income Overview in Norwood
Per Capita Income in Norwood is $59,459, while median incomes of families and households are $124,455 and $98,653 respectively.
| Characteristic | Number | Measure |
| Per Capita Income | 31,343 | $59,459 |
| Median Family Income | 8,023 | $124,455 |
| Mean Family Income | 8,023 | $161,169 |
| Median Household Income | 13,114 | $98,653 |
| Mean Household Income | 13,114 | $141,150 |
| Income Deficit | 8,023 | $0 |
| Wage / Income Gap (%) | 31,343 | 24.68% |
| Wage / Income Gap ($) | 31,343 | 75.32¢ per $1 |
| Gini / Inequality Index | 31,343 | 0.48 |
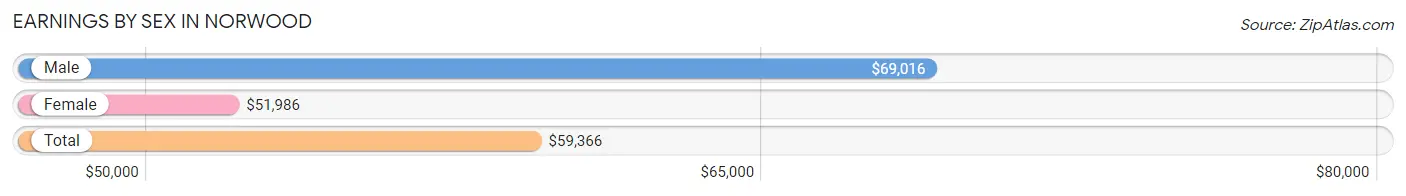
Earnings by Sex in Norwood
Average Earnings in Norwood are $59,366, $69,016 for men and $51,986 for women, a difference of 24.7%.
| Sex | Number | Average Earnings |
| Male | 9,807 (51.0%) | $69,016 |
| Female | 9,414 (49.0%) | $51,986 |
| Total | 19,221 (100.0%) | $59,366 |
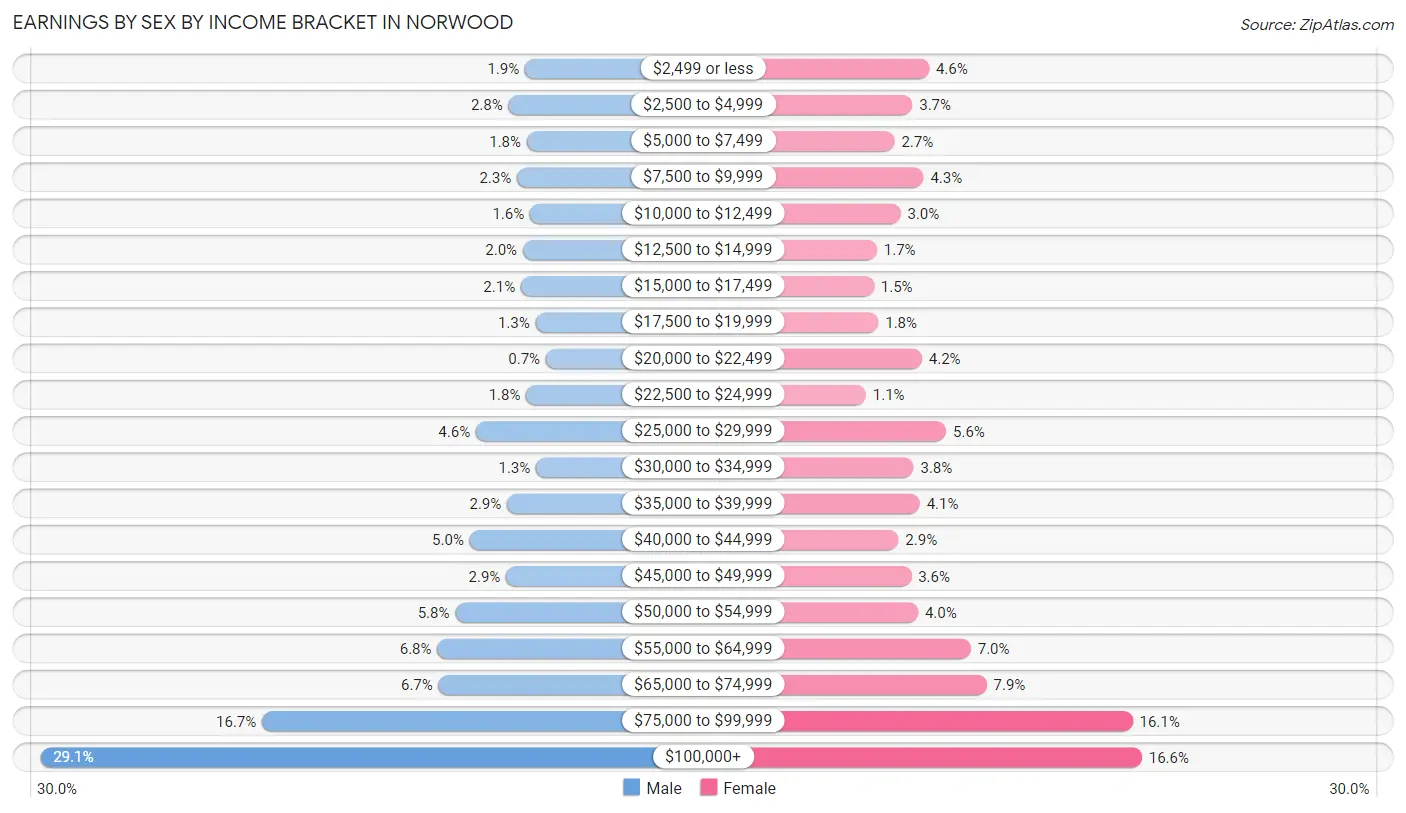
Earnings by Sex by Income Bracket in Norwood
The most common earnings brackets in Norwood are $100,000+ for men (2,856 | 29.1%) and $100,000+ for women (1,561 | 16.6%).
| Income | Male | Female |
| $2,499 or less | 183 (1.9%) | 435 (4.6%) |
| $2,500 to $4,999 | 275 (2.8%) | 346 (3.7%) |
| $5,000 to $7,499 | 174 (1.8%) | 252 (2.7%) |
| $7,500 to $9,999 | 228 (2.3%) | 406 (4.3%) |
| $10,000 to $12,499 | 156 (1.6%) | 284 (3.0%) |
| $12,500 to $14,999 | 195 (2.0%) | 159 (1.7%) |
| $15,000 to $17,499 | 206 (2.1%) | 143 (1.5%) |
| $17,500 to $19,999 | 126 (1.3%) | 167 (1.8%) |
| $20,000 to $22,499 | 69 (0.7%) | 397 (4.2%) |
| $22,500 to $24,999 | 177 (1.8%) | 101 (1.1%) |
| $25,000 to $29,999 | 454 (4.6%) | 525 (5.6%) |
| $30,000 to $34,999 | 123 (1.3%) | 353 (3.7%) |
| $35,000 to $39,999 | 282 (2.9%) | 386 (4.1%) |
| $40,000 to $44,999 | 488 (5.0%) | 273 (2.9%) |
| $45,000 to $49,999 | 287 (2.9%) | 341 (3.6%) |
| $50,000 to $54,999 | 568 (5.8%) | 377 (4.0%) |
| $55,000 to $64,999 | 667 (6.8%) | 656 (7.0%) |
| $65,000 to $74,999 | 660 (6.7%) | 740 (7.9%) |
| $75,000 to $99,999 | 1,633 (16.7%) | 1,512 (16.1%) |
| $100,000+ | 2,856 (29.1%) | 1,561 (16.6%) |
| Total | 9,807 (100.0%) | 9,414 (100.0%) |
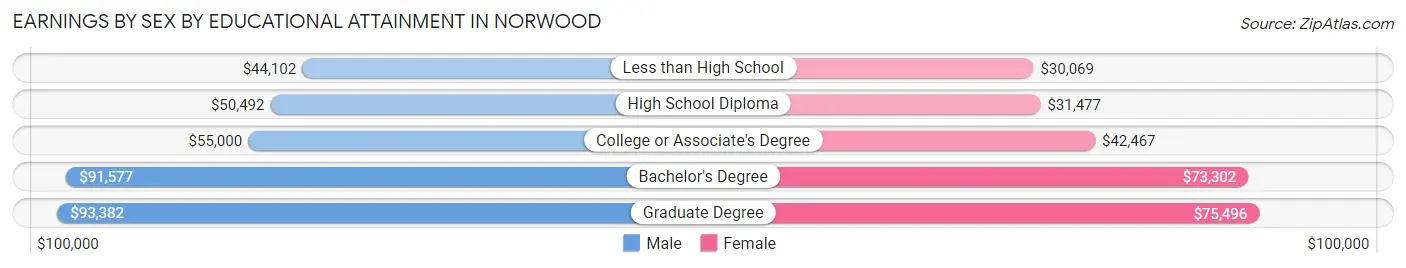
Earnings by Sex by Educational Attainment in Norwood
Average earnings in Norwood are $73,957 for men and $58,280 for women, a difference of 21.2%. Men with an educational attainment of graduate degree enjoy the highest average annual earnings of $93,382, while those with less than high school education earn the least with $44,102. Women with an educational attainment of graduate degree earn the most with the average annual earnings of $75,496, while those with less than high school education have the smallest earnings of $30,069.
| Educational Attainment | Male Income | Female Income |
| Less than High School | $44,102 | $30,069 |
| High School Diploma | $50,492 | $31,477 |
| College or Associate's Degree | $55,000 | $42,467 |
| Bachelor's Degree | $91,577 | $73,302 |
| Graduate Degree | $93,382 | $75,496 |
| Total | $73,957 | $58,280 |
Family Income in Norwood
Family Income Brackets in Norwood
According to the Norwood family income data, there are 2,014 families falling into the $200,000+ income range, which is the most common income bracket and makes up 25.1% of all families. Conversely, the $10,000 to $14,999 income bracket is the least frequent group with only 96 families (1.2%) belonging to this category.
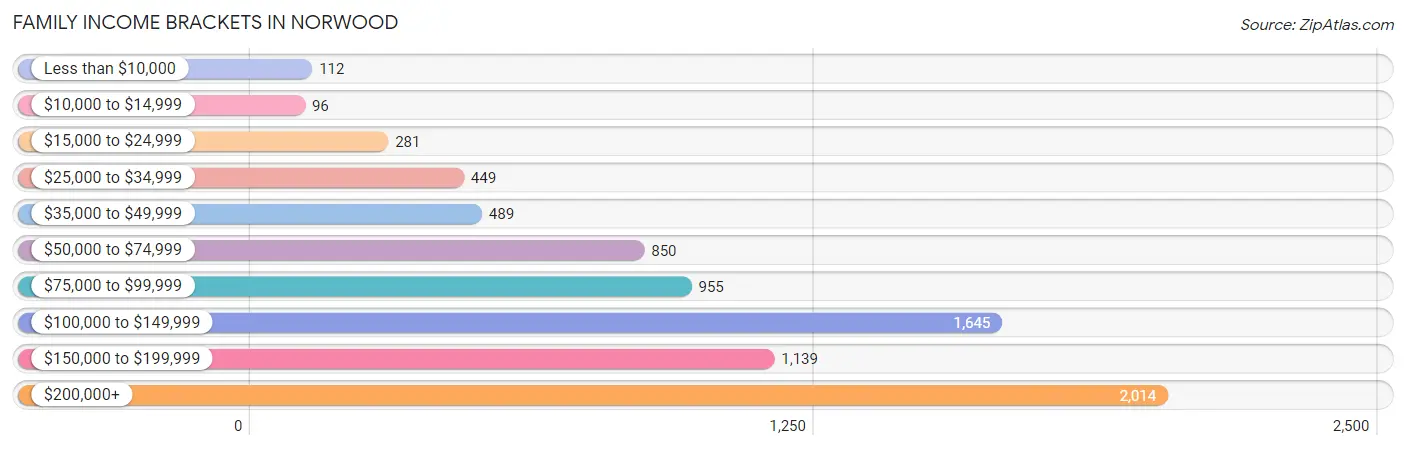
| Income Bracket | # Families | % Families |
| Less than $10,000 | 112 | 1.4% |
| $10,000 to $14,999 | 96 | 1.2% |
| $15,000 to $24,999 | 281 | 3.5% |
| $25,000 to $34,999 | 449 | 5.6% |
| $35,000 to $49,999 | 489 | 6.1% |
| $50,000 to $74,999 | 850 | 10.6% |
| $75,000 to $99,999 | 955 | 11.9% |
| $100,000 to $149,999 | 1,645 | 20.5% |
| $150,000 to $199,999 | 1,139 | 14.2% |
| $200,000+ | 2,014 | 25.1% |
Family Income by Famaliy Size in Norwood
7+ person families (106 | 1.3%) account for the highest median family income in Norwood with $206,548 per family, while 2-person families (3,488 | 43.5%) have the highest median income of $49,620 per family member.
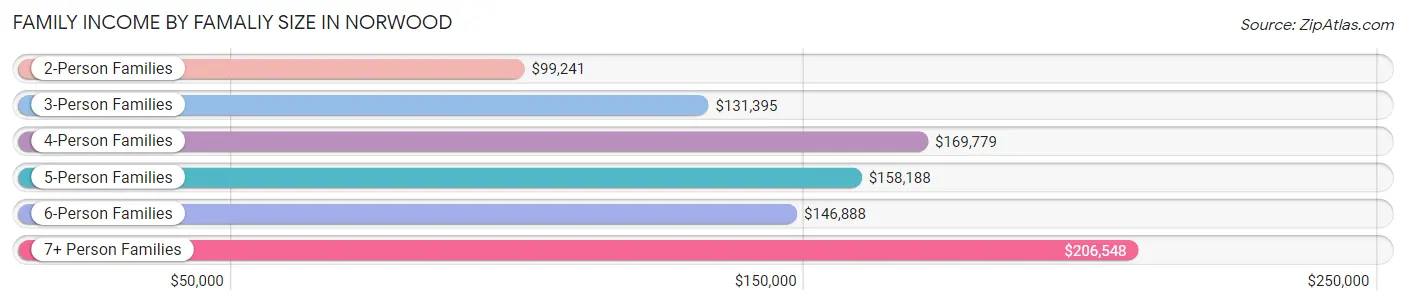
| Income Bracket | # Families | Median Income |
| 2-Person Families | 3,488 (43.5%) | $99,241 |
| 3-Person Families | 2,295 (28.6%) | $131,395 |
| 4-Person Families | 1,515 (18.9%) | $169,779 |
| 5-Person Families | 395 (4.9%) | $158,188 |
| 6-Person Families | 224 (2.8%) | $146,888 |
| 7+ Person Families | 106 (1.3%) | $206,548 |
| Total | 8,023 (100.0%) | $124,455 |
Family Income by Number of Earners in Norwood
The median family income in Norwood is $124,455, with families comprising 3+ earners (1,182) having the highest median family income of $231,250, while families with no earners (840) have the lowest median family income of $62,500, accounting for 14.7% and 10.5% of families, respectively.
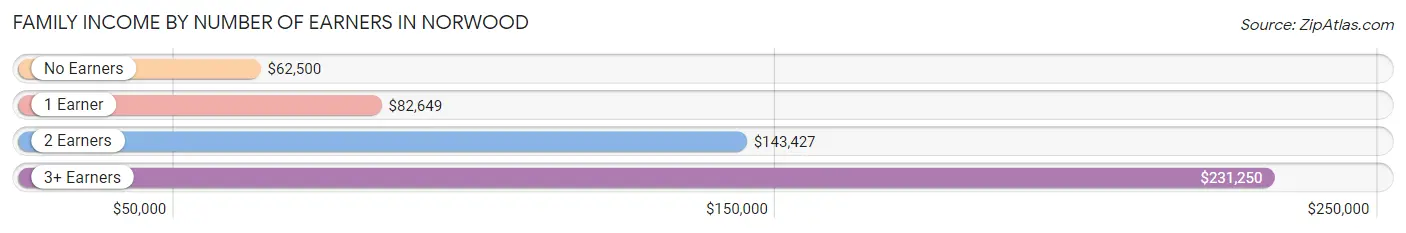
| Number of Earners | # Families | Median Income |
| No Earners | 840 (10.5%) | $62,500 |
| 1 Earner | 2,042 (25.5%) | $82,649 |
| 2 Earners | 3,959 (49.3%) | $143,427 |
| 3+ Earners | 1,182 (14.7%) | $231,250 |
| Total | 8,023 (100.0%) | $124,455 |
Household Income in Norwood
Household Income Brackets in Norwood
With 2,518 households falling in the category, the $200,000+ income range is the most frequent in Norwood, accounting for 19.2% of all households. In contrast, only 367 households (2.8%) fall into the less than $10,000 income bracket, making it the least populous group.
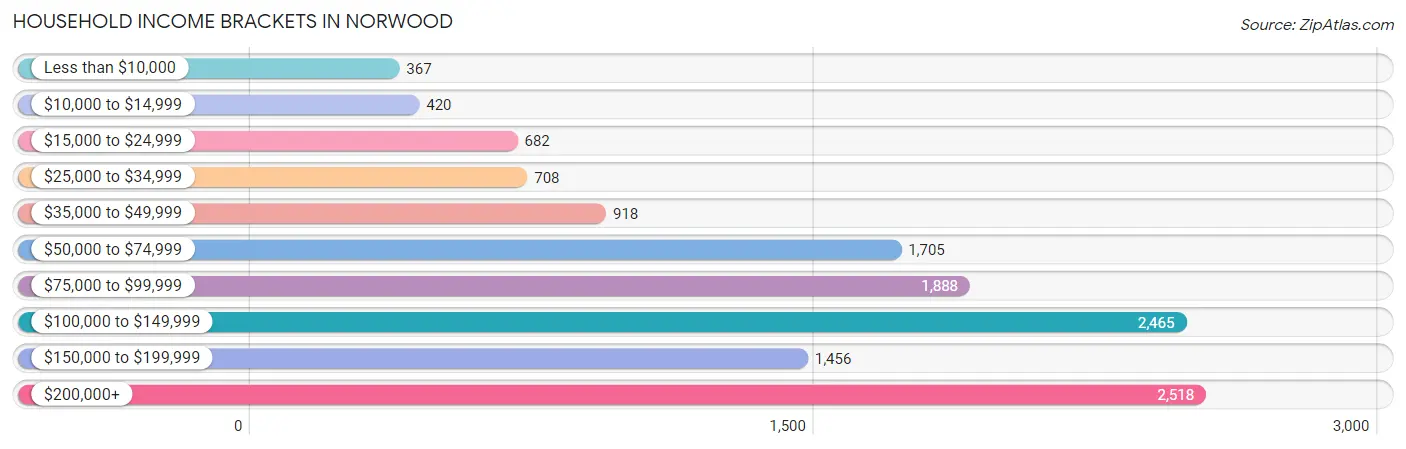
| Income Bracket | # Households | % Households |
| Less than $10,000 | 367 | 2.8% |
| $10,000 to $14,999 | 420 | 3.2% |
| $15,000 to $24,999 | 682 | 5.2% |
| $25,000 to $34,999 | 708 | 5.4% |
| $35,000 to $49,999 | 918 | 7.0% |
| $50,000 to $74,999 | 1,705 | 13.0% |
| $75,000 to $99,999 | 1,888 | 14.4% |
| $100,000 to $149,999 | 2,465 | 18.8% |
| $150,000 to $199,999 | 1,456 | 11.1% |
| $200,000+ | 2,518 | 19.2% |
Household Income by Householder Age in Norwood
The median household income in Norwood is $98,653, with the highest median household income of $125,573 found in the 45 to 64 years age bracket for the primary householder. A total of 4,664 households (35.6%) fall into this category. Meanwhile, the 15 to 24 years age bracket for the primary householder has the lowest median household income of $63,636, with 476 households (3.6%) in this group.
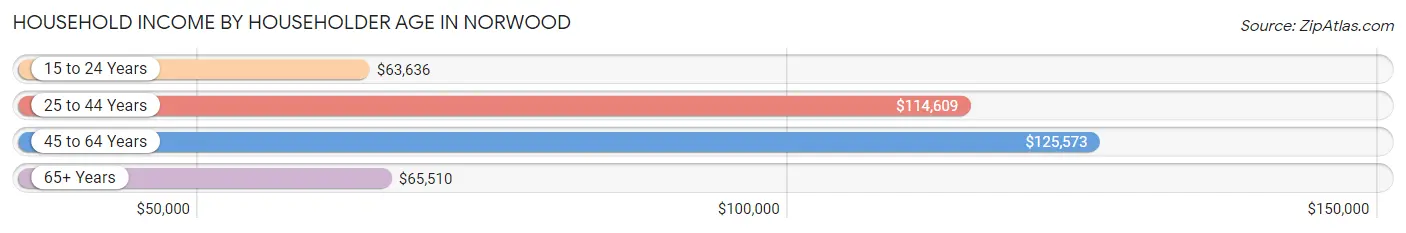
| Income Bracket | # Households | Median Income |
| 15 to 24 Years | 476 (3.6%) | $63,636 |
| 25 to 44 Years | 4,535 (34.6%) | $114,609 |
| 45 to 64 Years | 4,664 (35.6%) | $125,573 |
| 65+ Years | 3,439 (26.2%) | $65,510 |
| Total | 13,114 (100.0%) | $98,653 |
Poverty in Norwood
Income Below Poverty by Sex and Age in Norwood
With 5.7% poverty level for males and 9.4% for females among the residents of Norwood, 12 to 14 year old males and 12 to 14 year old females are the most vulnerable to poverty, with 71 males (17.2%) and 174 females (31.5%) in their respective age groups living below the poverty level.
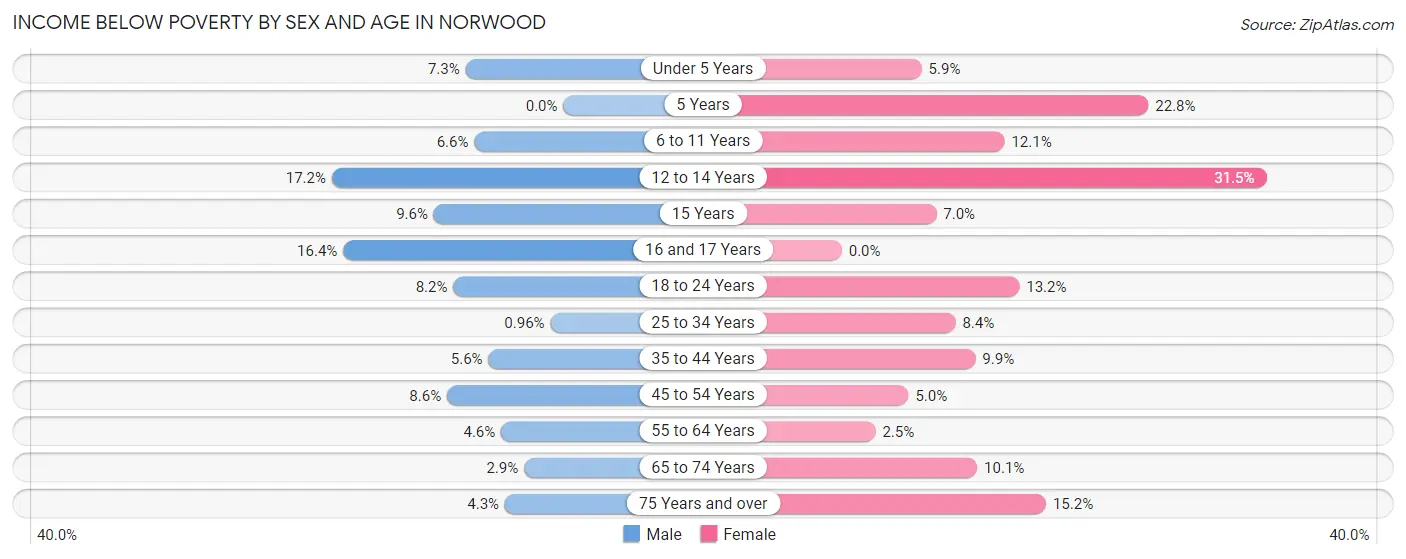
| Age Bracket | Male | Female |
| Under 5 Years | 73 (7.3%) | 47 (5.9%) |
| 5 Years | 0 (0.0%) | 33 (22.8%) |
| 6 to 11 Years | 86 (6.6%) | 91 (12.1%) |
| 12 to 14 Years | 71 (17.2%) | 174 (31.5%) |
| 15 Years | 20 (9.6%) | 16 (7.0%) |
| 16 and 17 Years | 52 (16.4%) | 0 (0.0%) |
| 18 to 24 Years | 82 (8.2%) | 146 (13.2%) |
| 25 to 34 Years | 25 (1.0%) | 233 (8.4%) |
| 35 to 44 Years | 119 (5.6%) | 185 (9.9%) |
| 45 to 54 Years | 180 (8.6%) | 92 (5.0%) |
| 55 to 64 Years | 88 (4.6%) | 56 (2.5%) |
| 65 to 74 Years | 33 (2.9%) | 149 (10.1%) |
| 75 Years and over | 46 (4.3%) | 240 (15.2%) |
| Total | 875 (5.7%) | 1,462 (9.4%) |
Income Above Poverty by Sex and Age in Norwood
According to the poverty statistics in Norwood, males aged 5 years and females aged 16 and 17 years are the age groups that are most secure financially, with 100.0% of males and 100.0% of females in these age groups living above the poverty line.
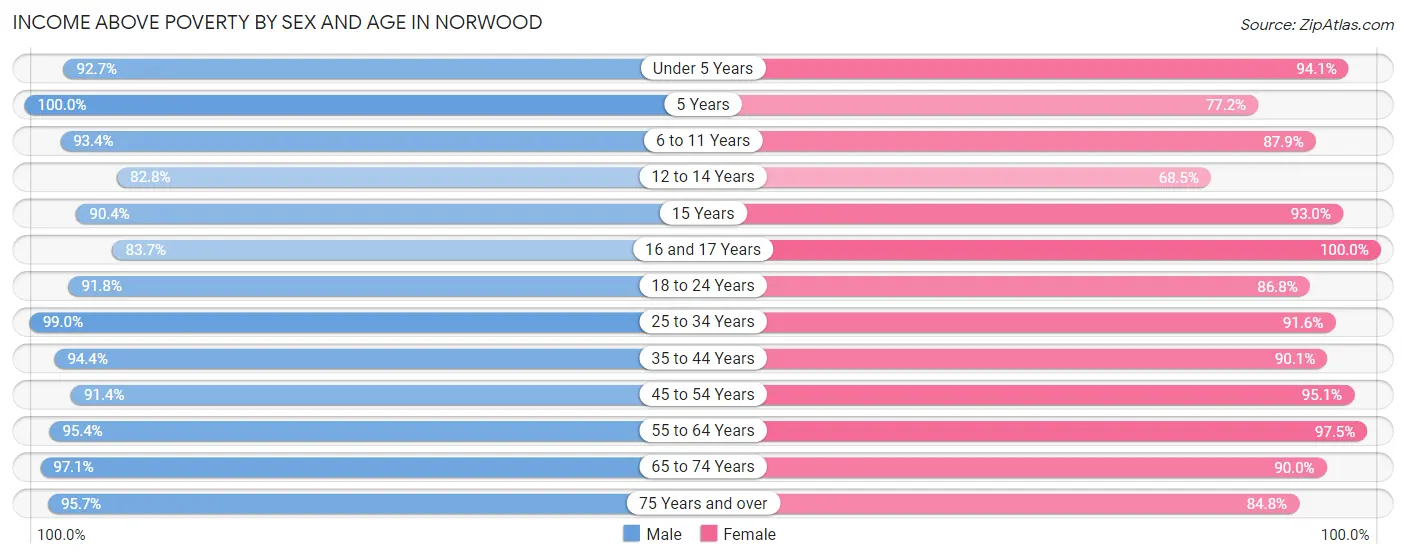
| Age Bracket | Male | Female |
| Under 5 Years | 933 (92.7%) | 745 (94.1%) |
| 5 Years | 163 (100.0%) | 112 (77.2%) |
| 6 to 11 Years | 1,216 (93.4%) | 662 (87.9%) |
| 12 to 14 Years | 342 (82.8%) | 378 (68.5%) |
| 15 Years | 188 (90.4%) | 212 (93.0%) |
| 16 and 17 Years | 266 (83.7%) | 206 (100.0%) |
| 18 to 24 Years | 922 (91.8%) | 962 (86.8%) |
| 25 to 34 Years | 2,566 (99.0%) | 2,527 (91.6%) |
| 35 to 44 Years | 2,020 (94.4%) | 1,679 (90.1%) |
| 45 to 54 Years | 1,904 (91.4%) | 1,765 (95.1%) |
| 55 to 64 Years | 1,816 (95.4%) | 2,183 (97.5%) |
| 65 to 74 Years | 1,099 (97.1%) | 1,333 (89.9%) |
| 75 Years and over | 1,014 (95.7%) | 1,343 (84.8%) |
| Total | 14,449 (94.3%) | 14,107 (90.6%) |
Income Below Poverty Among Married-Couple Families in Norwood
The poverty statistics for married-couple families in Norwood show that 2.9% or 177 of the total 6,072 families live below the poverty line. Families with 1 or 2 children have the highest poverty rate of 4.8%, comprising of 106 families. On the other hand, families with 3 or 4 children have the lowest poverty rate of 0.0%, which includes 0 families.
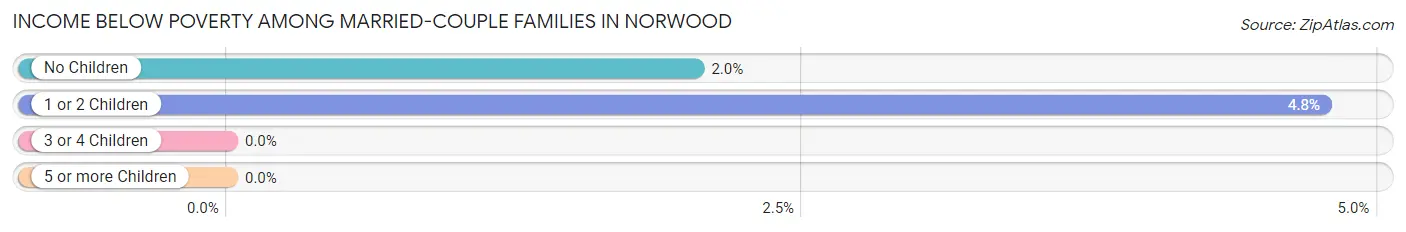
| Children | Above Poverty | Below Poverty |
| No Children | 3,424 (98.0%) | 71 (2.0%) |
| 1 or 2 Children | 2,121 (95.2%) | 106 (4.8%) |
| 3 or 4 Children | 288 (100.0%) | 0 (0.0%) |
| 5 or more Children | 62 (100.0%) | 0 (0.0%) |
| Total | 5,895 (97.1%) | 177 (2.9%) |
Income Below Poverty Among Single-Parent Households in Norwood
According to the poverty data in Norwood, 8.6% or 51 single-father households and 16.7% or 227 single-mother households are living below the poverty line. Among single-father households, those with 1 or 2 children have the highest poverty rate, with 51 households (18.5%) experiencing poverty. Likewise, among single-mother households, those with 5 or more children have the highest poverty rate, with 26 households (100.0%) falling below the poverty line.
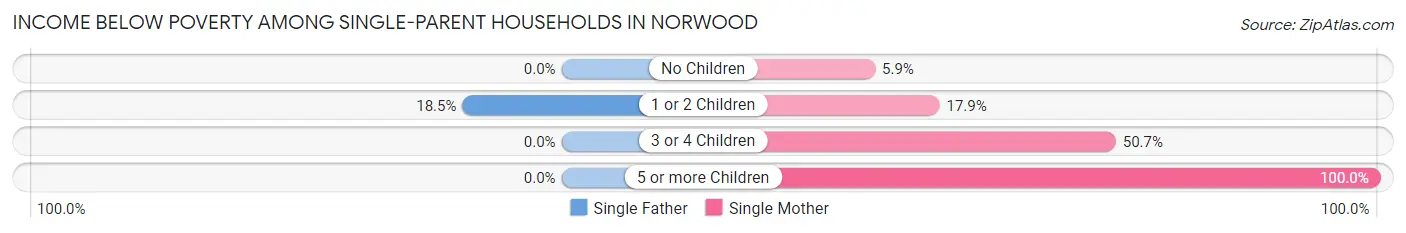
| Children | Single Father | Single Mother |
| No Children | 0 (0.0%) | 41 (5.9%) |
| 1 or 2 Children | 51 (18.5%) | 87 (17.9%) |
| 3 or 4 Children | 0 (0.0%) | 73 (50.7%) |
| 5 or more Children | 0 (0.0%) | 26 (100.0%) |
| Total | 51 (8.6%) | 227 (16.7%) |
Income Below Poverty Among Married-Couple vs Single-Parent Households in Norwood
The poverty data for Norwood shows that 177 of the married-couple family households (2.9%) and 278 of the single-parent households (14.2%) are living below the poverty level. Within the married-couple family households, those with 1 or 2 children have the highest poverty rate, with 106 households (4.8%) falling below the poverty line. Among the single-parent households, those with 5 or more children have the highest poverty rate, with 26 household (100.0%) living below poverty.
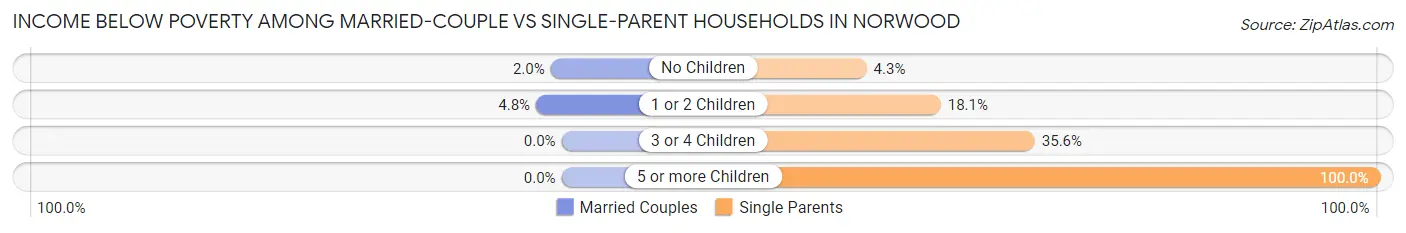
| Children | Married-Couple Families | Single-Parent Households |
| No Children | 71 (2.0%) | 41 (4.3%) |
| 1 or 2 Children | 106 (4.8%) | 138 (18.1%) |
| 3 or 4 Children | 0 (0.0%) | 73 (35.6%) |
| 5 or more Children | 0 (0.0%) | 26 (100.0%) |
| Total | 177 (2.9%) | 278 (14.2%) |
Race in Norwood
The most populous races in Norwood are White / Caucasian (24,035 | 76.7%), Hispanic or Latino (2,457 | 7.8%), and Black / African American (2,102 | 6.7%).
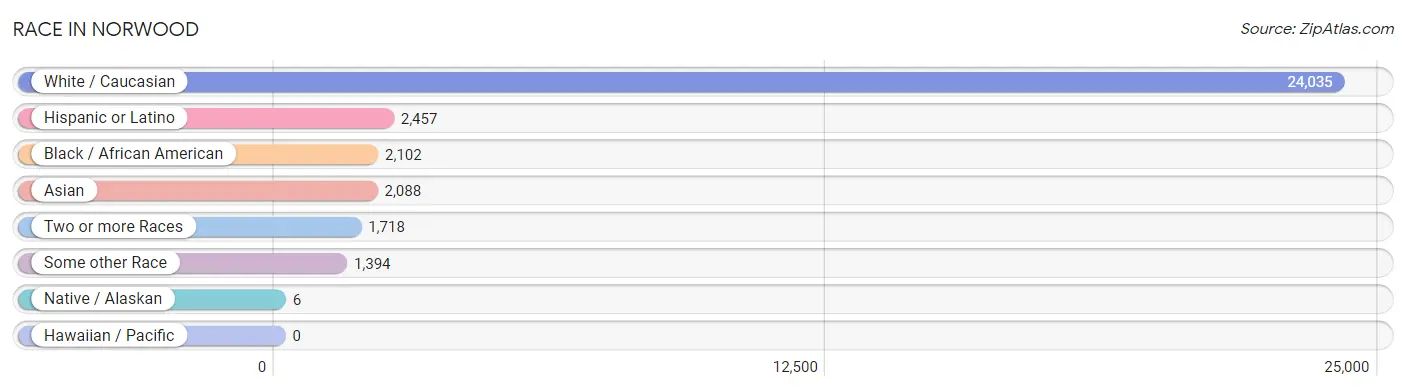
| Race | # Population | % Population |
| Asian | 2,088 | 6.7% |
| Black / African American | 2,102 | 6.7% |
| Hawaiian / Pacific | 0 | 0.0% |
| Hispanic or Latino | 2,457 | 7.8% |
| Native / Alaskan | 6 | 0.0% |
| White / Caucasian | 24,035 | 76.7% |
| Two or more Races | 1,718 | 5.5% |
| Some other Race | 1,394 | 4.4% |
| Total | 31,343 | 100.0% |
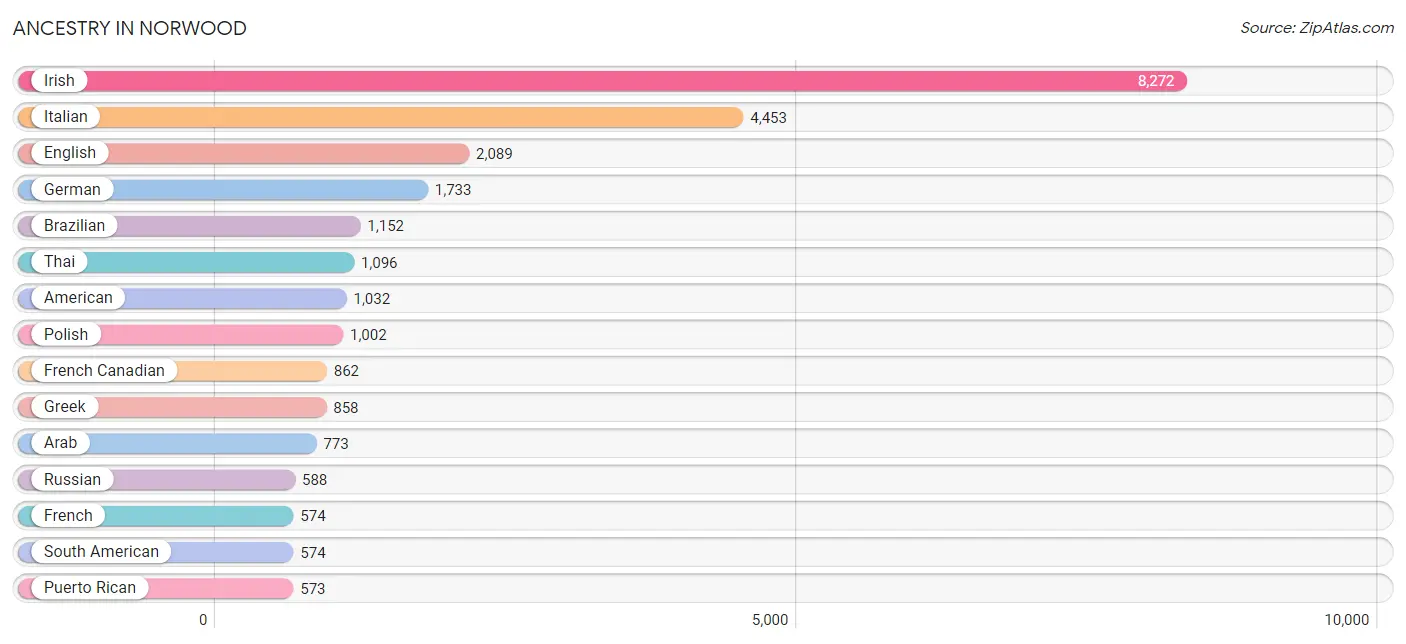
Ancestry in Norwood
The most populous ancestries reported in Norwood are Irish (8,272 | 26.4%), Italian (4,453 | 14.2%), English (2,089 | 6.7%), German (1,733 | 5.5%), and Brazilian (1,152 | 3.7%), together accounting for 56.5% of all Norwood residents.
| Ancestry | # Population | % Population |
| African | 39 | 0.1% |
| Albanian | 391 | 1.3% |
| American | 1,032 | 3.3% |
| Arab | 773 | 2.5% |
| Argentinean | 43 | 0.1% |
| Armenian | 158 | 0.5% |
| Austrian | 179 | 0.6% |
| Barbadian | 15 | 0.1% |
| Bhutanese | 29 | 0.1% |
| Brazilian | 1,152 | 3.7% |
| British | 94 | 0.3% |
| British West Indian | 4 | 0.0% |
| Burmese | 281 | 0.9% |
| Canadian | 212 | 0.7% |
| Cape Verdean | 159 | 0.5% |
| Central American | 565 | 1.8% |
| Cherokee | 34 | 0.1% |
| Chilean | 86 | 0.3% |
| Colombian | 148 | 0.5% |
| Cuban | 138 | 0.4% |
| Czech | 14 | 0.0% |
| Czechoslovakian | 17 | 0.1% |
| Danish | 91 | 0.3% |
| Dominican | 373 | 1.2% |
| Dutch | 66 | 0.2% |
| Eastern European | 201 | 0.6% |
| Egyptian | 17 | 0.1% |
| English | 2,089 | 6.7% |
| Estonian | 11 | 0.0% |
| European | 422 | 1.3% |
| Filipino | 70 | 0.2% |
| Finnish | 94 | 0.3% |
| French | 574 | 1.8% |
| French Canadian | 862 | 2.8% |
| German | 1,733 | 5.5% |
| Greek | 858 | 2.7% |
| Guamanian / Chamorro | 35 | 0.1% |
| Guatemalan | 68 | 0.2% |
| Guyanese | 16 | 0.1% |
| Haitian | 570 | 1.8% |
| Hungarian | 44 | 0.1% |
| Indian (Asian) | 409 | 1.3% |
| Inupiat | 6 | 0.0% |
| Iraqi | 17 | 0.1% |
| Irish | 8,272 | 26.4% |
| Israeli | 13 | 0.0% |
| Italian | 4,453 | 14.2% |
| Jamaican | 337 | 1.1% |
| Jordanian | 13 | 0.0% |
| Korean | 201 | 0.6% |
| Latvian | 17 | 0.1% |
| Lebanese | 551 | 1.8% |
| Liberian | 116 | 0.4% |
| Lithuanian | 340 | 1.1% |
| Mexican | 109 | 0.4% |
| Nigerian | 149 | 0.5% |
| Northern European | 43 | 0.1% |
| Norwegian | 67 | 0.2% |
| Pakistani | 20 | 0.1% |
| Paraguayan | 215 | 0.7% |
| Peruvian | 28 | 0.1% |
| Polish | 1,002 | 3.2% |
| Portuguese | 418 | 1.3% |
| Puerto Rican | 573 | 1.8% |
| Russian | 588 | 1.9% |
| Salvadoran | 318 | 1.0% |
| Scotch-Irish | 221 | 0.7% |
| Scottish | 552 | 1.8% |
| Serbian | 34 | 0.1% |
| Slovak | 10 | 0.0% |
| Slovene | 51 | 0.2% |
| South American | 574 | 1.8% |
| Spaniard | 11 | 0.0% |
| Spanish | 99 | 0.3% |
| Sri Lankan | 20 | 0.1% |
| Subsaharan African | 566 | 1.8% |
| Swedish | 353 | 1.1% |
| Swiss | 24 | 0.1% |
| Syrian | 146 | 0.5% |
| Thai | 1,096 | 3.5% |
| Trinidadian and Tobagonian | 3 | 0.0% |
| Ukrainian | 36 | 0.1% |
| Venezuelan | 54 | 0.2% |
| Welsh | 70 | 0.2% |
| West Indian | 10 | 0.0% | View All 85 Rows |
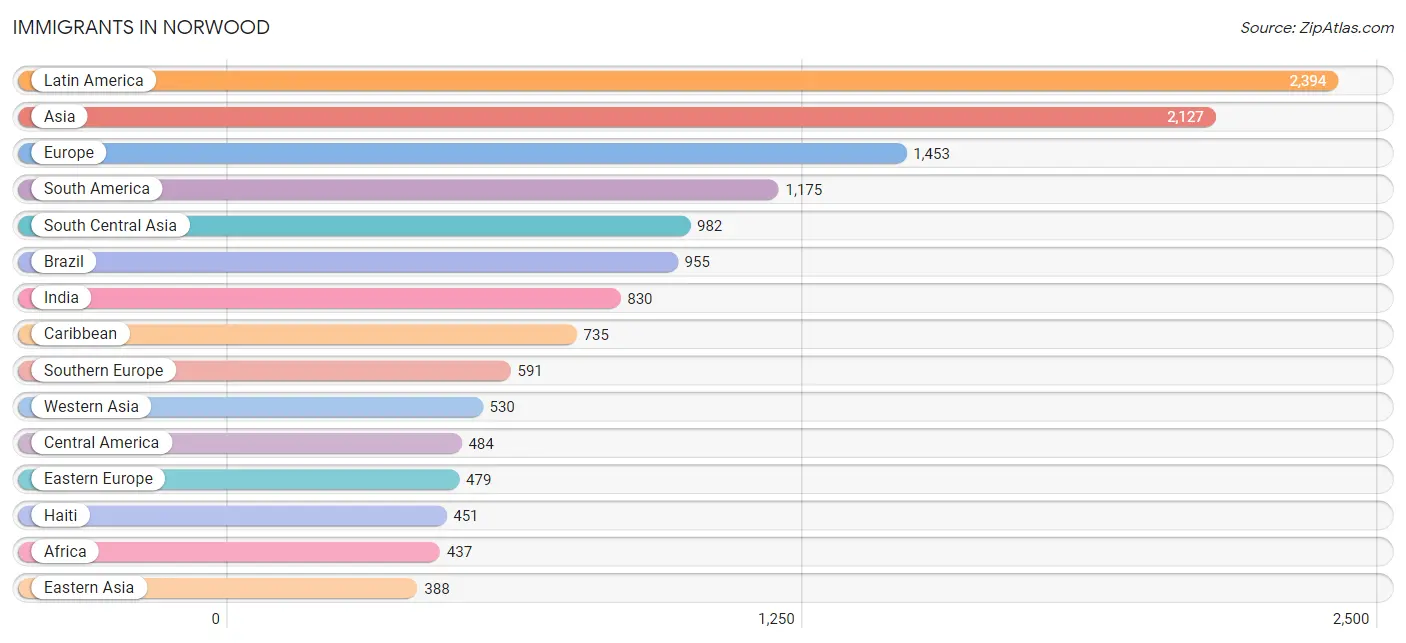
Immigrants in Norwood
The most numerous immigrant groups reported in Norwood came from Latin America (2,394 | 7.6%), Asia (2,127 | 6.8%), Europe (1,453 | 4.6%), South America (1,175 | 3.7%), and South Central Asia (982 | 3.1%), together accounting for 26.0% of all Norwood residents.
| Immigration Origin | # Population | % Population |
| Africa | 437 | 1.4% |
| Albania | 166 | 0.5% |
| Armenia | 42 | 0.1% |
| Asia | 2,127 | 6.8% |
| Belarus | 28 | 0.1% |
| Brazil | 955 | 3.0% |
| Cabo Verde | 41 | 0.1% |
| Canada | 27 | 0.1% |
| Caribbean | 735 | 2.4% |
| Central America | 484 | 1.5% |
| Chile | 20 | 0.1% |
| China | 229 | 0.7% |
| Colombia | 148 | 0.5% |
| Cuba | 57 | 0.2% |
| Czechoslovakia | 17 | 0.1% |
| Dominican Republic | 180 | 0.6% |
| Eastern Asia | 388 | 1.2% |
| Eastern Europe | 479 | 1.5% |
| Egypt | 36 | 0.1% |
| El Salvador | 205 | 0.6% |
| Europe | 1,453 | 4.6% |
| France | 41 | 0.1% |
| Germany | 61 | 0.2% |
| Ghana | 11 | 0.0% |
| Greece | 245 | 0.8% |
| Guatemala | 37 | 0.1% |
| Haiti | 451 | 1.4% |
| Honduras | 77 | 0.3% |
| Hong Kong | 61 | 0.2% |
| Hungary | 13 | 0.0% |
| India | 830 | 2.6% |
| Ireland | 192 | 0.6% |
| Israel | 66 | 0.2% |
| Italy | 302 | 1.0% |
| Jamaica | 37 | 0.1% |
| Korea | 159 | 0.5% |
| Kuwait | 13 | 0.0% |
| Latin America | 2,394 | 7.6% |
| Lebanon | 267 | 0.9% |
| Liberia | 116 | 0.4% |
| Mexico | 75 | 0.2% |
| Nepal | 72 | 0.2% |
| Netherlands | 10 | 0.0% |
| Nigeria | 139 | 0.4% |
| Northern Africa | 49 | 0.2% |
| Northern Europe | 240 | 0.8% |
| Norway | 11 | 0.0% |
| Peru | 14 | 0.0% |
| Philippines | 163 | 0.5% |
| Poland | 68 | 0.2% |
| Portugal | 33 | 0.1% |
| Romania | 7 | 0.0% |
| Russia | 139 | 0.4% |
| Serbia | 34 | 0.1% |
| Sierra Leone | 16 | 0.1% |
| South America | 1,175 | 3.7% |
| South Central Asia | 982 | 3.1% |
| South Eastern Asia | 227 | 0.7% |
| Southern Europe | 591 | 1.9% |
| Spain | 11 | 0.0% |
| Sri Lanka | 58 | 0.2% |
| Switzerland | 31 | 0.1% |
| Syria | 127 | 0.4% |
| Taiwan | 45 | 0.1% |
| Thailand | 20 | 0.1% |
| Trinidad and Tobago | 10 | 0.0% |
| Venezuela | 38 | 0.1% |
| Vietnam | 11 | 0.0% |
| Western Africa | 388 | 1.2% |
| Western Asia | 530 | 1.7% |
| Western Europe | 143 | 0.5% | View All 71 Rows |
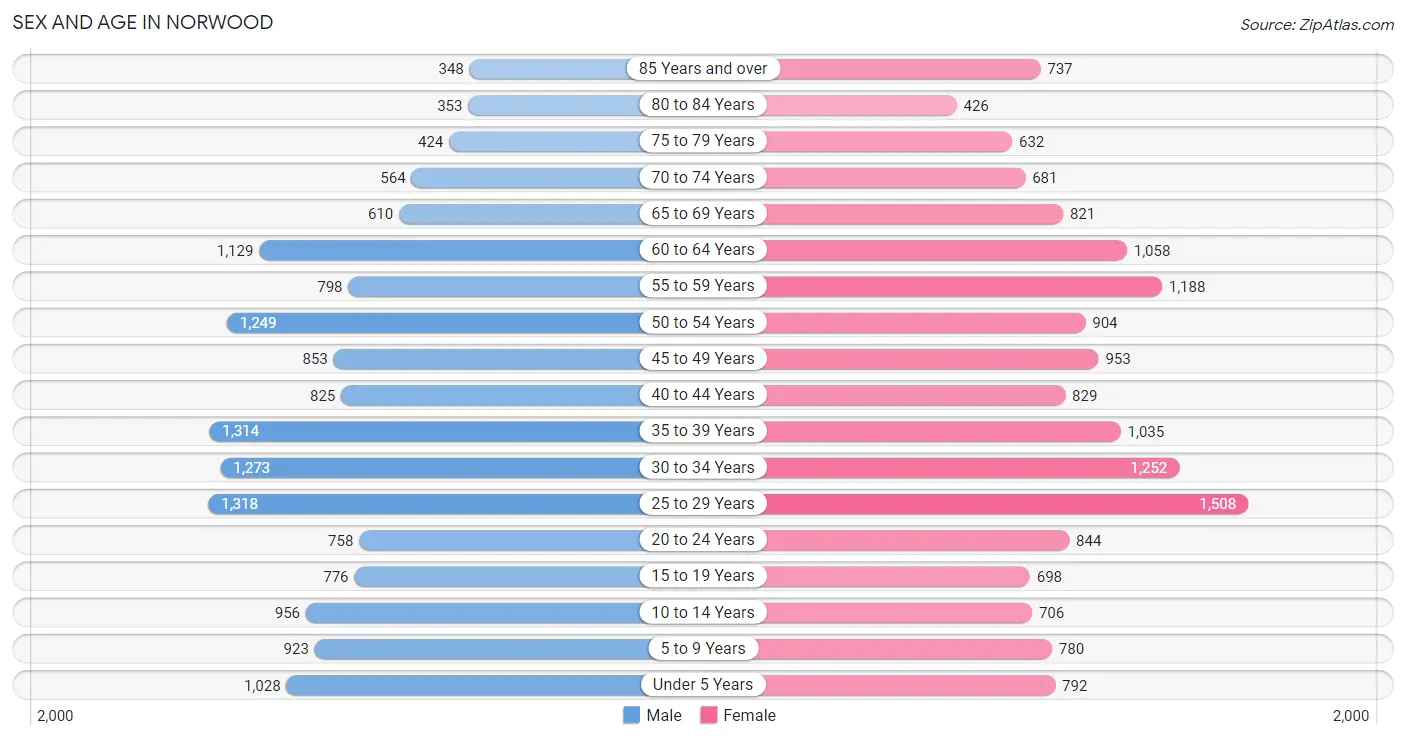
Sex and Age in Norwood
Sex and Age in Norwood
The most populous age groups in Norwood are 25 to 29 Years (1,318 | 8.5%) for men and 25 to 29 Years (1,508 | 9.5%) for women.
| Age Bracket | Male | Female |
| Under 5 Years | 1,028 (6.6%) | 792 (5.0%) |
| 5 to 9 Years | 923 (6.0%) | 780 (4.9%) |
| 10 to 14 Years | 956 (6.2%) | 706 (4.5%) |
| 15 to 19 Years | 776 (5.0%) | 698 (4.4%) |
| 20 to 24 Years | 758 (4.9%) | 844 (5.3%) |
| 25 to 29 Years | 1,318 (8.5%) | 1,508 (9.5%) |
| 30 to 34 Years | 1,273 (8.2%) | 1,252 (7.9%) |
| 35 to 39 Years | 1,314 (8.5%) | 1,035 (6.5%) |
| 40 to 44 Years | 825 (5.3%) | 829 (5.2%) |
| 45 to 49 Years | 853 (5.5%) | 953 (6.0%) |
| 50 to 54 Years | 1,249 (8.1%) | 904 (5.7%) |
| 55 to 59 Years | 798 (5.1%) | 1,188 (7.5%) |
| 60 to 64 Years | 1,129 (7.3%) | 1,058 (6.7%) |
| 65 to 69 Years | 610 (3.9%) | 821 (5.2%) |
| 70 to 74 Years | 564 (3.6%) | 681 (4.3%) |
| 75 to 79 Years | 424 (2.7%) | 632 (4.0%) |
| 80 to 84 Years | 353 (2.3%) | 426 (2.7%) |
| 85 Years and over | 348 (2.2%) | 737 (4.6%) |
| Total | 15,499 (100.0%) | 15,844 (100.0%) |
Families and Households in Norwood
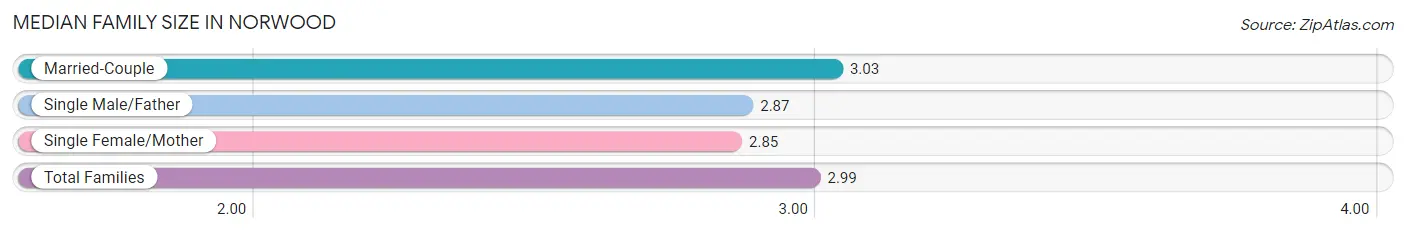
Median Family Size in Norwood
The median family size in Norwood is 2.99 persons per family, with married-couple families (6,072 | 75.7%) accounting for the largest median family size of 3.03 persons per family. On the other hand, single female/mother families (1,358 | 16.9%) represent the smallest median family size with 2.85 persons per family.
| Family Type | # Families | Family Size |
| Married-Couple | 6,072 (75.7%) | 3.03 |
| Single Male/Father | 593 (7.4%) | 2.87 |
| Single Female/Mother | 1,358 (16.9%) | 2.85 |
| Total Families | 8,023 (100.0%) | 2.99 |
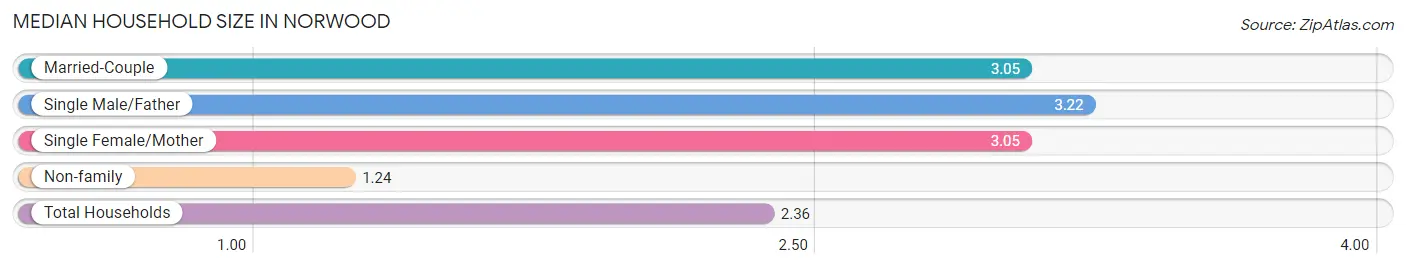
Median Household Size in Norwood
The median household size in Norwood is 2.36 persons per household, with single male/father households (593 | 4.5%) accounting for the largest median household size of 3.22 persons per household. non-family households (5,091 | 38.8%) represent the smallest median household size with 1.24 persons per household.
| Household Type | # Households | Household Size |
| Married-Couple | 6,072 (46.3%) | 3.05 |
| Single Male/Father | 593 (4.5%) | 3.22 |
| Single Female/Mother | 1,358 (10.4%) | 3.05 |
| Non-family | 5,091 (38.8%) | 1.24 |
| Total Households | 13,114 (100.0%) | 2.36 |
Household Size by Marriage Status in Norwood
Out of a total of 13,114 households in Norwood, 8,023 (61.2%) are family households, while 5,091 (38.8%) are nonfamily households. The most numerous type of family households are 2-person households, comprising 3,365, and the most common type of nonfamily households are 1-person households, comprising 3,930.
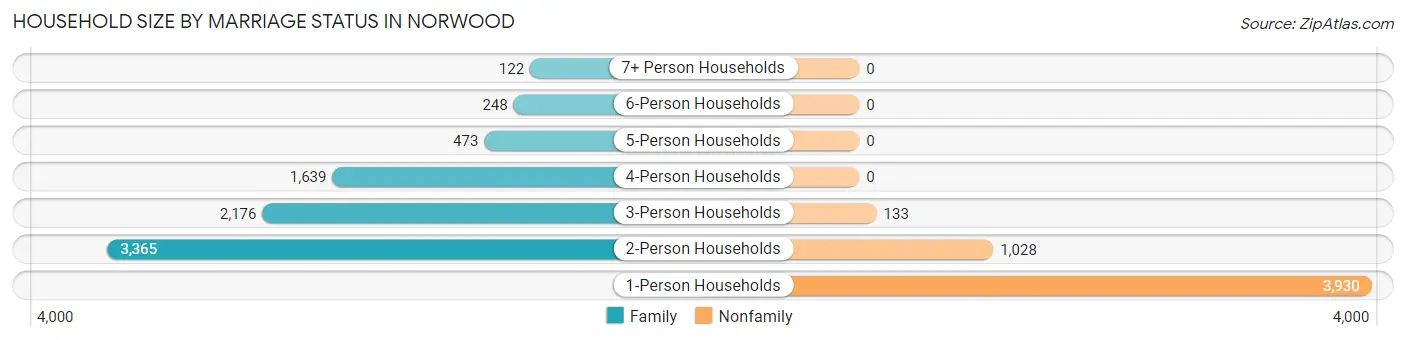
| Household Size | Family Households | Nonfamily Households |
| 1-Person Households | - | 3,930 (30.0%) |
| 2-Person Households | 3,365 (25.7%) | 1,028 (7.8%) |
| 3-Person Households | 2,176 (16.6%) | 133 (1.0%) |
| 4-Person Households | 1,639 (12.5%) | 0 (0.0%) |
| 5-Person Households | 473 (3.6%) | 0 (0.0%) |
| 6-Person Households | 248 (1.9%) | 0 (0.0%) |
| 7+ Person Households | 122 (0.9%) | 0 (0.0%) |
| Total | 8,023 (61.2%) | 5,091 (38.8%) |
Female Fertility in Norwood
Fertility by Age in Norwood
Average fertility rate in Norwood is 37.0 births per 1,000 women. Women in the age bracket of 35 to 50 years have the highest fertility rate with 50.0 births per 1,000 women. Women in the age bracket of 35 to 50 years acount for 56.7% of all women with births.
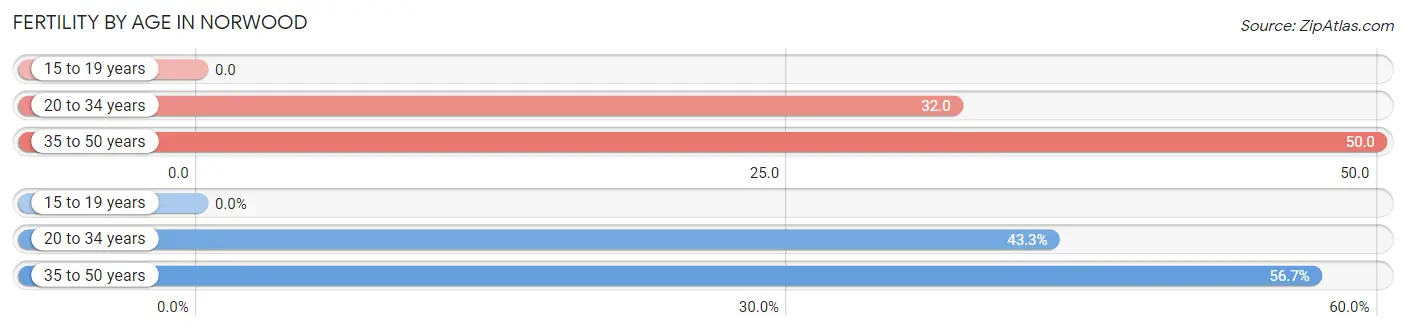
| Age Bracket | Women with Births | Births / 1,000 Women |
| 15 to 19 years | 0 (0.0%) | 0.0 |
| 20 to 34 years | 117 (43.3%) | 32.0 |
| 35 to 50 years | 153 (56.7%) | 50.0 |
| Total | 270 (100.0%) | 37.0 |
Fertility by Age by Marriage Status in Norwood
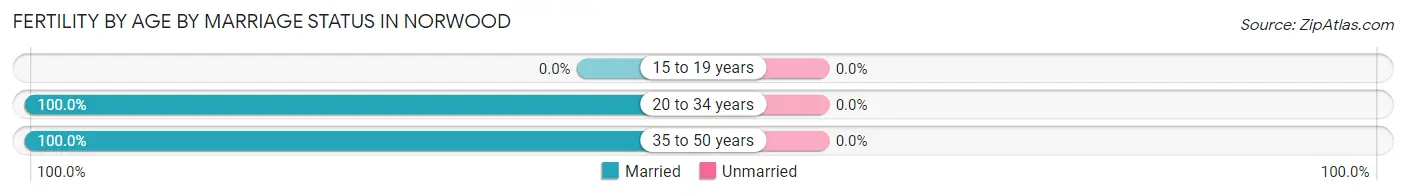
| Age Bracket | Married | Unmarried |
| 15 to 19 years | 0 (0.0%) | 0 (0.0%) |
| 20 to 34 years | 117 (100.0%) | 0 (0.0%) |
| 35 to 50 years | 153 (100.0%) | 0 (0.0%) |
| Total | 270 (100.0%) | 0 (0.0%) |
Fertility by Education in Norwood
Average fertility rate in Norwood is 37.0 births per 1,000 women. Women with the education attainment of graduate degree have the highest fertility rate of 93.0 births per 1,000 women, while women with the education attainment of less than high school have the lowest fertility at 15.0 births per 1,000 women. Women with the education attainment of graduate degree represent 61.1% of all women with births.
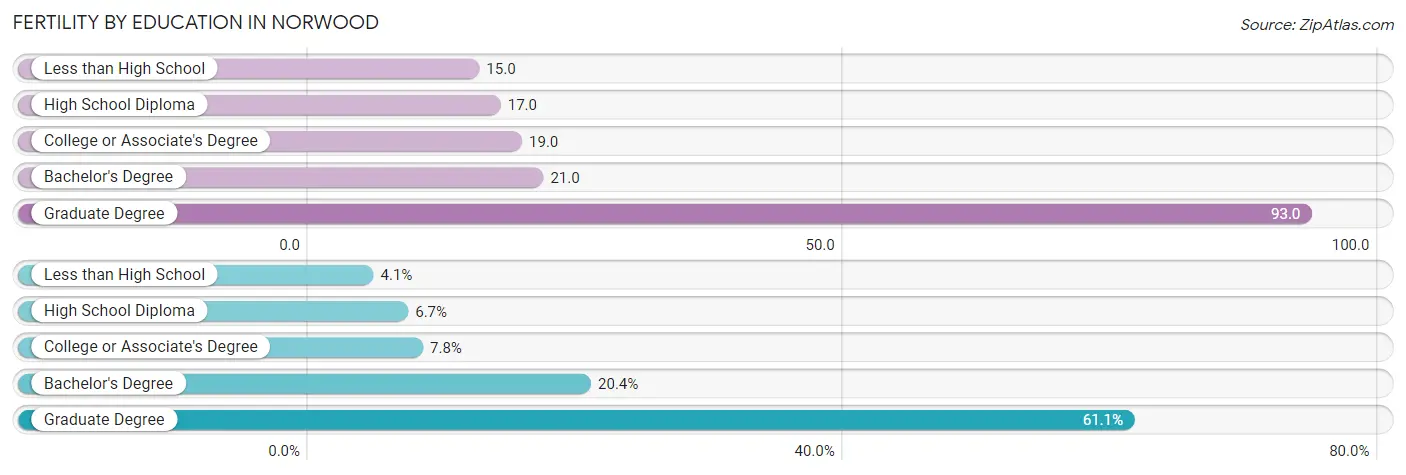
| Educational Attainment | Women with Births | Births / 1,000 Women |
| Less than High School | 11 (4.1%) | 15.0 |
| High School Diploma | 18 (6.7%) | 17.0 |
| College or Associate's Degree | 21 (7.8%) | 19.0 |
| Bachelor's Degree | 55 (20.4%) | 21.0 |
| Graduate Degree | 165 (61.1%) | 93.0 |
| Total | 270 (100.0%) | 37.0 |
Fertility by Education by Marriage Status in Norwood
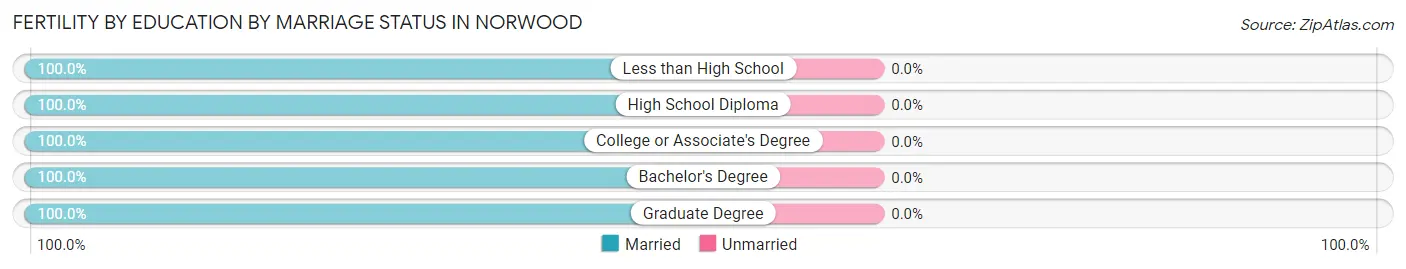
| Educational Attainment | Married | Unmarried |
| Less than High School | 11 (100.0%) | 0 (0.0%) |
| High School Diploma | 18 (100.0%) | 0 (0.0%) |
| College or Associate's Degree | 21 (100.0%) | 0 (0.0%) |
| Bachelor's Degree | 55 (100.0%) | 0 (0.0%) |
| Graduate Degree | 165 (100.0%) | 0 (0.0%) |
| Total | 270 (100.0%) | 0 (0.0%) |
Employment Characteristics in Norwood
Employment by Class of Employer in Norwood
Among the 17,729 employed individuals in Norwood, private company employees (11,828 | 66.7%), not-for-profit organizations (2,258 | 12.7%), and local government employees (1,389 | 7.8%) make up the most common classes of employment.
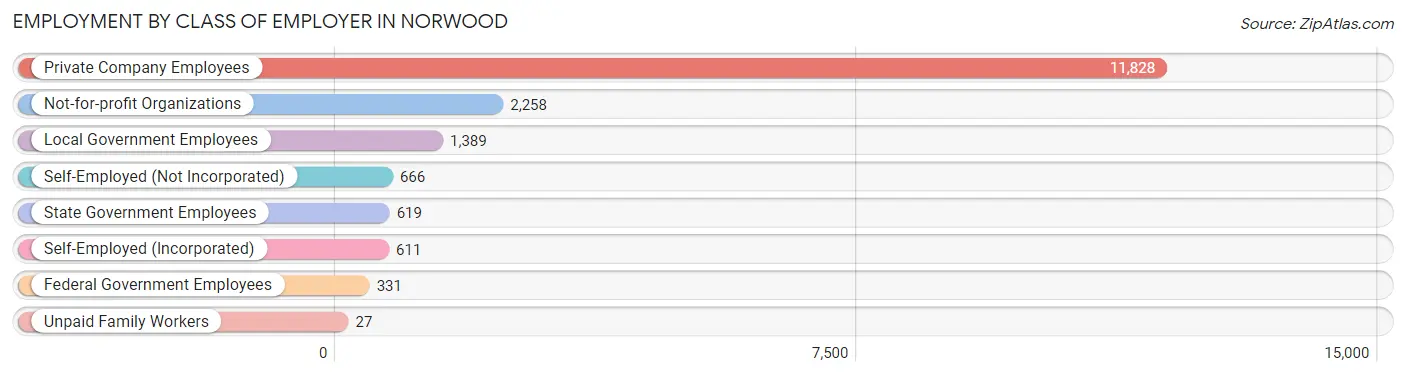
| Employer Class | # Employees | % Employees |
| Private Company Employees | 11,828 | 66.7% |
| Self-Employed (Incorporated) | 611 | 3.5% |
| Self-Employed (Not Incorporated) | 666 | 3.8% |
| Not-for-profit Organizations | 2,258 | 12.7% |
| Local Government Employees | 1,389 | 7.8% |
| State Government Employees | 619 | 3.5% |
| Federal Government Employees | 331 | 1.9% |
| Unpaid Family Workers | 27 | 0.2% |
| Total | 17,729 | 100.0% |
Employment Status by Age in Norwood
According to the labor force statistics for Norwood, out of the total population over 16 years of age (25,722), 72.3% or 18,597 individuals are in the labor force, with 3.6% or 669 of them unemployed. The age group with the highest labor force participation rate is 45 to 54 years, with 92.5% or 3,662 individuals in the labor force. Within the labor force, the 16 to 19 years age range has the highest percentage of unemployed individuals, with 11.0% or 62 of them being unemployed.
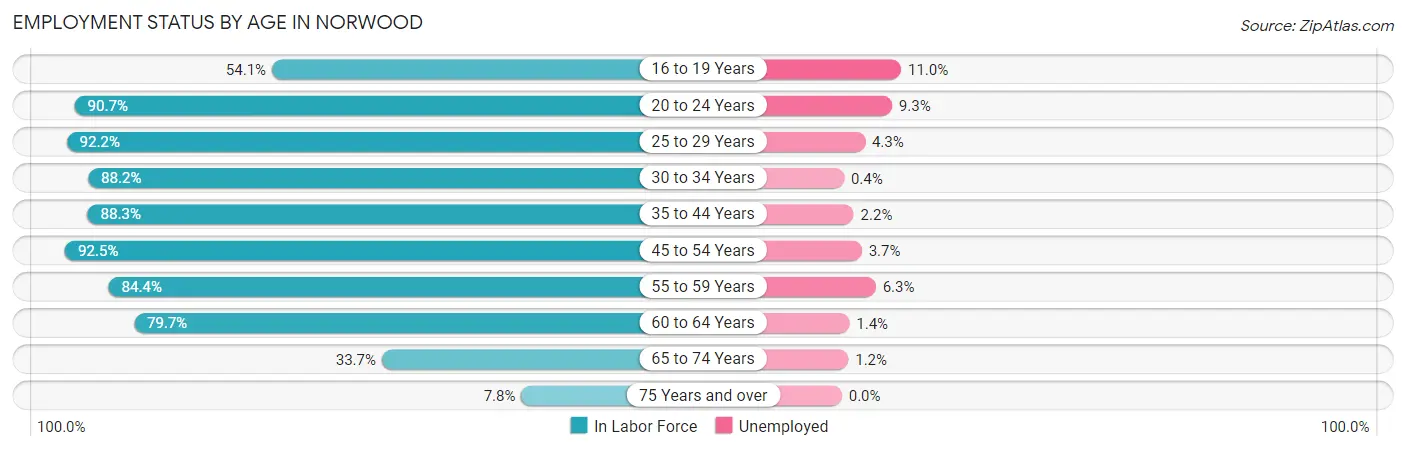
| Age Bracket | In Labor Force | Unemployed |
| 16 to 19 Years | 562 (54.1%) | 62 (11.0%) |
| 20 to 24 Years | 1,453 (90.7%) | 135 (9.3%) |
| 25 to 29 Years | 2,606 (92.2%) | 112 (4.3%) |
| 30 to 34 Years | 2,227 (88.2%) | 9 (0.4%) |
| 35 to 44 Years | 3,535 (88.3%) | 78 (2.2%) |
| 45 to 54 Years | 3,662 (92.5%) | 135 (3.7%) |
| 55 to 59 Years | 1,676 (84.4%) | 106 (6.3%) |
| 60 to 64 Years | 1,743 (79.7%) | 24 (1.4%) |
| 65 to 74 Years | 902 (33.7%) | 11 (1.2%) |
| 75 Years and over | 228 (7.8%) | 0 (0.0%) |
| Total | 18,597 (72.3%) | 669 (3.6%) |
Employment Status by Educational Attainment in Norwood
According to labor force statistics for Norwood, 88.4% of individuals (15,458) out of the total population between 25 and 64 years of age (17,486) are in the labor force, with 3.0% or 464 of them being unemployed. The group with the highest labor force participation rate are those with the educational attainment of bachelor's degree or higher, with 91.6% or 9,501 individuals in the labor force. Within the labor force, individuals with college / associate degree education have the highest percentage of unemployment, with 5.3% or 177 of them being unemployed.
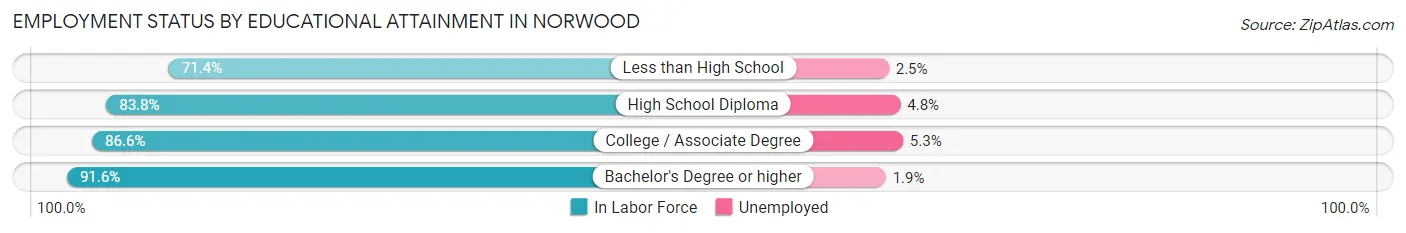
| Educational Attainment | In Labor Force | Unemployed |
| Less than High School | 678 (71.4%) | 24 (2.5%) |
| High School Diploma | 1,932 (83.8%) | 111 (4.8%) |
| College / Associate Degree | 3,341 (86.6%) | 204 (5.3%) |
| Bachelor's Degree or higher | 9,501 (91.6%) | 197 (1.9%) |
| Total | 15,458 (88.4%) | 525 (3.0%) |
Employment Occupations by Sex in Norwood
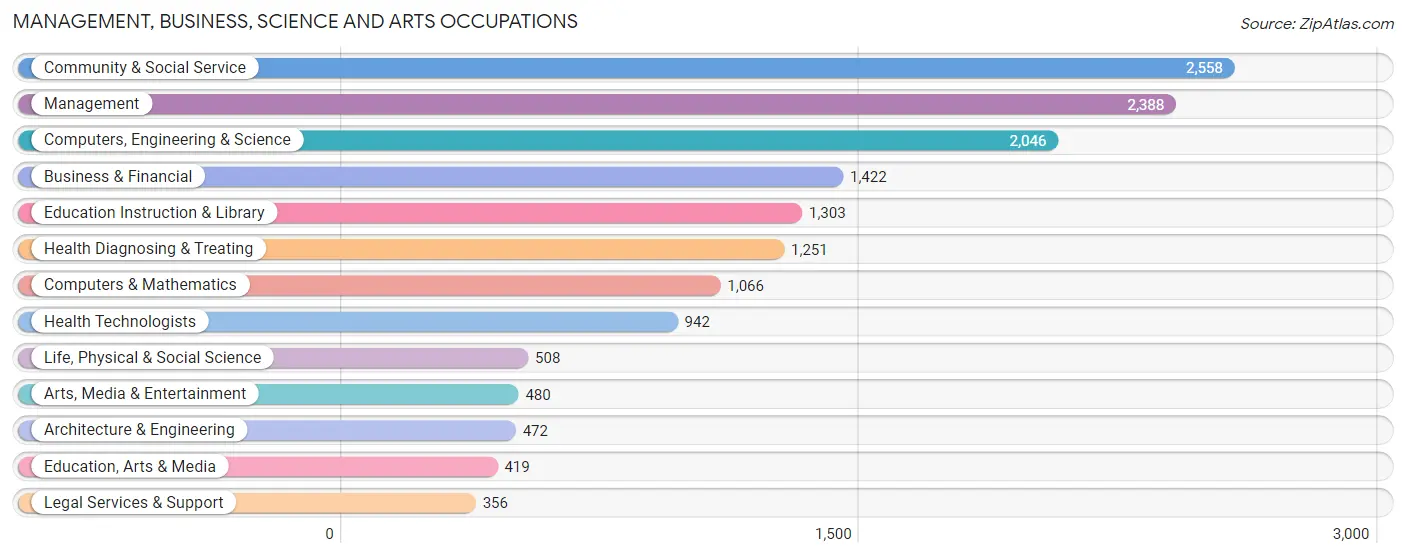
Management, Business, Science and Arts Occupations
The most common Management, Business, Science and Arts occupations in Norwood are Community & Social Service (2,558 | 14.3%), Management (2,388 | 13.3%), Computers, Engineering & Science (2,046 | 11.4%), Business & Financial (1,422 | 7.9%), and Education Instruction & Library (1,303 | 7.3%).
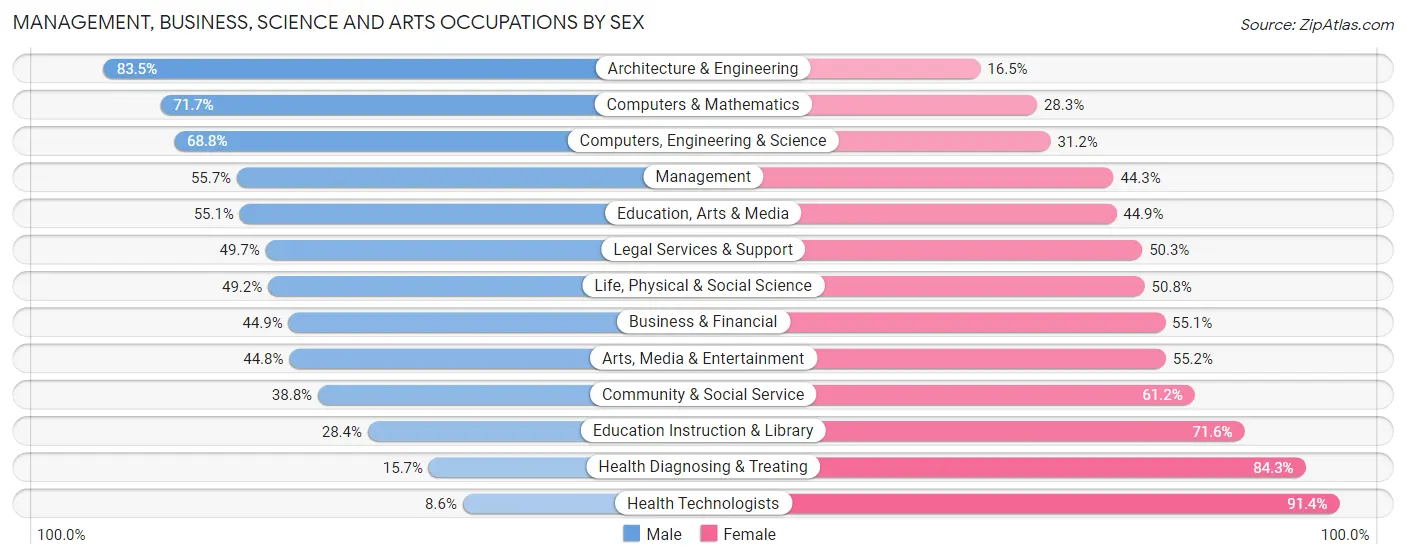
Management, Business, Science and Arts Occupations by Sex
Within the Management, Business, Science and Arts occupations in Norwood, the most male-oriented occupations are Architecture & Engineering (83.5%), Computers & Mathematics (71.7%), and Computers, Engineering & Science (68.8%), while the most female-oriented occupations are Health Technologists (91.4%), Health Diagnosing & Treating (84.3%), and Education Instruction & Library (71.6%).
| Occupation | Male | Female |
| Management | 1,330 (55.7%) | 1,058 (44.3%) |
| Business & Financial | 639 (44.9%) | 783 (55.1%) |
| Computers, Engineering & Science | 1,408 (68.8%) | 638 (31.2%) |
| Computers & Mathematics | 764 (71.7%) | 302 (28.3%) |
| Architecture & Engineering | 394 (83.5%) | 78 (16.5%) |
| Life, Physical & Social Science | 250 (49.2%) | 258 (50.8%) |
| Community & Social Service | 993 (38.8%) | 1,565 (61.2%) |
| Education, Arts & Media | 231 (55.1%) | 188 (44.9%) |
| Legal Services & Support | 177 (49.7%) | 179 (50.3%) |
| Education Instruction & Library | 370 (28.4%) | 933 (71.6%) |
| Arts, Media & Entertainment | 215 (44.8%) | 265 (55.2%) |
| Health Diagnosing & Treating | 196 (15.7%) | 1,055 (84.3%) |
| Health Technologists | 81 (8.6%) | 861 (91.4%) |
| Total (Category) | 4,566 (47.2%) | 5,099 (52.8%) |
| Total (Overall) | 9,156 (51.1%) | 8,769 (48.9%) |
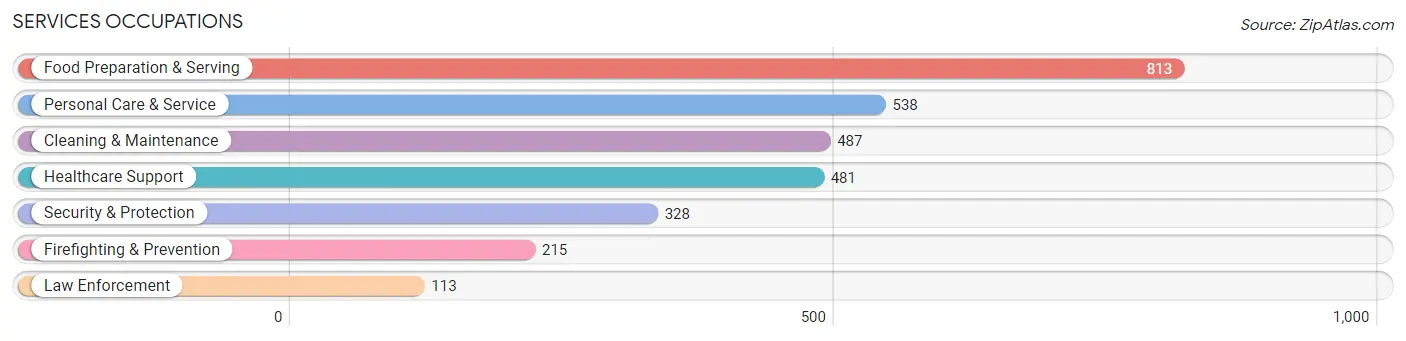
Services Occupations
The most common Services occupations in Norwood are Food Preparation & Serving (813 | 4.5%), Personal Care & Service (538 | 3.0%), Cleaning & Maintenance (487 | 2.7%), Healthcare Support (481 | 2.7%), and Security & Protection (328 | 1.8%).
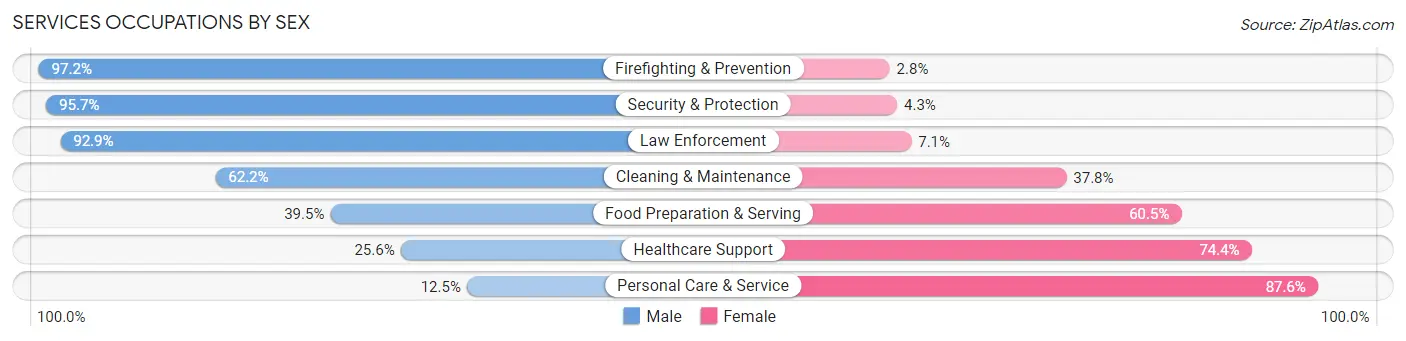
Services Occupations by Sex
Within the Services occupations in Norwood, the most male-oriented occupations are Firefighting & Prevention (97.2%), Security & Protection (95.7%), and Law Enforcement (92.9%), while the most female-oriented occupations are Personal Care & Service (87.5%), Healthcare Support (74.4%), and Food Preparation & Serving (60.5%).
| Occupation | Male | Female |
| Healthcare Support | 123 (25.6%) | 358 (74.4%) |
| Security & Protection | 314 (95.7%) | 14 (4.3%) |
| Firefighting & Prevention | 209 (97.2%) | 6 (2.8%) |
| Law Enforcement | 105 (92.9%) | 8 (7.1%) |
| Food Preparation & Serving | 321 (39.5%) | 492 (60.5%) |
| Cleaning & Maintenance | 303 (62.2%) | 184 (37.8%) |
| Personal Care & Service | 67 (12.4%) | 471 (87.5%) |
| Total (Category) | 1,128 (42.6%) | 1,519 (57.4%) |
| Total (Overall) | 9,156 (51.1%) | 8,769 (48.9%) |
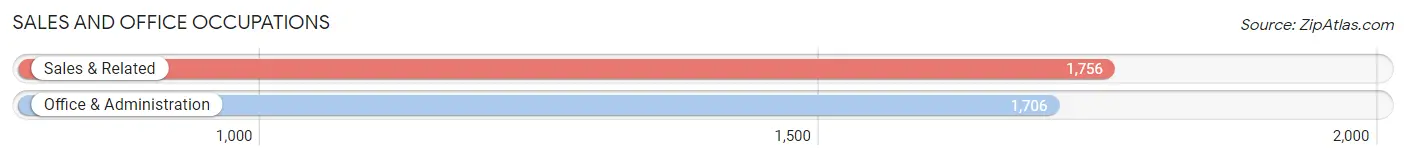
Sales and Office Occupations
The most common Sales and Office occupations in Norwood are Sales & Related (1,756 | 9.8%), and Office & Administration (1,706 | 9.5%).
Sales and Office Occupations by Sex
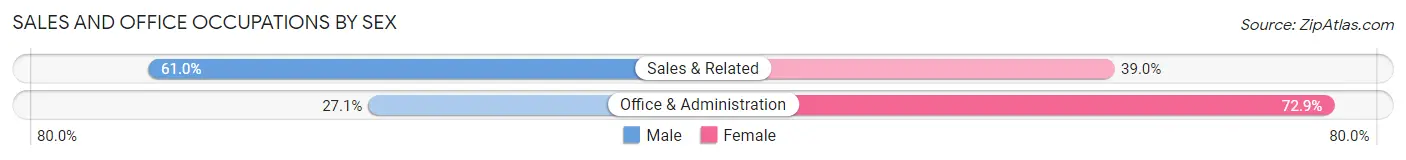
| Occupation | Male | Female |
| Sales & Related | 1,071 (61.0%) | 685 (39.0%) |
| Office & Administration | 463 (27.1%) | 1,243 (72.9%) |
| Total (Category) | 1,534 (44.3%) | 1,928 (55.7%) |
| Total (Overall) | 9,156 (51.1%) | 8,769 (48.9%) |
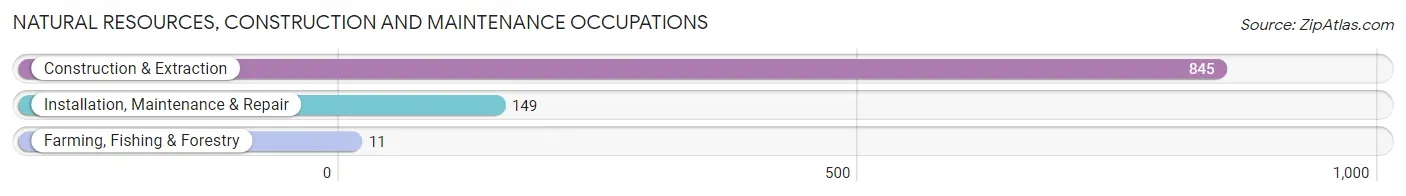
Natural Resources, Construction and Maintenance Occupations
The most common Natural Resources, Construction and Maintenance occupations in Norwood are Construction & Extraction (845 | 4.7%), Installation, Maintenance & Repair (149 | 0.8%), and Farming, Fishing & Forestry (11 | 0.1%).
Natural Resources, Construction and Maintenance Occupations by Sex
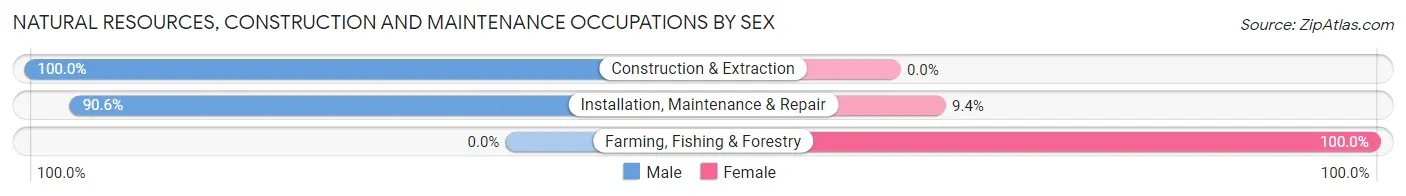
| Occupation | Male | Female |
| Farming, Fishing & Forestry | 0 (0.0%) | 11 (100.0%) |
| Construction & Extraction | 845 (100.0%) | 0 (0.0%) |
| Installation, Maintenance & Repair | 135 (90.6%) | 14 (9.4%) |
| Total (Category) | 980 (97.5%) | 25 (2.5%) |
| Total (Overall) | 9,156 (51.1%) | 8,769 (48.9%) |
Production, Transportation and Moving Occupations
The most common Production, Transportation and Moving occupations in Norwood are Material Moving (470 | 2.6%), Production (340 | 1.9%), and Transportation (336 | 1.9%).
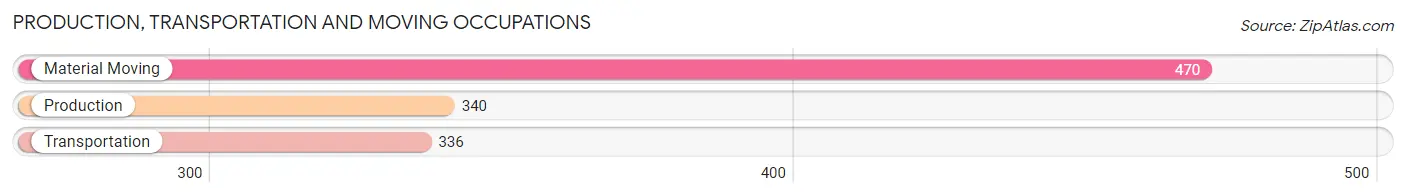
Production, Transportation and Moving Occupations by Sex
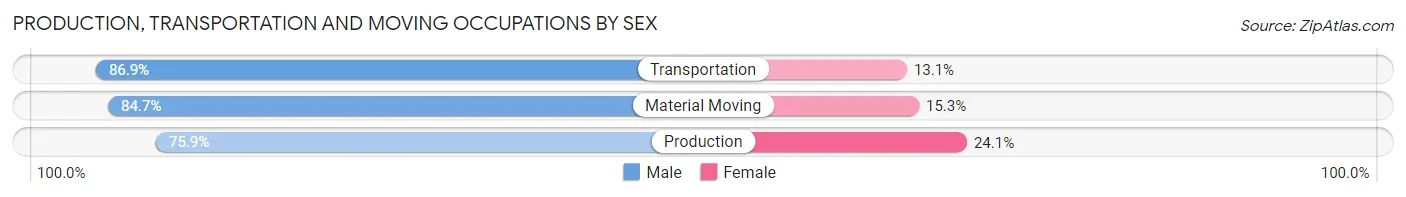
| Occupation | Male | Female |
| Production | 258 (75.9%) | 82 (24.1%) |
| Transportation | 292 (86.9%) | 44 (13.1%) |
| Material Moving | 398 (84.7%) | 72 (15.3%) |
| Total (Category) | 948 (82.7%) | 198 (17.3%) |
| Total (Overall) | 9,156 (51.1%) | 8,769 (48.9%) |
Employment Industries by Sex in Norwood
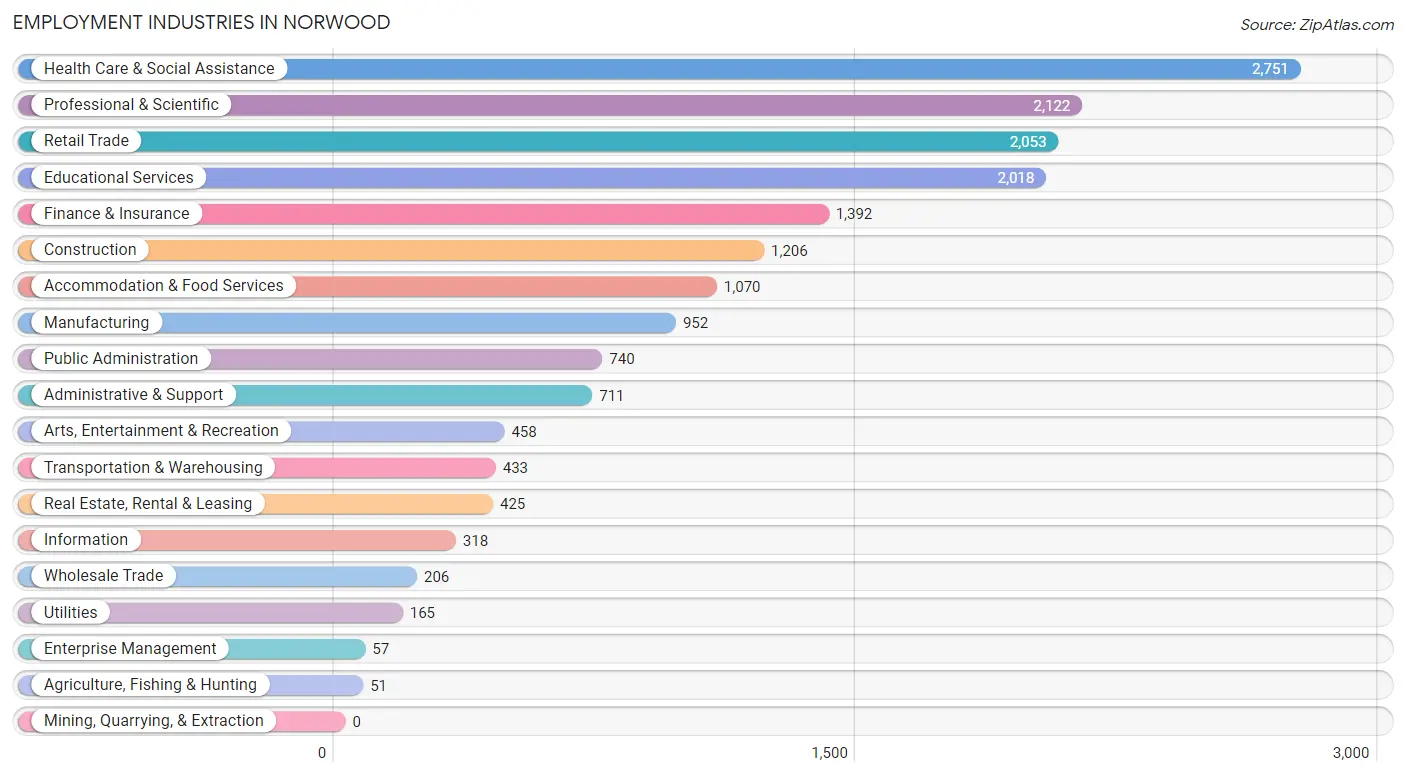
Employment Industries in Norwood
The major employment industries in Norwood include Health Care & Social Assistance (2,751 | 15.3%), Professional & Scientific (2,122 | 11.8%), Retail Trade (2,053 | 11.5%), Educational Services (2,018 | 11.3%), and Finance & Insurance (1,392 | 7.8%).
Employment Industries by Sex in Norwood
The Norwood industries that see more men than women are Construction (97.9%), Wholesale Trade (93.7%), and Transportation & Warehousing (87.1%), whereas the industries that tend to have a higher number of women are Enterprise Management (100.0%), Health Care & Social Assistance (80.6%), and Educational Services (63.8%).
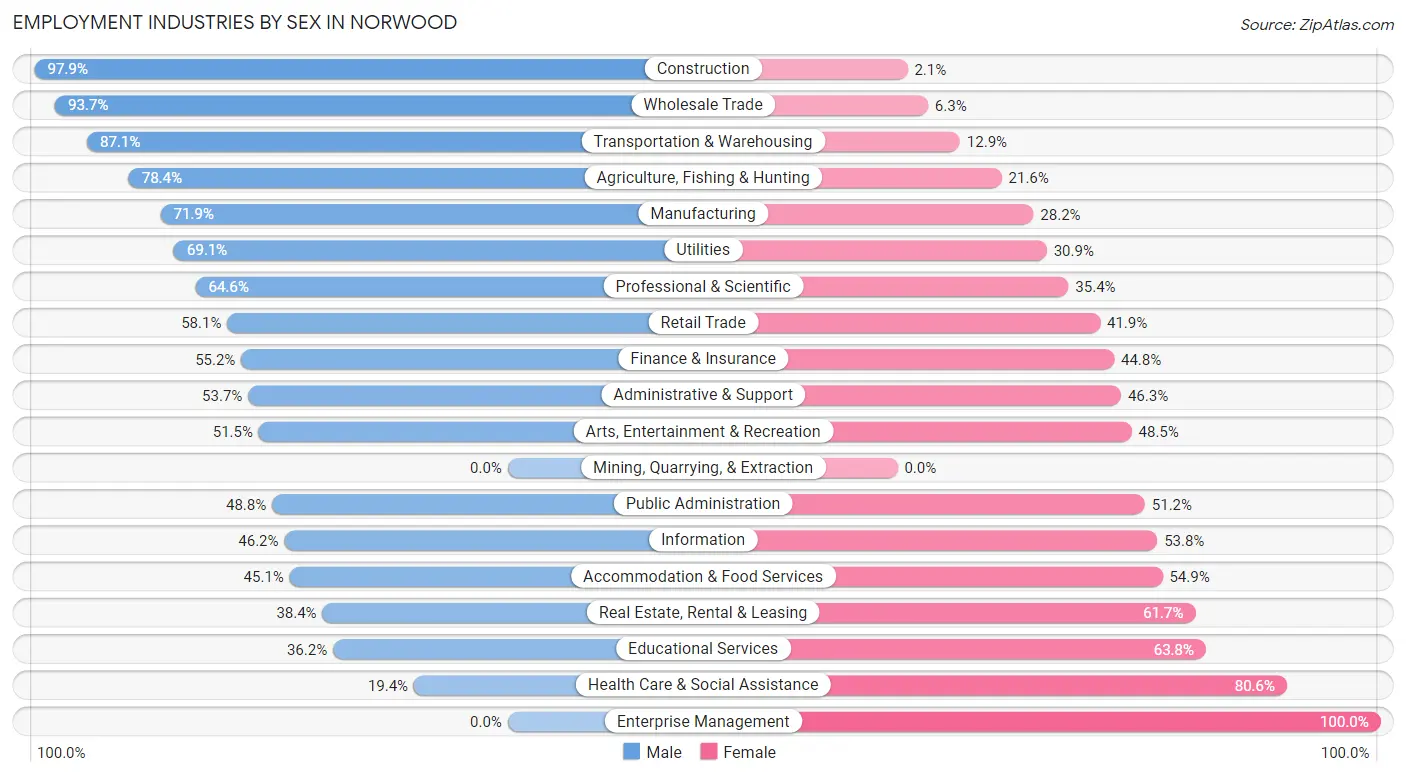
| Industry | Male | Female |
| Agriculture, Fishing & Hunting | 40 (78.4%) | 11 (21.6%) |
| Mining, Quarrying, & Extraction | 0 (0.0%) | 0 (0.0%) |
| Construction | 1,181 (97.9%) | 25 (2.1%) |
| Manufacturing | 684 (71.9%) | 268 (28.1%) |
| Wholesale Trade | 193 (93.7%) | 13 (6.3%) |
| Retail Trade | 1,192 (58.1%) | 861 (41.9%) |
| Transportation & Warehousing | 377 (87.1%) | 56 (12.9%) |
| Utilities | 114 (69.1%) | 51 (30.9%) |
| Information | 147 (46.2%) | 171 (53.8%) |
| Finance & Insurance | 768 (55.2%) | 624 (44.8%) |
| Real Estate, Rental & Leasing | 163 (38.4%) | 262 (61.7%) |
| Professional & Scientific | 1,371 (64.6%) | 751 (35.4%) |
| Enterprise Management | 0 (0.0%) | 57 (100.0%) |
| Administrative & Support | 382 (53.7%) | 329 (46.3%) |
| Educational Services | 730 (36.2%) | 1,288 (63.8%) |
| Health Care & Social Assistance | 534 (19.4%) | 2,217 (80.6%) |
| Arts, Entertainment & Recreation | 236 (51.5%) | 222 (48.5%) |
| Accommodation & Food Services | 483 (45.1%) | 587 (54.9%) |
| Public Administration | 361 (48.8%) | 379 (51.2%) |
| Total | 9,156 (51.1%) | 8,769 (48.9%) |
Education in Norwood
School Enrollment in Norwood
The most common levels of schooling among the 6,415 students in Norwood are elementary school (1,451 | 22.6%), high school (1,341 | 20.9%), and middle school (1,319 | 20.6%).
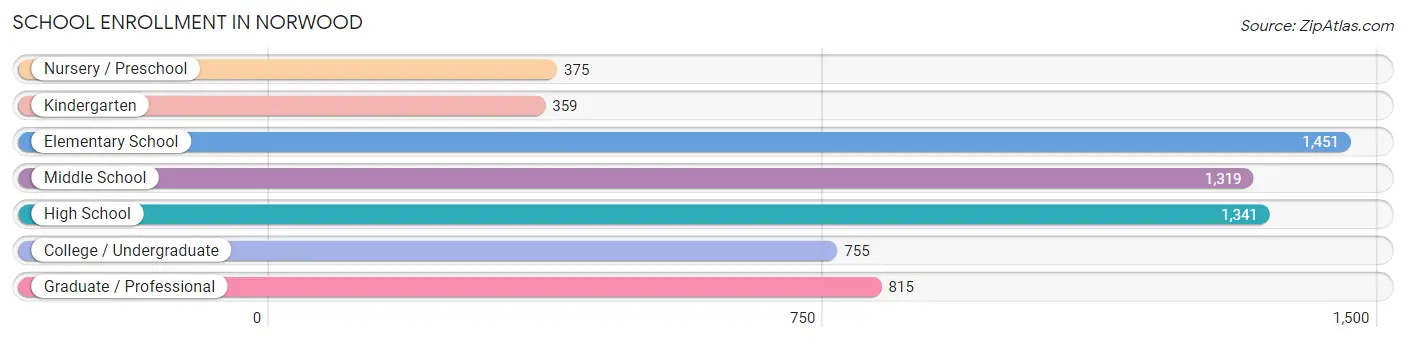
| School Level | # Students | % Students |
| Nursery / Preschool | 375 | 5.9% |
| Kindergarten | 359 | 5.6% |
| Elementary School | 1,451 | 22.6% |
| Middle School | 1,319 | 20.6% |
| High School | 1,341 | 20.9% |
| College / Undergraduate | 755 | 11.8% |
| Graduate / Professional | 815 | 12.7% |
| Total | 6,415 | 100.0% |
School Enrollment by Age by Funding Source in Norwood
Out of a total of 6,415 students who are enrolled in schools in Norwood, 1,488 (23.2%) attend a private institution, while the remaining 4,927 (76.8%) are enrolled in public schools. The age group of 3 to 4 year olds has the highest likelihood of being enrolled in private schools, with 142 (56.8% in the age bracket) enrolled. Conversely, the age group of 15 to 17 year olds has the lowest likelihood of being enrolled in a private school, with 824 (90.7% in the age bracket) attending a public institution.
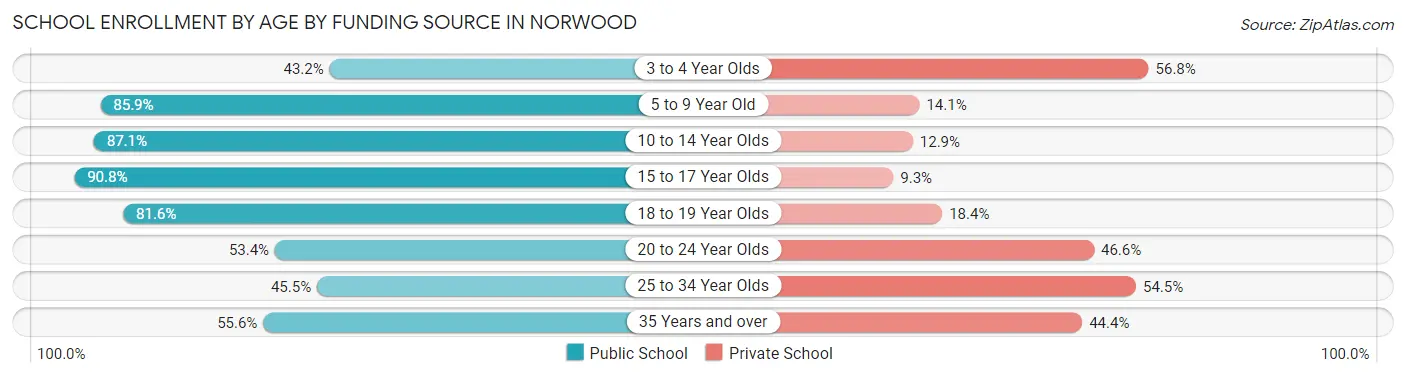
| Age Bracket | Public School | Private School |
| 3 to 4 Year Olds | 108 (43.2%) | 142 (56.8%) |
| 5 to 9 Year Old | 1,429 (85.9%) | 235 (14.1%) |
| 10 to 14 Year Olds | 1,413 (87.1%) | 209 (12.9%) |
| 15 to 17 Year Olds | 824 (90.7%) | 84 (9.2%) |
| 18 to 19 Year Olds | 409 (81.6%) | 92 (18.4%) |
| 20 to 24 Year Olds | 317 (53.4%) | 277 (46.6%) |
| 25 to 34 Year Olds | 276 (45.5%) | 330 (54.5%) |
| 35 Years and over | 150 (55.6%) | 120 (44.4%) |
| Total | 4,927 (76.8%) | 1,488 (23.2%) |
Educational Attainment by Field of Study in Norwood
Business (2,773 | 21.0%), science & technology (1,430 | 10.9%), education (1,177 | 8.9%), social sciences (1,130 | 8.6%), and engineering (1,098 | 8.3%) are the most common fields of study among 13,171 individuals in Norwood who have obtained a bachelor's degree or higher.
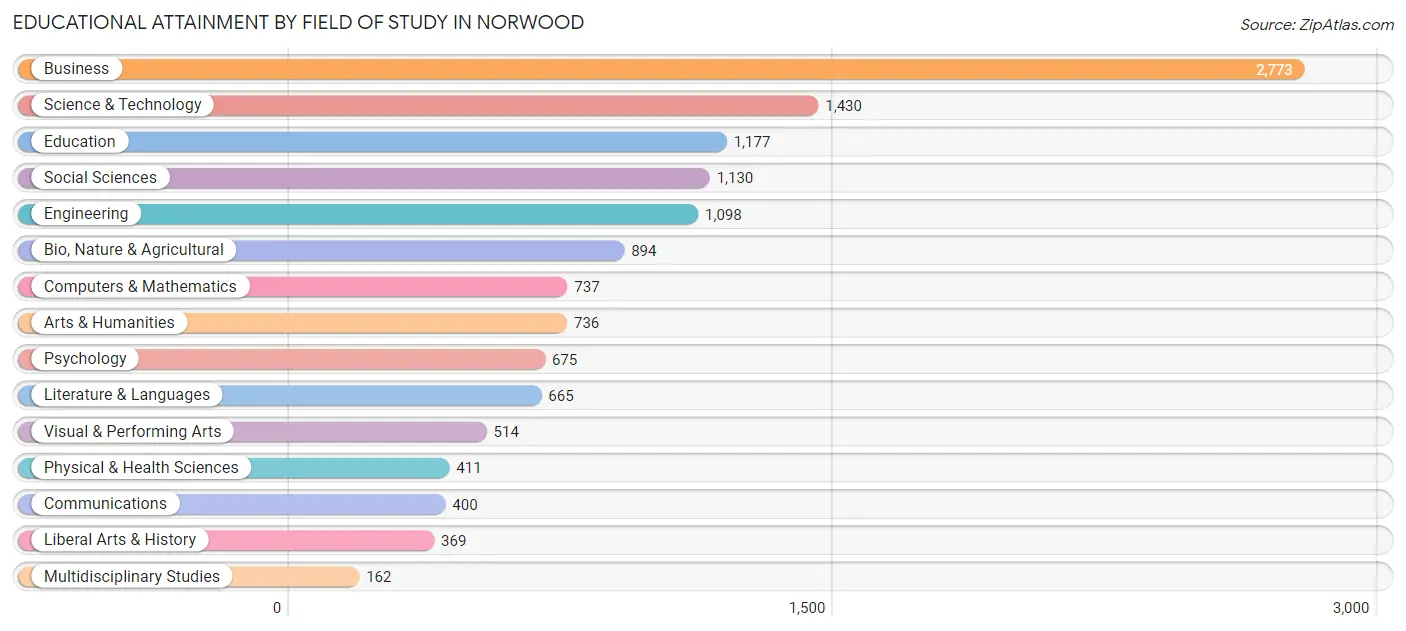
| Field of Study | # Graduates | % Graduates |
| Computers & Mathematics | 737 | 5.6% |
| Bio, Nature & Agricultural | 894 | 6.8% |
| Physical & Health Sciences | 411 | 3.1% |
| Psychology | 675 | 5.1% |
| Social Sciences | 1,130 | 8.6% |
| Engineering | 1,098 | 8.3% |
| Multidisciplinary Studies | 162 | 1.2% |
| Science & Technology | 1,430 | 10.9% |
| Business | 2,773 | 21.0% |
| Education | 1,177 | 8.9% |
| Literature & Languages | 665 | 5.1% |
| Liberal Arts & History | 369 | 2.8% |
| Visual & Performing Arts | 514 | 3.9% |
| Communications | 400 | 3.0% |
| Arts & Humanities | 736 | 5.6% |
| Total | 13,171 | 100.0% |
Transportation & Commute in Norwood
Vehicle Availability by Sex in Norwood
The most prevalent vehicle ownership categories in Norwood are males with 2 vehicles (3,998, accounting for 43.9%) and females with 2 vehicles (3,562, making up 46.4%).
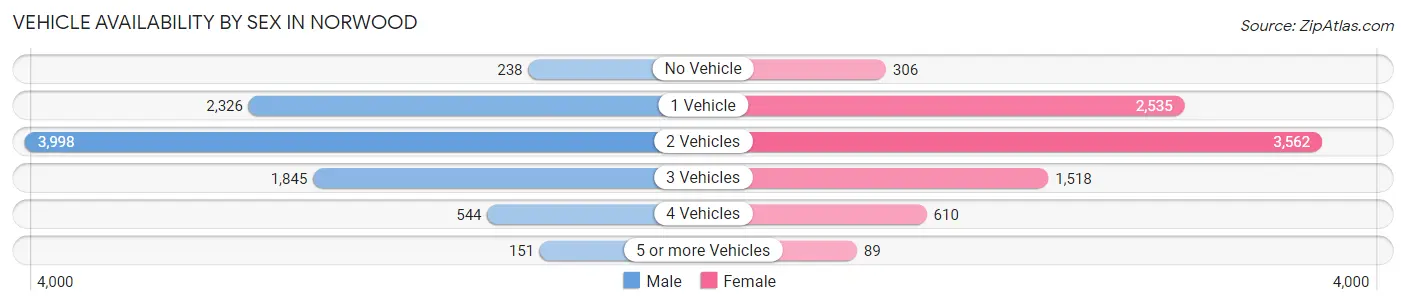
| Vehicles Available | Male | Female |
| No Vehicle | 238 (2.6%) | 306 (3.5%) |
| 1 Vehicle | 2,326 (25.6%) | 2,535 (29.4%) |
| 2 Vehicles | 3,998 (43.9%) | 3,562 (41.3%) |
| 3 Vehicles | 1,845 (20.3%) | 1,518 (17.6%) |
| 4 Vehicles | 544 (6.0%) | 610 (7.1%) |
| 5 or more Vehicles | 151 (1.7%) | 89 (1.0%) |
| Total | 9,102 (100.0%) | 8,620 (100.0%) |
Commute Time in Norwood
The most frequently occuring commute durations in Norwood are 30 to 34 minutes (2,124 commuters, 13.7%), 45 to 59 minutes (2,048 commuters, 13.2%), and 15 to 19 minutes (1,679 commuters, 10.8%).
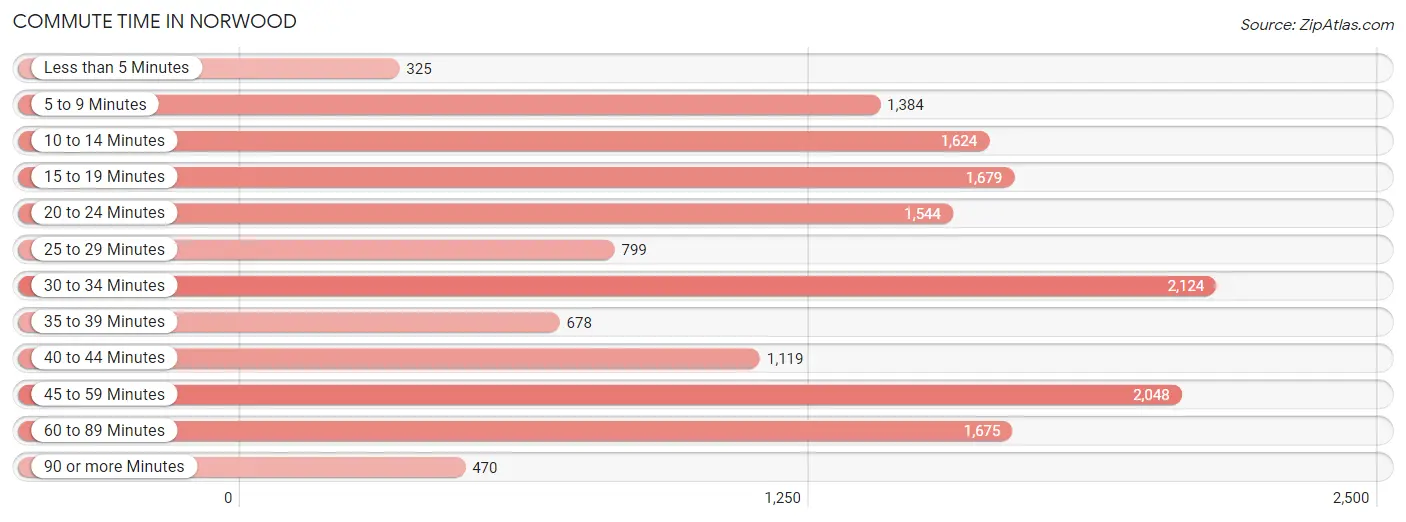
| Commute Time | # Commuters | % Commuters |
| Less than 5 Minutes | 325 | 2.1% |
| 5 to 9 Minutes | 1,384 | 8.9% |
| 10 to 14 Minutes | 1,624 | 10.5% |
| 15 to 19 Minutes | 1,679 | 10.8% |
| 20 to 24 Minutes | 1,544 | 10.0% |
| 25 to 29 Minutes | 799 | 5.2% |
| 30 to 34 Minutes | 2,124 | 13.7% |
| 35 to 39 Minutes | 678 | 4.4% |
| 40 to 44 Minutes | 1,119 | 7.2% |
| 45 to 59 Minutes | 2,048 | 13.2% |
| 60 to 89 Minutes | 1,675 | 10.8% |
| 90 or more Minutes | 470 | 3.0% |
Commute Time by Sex in Norwood
The most common commute times in Norwood are 45 to 59 minutes (1,210 commuters, 15.1%) for males and 30 to 34 minutes (1,149 commuters, 15.4%) for females.
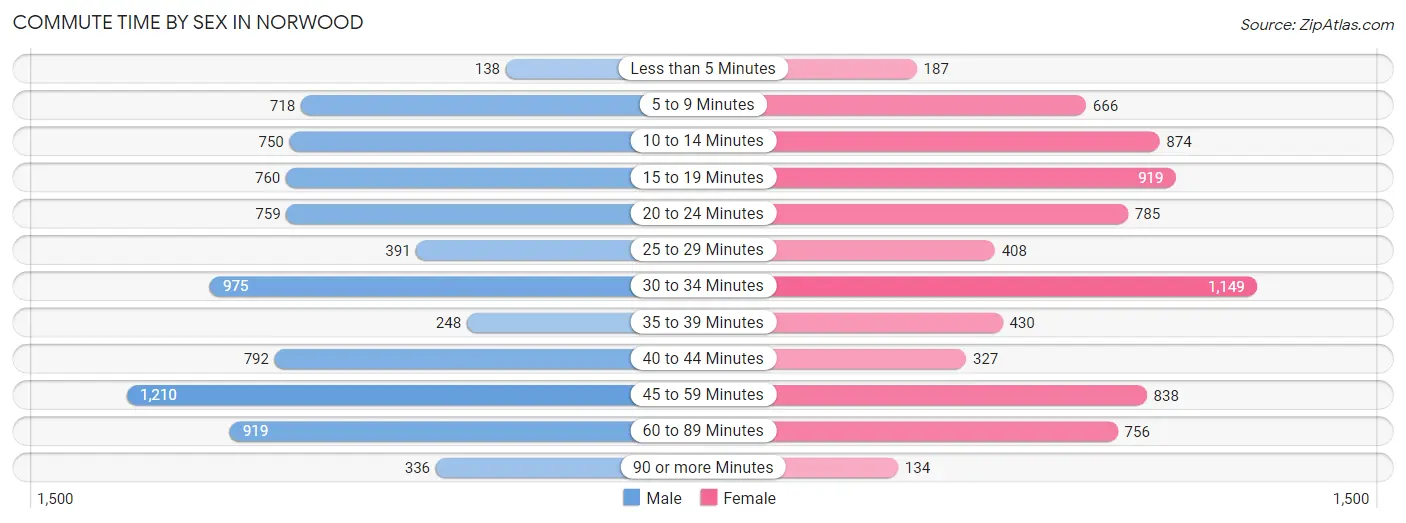
| Commute Time | Male | Female |
| Less than 5 Minutes | 138 (1.7%) | 187 (2.5%) |
| 5 to 9 Minutes | 718 (9.0%) | 666 (8.9%) |
| 10 to 14 Minutes | 750 (9.4%) | 874 (11.7%) |
| 15 to 19 Minutes | 760 (9.5%) | 919 (12.3%) |
| 20 to 24 Minutes | 759 (9.5%) | 785 (10.5%) |
| 25 to 29 Minutes | 391 (4.9%) | 408 (5.5%) |
| 30 to 34 Minutes | 975 (12.2%) | 1,149 (15.4%) |
| 35 to 39 Minutes | 248 (3.1%) | 430 (5.8%) |
| 40 to 44 Minutes | 792 (9.9%) | 327 (4.4%) |
| 45 to 59 Minutes | 1,210 (15.1%) | 838 (11.2%) |
| 60 to 89 Minutes | 919 (11.5%) | 756 (10.1%) |
| 90 or more Minutes | 336 (4.2%) | 134 (1.8%) |
Time of Departure to Work by Sex in Norwood
The most frequent times of departure to work in Norwood are 6:30 AM to 6:59 AM (1,204, 15.1%) for males and 7:00 AM to 7:29 AM (1,060, 14.2%) for females.
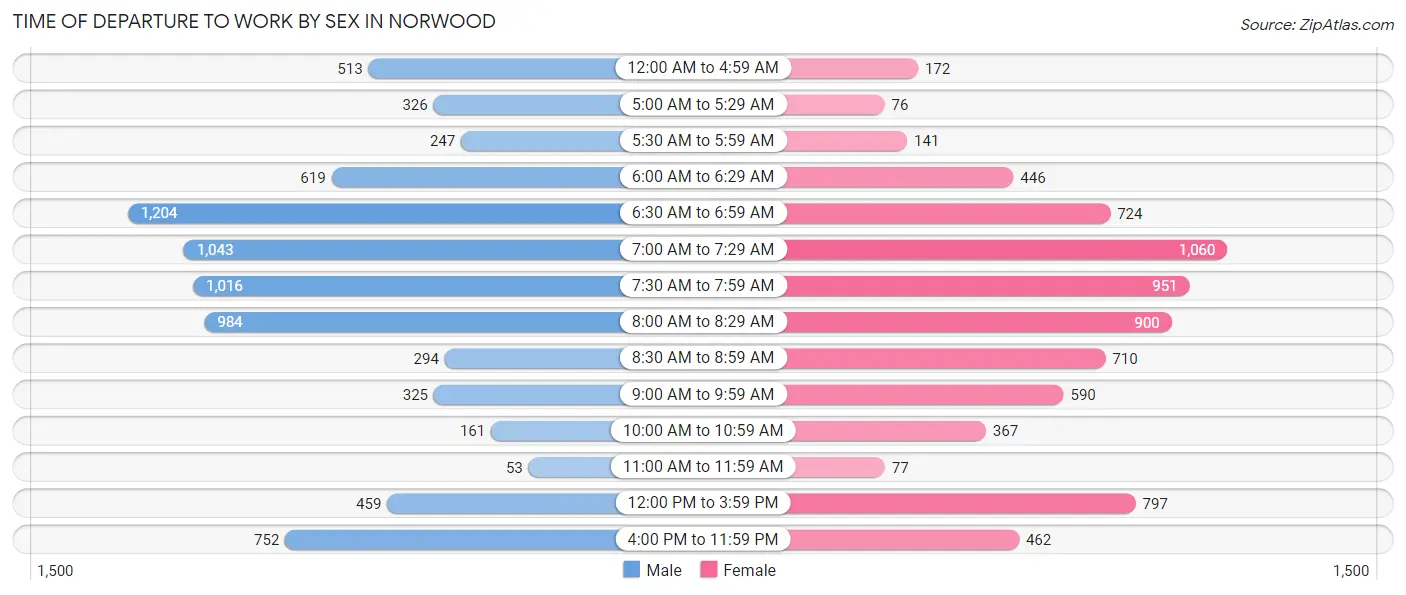
| Time of Departure | Male | Female |
| 12:00 AM to 4:59 AM | 513 (6.4%) | 172 (2.3%) |
| 5:00 AM to 5:29 AM | 326 (4.1%) | 76 (1.0%) |
| 5:30 AM to 5:59 AM | 247 (3.1%) | 141 (1.9%) |
| 6:00 AM to 6:29 AM | 619 (7.7%) | 446 (6.0%) |
| 6:30 AM to 6:59 AM | 1,204 (15.1%) | 724 (9.7%) |
| 7:00 AM to 7:29 AM | 1,043 (13.0%) | 1,060 (14.2%) |
| 7:30 AM to 7:59 AM | 1,016 (12.7%) | 951 (12.7%) |
| 8:00 AM to 8:29 AM | 984 (12.3%) | 900 (12.0%) |
| 8:30 AM to 8:59 AM | 294 (3.7%) | 710 (9.5%) |
| 9:00 AM to 9:59 AM | 325 (4.1%) | 590 (7.9%) |
| 10:00 AM to 10:59 AM | 161 (2.0%) | 367 (4.9%) |
| 11:00 AM to 11:59 AM | 53 (0.7%) | 77 (1.0%) |
| 12:00 PM to 3:59 PM | 459 (5.7%) | 797 (10.7%) |
| 4:00 PM to 11:59 PM | 752 (9.4%) | 462 (6.2%) |
| Total | 7,996 (100.0%) | 7,473 (100.0%) |
Housing Occupancy in Norwood
Occupancy by Ownership in Norwood
Of the total 13,114 dwellings in Norwood, owner-occupied units account for 6,745 (51.4%), while renter-occupied units make up 6,369 (48.6%).
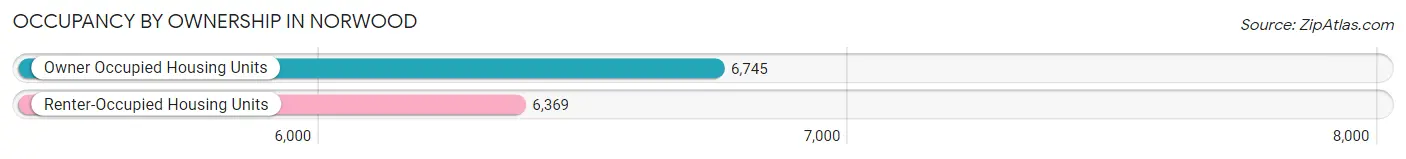
| Occupancy | # Housing Units | % Housing Units |
| Owner Occupied Housing Units | 6,745 | 51.4% |
| Renter-Occupied Housing Units | 6,369 | 48.6% |
| Total Occupied Housing Units | 13,114 | 100.0% |
Occupancy by Household Size in Norwood
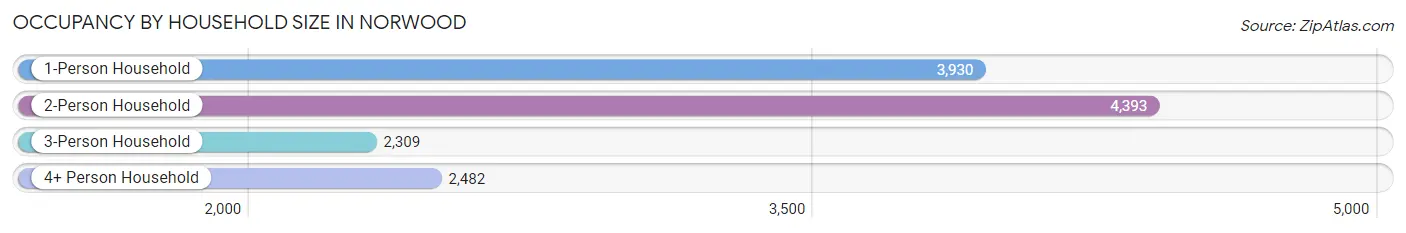
| Household Size | # Housing Units | % Housing Units |
| 1-Person Household | 3,930 | 30.0% |
| 2-Person Household | 4,393 | 33.5% |
| 3-Person Household | 2,309 | 17.6% |
| 4+ Person Household | 2,482 | 18.9% |
| Total Housing Units | 13,114 | 100.0% |
Occupancy by Ownership by Household Size in Norwood
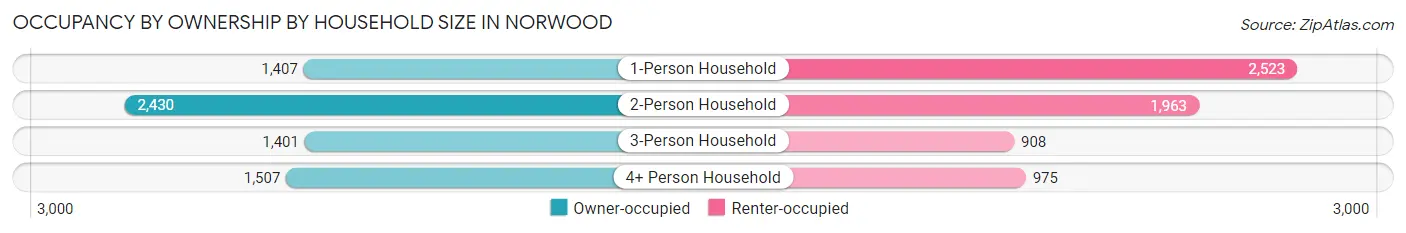
| Household Size | Owner-occupied | Renter-occupied |
| 1-Person Household | 1,407 (35.8%) | 2,523 (64.2%) |
| 2-Person Household | 2,430 (55.3%) | 1,963 (44.7%) |
| 3-Person Household | 1,401 (60.7%) | 908 (39.3%) |
| 4+ Person Household | 1,507 (60.7%) | 975 (39.3%) |
| Total Housing Units | 6,745 (51.4%) | 6,369 (48.6%) |
Occupancy by Educational Attainment in Norwood
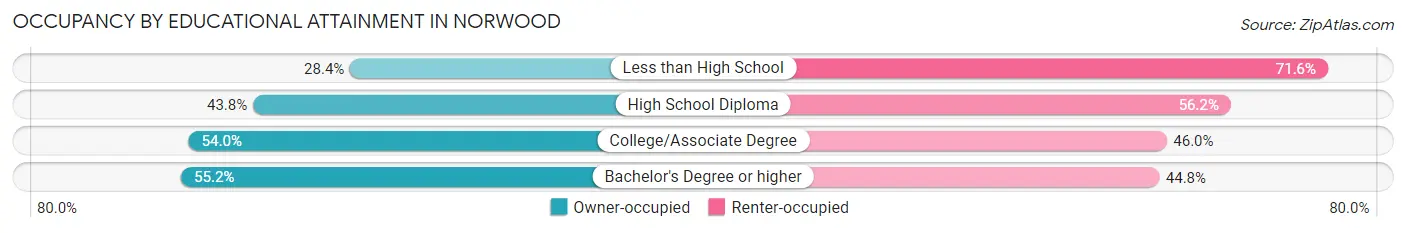
| Household Size | Owner-occupied | Renter-occupied |
| Less than High School | 249 (28.4%) | 629 (71.6%) |
| High School Diploma | 818 (43.8%) | 1,051 (56.2%) |
| College/Associate Degree | 1,847 (54.0%) | 1,575 (46.0%) |
| Bachelor's Degree or higher | 3,831 (55.2%) | 3,114 (44.8%) |
Occupancy by Age of Householder in Norwood
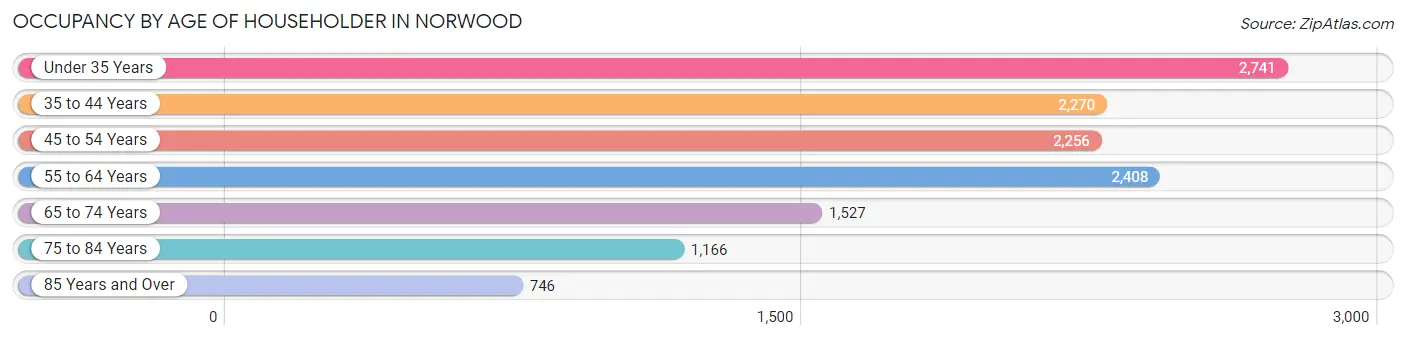
| Age Bracket | # Households | % Households |
| Under 35 Years | 2,741 | 20.9% |
| 35 to 44 Years | 2,270 | 17.3% |
| 45 to 54 Years | 2,256 | 17.2% |
| 55 to 64 Years | 2,408 | 18.4% |
| 65 to 74 Years | 1,527 | 11.6% |
| 75 to 84 Years | 1,166 | 8.9% |
| 85 Years and Over | 746 | 5.7% |
| Total | 13,114 | 100.0% |
Housing Finances in Norwood
Median Income by Occupancy in Norwood
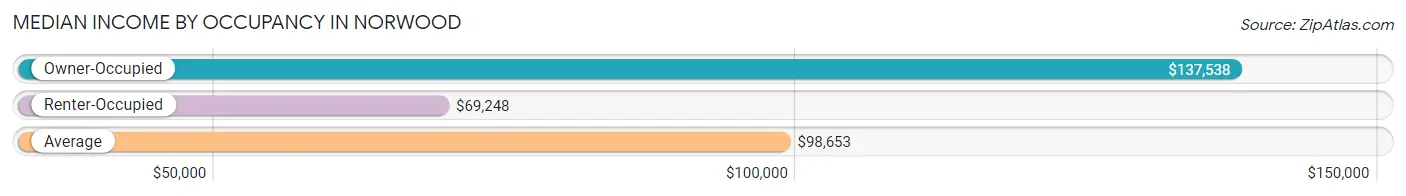
| Occupancy Type | # Households | Median Income |
| Owner-Occupied | 6,745 (51.4%) | $137,538 |
| Renter-Occupied | 6,369 (48.6%) | $69,248 |
| Average | 13,114 (100.0%) | $98,653 |
Occupancy by Householder Income Bracket in Norwood
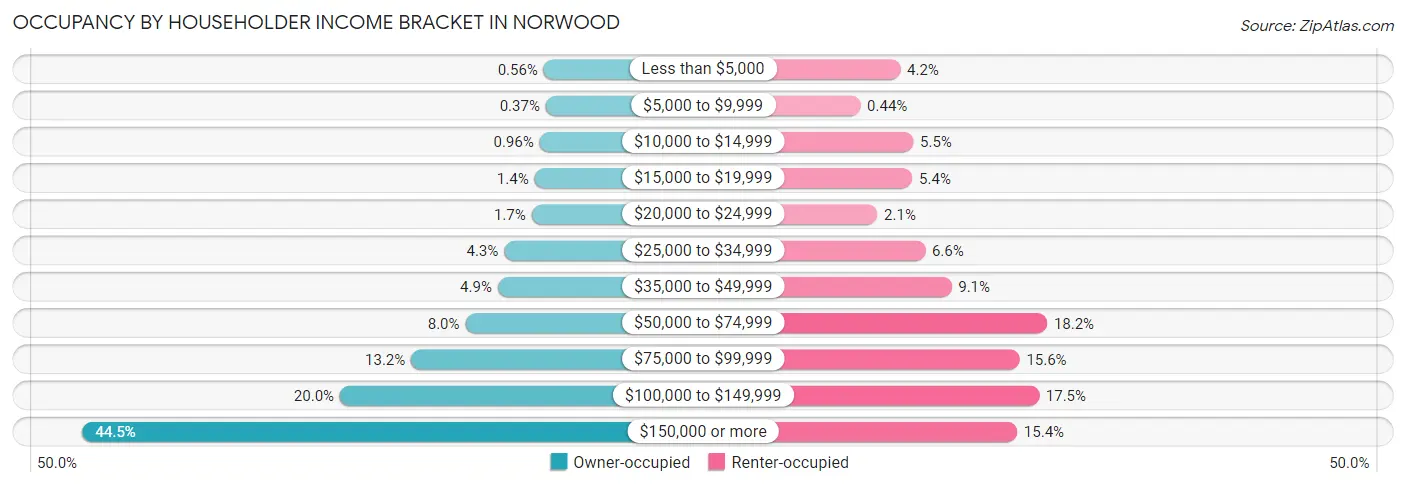
| Income Bracket | Owner-occupied | Renter-occupied |
| Less than $5,000 | 38 (0.6%) | 270 (4.2%) |
| $5,000 to $9,999 | 25 (0.4%) | 28 (0.4%) |
| $10,000 to $14,999 | 65 (1.0%) | 349 (5.5%) |
| $15,000 to $19,999 | 97 (1.4%) | 343 (5.4%) |
| $20,000 to $24,999 | 116 (1.7%) | 131 (2.1%) |
| $25,000 to $34,999 | 292 (4.3%) | 421 (6.6%) |
| $35,000 to $49,999 | 333 (4.9%) | 581 (9.1%) |
| $50,000 to $74,999 | 541 (8.0%) | 1,161 (18.2%) |
| $75,000 to $99,999 | 890 (13.2%) | 994 (15.6%) |
| $100,000 to $149,999 | 1,347 (20.0%) | 1,112 (17.5%) |
| $150,000 or more | 3,001 (44.5%) | 979 (15.4%) |
| Total | 6,745 (100.0%) | 6,369 (100.0%) |
Monthly Housing Cost Tiers in Norwood
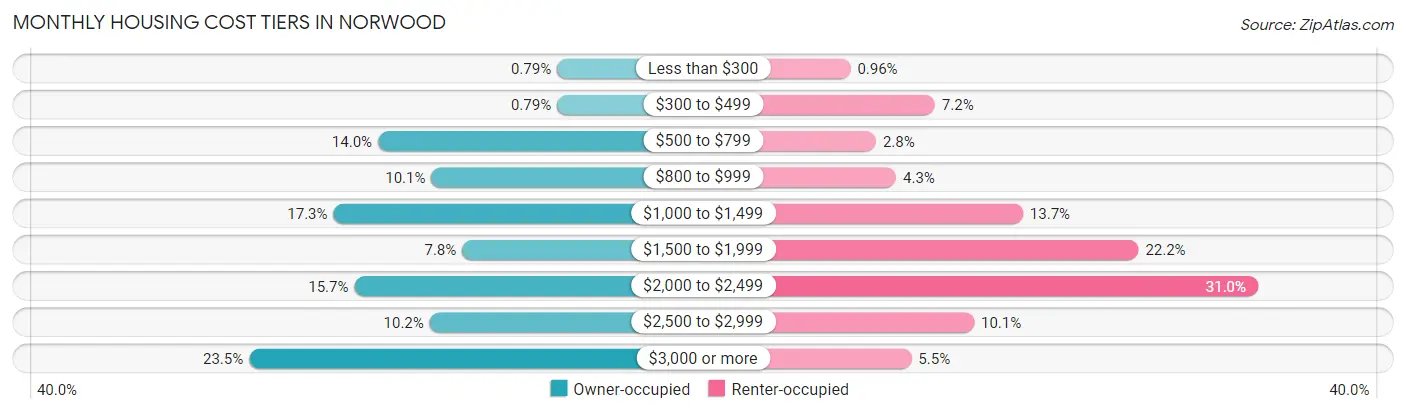
| Monthly Cost | Owner-occupied | Renter-occupied |
| Less than $300 | 53 (0.8%) | 61 (1.0%) |
| $300 to $499 | 53 (0.8%) | 457 (7.2%) |
| $500 to $799 | 943 (14.0%) | 181 (2.8%) |
| $800 to $999 | 678 (10.1%) | 275 (4.3%) |
| $1,000 to $1,499 | 1,164 (17.3%) | 870 (13.7%) |
| $1,500 to $1,999 | 525 (7.8%) | 1,412 (22.2%) |
| $2,000 to $2,499 | 1,060 (15.7%) | 1,972 (31.0%) |
| $2,500 to $2,999 | 686 (10.2%) | 641 (10.1%) |
| $3,000 or more | 1,583 (23.5%) | 347 (5.4%) |
| Total | 6,745 (100.0%) | 6,369 (100.0%) |
Physical Housing Characteristics in Norwood
Housing Structures in Norwood
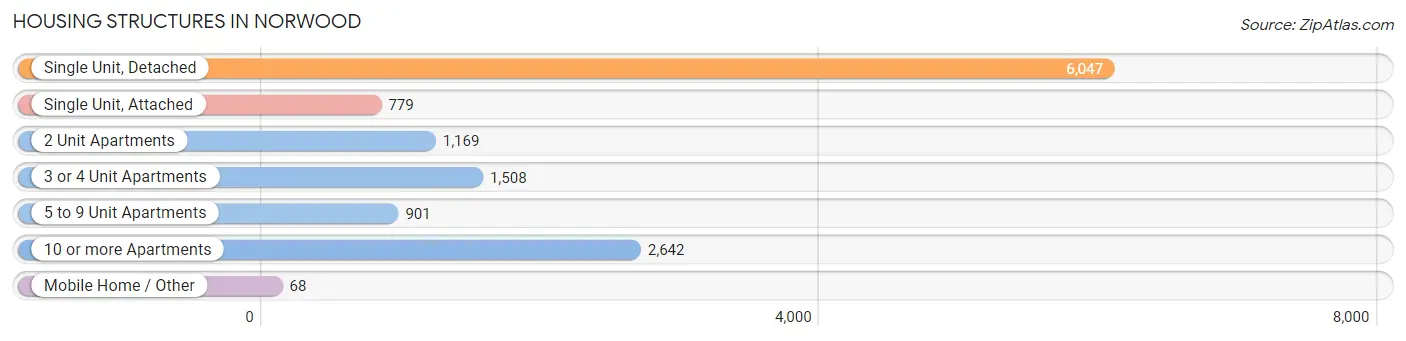
| Structure Type | # Housing Units | % Housing Units |
| Single Unit, Detached | 6,047 | 46.1% |
| Single Unit, Attached | 779 | 5.9% |
| 2 Unit Apartments | 1,169 | 8.9% |
| 3 or 4 Unit Apartments | 1,508 | 11.5% |
| 5 to 9 Unit Apartments | 901 | 6.9% |
| 10 or more Apartments | 2,642 | 20.2% |
| Mobile Home / Other | 68 | 0.5% |
| Total | 13,114 | 100.0% |
Housing Structures by Occupancy in Norwood
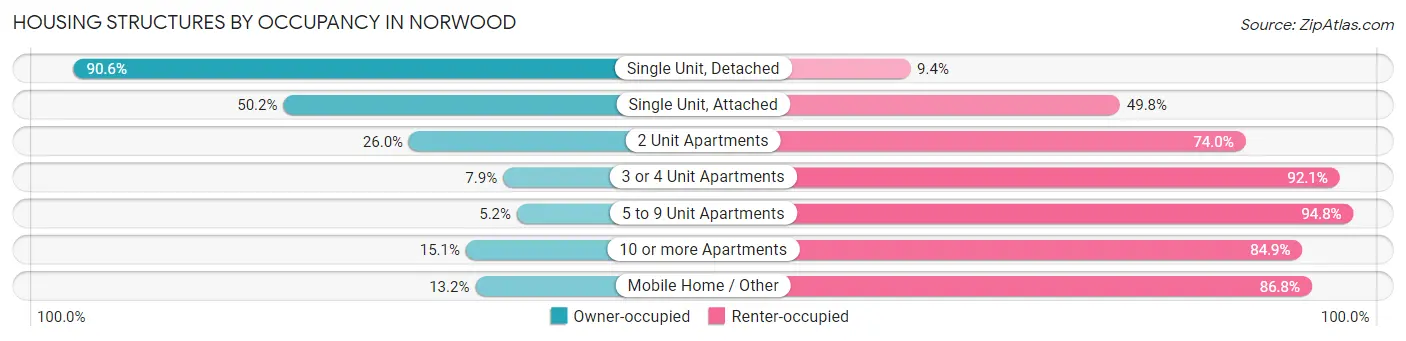
| Structure Type | Owner-occupied | Renter-occupied |
| Single Unit, Detached | 5,477 (90.6%) | 570 (9.4%) |
| Single Unit, Attached | 391 (50.2%) | 388 (49.8%) |
| 2 Unit Apartments | 304 (26.0%) | 865 (74.0%) |
| 3 or 4 Unit Apartments | 119 (7.9%) | 1,389 (92.1%) |
| 5 to 9 Unit Apartments | 47 (5.2%) | 854 (94.8%) |
| 10 or more Apartments | 398 (15.1%) | 2,244 (84.9%) |
| Mobile Home / Other | 9 (13.2%) | 59 (86.8%) |
| Total | 6,745 (51.4%) | 6,369 (48.6%) |
Housing Structures by Number of Rooms in Norwood
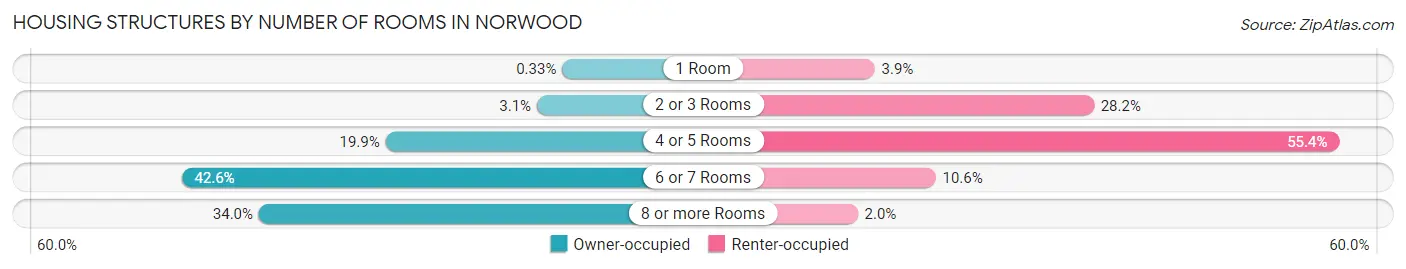
| Number of Rooms | Owner-occupied | Renter-occupied |
| 1 Room | 22 (0.3%) | 245 (3.8%) |
| 2 or 3 Rooms | 212 (3.1%) | 1,794 (28.2%) |
| 4 or 5 Rooms | 1,345 (19.9%) | 3,529 (55.4%) |
| 6 or 7 Rooms | 2,873 (42.6%) | 676 (10.6%) |
| 8 or more Rooms | 2,293 (34.0%) | 125 (2.0%) |
| Total | 6,745 (100.0%) | 6,369 (100.0%) |
Housing Structure by Heating Type in Norwood
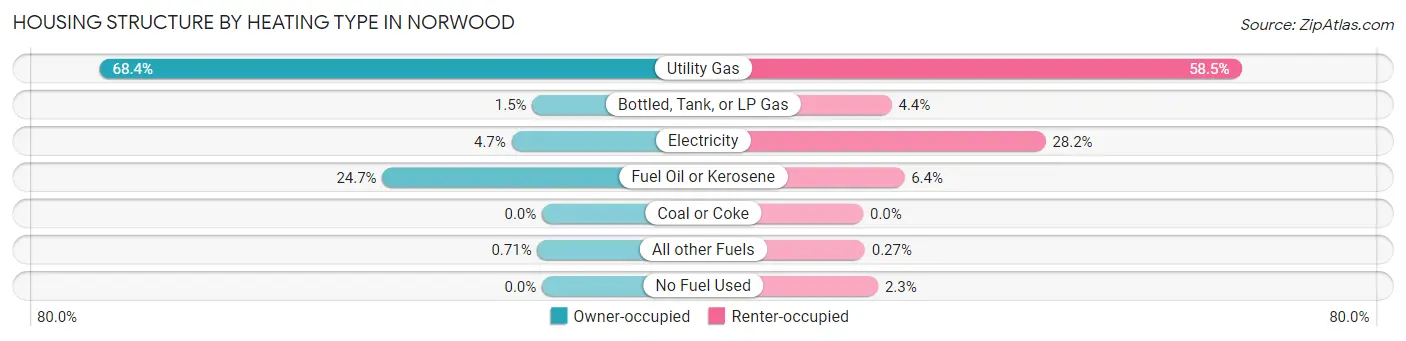
| Heating Type | Owner-occupied | Renter-occupied |
| Utility Gas | 4,613 (68.4%) | 3,723 (58.5%) |
| Bottled, Tank, or LP Gas | 101 (1.5%) | 280 (4.4%) |
| Electricity | 318 (4.7%) | 1,796 (28.2%) |
| Fuel Oil or Kerosene | 1,665 (24.7%) | 406 (6.4%) |
| Coal or Coke | 0 (0.0%) | 0 (0.0%) |
| All other Fuels | 48 (0.7%) | 17 (0.3%) |
| No Fuel Used | 0 (0.0%) | 147 (2.3%) |
| Total | 6,745 (100.0%) | 6,369 (100.0%) |
Household Vehicle Usage in Norwood
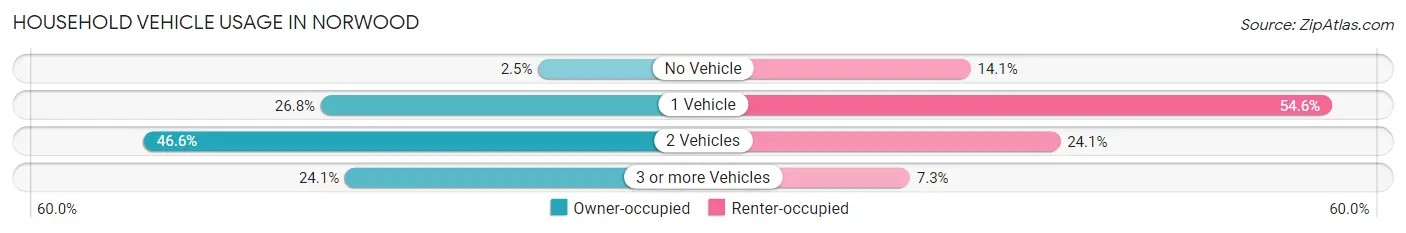
| Vehicles per Household | Owner-occupied | Renter-occupied |
| No Vehicle | 166 (2.5%) | 896 (14.1%) |
| 1 Vehicle | 1,808 (26.8%) | 3,474 (54.5%) |
| 2 Vehicles | 3,145 (46.6%) | 1,536 (24.1%) |
| 3 or more Vehicles | 1,626 (24.1%) | 463 (7.3%) |
| Total | 6,745 (100.0%) | 6,369 (100.0%) |
Real Estate & Mortgages in Norwood
Real Estate and Mortgage Overview in Norwood
| Characteristic | Without Mortgage | With Mortgage |
| Housing Units | 2,460 | 4,285 |
| Median Property Value | $572,800 | $596,400 |
| Median Household Income | $98,375 | $2,301 |
| Monthly Housing Costs | $892 | $1,571 |
| Real Estate Taxes | $5,576 | $96 |
Property Value by Mortgage Status in Norwood
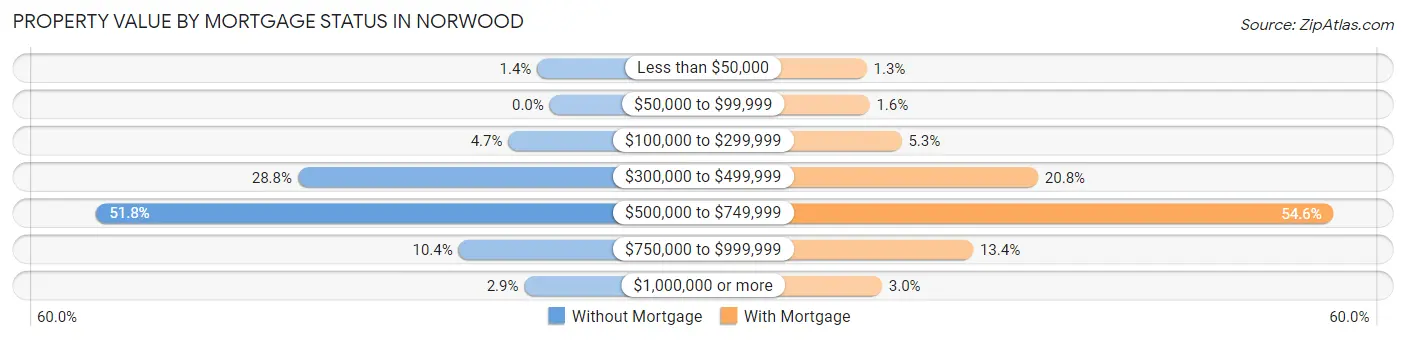
| Property Value | Without Mortgage | With Mortgage |
| Less than $50,000 | 35 (1.4%) | 54 (1.3%) |
| $50,000 to $99,999 | 0 (0.0%) | 68 (1.6%) |
| $100,000 to $299,999 | 116 (4.7%) | 225 (5.2%) |
| $300,000 to $499,999 | 708 (28.8%) | 893 (20.8%) |
| $500,000 to $749,999 | 1,274 (51.8%) | 2,341 (54.6%) |
| $750,000 to $999,999 | 256 (10.4%) | 575 (13.4%) |
| $1,000,000 or more | 71 (2.9%) | 129 (3.0%) |
| Total | 2,460 (100.0%) | 4,285 (100.0%) |
Household Income by Mortgage Status in Norwood
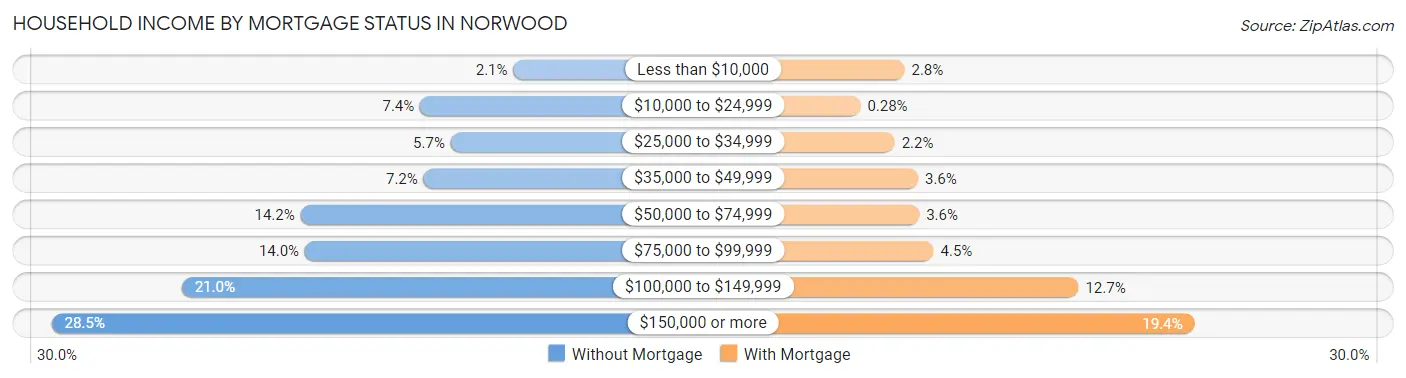
| Household Income | Without Mortgage | With Mortgage |
| Less than $10,000 | 51 (2.1%) | 120 (2.8%) |
| $10,000 to $24,999 | 182 (7.4%) | 12 (0.3%) |
| $25,000 to $34,999 | 139 (5.7%) | 96 (2.2%) |
| $35,000 to $49,999 | 177 (7.2%) | 153 (3.6%) |
| $50,000 to $74,999 | 350 (14.2%) | 156 (3.6%) |
| $75,000 to $99,999 | 344 (14.0%) | 191 (4.5%) |
| $100,000 to $149,999 | 517 (21.0%) | 546 (12.7%) |
| $150,000 or more | 700 (28.5%) | 830 (19.4%) |
| Total | 2,460 (100.0%) | 4,285 (100.0%) |
Property Value to Household Income Ratio in Norwood
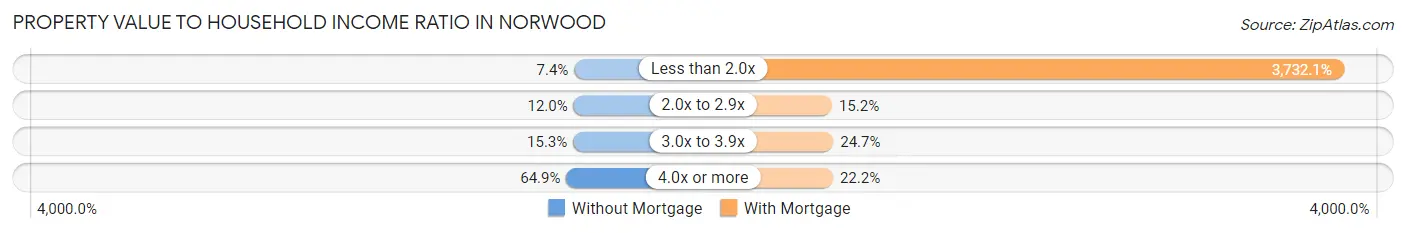
| Value-to-Income Ratio | Without Mortgage | With Mortgage |
| Less than 2.0x | 182 (7.4%) | 159,922 (3,732.1%) |
| 2.0x to 2.9x | 295 (12.0%) | 649 (15.1%) |
| 3.0x to 3.9x | 376 (15.3%) | 1,059 (24.7%) |
| 4.0x or more | 1,596 (64.9%) | 951 (22.2%) |
| Total | 2,460 (100.0%) | 4,285 (100.0%) |
Real Estate Taxes by Mortgage Status in Norwood
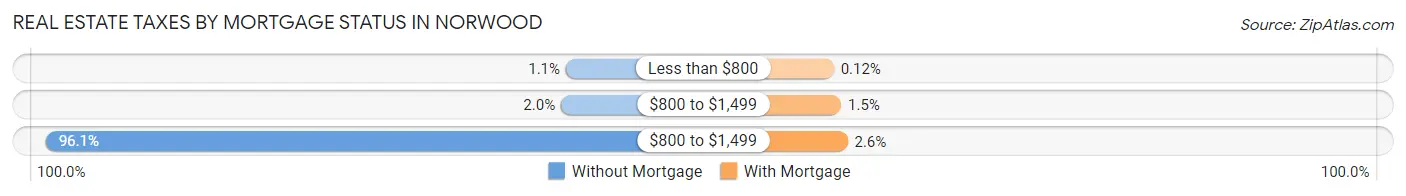
| Property Taxes | Without Mortgage | With Mortgage |
| Less than $800 | 28 (1.1%) | 5 (0.1%) |
| $800 to $1,499 | 50 (2.0%) | 63 (1.5%) |
| $800 to $1,499 | 2,365 (96.1%) | 113 (2.6%) |
| Total | 2,460 (100.0%) | 4,285 (100.0%) |
Health & Disability in Norwood
Health Insurance Coverage by Age in Norwood
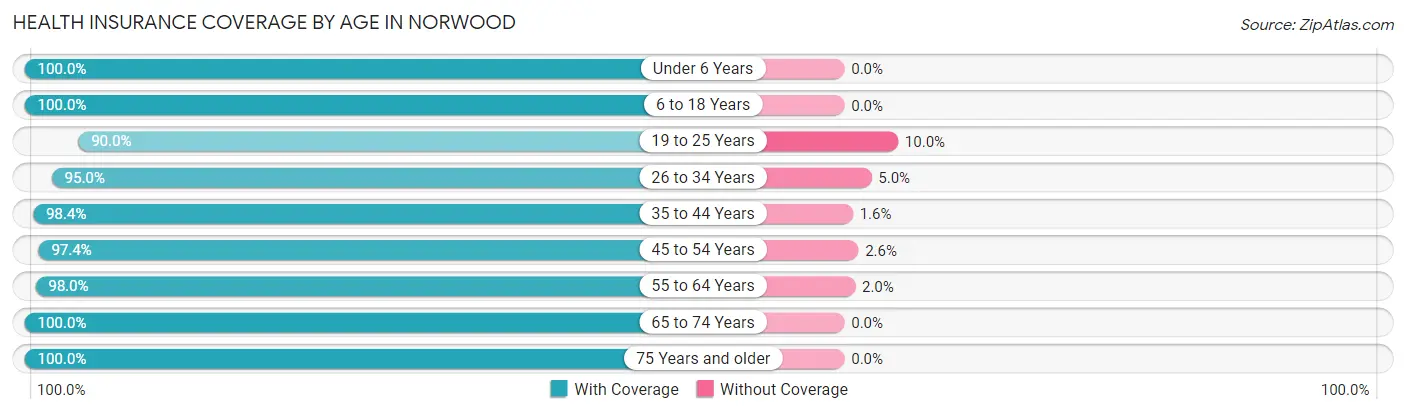
| Age Bracket | With Coverage | Without Coverage |
| Under 6 Years | 2,128 (100.0%) | 0 (0.0%) |
| 6 to 18 Years | 4,418 (100.0%) | 0 (0.0%) |
| 19 to 25 Years | 1,889 (90.0%) | 210 (10.0%) |
| 26 to 34 Years | 4,712 (95.0%) | 250 (5.0%) |
| 35 to 44 Years | 3,940 (98.4%) | 63 (1.6%) |
| 45 to 54 Years | 3,839 (97.4%) | 102 (2.6%) |
| 55 to 64 Years | 4,060 (98.0%) | 83 (2.0%) |
| 65 to 74 Years | 2,614 (100.0%) | 0 (0.0%) |
| 75 Years and older | 2,643 (100.0%) | 0 (0.0%) |
| Total | 30,243 (97.7%) | 708 (2.3%) |
Health Insurance Coverage by Citizenship Status in Norwood
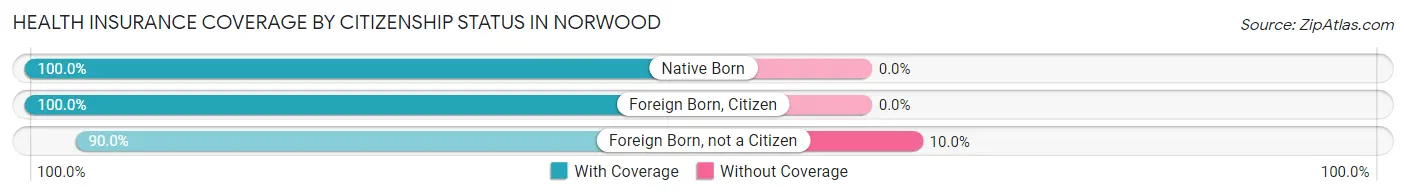
| Citizenship Status | With Coverage | Without Coverage |
| Native Born | 2,128 (100.0%) | 0 (0.0%) |
| Foreign Born, Citizen | 4,418 (100.0%) | 0 (0.0%) |
| Foreign Born, not a Citizen | 1,889 (90.0%) | 210 (10.0%) |
Health Insurance Coverage by Household Income in Norwood
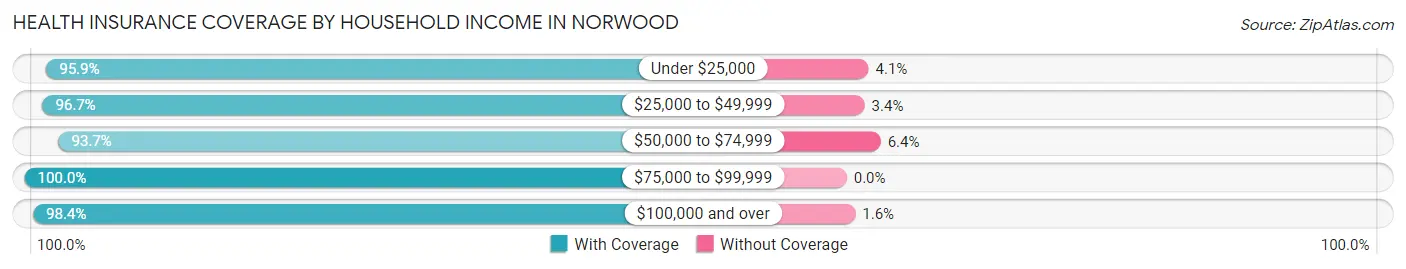
| Household Income | With Coverage | Without Coverage |
| Under $25,000 | 2,189 (95.9%) | 93 (4.1%) |
| $25,000 to $49,999 | 3,032 (96.7%) | 105 (3.4%) |
| $50,000 to $74,999 | 3,228 (93.6%) | 219 (6.4%) |
| $75,000 to $99,999 | 3,846 (100.0%) | 0 (0.0%) |
| $100,000 and over | 17,910 (98.4%) | 291 (1.6%) |
Public vs Private Health Insurance Coverage by Age in Norwood
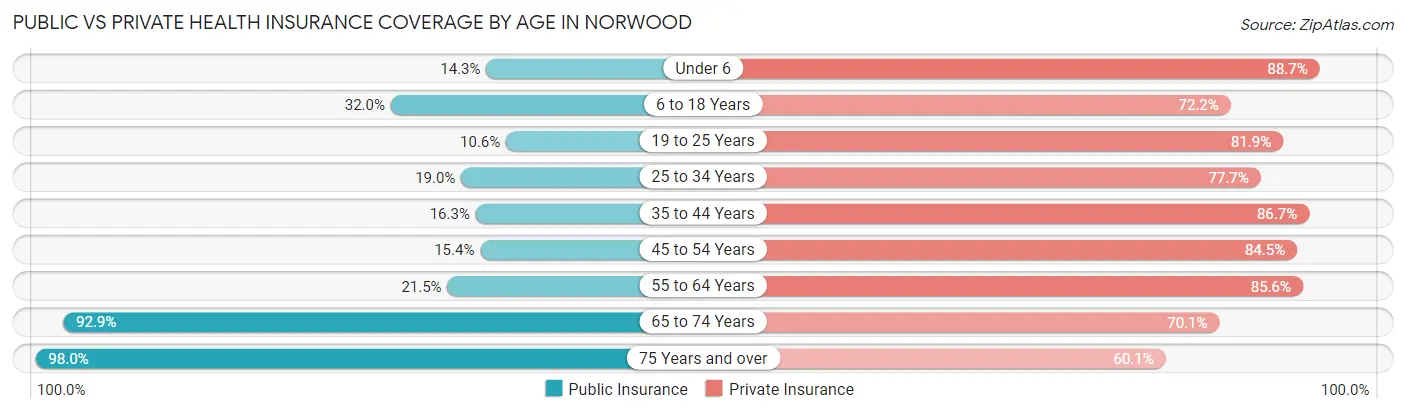
| Age Bracket | Public Insurance | Private Insurance |
| Under 6 | 304 (14.3%) | 1,887 (88.7%) |
| 6 to 18 Years | 1,415 (32.0%) | 3,188 (72.2%) |
| 19 to 25 Years | 223 (10.6%) | 1,719 (81.9%) |
| 25 to 34 Years | 941 (19.0%) | 3,857 (77.7%) |
| 35 to 44 Years | 651 (16.3%) | 3,471 (86.7%) |
| 45 to 54 Years | 608 (15.4%) | 3,330 (84.5%) |
| 55 to 64 Years | 891 (21.5%) | 3,545 (85.6%) |
| 65 to 74 Years | 2,427 (92.8%) | 1,832 (70.1%) |
| 75 Years and over | 2,590 (98.0%) | 1,588 (60.1%) |
| Total | 10,050 (32.5%) | 24,417 (78.9%) |
Disability Status by Sex by Age in Norwood
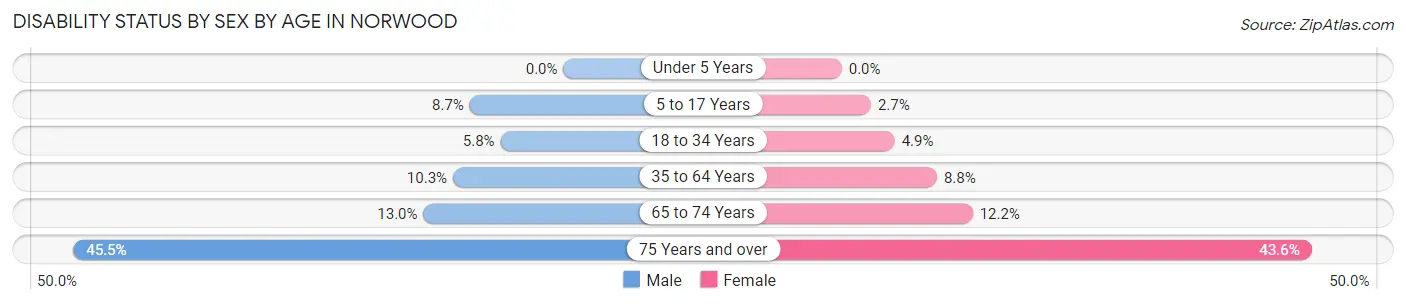
| Age Bracket | Male | Female |
| Under 5 Years | 0 (0.0%) | 0 (0.0%) |
| 5 to 17 Years | 209 (8.7%) | 52 (2.7%) |
| 18 to 34 Years | 210 (5.8%) | 190 (4.9%) |
| 35 to 64 Years | 628 (10.2%) | 526 (8.8%) |
| 65 to 74 Years | 147 (13.0%) | 180 (12.1%) |
| 75 Years and over | 482 (45.5%) | 690 (43.6%) |
Disability Class by Sex by Age in Norwood
Disability Class: Hearing Difficulty
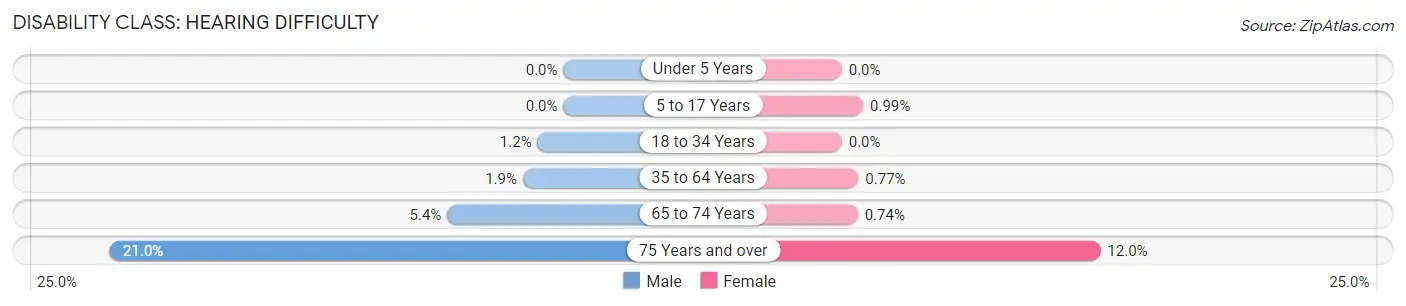
| Age Bracket | Male | Female |
| Under 5 Years | 0 (0.0%) | 0 (0.0%) |
| 5 to 17 Years | 0 (0.0%) | 19 (1.0%) |
| 18 to 34 Years | 43 (1.2%) | 0 (0.0%) |
| 35 to 64 Years | 115 (1.9%) | 46 (0.8%) |
| 65 to 74 Years | 61 (5.4%) | 11 (0.7%) |
| 75 Years and over | 223 (21.0%) | 190 (12.0%) |
Disability Class: Vision Difficulty
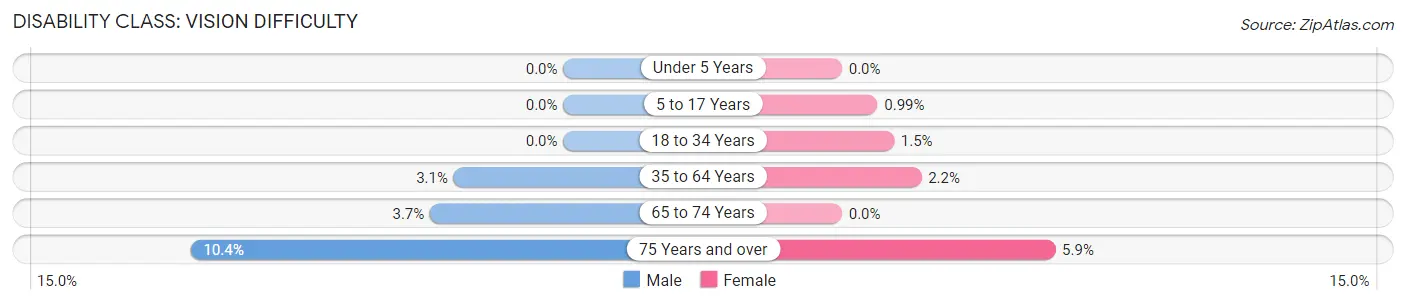
| Age Bracket | Male | Female |
| Under 5 Years | 0 (0.0%) | 0 (0.0%) |
| 5 to 17 Years | 0 (0.0%) | 19 (1.0%) |
| 18 to 34 Years | 0 (0.0%) | 56 (1.5%) |
| 35 to 64 Years | 187 (3.0%) | 132 (2.2%) |
| 65 to 74 Years | 42 (3.7%) | 0 (0.0%) |
| 75 Years and over | 110 (10.4%) | 94 (5.9%) |
Disability Class: Cognitive Difficulty
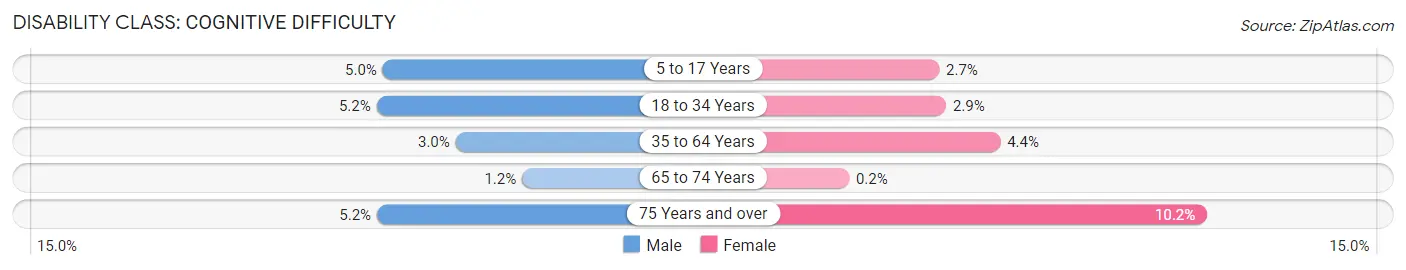
| Age Bracket | Male | Female |
| 5 to 17 Years | 121 (5.0%) | 52 (2.7%) |
| 18 to 34 Years | 187 (5.2%) | 112 (2.9%) |
| 35 to 64 Years | 184 (3.0%) | 263 (4.4%) |
| 65 to 74 Years | 13 (1.1%) | 3 (0.2%) |
| 75 Years and over | 55 (5.2%) | 161 (10.2%) |
Disability Class: Ambulatory Difficulty
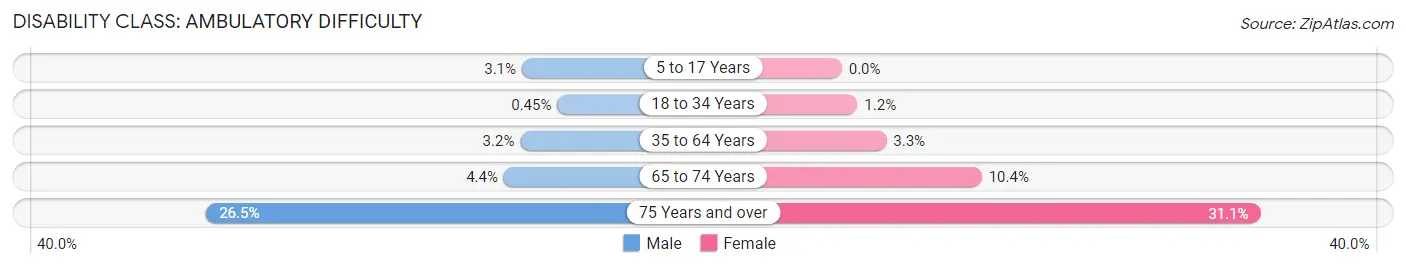
| Age Bracket | Male | Female |
| 5 to 17 Years | 74 (3.1%) | 0 (0.0%) |
| 18 to 34 Years | 16 (0.4%) | 45 (1.2%) |
| 35 to 64 Years | 196 (3.2%) | 197 (3.3%) |
| 65 to 74 Years | 50 (4.4%) | 154 (10.4%) |
| 75 Years and over | 281 (26.5%) | 492 (31.1%) |
Disability Class: Self-Care Difficulty
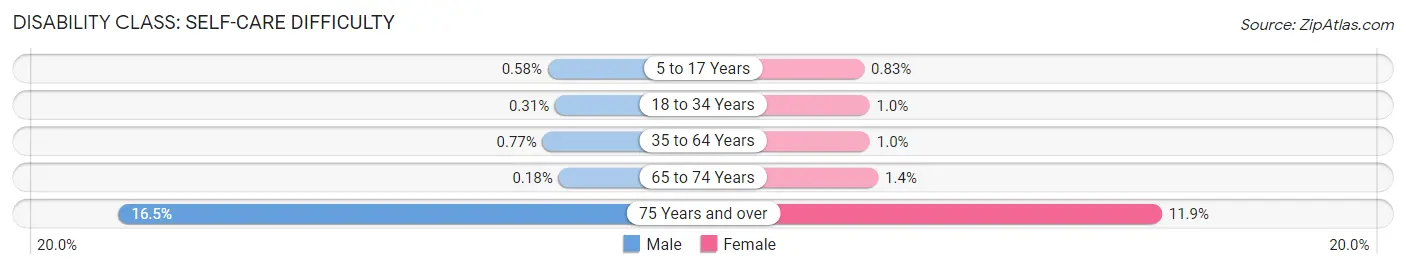
| Age Bracket | Male | Female |
| 5 to 17 Years | 14 (0.6%) | 16 (0.8%) |
| 18 to 34 Years | 11 (0.3%) | 40 (1.0%) |
| 35 to 64 Years | 47 (0.8%) | 62 (1.0%) |
| 65 to 74 Years | 2 (0.2%) | 20 (1.3%) |
| 75 Years and over | 175 (16.5%) | 188 (11.9%) |
Technology Access in Norwood
Computing Device Access in Norwood
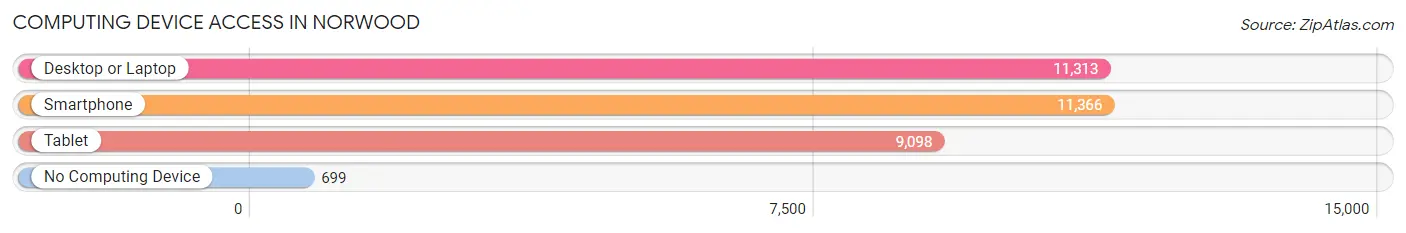
| Device Type | # Households | % Households |
| Desktop or Laptop | 11,313 | 86.3% |
| Smartphone | 11,366 | 86.7% |
| Tablet | 9,098 | 69.4% |
| No Computing Device | 699 | 5.3% |
| Total | 13,114 | 100.0% |
Internet Access in Norwood
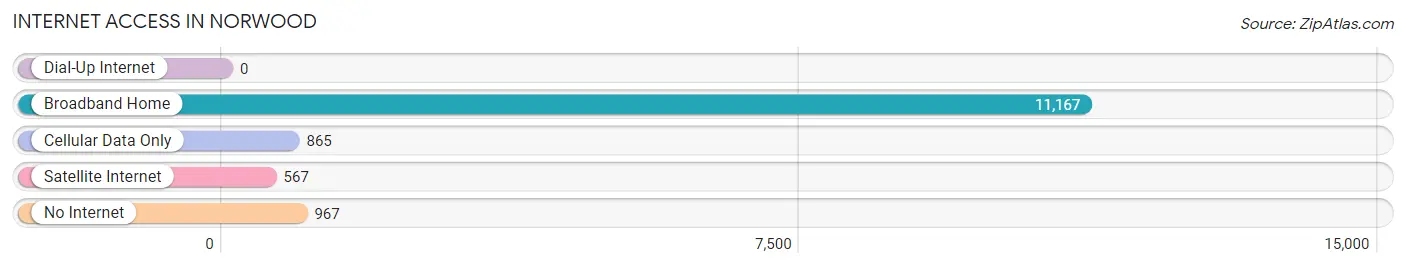
| Internet Type | # Households | % Households |
| Dial-Up Internet | 0 | 0.0% |
| Broadband Home | 11,167 | 85.2% |
| Cellular Data Only | 865 | 6.6% |
| Satellite Internet | 567 | 4.3% |
| No Internet | 967 | 7.4% |
| Total | 13,114 | 100.0% |
Norwood Summary
Norwood is a town located in Norfolk County, Massachusetts, United States. It is part of the Greater Boston metropolitan area and is located approximately 15 miles southwest of downtown Boston. As of the 2010 census, the town had a population of 28,602.
History
The area that is now Norwood was first settled in 1678 by Thomas Lothrop and his family. The town was officially incorporated in 1872 and was named after Norwood, England. The town was originally part of Dedham, Massachusetts, and was known as the “South Parish” of Dedham.
In the late 19th century, Norwood developed into a major industrial center. The town was home to several factories, including the Norwood Bleachery, the Norwood Knitting Mill, and the Norwood Paper Mill. The town also had a thriving agricultural industry, with several farms located in the area.
Geography
Norwood is located in eastern Massachusetts, approximately 15 miles southwest of downtown Boston. The town is bordered by the towns of Westwood, Walpole, Sharon, and Dedham. The town is located on the Neponset River, which flows through the town and into the nearby Boston Harbor.
The town has a total area of 8.7 square miles, of which 8.3 square miles is land and 0.4 square miles is water. The town is mostly flat, with some hills in the northern part of town.
Economy
Norwood’s economy is largely based on manufacturing and retail. The town is home to several large companies, including the Norwood Bleachery, the Norwood Knitting Mill, and the Norwood Paper Mill. The town also has several retail stores, including a Walmart Supercenter, a Target, and a Home Depot.
The town is also home to several medical facilities, including Norwood Hospital and the Norwood Medical Center. The town is also home to several educational institutions, including Norwood High School, Norwood Middle School, and the Norwood Public Schools.
Demographics
As of the 2010 census, there were 28,602 people, 10,845 households, and 7,541 families residing in the town. The population density was 3,364.3 people per square mile. The racial makeup of the town was 87.3% White, 4.2% African American, 0.3% Native American, 4.2% Asian, 0.1% Pacific Islander, 1.7% from other races, and 2.2% from two or more races. Hispanic or Latino of any race were 4.7% of the population.
The median income for a household in the town was $76,845, and the median income for a family was $93,945. The per capita income for the town was $35,945. About 3.2% of families and 4.7% of the population were below the poverty line, including 5.2% of those under age 18 and 4.2% of those age 65 or over.
Common Questions
What is Per Capita Income in Norwood?
Per Capita income in Norwood is $59,459.
What is the Median Family Income in Norwood?
Median Family Income in Norwood is $124,455.
What is the Median Household income in Norwood?
Median Household Income in Norwood is $98,653.
What is Income or Wage Gap in Norwood?
Income or Wage Gap in Norwood is 24.7%.
Women in Norwood earn 75.3 cents for every dollar earned by a man.
What is Inequality or Gini Index in Norwood?
Inequality or Gini Index in Norwood is 0.48.
What is the Total Population of Norwood?
Total Population of Norwood is 31,343.
What is the Total Male Population of Norwood?
Total Male Population of Norwood is 15,499.
What is the Total Female Population of Norwood?
Total Female Population of Norwood is 15,844.
What is the Ratio of Males per 100 Females in Norwood?
There are 97.82 Males per 100 Females in Norwood.
What is the Ratio of Females per 100 Males in Norwood?
There are 102.23 Females per 100 Males in Norwood.
What is the Median Population Age in Norwood?
Median Population Age in Norwood is 39.0 Years.
What is the Average Family Size in Norwood
Average Family Size in Norwood is 3.0 People.
What is the Average Household Size in Norwood
Average Household Size in Norwood is 2.4 People.
How Large is the Labor Force in Norwood?
There are 18,597 People in the Labor Forcein in Norwood.
What is the Percentage of People in the Labor Force in Norwood?
72.3% of People are in the Labor Force in Norwood.
What is the Unemployment Rate in Norwood?
Unemployment Rate in Norwood is 3.6%.