Worcester, MA Map & Demographics
Worcester Map
Worcester Overview
$33,592
PER CAPITA INCOME
$76,920
AVG FAMILY INCOME
$63,011
AVG HOUSEHOLD INCOME
24.1%
WAGE / INCOME GAP [ % ]
75.9¢/ $1
WAGE / INCOME GAP [ $ ]
$10,935
FAMILY INCOME DEFICIT
0.48
INEQUALITY / GINI INDEX
204,191
TOTAL POPULATION
101,667
MALE POPULATION
102,524
FEMALE POPULATION
99.16
MALES / 100 FEMALES
100.84
FEMALES / 100 MALES
34.3
MEDIAN AGE
3.1
AVG FAMILY SIZE
2.4
AVG HOUSEHOLD SIZE
107,979
LABOR FORCE [ PEOPLE ]
63.9%
PERCENT IN LABOR FORCE
6.6%
UNEMPLOYMENT RATE
Income in Worcester
Income Overview in Worcester
Per Capita Income in Worcester is $33,592, while median incomes of families and households are $76,920 and $63,011 respectively.
| Characteristic | Number | Measure |
| Per Capita Income | 204,191 | $33,592 |
| Median Family Income | 44,118 | $76,920 |
| Mean Family Income | 44,118 | $100,648 |
| Median Household Income | 78,977 | $63,011 |
| Mean Household Income | 78,977 | $84,324 |
| Income Deficit | 44,118 | $10,935 |
| Wage / Income Gap (%) | 204,191 | 24.07% |
| Wage / Income Gap ($) | 204,191 | 75.93¢ per $1 |
| Gini / Inequality Index | 204,191 | 0.48 |
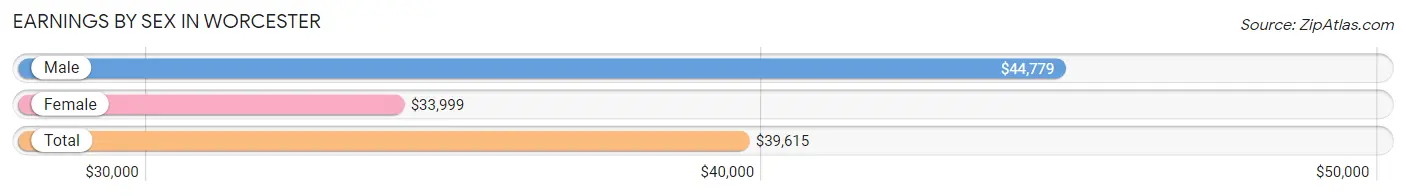
Earnings by Sex in Worcester
Average Earnings in Worcester are $39,615, $44,779 for men and $33,999 for women, a difference of 24.1%.
| Sex | Number | Average Earnings |
| Male | 59,516 (52.0%) | $44,779 |
| Female | 55,004 (48.0%) | $33,999 |
| Total | 114,520 (100.0%) | $39,615 |
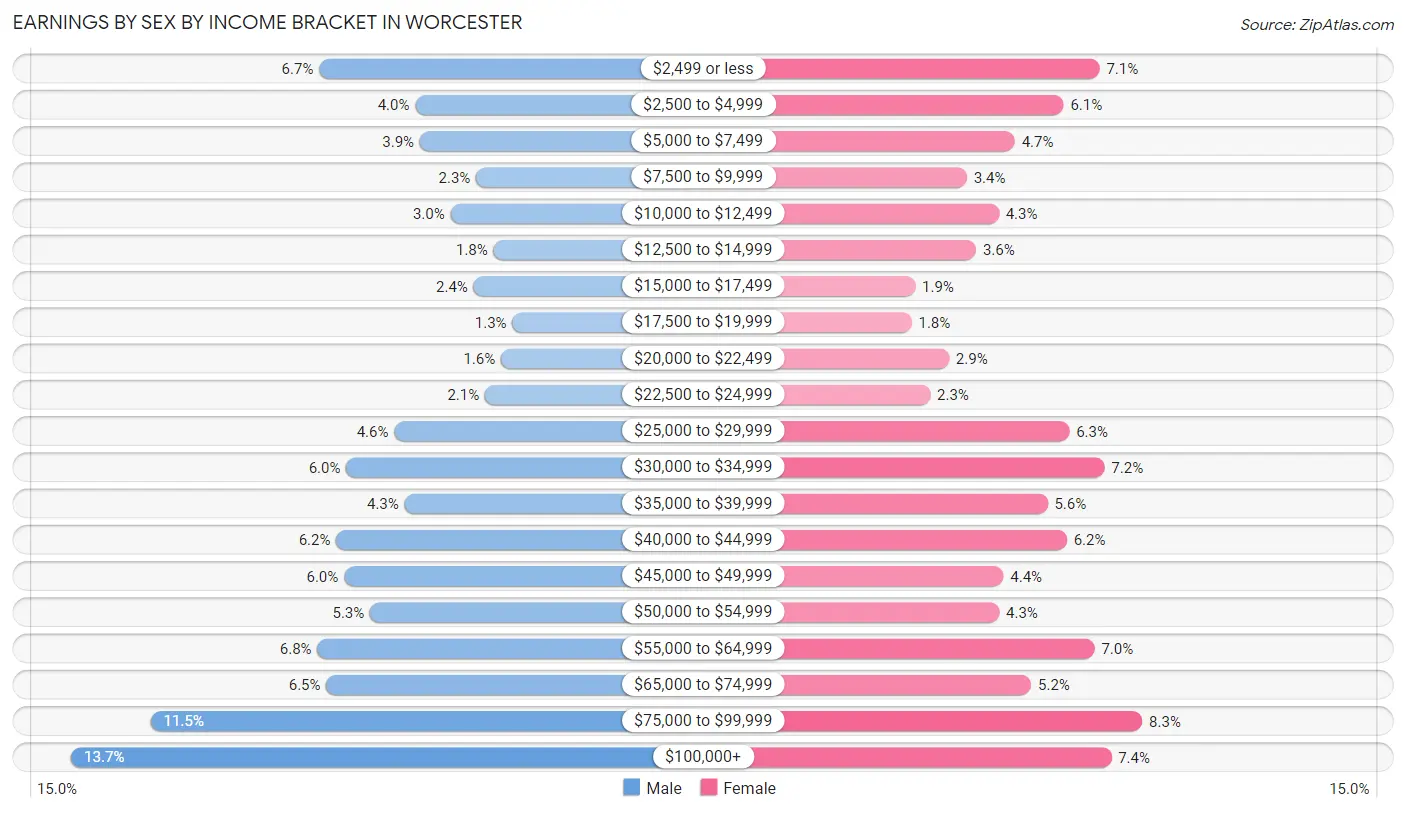
Earnings by Sex by Income Bracket in Worcester
The most common earnings brackets in Worcester are $100,000+ for men (8,146 | 13.7%) and $75,000 to $99,999 for women (4,568 | 8.3%).
| Income | Male | Female |
| $2,499 or less | 4,002 (6.7%) | 3,903 (7.1%) |
| $2,500 to $4,999 | 2,392 (4.0%) | 3,348 (6.1%) |
| $5,000 to $7,499 | 2,315 (3.9%) | 2,598 (4.7%) |
| $7,500 to $9,999 | 1,376 (2.3%) | 1,853 (3.4%) |
| $10,000 to $12,499 | 1,803 (3.0%) | 2,351 (4.3%) |
| $12,500 to $14,999 | 1,082 (1.8%) | 1,996 (3.6%) |
| $15,000 to $17,499 | 1,415 (2.4%) | 1,058 (1.9%) |
| $17,500 to $19,999 | 768 (1.3%) | 1,002 (1.8%) |
| $20,000 to $22,499 | 957 (1.6%) | 1,577 (2.9%) |
| $22,500 to $24,999 | 1,225 (2.1%) | 1,287 (2.3%) |
| $25,000 to $29,999 | 2,744 (4.6%) | 3,440 (6.2%) |
| $30,000 to $34,999 | 3,545 (6.0%) | 3,984 (7.2%) |
| $35,000 to $39,999 | 2,571 (4.3%) | 3,101 (5.6%) |
| $40,000 to $44,999 | 3,711 (6.2%) | 3,401 (6.2%) |
| $45,000 to $49,999 | 3,583 (6.0%) | 2,422 (4.4%) |
| $50,000 to $54,999 | 3,149 (5.3%) | 2,354 (4.3%) |
| $55,000 to $64,999 | 4,028 (6.8%) | 3,826 (7.0%) |
| $65,000 to $74,999 | 3,883 (6.5%) | 2,849 (5.2%) |
| $75,000 to $99,999 | 6,821 (11.5%) | 4,568 (8.3%) |
| $100,000+ | 8,146 (13.7%) | 4,086 (7.4%) |
| Total | 59,516 (100.0%) | 55,004 (100.0%) |
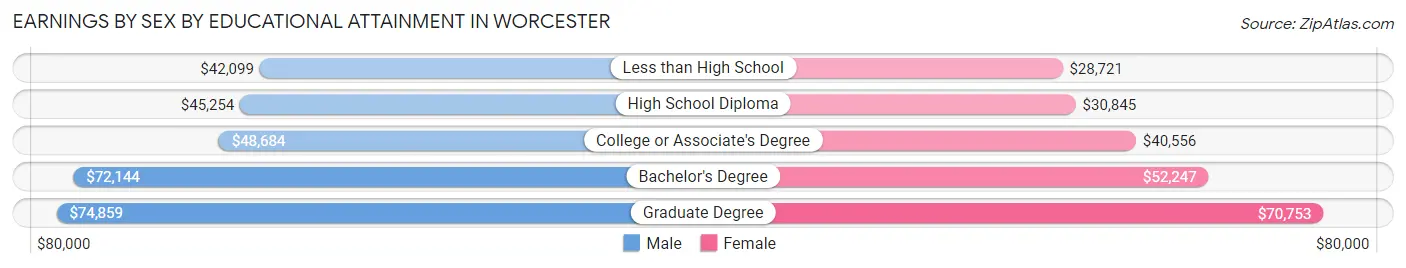
Earnings by Sex by Educational Attainment in Worcester
Average earnings in Worcester are $52,664 for men and $42,083 for women, a difference of 20.1%. Men with an educational attainment of graduate degree enjoy the highest average annual earnings of $74,859, while those with less than high school education earn the least with $42,099. Women with an educational attainment of graduate degree earn the most with the average annual earnings of $70,753, while those with less than high school education have the smallest earnings of $28,721.
| Educational Attainment | Male Income | Female Income |
| Less than High School | $42,099 | $28,721 |
| High School Diploma | $45,254 | $30,845 |
| College or Associate's Degree | $48,684 | $40,556 |
| Bachelor's Degree | $72,144 | $52,247 |
| Graduate Degree | $74,859 | $70,753 |
| Total | $52,664 | $42,083 |
Family Income in Worcester
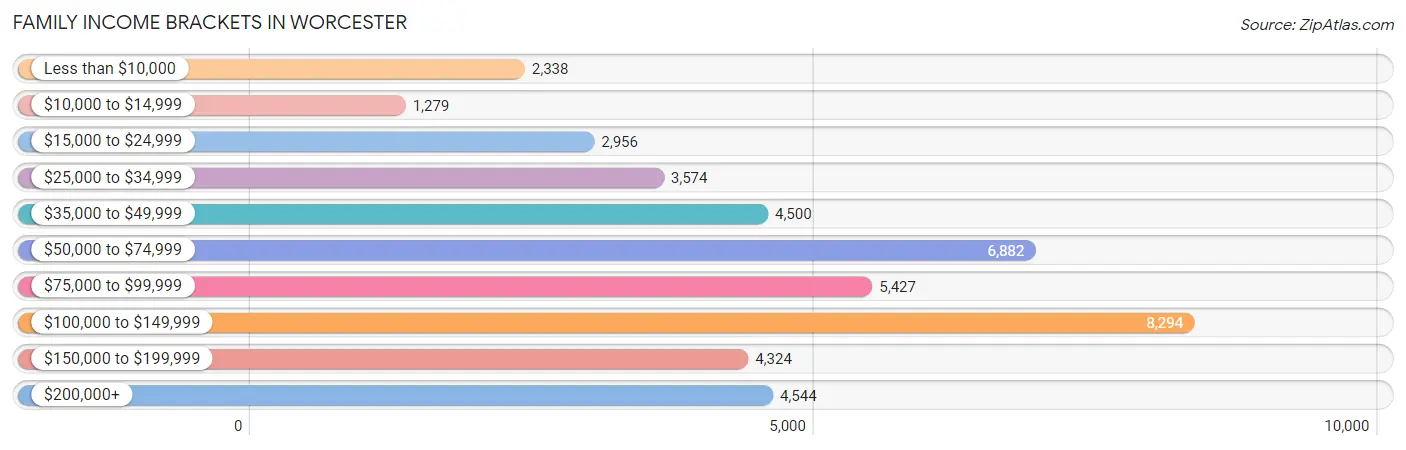
Family Income Brackets in Worcester
According to the Worcester family income data, there are 8,294 families falling into the $100,000 to $149,999 income range, which is the most common income bracket and makes up 18.8% of all families. Conversely, the $10,000 to $14,999 income bracket is the least frequent group with only 1,279 families (2.9%) belonging to this category.
| Income Bracket | # Families | % Families |
| Less than $10,000 | 2,338 | 5.3% |
| $10,000 to $14,999 | 1,279 | 2.9% |
| $15,000 to $24,999 | 2,956 | 6.7% |
| $25,000 to $34,999 | 3,574 | 8.1% |
| $35,000 to $49,999 | 4,500 | 10.2% |
| $50,000 to $74,999 | 6,882 | 15.6% |
| $75,000 to $99,999 | 5,427 | 12.3% |
| $100,000 to $149,999 | 8,294 | 18.8% |
| $150,000 to $199,999 | 4,324 | 9.8% |
| $200,000+ | 4,544 | 10.3% |
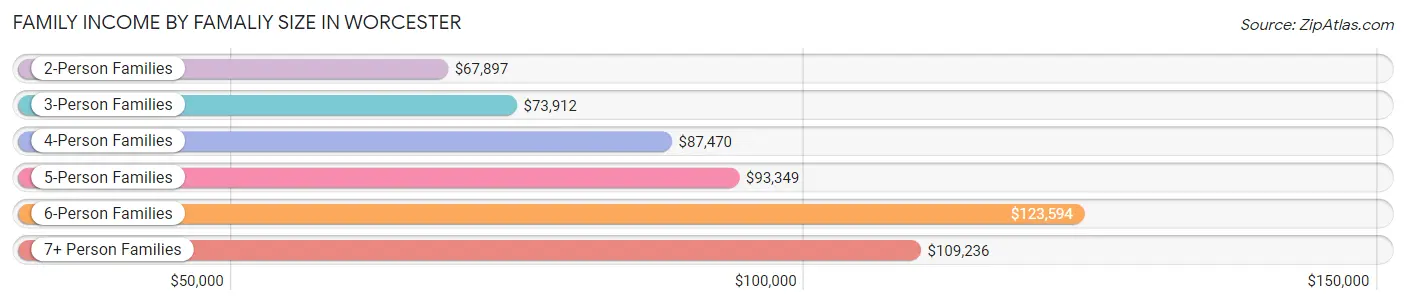
Family Income by Famaliy Size in Worcester
6-person families (1,510 | 3.4%) account for the highest median family income in Worcester with $123,594 per family, while 2-person families (18,823 | 42.7%) have the highest median income of $33,948 per family member.
| Income Bracket | # Families | Median Income |
| 2-Person Families | 18,823 (42.7%) | $67,897 |
| 3-Person Families | 11,794 (26.7%) | $73,912 |
| 4-Person Families | 8,365 (19.0%) | $87,470 |
| 5-Person Families | 3,029 (6.9%) | $93,349 |
| 6-Person Families | 1,510 (3.4%) | $123,594 |
| 7+ Person Families | 597 (1.3%) | $109,236 |
| Total | 44,118 (100.0%) | $76,920 |
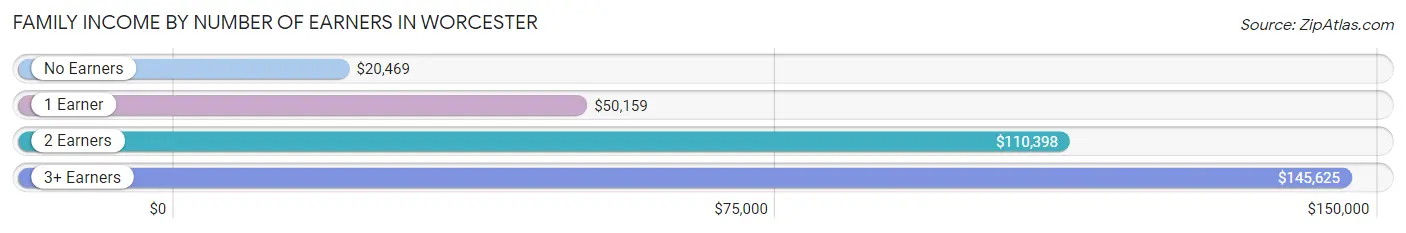
Family Income by Number of Earners in Worcester
The median family income in Worcester is $76,920, with families comprising 3+ earners (6,176) having the highest median family income of $145,625, while families with no earners (5,837) have the lowest median family income of $20,469, accounting for 14.0% and 13.2% of families, respectively.
| Number of Earners | # Families | Median Income |
| No Earners | 5,837 (13.2%) | $20,469 |
| 1 Earner | 15,018 (34.0%) | $50,159 |
| 2 Earners | 17,087 (38.7%) | $110,398 |
| 3+ Earners | 6,176 (14.0%) | $145,625 |
| Total | 44,118 (100.0%) | $76,920 |
Household Income in Worcester
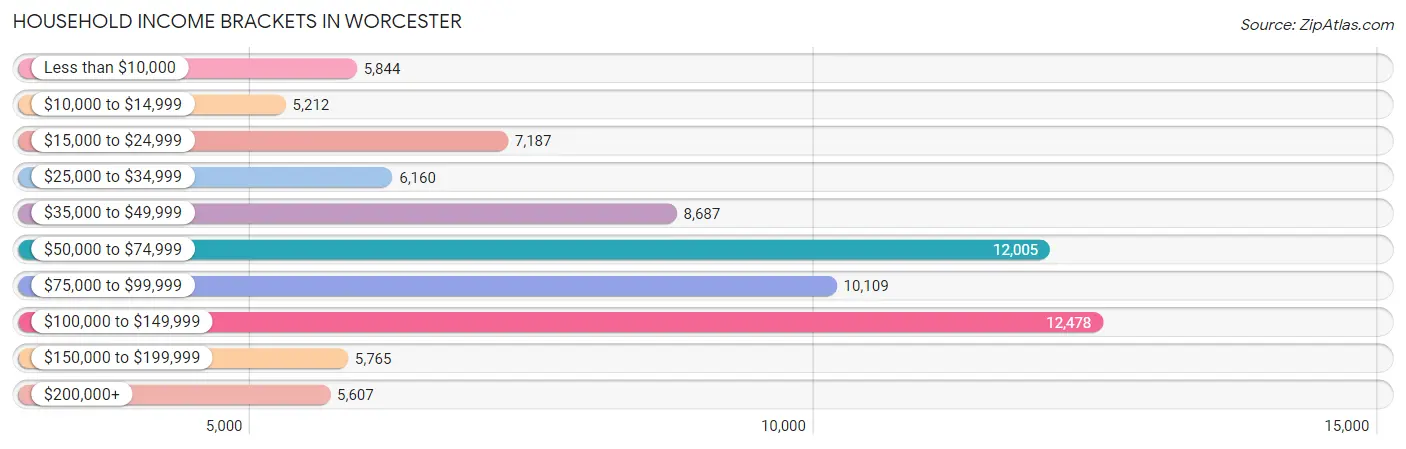
Household Income Brackets in Worcester
With 12,478 households falling in the category, the $100,000 to $149,999 income range is the most frequent in Worcester, accounting for 15.8% of all households. In contrast, only 5,212 households (6.6%) fall into the $10,000 to $14,999 income bracket, making it the least populous group.
| Income Bracket | # Households | % Households |
| Less than $10,000 | 5,844 | 7.4% |
| $10,000 to $14,999 | 5,212 | 6.6% |
| $15,000 to $24,999 | 7,187 | 9.1% |
| $25,000 to $34,999 | 6,160 | 7.8% |
| $35,000 to $49,999 | 8,687 | 11.0% |
| $50,000 to $74,999 | 12,005 | 15.2% |
| $75,000 to $99,999 | 10,109 | 12.8% |
| $100,000 to $149,999 | 12,478 | 15.8% |
| $150,000 to $199,999 | 5,765 | 7.3% |
| $200,000+ | 5,607 | 7.1% |
Household Income by Householder Age in Worcester
The median household income in Worcester is $63,011, with the highest median household income of $80,807 found in the 45 to 64 years age bracket for the primary householder. A total of 28,044 households (35.5%) fall into this category. Meanwhile, the 15 to 24 years age bracket for the primary householder has the lowest median household income of $33,631, with 3,947 households (5.0%) in this group.
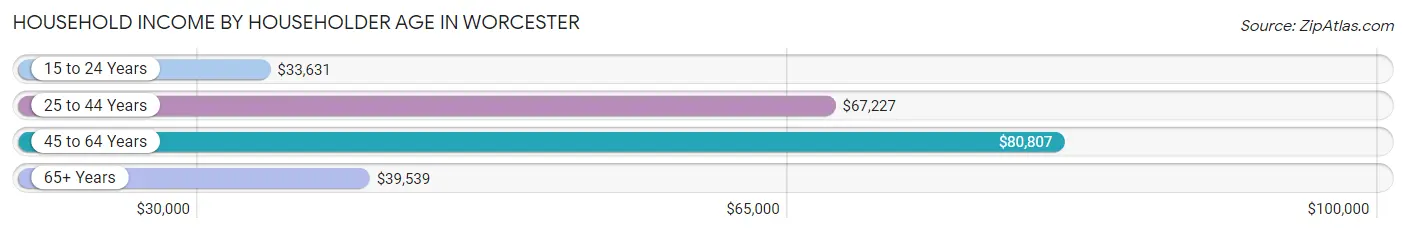
| Income Bracket | # Households | Median Income |
| 15 to 24 Years | 3,947 (5.0%) | $33,631 |
| 25 to 44 Years | 30,170 (38.2%) | $67,227 |
| 45 to 64 Years | 28,044 (35.5%) | $80,807 |
| 65+ Years | 16,816 (21.3%) | $39,539 |
| Total | 78,977 (100.0%) | $63,011 |
Poverty in Worcester
Income Below Poverty by Sex and Age in Worcester
With 18.5% poverty level for males and 20.4% for females among the residents of Worcester, 5 year old males and 18 to 24 year old females are the most vulnerable to poverty, with 180 males (35.6%) and 3,446 females (35.2%) in their respective age groups living below the poverty level.
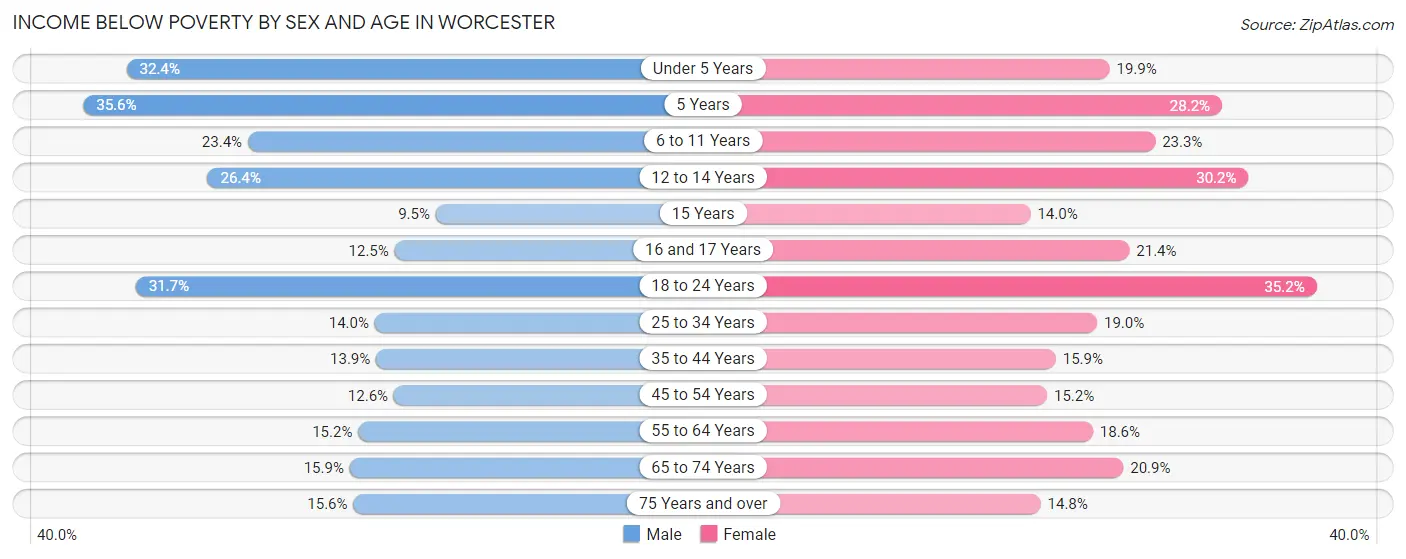
| Age Bracket | Male | Female |
| Under 5 Years | 1,897 (32.4%) | 988 (19.9%) |
| 5 Years | 180 (35.6%) | 278 (28.2%) |
| 6 to 11 Years | 1,584 (23.4%) | 1,484 (23.3%) |
| 12 to 14 Years | 1,043 (26.4%) | 890 (30.2%) |
| 15 Years | 126 (9.5%) | 151 (14.0%) |
| 16 and 17 Years | 308 (12.5%) | 449 (21.3%) |
| 18 to 24 Years | 3,524 (31.7%) | 3,446 (35.2%) |
| 25 to 34 Years | 2,386 (14.0%) | 3,067 (19.0%) |
| 35 to 44 Years | 1,809 (13.9%) | 2,002 (15.9%) |
| 45 to 54 Years | 1,419 (12.6%) | 1,771 (15.2%) |
| 55 to 64 Years | 1,856 (15.2%) | 2,223 (18.6%) |
| 65 to 74 Years | 1,063 (15.9%) | 1,823 (20.9%) |
| 75 Years and over | 604 (15.6%) | 932 (14.8%) |
| Total | 17,799 (18.5%) | 19,504 (20.4%) |
Income Above Poverty by Sex and Age in Worcester
According to the poverty statistics in Worcester, males aged 15 years and females aged 15 years are the age groups that are most secure financially, with 90.5% of males and 86.0% of females in these age groups living above the poverty line.
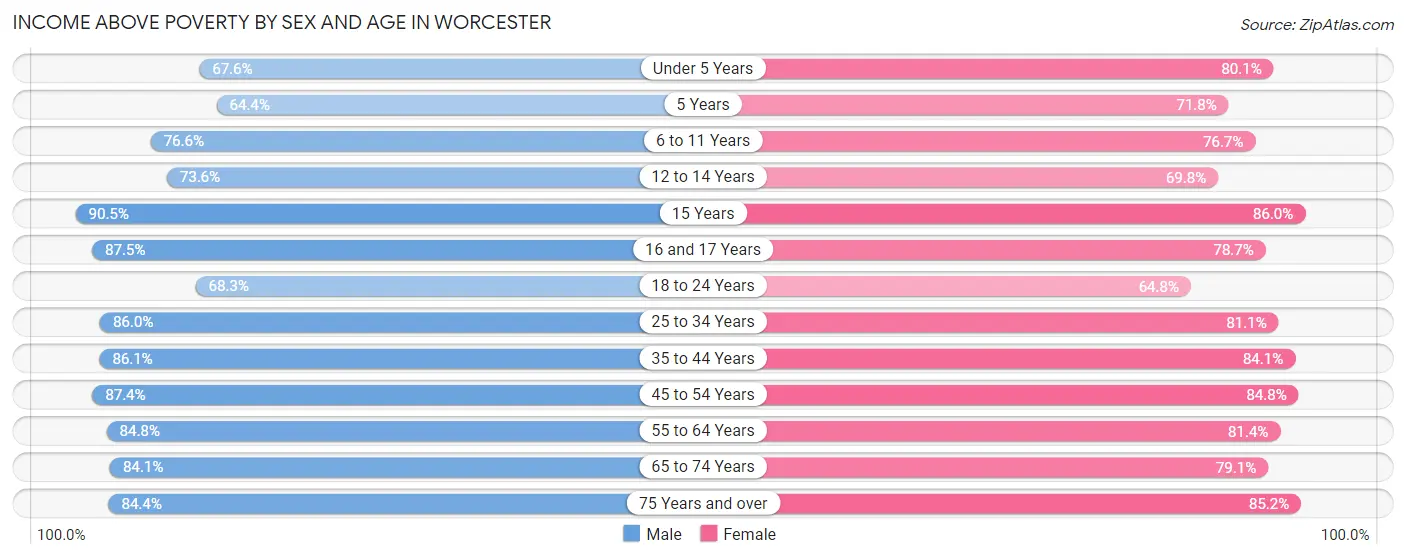
| Age Bracket | Male | Female |
| Under 5 Years | 3,953 (67.6%) | 3,981 (80.1%) |
| 5 Years | 325 (64.4%) | 707 (71.8%) |
| 6 to 11 Years | 5,179 (76.6%) | 4,892 (76.7%) |
| 12 to 14 Years | 2,906 (73.6%) | 2,059 (69.8%) |
| 15 Years | 1,205 (90.5%) | 927 (86.0%) |
| 16 and 17 Years | 2,150 (87.5%) | 1,654 (78.6%) |
| 18 to 24 Years | 7,578 (68.3%) | 6,333 (64.8%) |
| 25 to 34 Years | 14,654 (86.0%) | 13,115 (81.0%) |
| 35 to 44 Years | 11,205 (86.1%) | 10,597 (84.1%) |
| 45 to 54 Years | 9,857 (87.4%) | 9,851 (84.8%) |
| 55 to 64 Years | 10,328 (84.8%) | 9,700 (81.4%) |
| 65 to 74 Years | 5,639 (84.1%) | 6,901 (79.1%) |
| 75 Years and over | 3,270 (84.4%) | 5,383 (85.2%) |
| Total | 78,249 (81.5%) | 76,100 (79.6%) |
Income Below Poverty Among Married-Couple Families in Worcester
The poverty statistics for married-couple families in Worcester show that 7.2% or 1,873 of the total 26,177 families live below the poverty line. Families with 3 or 4 children have the highest poverty rate of 15.6%, comprising of 245 families. On the other hand, families with no children have the lowest poverty rate of 6.3%, which includes 952 families.
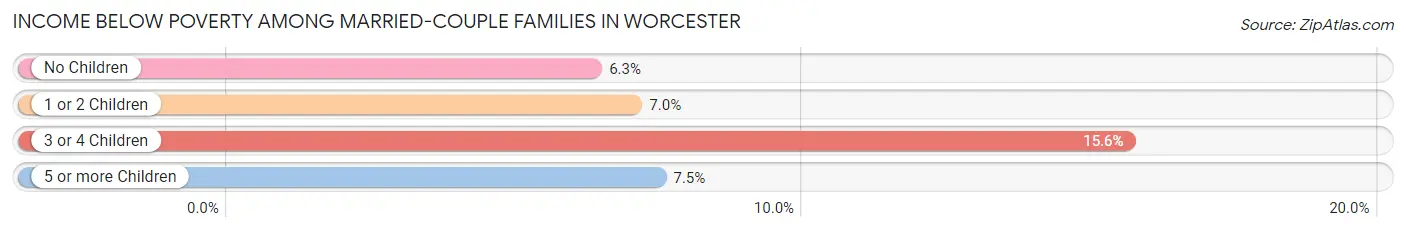
| Children | Above Poverty | Below Poverty |
| No Children | 14,064 (93.7%) | 952 (6.3%) |
| 1 or 2 Children | 8,792 (93.0%) | 666 (7.0%) |
| 3 or 4 Children | 1,324 (84.4%) | 245 (15.6%) |
| 5 or more Children | 124 (92.5%) | 10 (7.5%) |
| Total | 24,304 (92.8%) | 1,873 (7.2%) |
Income Below Poverty Among Single-Parent Households in Worcester
According to the poverty data in Worcester, 20.8% or 1,073 single-father households and 25.1% or 3,216 single-mother households are living below the poverty line. Among single-father households, those with 3 or 4 children have the highest poverty rate, with 161 households (52.4%) experiencing poverty. Likewise, among single-mother households, those with 5 or more children have the highest poverty rate, with 97 households (73.5%) falling below the poverty line.
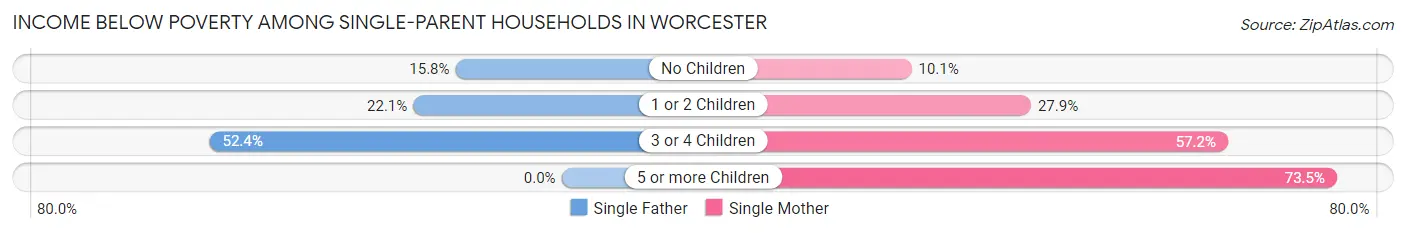
| Children | Single Father | Single Mother |
| No Children | 397 (15.8%) | 466 (10.1%) |
| 1 or 2 Children | 515 (22.1%) | 1,861 (27.9%) |
| 3 or 4 Children | 161 (52.4%) | 792 (57.2%) |
| 5 or more Children | 0 (0.0%) | 97 (73.5%) |
| Total | 1,073 (20.8%) | 3,216 (25.1%) |
Income Below Poverty Among Married-Couple vs Single-Parent Households in Worcester
The poverty data for Worcester shows that 1,873 of the married-couple family households (7.2%) and 4,289 of the single-parent households (23.9%) are living below the poverty level. Within the married-couple family households, those with 3 or 4 children have the highest poverty rate, with 245 households (15.6%) falling below the poverty line. Among the single-parent households, those with 5 or more children have the highest poverty rate, with 97 household (73.5%) living below poverty.
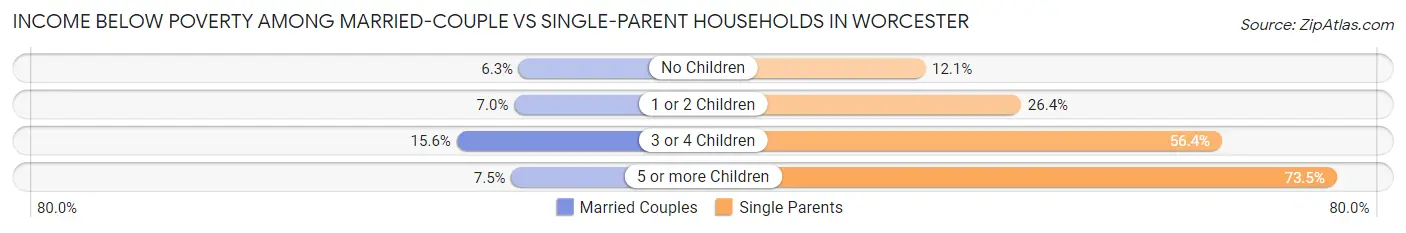
| Children | Married-Couple Families | Single-Parent Households |
| No Children | 952 (6.3%) | 863 (12.1%) |
| 1 or 2 Children | 666 (7.0%) | 2,376 (26.4%) |
| 3 or 4 Children | 245 (15.6%) | 953 (56.4%) |
| 5 or more Children | 10 (7.5%) | 97 (73.5%) |
| Total | 1,873 (7.2%) | 4,289 (23.9%) |
Race in Worcester
The most populous races in Worcester are White / Caucasian (125,111 | 61.3%), Hispanic or Latino (50,220 | 24.6%), and Black / African American (26,139 | 12.8%).
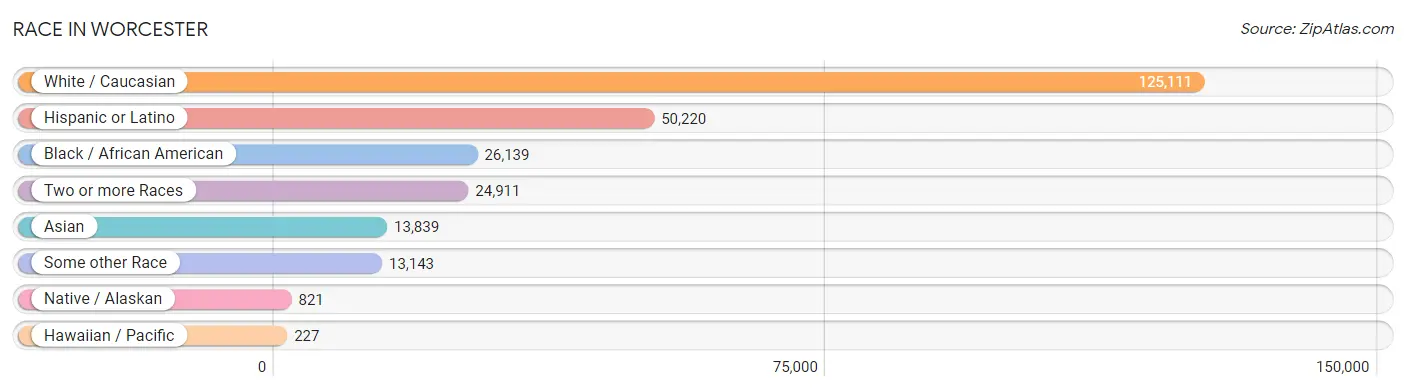
| Race | # Population | % Population |
| Asian | 13,839 | 6.8% |
| Black / African American | 26,139 | 12.8% |
| Hawaiian / Pacific | 227 | 0.1% |
| Hispanic or Latino | 50,220 | 24.6% |
| Native / Alaskan | 821 | 0.4% |
| White / Caucasian | 125,111 | 61.3% |
| Two or more Races | 24,911 | 12.2% |
| Some other Race | 13,143 | 6.4% |
| Total | 204,191 | 100.0% |
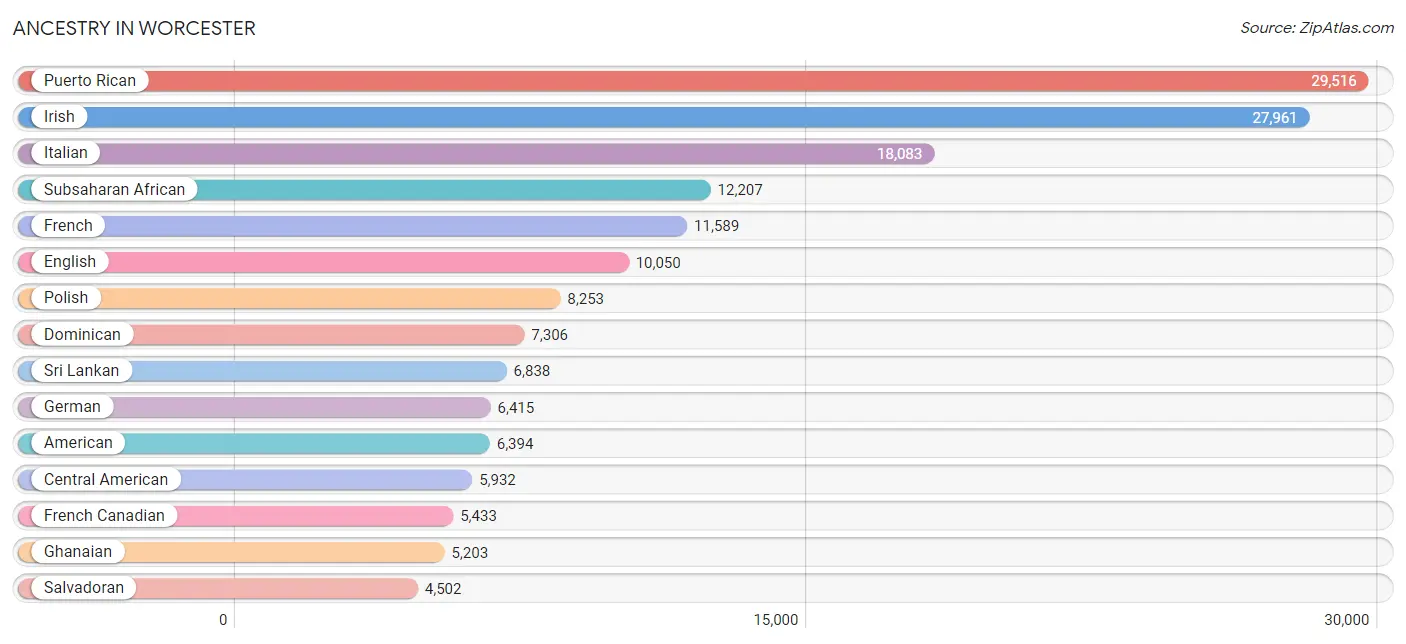
Ancestry in Worcester
The most populous ancestries reported in Worcester are Puerto Rican (29,516 | 14.5%), Irish (27,961 | 13.7%), Italian (18,083 | 8.9%), Subsaharan African (12,207 | 6.0%), and French (11,589 | 5.7%), together accounting for 48.7% of all Worcester residents.
| Ancestry | # Population | % Population |
| Afghan | 28 | 0.0% |
| African | 3,354 | 1.6% |
| Albanian | 3,563 | 1.7% |
| Aleut | 12 | 0.0% |
| American | 6,394 | 3.1% |
| Arab | 3,504 | 1.7% |
| Argentinean | 253 | 0.1% |
| Armenian | 836 | 0.4% |
| Assyrian / Chaldean / Syriac | 35 | 0.0% |
| Australian | 159 | 0.1% |
| Austrian | 325 | 0.2% |
| Barbadian | 22 | 0.0% |
| Basque | 31 | 0.0% |
| Belgian | 120 | 0.1% |
| Bermudan | 14 | 0.0% |
| Bhutanese | 662 | 0.3% |
| Blackfeet | 174 | 0.1% |
| Bolivian | 139 | 0.1% |
| Brazilian | 3,491 | 1.7% |
| British | 740 | 0.4% |
| British West Indian | 106 | 0.1% |
| Bulgarian | 47 | 0.0% |
| Burmese | 765 | 0.4% |
| Cambodian | 55 | 0.0% |
| Canadian | 846 | 0.4% |
| Cape Verdean | 305 | 0.2% |
| Central American | 5,932 | 2.9% |
| Central American Indian | 509 | 0.3% |
| Cherokee | 107 | 0.1% |
| Chickasaw | 2 | 0.0% |
| Chilean | 36 | 0.0% |
| Colombian | 1,090 | 0.5% |
| Costa Rican | 6 | 0.0% |
| Cree | 9 | 0.0% |
| Croatian | 4 | 0.0% |
| Cuban | 332 | 0.2% |
| Czech | 652 | 0.3% |
| Czechoslovakian | 178 | 0.1% |
| Danish | 260 | 0.1% |
| Dominican | 7,306 | 3.6% |
| Dutch | 696 | 0.3% |
| Eastern European | 602 | 0.3% |
| Ecuadorian | 1,728 | 0.9% |
| Egyptian | 30 | 0.0% |
| English | 10,050 | 4.9% |
| Ethiopian | 73 | 0.0% |
| European | 1,065 | 0.5% |
| Filipino | 179 | 0.1% |
| Finnish | 1,034 | 0.5% |
| French | 11,589 | 5.7% |
| French American Indian | 67 | 0.0% |
| French Canadian | 5,433 | 2.7% |
| German | 6,415 | 3.1% |
| Ghanaian | 5,203 | 2.5% |
| Greek | 1,745 | 0.9% |
| Guamanian / Chamorro | 20 | 0.0% |
| Guatemalan | 945 | 0.5% |
| Guyanese | 130 | 0.1% |
| Haitian | 2,069 | 1.0% |
| Honduran | 263 | 0.1% |
| Hungarian | 444 | 0.2% |
| Indian (Asian) | 3,507 | 1.7% |
| Inupiat | 8 | 0.0% |
| Iranian | 118 | 0.1% |
| Iraqi | 1,084 | 0.5% |
| Irish | 27,961 | 13.7% |
| Iroquois | 19 | 0.0% |
| Israeli | 58 | 0.0% |
| Italian | 18,083 | 8.9% |
| Jamaican | 1,688 | 0.8% |
| Japanese | 875 | 0.4% |
| Jordanian | 194 | 0.1% |
| Kenyan | 916 | 0.4% |
| Korean | 604 | 0.3% |
| Laotian | 62 | 0.0% |
| Latvian | 11 | 0.0% |
| Lebanese | 875 | 0.4% |
| Liberian | 584 | 0.3% |
| Lithuanian | 1,643 | 0.8% |
| Luxembourger | 11 | 0.0% |
| Macedonian | 29 | 0.0% |
| Malaysian | 361 | 0.2% |
| Mexican | 1,745 | 0.9% |
| Mexican American Indian | 69 | 0.0% |
| Mongolian | 28 | 0.0% |
| Moroccan | 239 | 0.1% |
| Native Hawaiian | 229 | 0.1% |
| Navajo | 57 | 0.0% |
| Nicaraguan | 74 | 0.0% |
| Nigerian | 1,026 | 0.5% |
| Northern European | 161 | 0.1% |
| Norwegian | 746 | 0.4% |
| Pakistani | 197 | 0.1% |
| Palestinian | 42 | 0.0% |
| Panamanian | 142 | 0.1% |
| Paraguayan | 15 | 0.0% |
| Peruvian | 215 | 0.1% |
| Polish | 8,253 | 4.0% |
| Portuguese | 2,489 | 1.2% |
| Puerto Rican | 29,516 | 14.5% |
| Romanian | 117 | 0.1% |
| Russian | 1,803 | 0.9% |
| Salvadoran | 4,502 | 2.2% |
| Samoan | 81 | 0.0% |
| Scandinavian | 269 | 0.1% |
| Scotch-Irish | 578 | 0.3% |
| Scottish | 2,064 | 1.0% |
| Serbian | 67 | 0.0% |
| Sioux | 64 | 0.0% |
| Slavic | 20 | 0.0% |
| Slovak | 67 | 0.0% |
| Slovene | 110 | 0.1% |
| Somali | 139 | 0.1% |
| South African | 57 | 0.0% |
| South American | 3,827 | 1.9% |
| South American Indian | 104 | 0.1% |
| Spaniard | 309 | 0.2% |
| Spanish | 234 | 0.1% |
| Sri Lankan | 6,838 | 3.4% |
| Subsaharan African | 12,207 | 6.0% |
| Sudanese | 14 | 0.0% |
| Swedish | 3,659 | 1.8% |
| Swiss | 166 | 0.1% |
| Syrian | 342 | 0.2% |
| Thai | 1,490 | 0.7% |
| Trinidadian and Tobagonian | 256 | 0.1% |
| Turkish | 44 | 0.0% |
| U.S. Virgin Islander | 35 | 0.0% |
| Ugandan | 168 | 0.1% |
| Ukrainian | 294 | 0.1% |
| Uruguayan | 51 | 0.0% |
| Venezuelan | 283 | 0.1% |
| Vietnamese | 65 | 0.0% |
| Welsh | 546 | 0.3% |
| West Indian | 431 | 0.2% |
| Yugoslavian | 51 | 0.0% |
| Zimbabwean | 26 | 0.0% | View All 137 Rows |
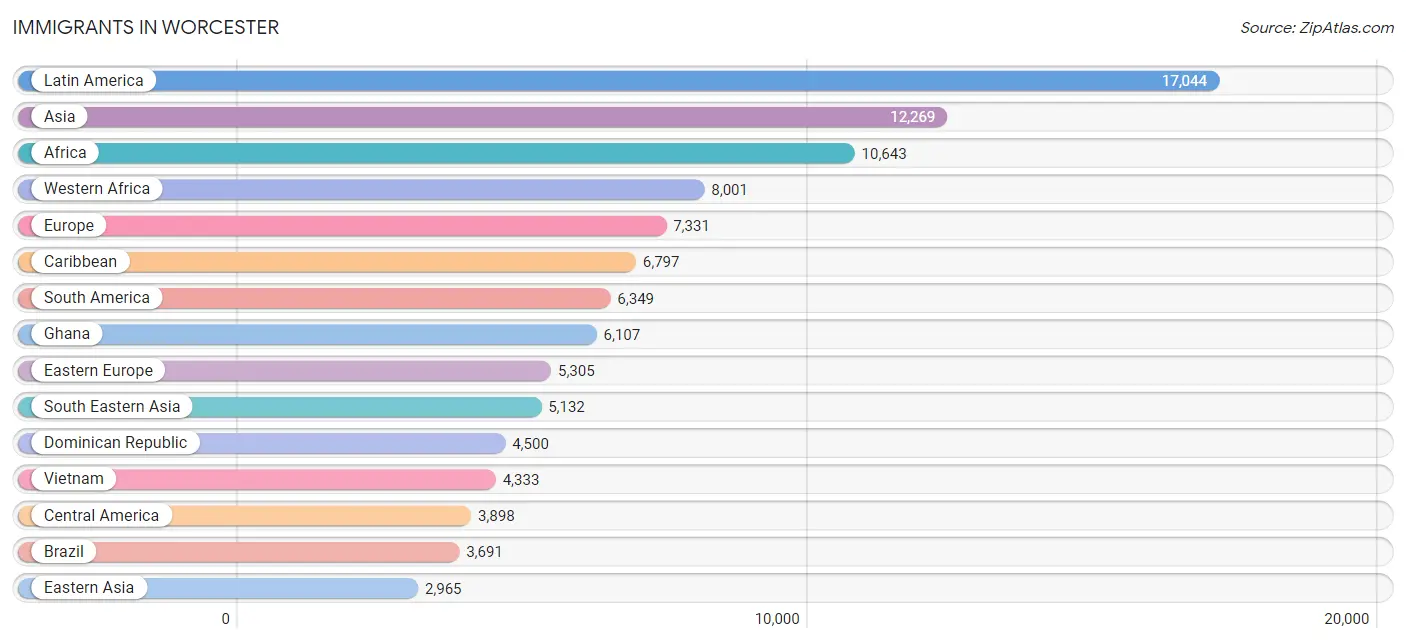
Immigrants in Worcester
The most numerous immigrant groups reported in Worcester came from Latin America (17,044 | 8.4%), Asia (12,269 | 6.0%), Africa (10,643 | 5.2%), Western Africa (8,001 | 3.9%), and Europe (7,331 | 3.6%), together accounting for 27.1% of all Worcester residents.
| Immigration Origin | # Population | % Population |
| Africa | 10,643 | 5.2% |
| Albania | 2,943 | 1.4% |
| Argentina | 189 | 0.1% |
| Asia | 12,269 | 6.0% |
| Australia | 88 | 0.0% |
| Austria | 39 | 0.0% |
| Bangladesh | 261 | 0.1% |
| Barbados | 5 | 0.0% |
| Belarus | 281 | 0.1% |
| Belgium | 34 | 0.0% |
| Bolivia | 112 | 0.1% |
| Bosnia and Herzegovina | 70 | 0.0% |
| Brazil | 3,691 | 1.8% |
| Bulgaria | 10 | 0.0% |
| Cabo Verde | 24 | 0.0% |
| Cambodia | 342 | 0.2% |
| Cameroon | 93 | 0.1% |
| Canada | 269 | 0.1% |
| Caribbean | 6,797 | 3.3% |
| Central America | 3,898 | 1.9% |
| Chile | 36 | 0.0% |
| China | 2,174 | 1.1% |
| Colombia | 801 | 0.4% |
| Congo | 13 | 0.0% |
| Costa Rica | 6 | 0.0% |
| Cuba | 84 | 0.0% |
| Denmark | 11 | 0.0% |
| Dominica | 69 | 0.0% |
| Dominican Republic | 4,500 | 2.2% |
| Eastern Africa | 1,529 | 0.7% |
| Eastern Asia | 2,965 | 1.5% |
| Eastern Europe | 5,305 | 2.6% |
| Ecuador | 966 | 0.5% |
| Egypt | 8 | 0.0% |
| El Salvador | 2,461 | 1.2% |
| England | 187 | 0.1% |
| Eritrea | 19 | 0.0% |
| Ethiopia | 31 | 0.0% |
| Europe | 7,331 | 3.6% |
| France | 113 | 0.1% |
| Germany | 116 | 0.1% |
| Ghana | 6,107 | 3.0% |
| Greece | 472 | 0.2% |
| Guatemala | 552 | 0.3% |
| Guyana | 114 | 0.1% |
| Haiti | 1,085 | 0.5% |
| Honduras | 70 | 0.0% |
| Hong Kong | 29 | 0.0% |
| Hungary | 7 | 0.0% |
| India | 645 | 0.3% |
| Indonesia | 49 | 0.0% |
| Iran | 79 | 0.0% |
| Iraq | 1,328 | 0.6% |
| Ireland | 110 | 0.1% |
| Israel | 70 | 0.0% |
| Italy | 428 | 0.2% |
| Jamaica | 892 | 0.4% |
| Japan | 240 | 0.1% |
| Jordan | 151 | 0.1% |
| Kazakhstan | 40 | 0.0% |
| Kenya | 953 | 0.5% |
| Korea | 535 | 0.3% |
| Kuwait | 33 | 0.0% |
| Laos | 118 | 0.1% |
| Latin America | 17,044 | 8.4% |
| Latvia | 22 | 0.0% |
| Lebanon | 442 | 0.2% |
| Liberia | 830 | 0.4% |
| Lithuania | 117 | 0.1% |
| Mexico | 606 | 0.3% |
| Middle Africa | 394 | 0.2% |
| Moldova | 8 | 0.0% |
| Morocco | 268 | 0.1% |
| Nepal | 230 | 0.1% |
| Netherlands | 10 | 0.0% |
| Nicaragua | 37 | 0.0% |
| Nigeria | 742 | 0.4% |
| North Macedonia | 22 | 0.0% |
| Northern Africa | 283 | 0.1% |
| Northern Europe | 545 | 0.3% |
| Norway | 1 | 0.0% |
| Oceania | 112 | 0.1% |
| Pakistan | 422 | 0.2% |
| Panama | 49 | 0.0% |
| Peru | 183 | 0.1% |
| Philippines | 164 | 0.1% |
| Poland | 994 | 0.5% |
| Portugal | 42 | 0.0% |
| Romania | 58 | 0.0% |
| Russia | 483 | 0.2% |
| Saudi Arabia | 56 | 0.0% |
| Scotland | 20 | 0.0% |
| Senegal | 42 | 0.0% |
| Serbia | 67 | 0.0% |
| Sierra Leone | 7 | 0.0% |
| Singapore | 10 | 0.0% |
| Somalia | 180 | 0.1% |
| South Africa | 74 | 0.0% |
| South America | 6,349 | 3.1% |
| South Central Asia | 1,724 | 0.8% |
| South Eastern Asia | 5,132 | 2.5% |
| Southern Europe | 1,098 | 0.5% |
| Spain | 156 | 0.1% |
| Sri Lanka | 4 | 0.0% |
| Sudan | 7 | 0.0% |
| Sweden | 13 | 0.0% |
| Switzerland | 71 | 0.0% |
| Syria | 283 | 0.1% |
| Taiwan | 134 | 0.1% |
| Thailand | 116 | 0.1% |
| Trinidad and Tobago | 126 | 0.1% |
| Turkey | 63 | 0.0% |
| Uganda | 112 | 0.1% |
| Ukraine | 88 | 0.0% |
| Uruguay | 14 | 0.0% |
| Venezuela | 243 | 0.1% |
| Vietnam | 4,333 | 2.1% |
| Western Africa | 8,001 | 3.9% |
| Western Asia | 2,448 | 1.2% |
| Western Europe | 383 | 0.2% |
| Zaire | 267 | 0.1% | View All 121 Rows |
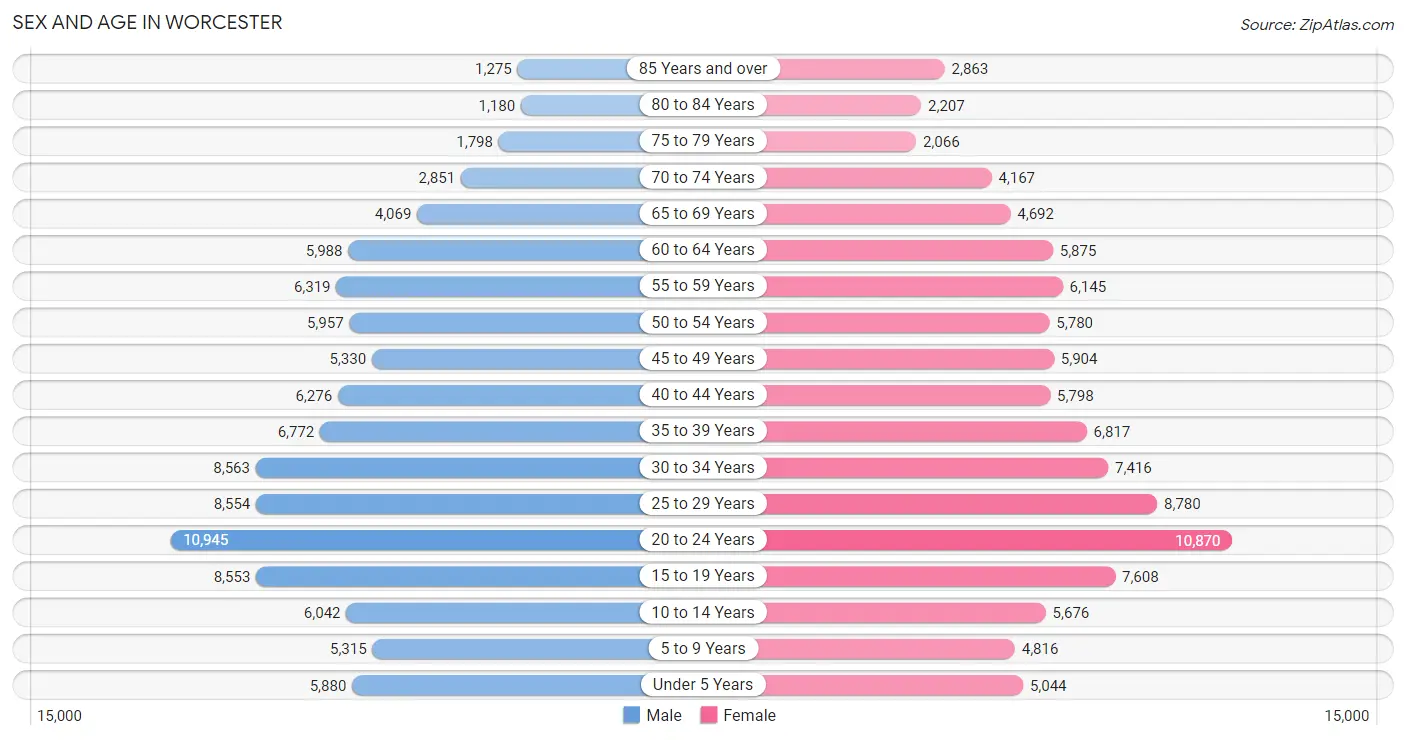
Sex and Age in Worcester
Sex and Age in Worcester
The most populous age groups in Worcester are 20 to 24 Years (10,945 | 10.8%) for men and 20 to 24 Years (10,870 | 10.6%) for women.
| Age Bracket | Male | Female |
| Under 5 Years | 5,880 (5.8%) | 5,044 (4.9%) |
| 5 to 9 Years | 5,315 (5.2%) | 4,816 (4.7%) |
| 10 to 14 Years | 6,042 (5.9%) | 5,676 (5.5%) |
| 15 to 19 Years | 8,553 (8.4%) | 7,608 (7.4%) |
| 20 to 24 Years | 10,945 (10.8%) | 10,870 (10.6%) |
| 25 to 29 Years | 8,554 (8.4%) | 8,780 (8.6%) |
| 30 to 34 Years | 8,563 (8.4%) | 7,416 (7.2%) |
| 35 to 39 Years | 6,772 (6.7%) | 6,817 (6.7%) |
| 40 to 44 Years | 6,276 (6.2%) | 5,798 (5.7%) |
| 45 to 49 Years | 5,330 (5.2%) | 5,904 (5.8%) |
| 50 to 54 Years | 5,957 (5.9%) | 5,780 (5.6%) |
| 55 to 59 Years | 6,319 (6.2%) | 6,145 (6.0%) |
| 60 to 64 Years | 5,988 (5.9%) | 5,875 (5.7%) |
| 65 to 69 Years | 4,069 (4.0%) | 4,692 (4.6%) |
| 70 to 74 Years | 2,851 (2.8%) | 4,167 (4.1%) |
| 75 to 79 Years | 1,798 (1.8%) | 2,066 (2.0%) |
| 80 to 84 Years | 1,180 (1.2%) | 2,207 (2.1%) |
| 85 Years and over | 1,275 (1.3%) | 2,863 (2.8%) |
| Total | 101,667 (100.0%) | 102,524 (100.0%) |
Families and Households in Worcester
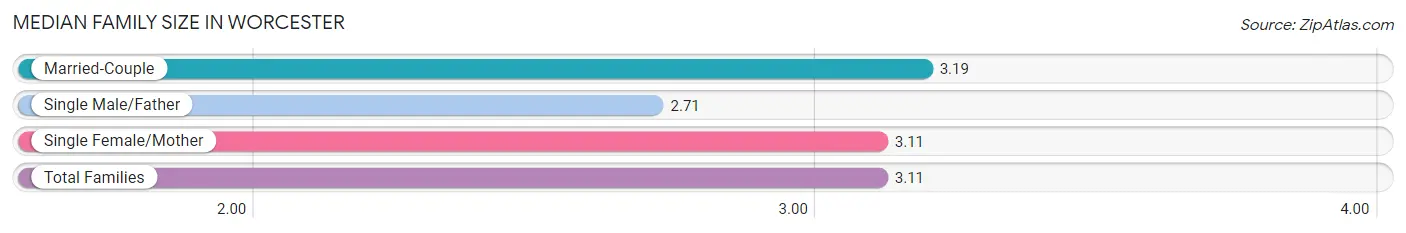
Median Family Size in Worcester
The median family size in Worcester is 3.11 persons per family, with married-couple families (26,177 | 59.3%) accounting for the largest median family size of 3.19 persons per family. On the other hand, single male/father families (5,147 | 11.7%) represent the smallest median family size with 2.71 persons per family.
| Family Type | # Families | Family Size |
| Married-Couple | 26,177 (59.3%) | 3.19 |
| Single Male/Father | 5,147 (11.7%) | 2.71 |
| Single Female/Mother | 12,794 (29.0%) | 3.11 |
| Total Families | 44,118 (100.0%) | 3.11 |
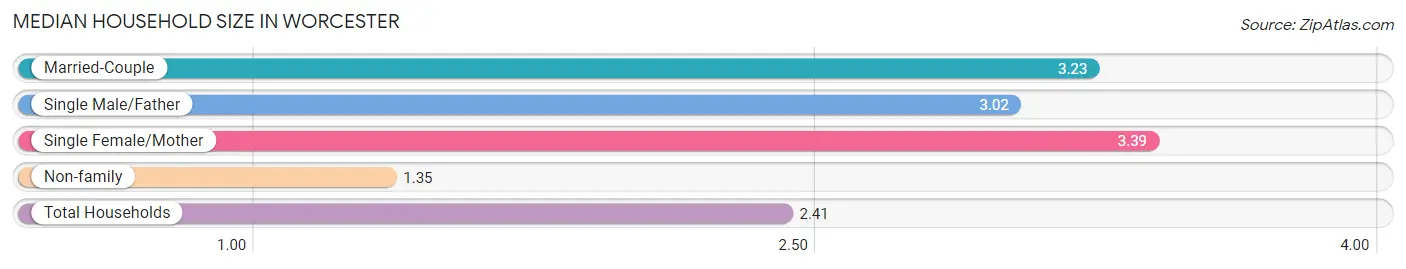
Median Household Size in Worcester
The median household size in Worcester is 2.41 persons per household, with single female/mother households (12,794 | 16.2%) accounting for the largest median household size of 3.39 persons per household. non-family households (34,859 | 44.1%) represent the smallest median household size with 1.35 persons per household.
| Household Type | # Households | Household Size |
| Married-Couple | 26,177 (33.2%) | 3.23 |
| Single Male/Father | 5,147 (6.5%) | 3.02 |
| Single Female/Mother | 12,794 (16.2%) | 3.39 |
| Non-family | 34,859 (44.1%) | 1.35 |
| Total Households | 78,977 (100.0%) | 2.41 |
Household Size by Marriage Status in Worcester
Out of a total of 78,977 households in Worcester, 44,118 (55.9%) are family households, while 34,859 (44.1%) are nonfamily households. The most numerous type of family households are 2-person households, comprising 16,715, and the most common type of nonfamily households are 1-person households, comprising 26,433.

| Household Size | Family Households | Nonfamily Households |
| 1-Person Households | - | 26,433 (33.5%) |
| 2-Person Households | 16,715 (21.2%) | 6,045 (7.6%) |
| 3-Person Households | 11,865 (15.0%) | 1,745 (2.2%) |
| 4-Person Households | 9,669 (12.2%) | 471 (0.6%) |
| 5-Person Households | 3,194 (4.0%) | 95 (0.1%) |
| 6-Person Households | 1,911 (2.4%) | 58 (0.1%) |
| 7+ Person Households | 764 (1.0%) | 12 (0.0%) |
| Total | 44,118 (55.9%) | 34,859 (44.1%) |
Female Fertility in Worcester
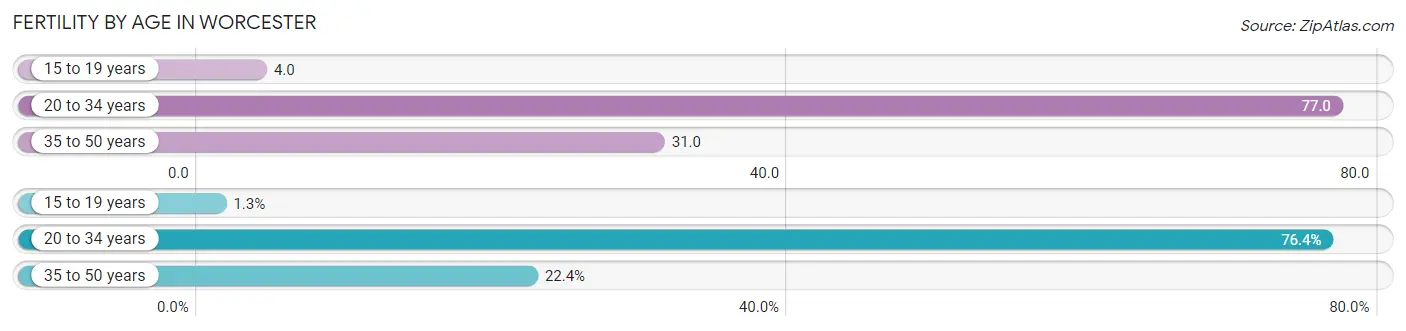
Fertility by Age in Worcester
Average fertility rate in Worcester is 50.0 births per 1,000 women. Women in the age bracket of 20 to 34 years have the highest fertility rate with 77.0 births per 1,000 women. Women in the age bracket of 20 to 34 years acount for 76.4% of all women with births.
| Age Bracket | Women with Births | Births / 1,000 Women |
| 15 to 19 years | 34 (1.3%) | 4.0 |
| 20 to 34 years | 2,080 (76.4%) | 77.0 |
| 35 to 50 years | 610 (22.4%) | 31.0 |
| Total | 2,724 (100.0%) | 50.0 |
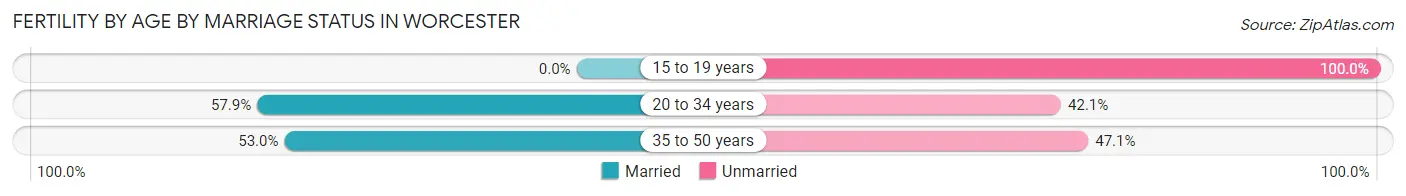
Fertility by Age by Marriage Status in Worcester
56.1% of women with births (2,724) in Worcester are married. The highest percentage of unmarried women with births falls into 15 to 19 years age bracket with 100.0% of them unmarried at the time of birth, while the lowest percentage of unmarried women with births belong to 20 to 34 years age bracket with 42.1% of them unmarried.
| Age Bracket | Married | Unmarried |
| 15 to 19 years | 0 (0.0%) | 34 (100.0%) |
| 20 to 34 years | 1,204 (57.9%) | 876 (42.1%) |
| 35 to 50 years | 323 (52.9%) | 287 (47.0%) |
| Total | 1,528 (56.1%) | 1,196 (43.9%) |
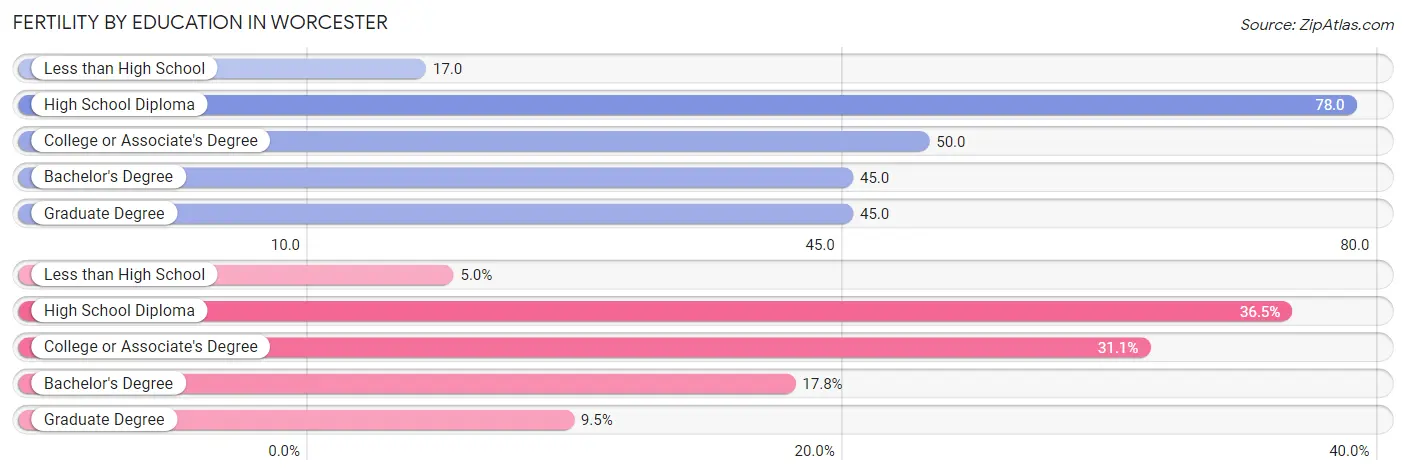
Fertility by Education in Worcester
Average fertility rate in Worcester is 50.0 births per 1,000 women. Women with the education attainment of high school diploma have the highest fertility rate of 78.0 births per 1,000 women, while women with the education attainment of less than high school have the lowest fertility at 17.0 births per 1,000 women. Women with the education attainment of high school diploma represent 36.4% of all women with births.
| Educational Attainment | Women with Births | Births / 1,000 Women |
| Less than High School | 137 (5.0%) | 17.0 |
| High School Diploma | 993 (36.4%) | 78.0 |
| College or Associate's Degree | 848 (31.1%) | 50.0 |
| Bachelor's Degree | 486 (17.8%) | 45.0 |
| Graduate Degree | 260 (9.5%) | 45.0 |
| Total | 2,724 (100.0%) | 50.0 |
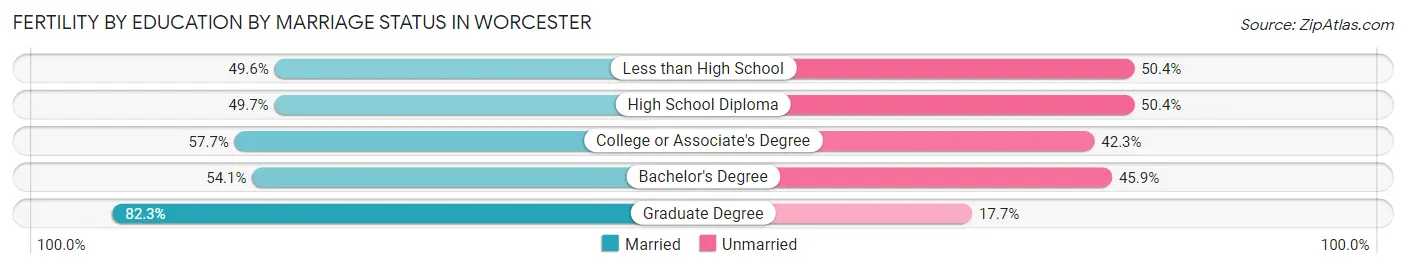
Fertility by Education by Marriage Status in Worcester
43.9% of women with births in Worcester are unmarried. Women with the educational attainment of graduate degree are most likely to be married with 82.3% of them married at childbirth, while women with the educational attainment of less than high school are least likely to be married with 50.4% of them unmarried at childbirth.
| Educational Attainment | Married | Unmarried |
| Less than High School | 68 (49.6%) | 69 (50.4%) |
| High School Diploma | 493 (49.6%) | 500 (50.3%) |
| College or Associate's Degree | 489 (57.7%) | 359 (42.3%) |
| Bachelor's Degree | 263 (54.1%) | 223 (45.9%) |
| Graduate Degree | 214 (82.3%) | 46 (17.7%) |
| Total | 1,528 (56.1%) | 1,196 (43.9%) |
Employment Characteristics in Worcester
Employment by Class of Employer in Worcester
Among the 98,617 employed individuals in Worcester, private company employees (65,109 | 66.0%), not-for-profit organizations (13,073 | 13.3%), and local government employees (6,399 | 6.5%) make up the most common classes of employment.
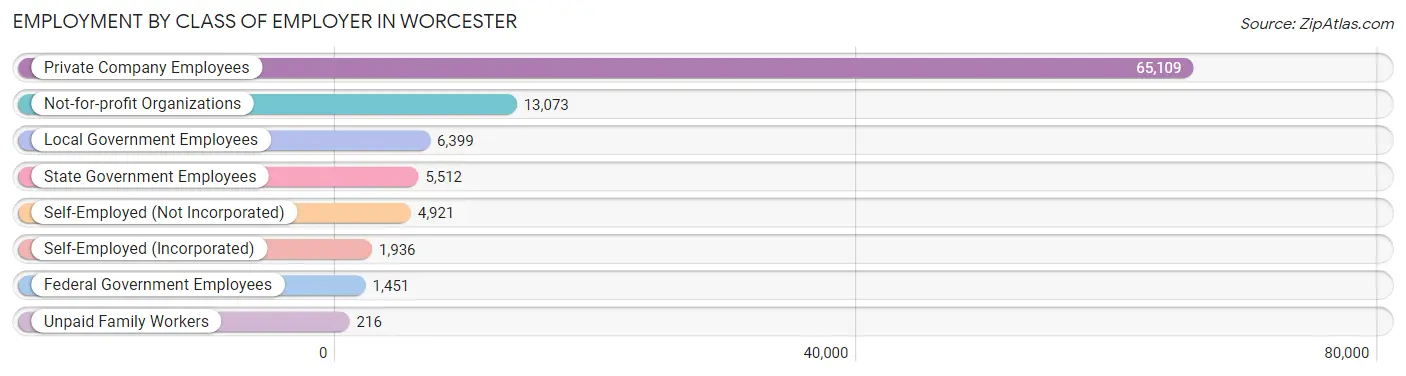
| Employer Class | # Employees | % Employees |
| Private Company Employees | 65,109 | 66.0% |
| Self-Employed (Incorporated) | 1,936 | 2.0% |
| Self-Employed (Not Incorporated) | 4,921 | 5.0% |
| Not-for-profit Organizations | 13,073 | 13.3% |
| Local Government Employees | 6,399 | 6.5% |
| State Government Employees | 5,512 | 5.6% |
| Federal Government Employees | 1,451 | 1.5% |
| Unpaid Family Workers | 216 | 0.2% |
| Total | 98,617 | 100.0% |
Employment Status by Age in Worcester
According to the labor force statistics for Worcester, out of the total population over 16 years of age (168,982), 63.9% or 107,979 individuals are in the labor force, with 6.6% or 7,127 of them unemployed. The age group with the highest labor force participation rate is 30 to 34 years, with 83.6% or 13,358 individuals in the labor force. Within the labor force, the 20 to 24 years age range has the highest percentage of unemployed individuals, with 11.0% or 1,644 of them being unemployed.
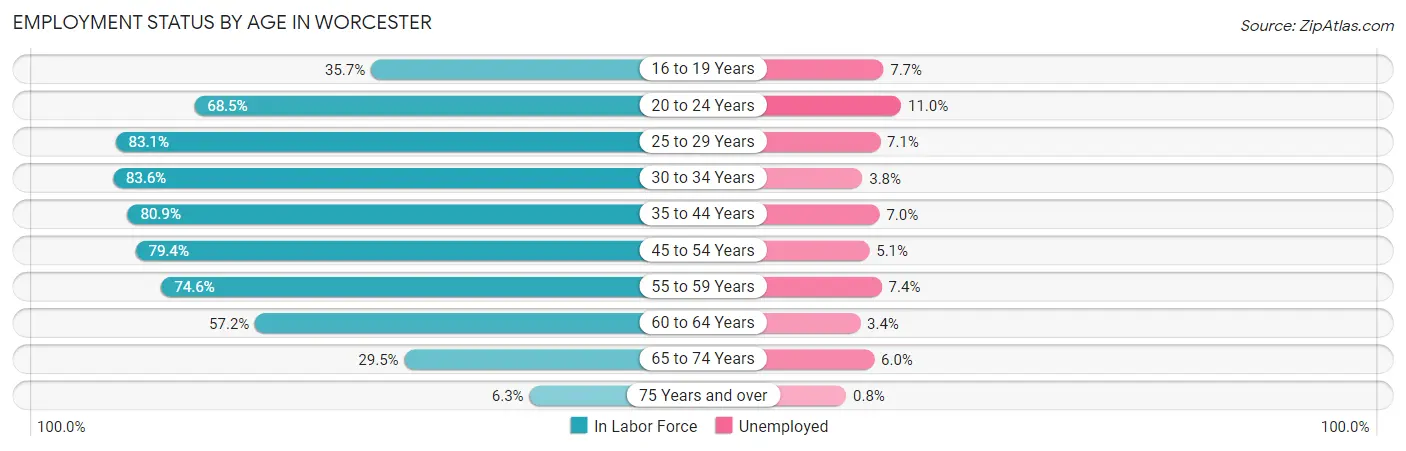
| Age Bracket | In Labor Force | Unemployed |
| 16 to 19 Years | 4,900 (35.7%) | 377 (7.7%) |
| 20 to 24 Years | 14,943 (68.5%) | 1,644 (11.0%) |
| 25 to 29 Years | 14,405 (83.1%) | 1,023 (7.1%) |
| 30 to 34 Years | 13,358 (83.6%) | 508 (3.8%) |
| 35 to 44 Years | 20,761 (80.9%) | 1,453 (7.0%) |
| 45 to 54 Years | 18,239 (79.4%) | 930 (5.1%) |
| 55 to 59 Years | 9,298 (74.6%) | 688 (7.4%) |
| 60 to 64 Years | 6,786 (57.2%) | 231 (3.4%) |
| 65 to 74 Years | 4,655 (29.5%) | 279 (6.0%) |
| 75 Years and over | 718 (6.3%) | 6 (0.8%) |
| Total | 107,979 (63.9%) | 7,127 (6.6%) |
Employment Status by Educational Attainment in Worcester
According to labor force statistics for Worcester, 78.0% of individuals (82,894) out of the total population between 25 and 64 years of age (106,274) are in the labor force, with 5.8% or 4,808 of them being unemployed. The group with the highest labor force participation rate are those with the educational attainment of bachelor's degree or higher, with 87.5% or 31,747 individuals in the labor force. Within the labor force, individuals with less than high school education have the highest percentage of unemployment, with 12.1% or 905 of them being unemployed.
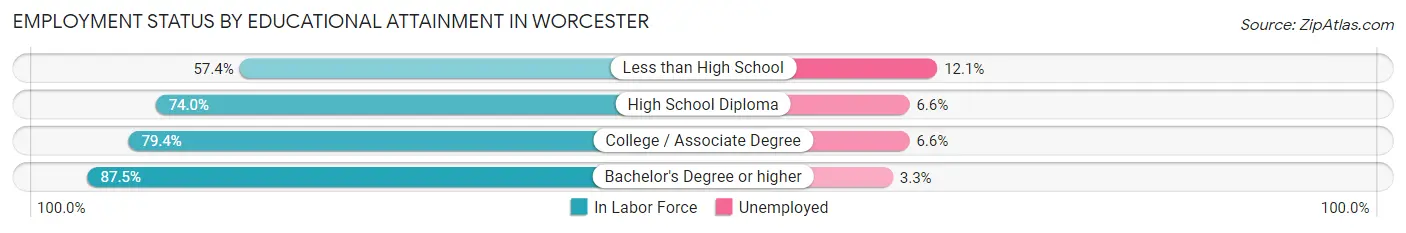
| Educational Attainment | In Labor Force | Unemployed |
| Less than High School | 7,480 (57.4%) | 1,577 (12.1%) |
| High School Diploma | 22,173 (74.0%) | 1,978 (6.6%) |
| College / Associate Degree | 21,436 (79.4%) | 1,782 (6.6%) |
| Bachelor's Degree or higher | 31,747 (87.5%) | 1,197 (3.3%) |
| Total | 82,894 (78.0%) | 6,164 (5.8%) |
Employment Occupations by Sex in Worcester
Management, Business, Science and Arts Occupations
The most common Management, Business, Science and Arts occupations in Worcester are Community & Social Service (12,702 | 12.6%), Management (8,823 | 8.7%), Computers, Engineering & Science (7,869 | 7.8%), Education Instruction & Library (7,642 | 7.6%), and Health Diagnosing & Treating (7,110 | 7.0%).
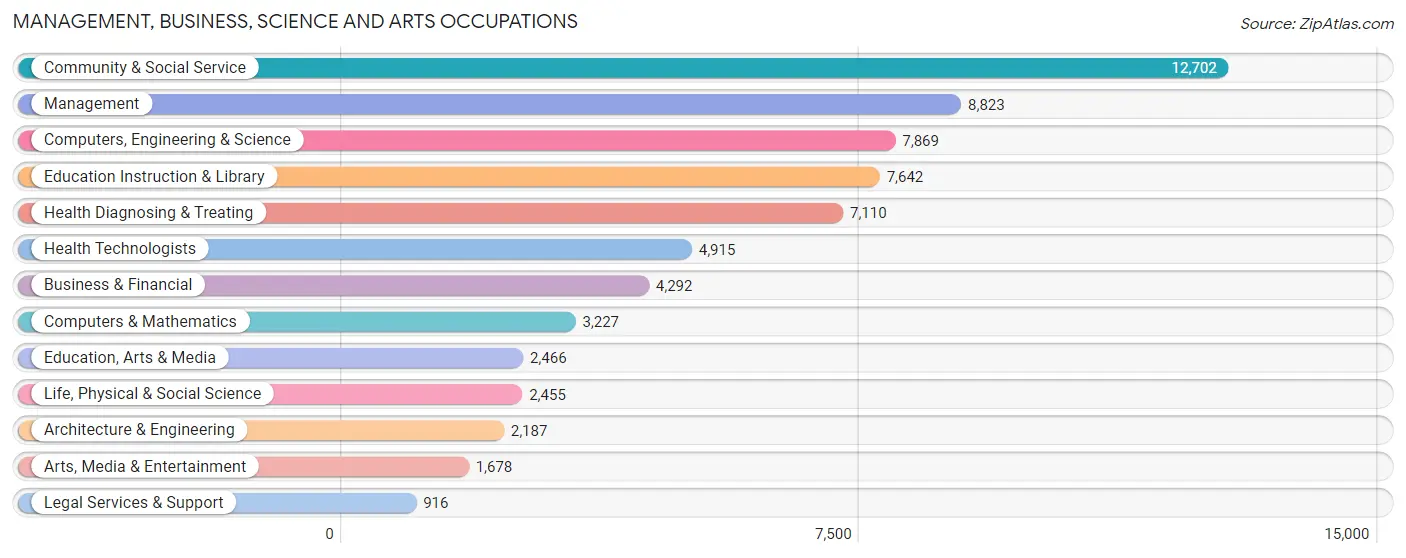
Management, Business, Science and Arts Occupations by Sex
Within the Management, Business, Science and Arts occupations in Worcester, the most male-oriented occupations are Architecture & Engineering (79.6%), Computers & Mathematics (74.5%), and Computers, Engineering & Science (73.1%), while the most female-oriented occupations are Health Technologists (72.8%), Health Diagnosing & Treating (72.5%), and Education Instruction & Library (64.4%).
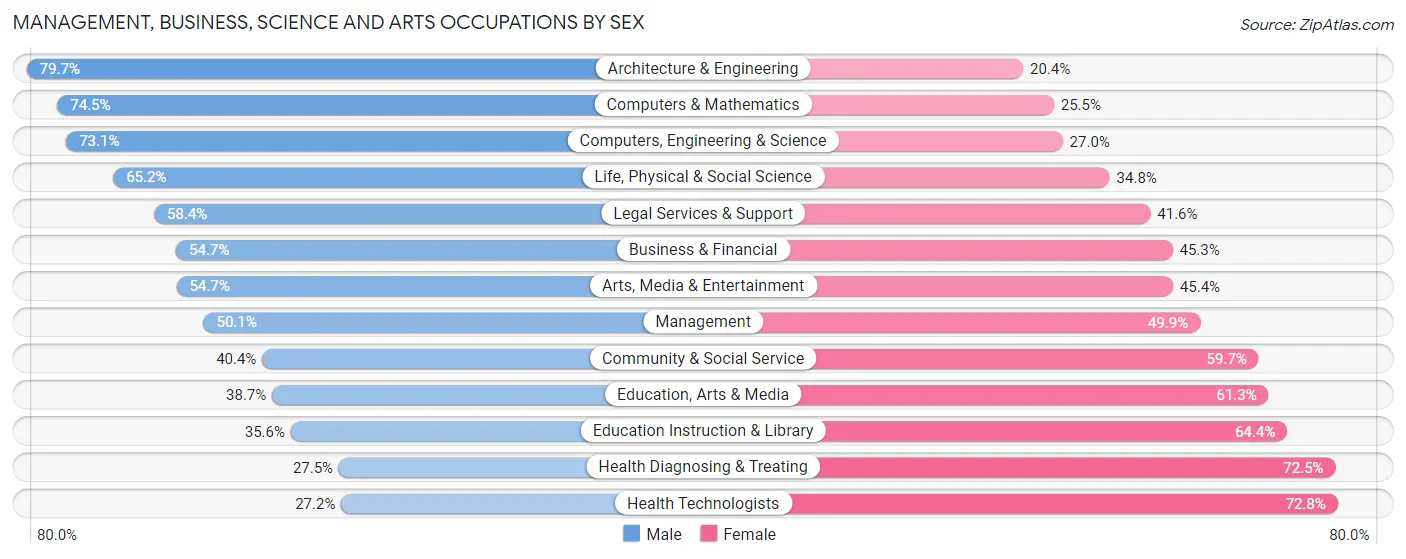
| Occupation | Male | Female |
| Management | 4,423 (50.1%) | 4,400 (49.9%) |
| Business & Financial | 2,348 (54.7%) | 1,944 (45.3%) |
| Computers, Engineering & Science | 5,748 (73.1%) | 2,121 (27.0%) |
| Computers & Mathematics | 2,405 (74.5%) | 822 (25.5%) |
| Architecture & Engineering | 1,742 (79.6%) | 445 (20.3%) |
| Life, Physical & Social Science | 1,601 (65.2%) | 854 (34.8%) |
| Community & Social Service | 5,125 (40.4%) | 7,577 (59.7%) |
| Education, Arts & Media | 954 (38.7%) | 1,512 (61.3%) |
| Legal Services & Support | 535 (58.4%) | 381 (41.6%) |
| Education Instruction & Library | 2,719 (35.6%) | 4,923 (64.4%) |
| Arts, Media & Entertainment | 917 (54.6%) | 761 (45.4%) |
| Health Diagnosing & Treating | 1,958 (27.5%) | 5,152 (72.5%) |
| Health Technologists | 1,335 (27.2%) | 3,580 (72.8%) |
| Total (Category) | 19,602 (48.0%) | 21,194 (51.9%) |
| Total (Overall) | 52,663 (52.2%) | 48,166 (47.8%) |
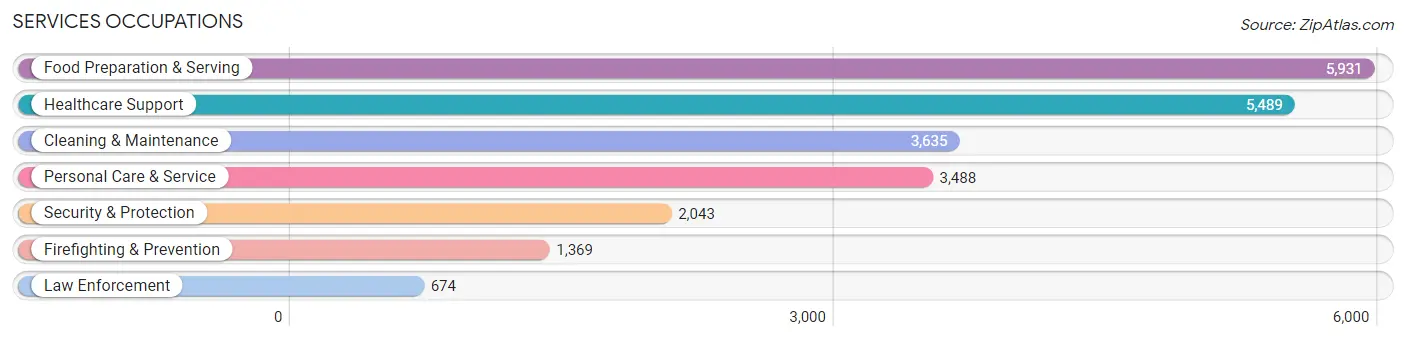
Services Occupations
The most common Services occupations in Worcester are Food Preparation & Serving (5,931 | 5.9%), Healthcare Support (5,489 | 5.4%), Cleaning & Maintenance (3,635 | 3.6%), Personal Care & Service (3,488 | 3.5%), and Security & Protection (2,043 | 2.0%).
Services Occupations by Sex
Within the Services occupations in Worcester, the most male-oriented occupations are Law Enforcement (85.0%), Security & Protection (77.7%), and Firefighting & Prevention (74.1%), while the most female-oriented occupations are Healthcare Support (77.6%), Personal Care & Service (74.4%), and Food Preparation & Serving (56.1%).
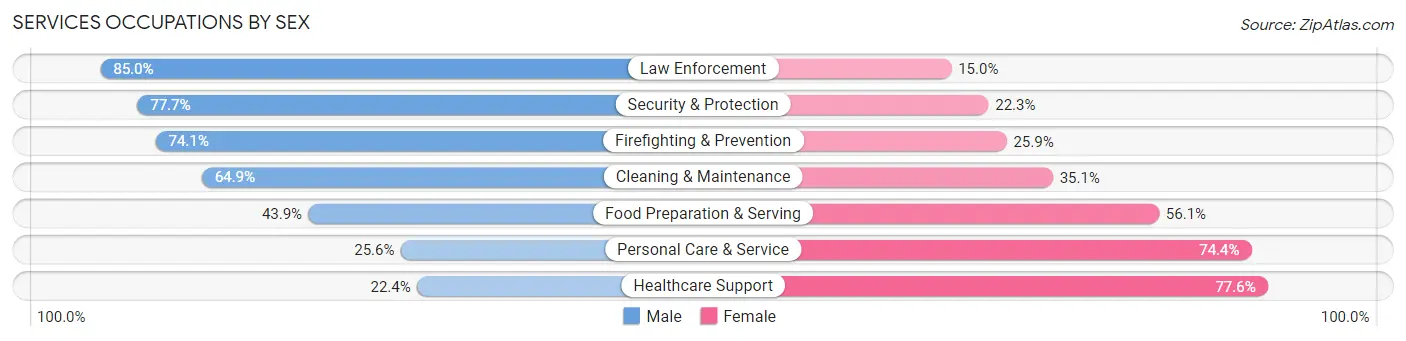
| Occupation | Male | Female |
| Healthcare Support | 1,229 (22.4%) | 4,260 (77.6%) |
| Security & Protection | 1,587 (77.7%) | 456 (22.3%) |
| Firefighting & Prevention | 1,014 (74.1%) | 355 (25.9%) |
| Law Enforcement | 573 (85.0%) | 101 (15.0%) |
| Food Preparation & Serving | 2,603 (43.9%) | 3,328 (56.1%) |
| Cleaning & Maintenance | 2,360 (64.9%) | 1,275 (35.1%) |
| Personal Care & Service | 893 (25.6%) | 2,595 (74.4%) |
| Total (Category) | 8,672 (42.1%) | 11,914 (57.9%) |
| Total (Overall) | 52,663 (52.2%) | 48,166 (47.8%) |
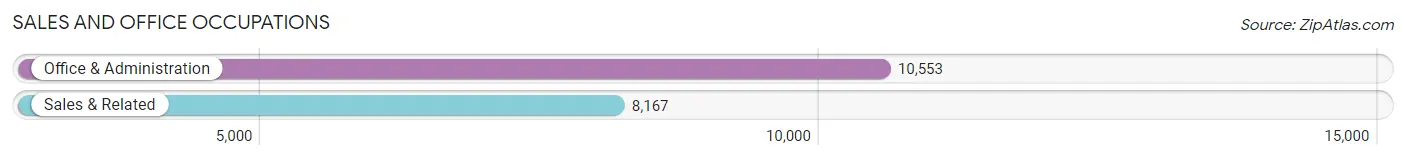
Sales and Office Occupations
The most common Sales and Office occupations in Worcester are Office & Administration (10,553 | 10.5%), and Sales & Related (8,167 | 8.1%).
Sales and Office Occupations by Sex
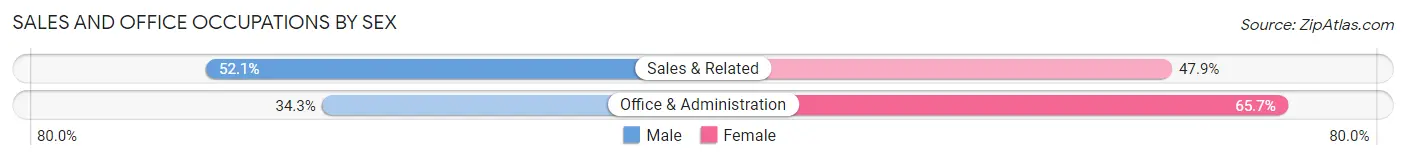
| Occupation | Male | Female |
| Sales & Related | 4,252 (52.1%) | 3,915 (47.9%) |
| Office & Administration | 3,621 (34.3%) | 6,932 (65.7%) |
| Total (Category) | 7,873 (42.1%) | 10,847 (57.9%) |
| Total (Overall) | 52,663 (52.2%) | 48,166 (47.8%) |
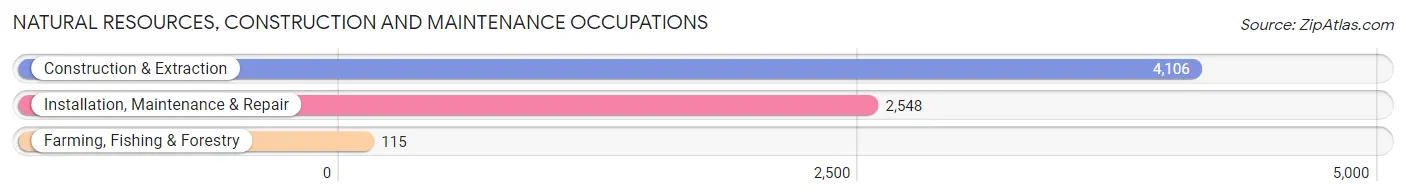
Natural Resources, Construction and Maintenance Occupations
The most common Natural Resources, Construction and Maintenance occupations in Worcester are Construction & Extraction (4,106 | 4.1%), Installation, Maintenance & Repair (2,548 | 2.5%), and Farming, Fishing & Forestry (115 | 0.1%).
Natural Resources, Construction and Maintenance Occupations by Sex
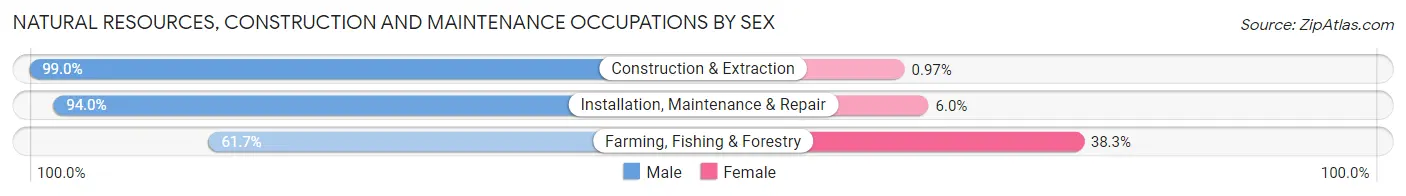
| Occupation | Male | Female |
| Farming, Fishing & Forestry | 71 (61.7%) | 44 (38.3%) |
| Construction & Extraction | 4,066 (99.0%) | 40 (1.0%) |
| Installation, Maintenance & Repair | 2,396 (94.0%) | 152 (6.0%) |
| Total (Category) | 6,533 (96.5%) | 236 (3.5%) |
| Total (Overall) | 52,663 (52.2%) | 48,166 (47.8%) |
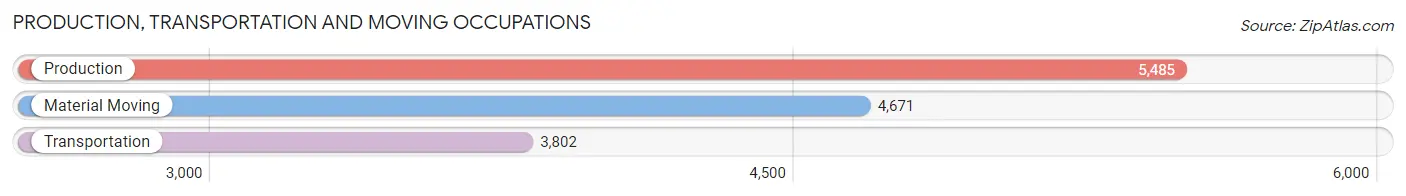
Production, Transportation and Moving Occupations
The most common Production, Transportation and Moving occupations in Worcester are Production (5,485 | 5.4%), Material Moving (4,671 | 4.6%), and Transportation (3,802 | 3.8%).
Production, Transportation and Moving Occupations by Sex
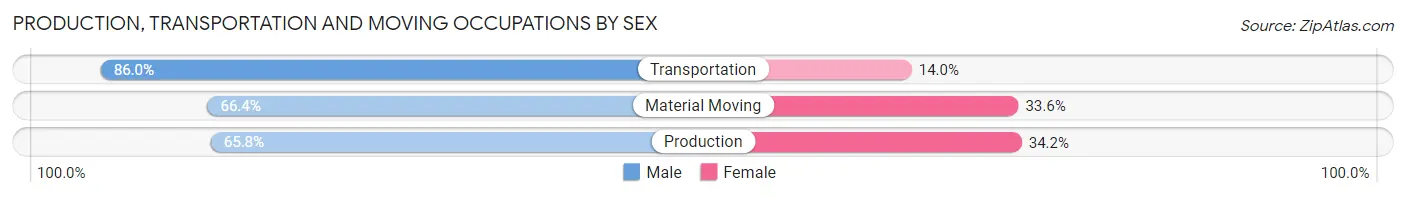
| Occupation | Male | Female |
| Production | 3,610 (65.8%) | 1,875 (34.2%) |
| Transportation | 3,270 (86.0%) | 532 (14.0%) |
| Material Moving | 3,103 (66.4%) | 1,568 (33.6%) |
| Total (Category) | 9,983 (71.5%) | 3,975 (28.5%) |
| Total (Overall) | 52,663 (52.2%) | 48,166 (47.8%) |
Employment Industries by Sex in Worcester
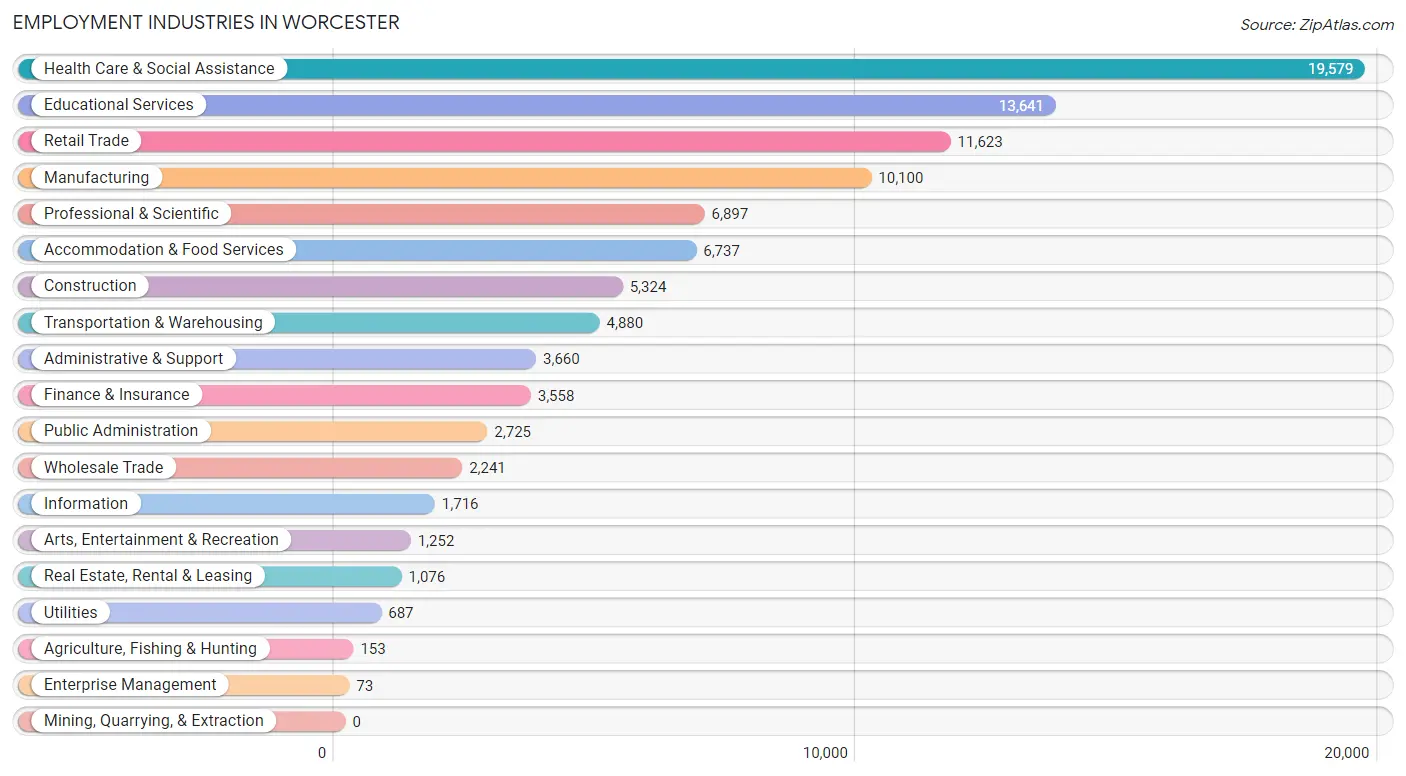
Employment Industries in Worcester
The major employment industries in Worcester include Health Care & Social Assistance (19,579 | 19.4%), Educational Services (13,641 | 13.5%), Retail Trade (11,623 | 11.5%), Manufacturing (10,100 | 10.0%), and Professional & Scientific (6,897 | 6.8%).
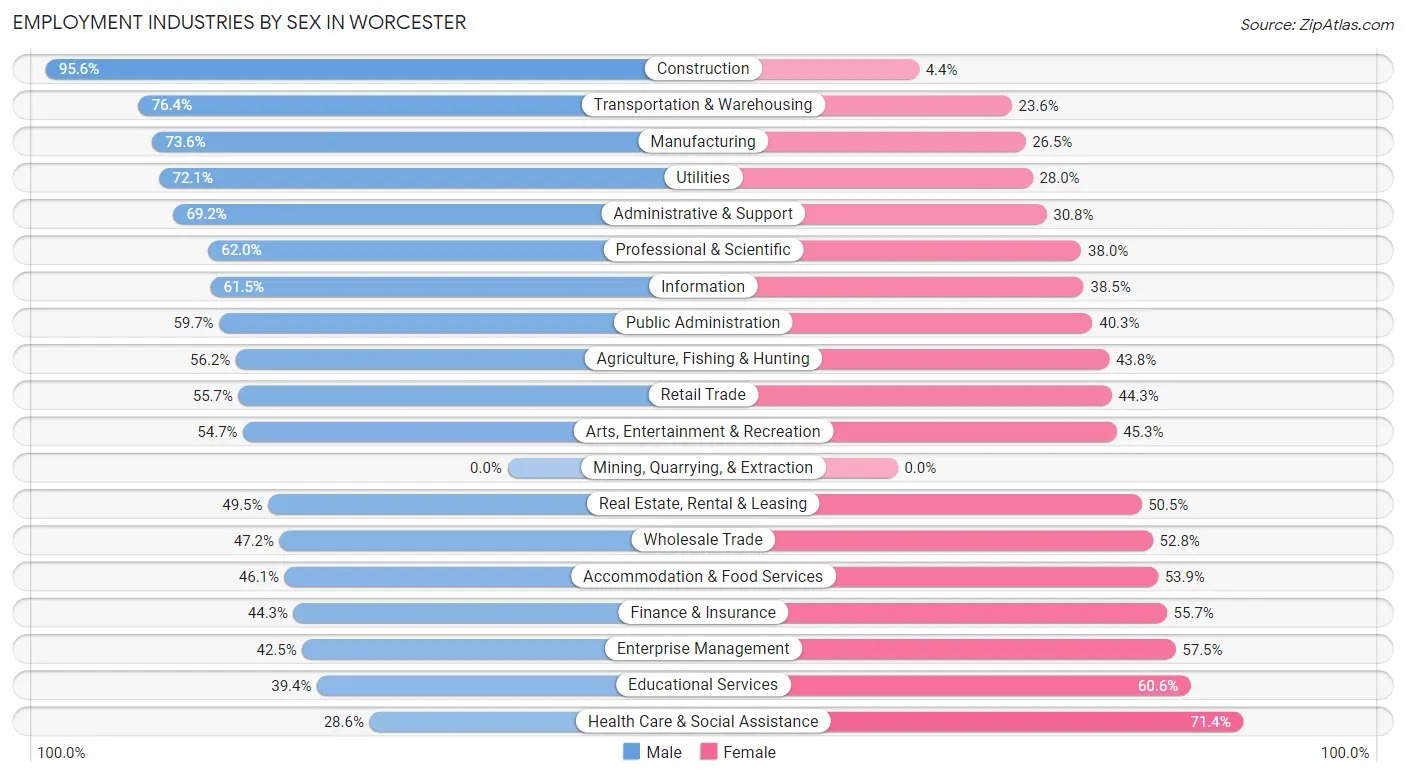
Employment Industries by Sex in Worcester
The Worcester industries that see more men than women are Construction (95.6%), Transportation & Warehousing (76.4%), and Manufacturing (73.6%), whereas the industries that tend to have a higher number of women are Health Care & Social Assistance (71.4%), Educational Services (60.6%), and Enterprise Management (57.5%).
| Industry | Male | Female |
| Agriculture, Fishing & Hunting | 86 (56.2%) | 67 (43.8%) |
| Mining, Quarrying, & Extraction | 0 (0.0%) | 0 (0.0%) |
| Construction | 5,089 (95.6%) | 235 (4.4%) |
| Manufacturing | 7,429 (73.6%) | 2,671 (26.5%) |
| Wholesale Trade | 1,057 (47.2%) | 1,184 (52.8%) |
| Retail Trade | 6,469 (55.7%) | 5,154 (44.3%) |
| Transportation & Warehousing | 3,727 (76.4%) | 1,153 (23.6%) |
| Utilities | 495 (72.1%) | 192 (28.0%) |
| Information | 1,055 (61.5%) | 661 (38.5%) |
| Finance & Insurance | 1,575 (44.3%) | 1,983 (55.7%) |
| Real Estate, Rental & Leasing | 533 (49.5%) | 543 (50.5%) |
| Professional & Scientific | 4,274 (62.0%) | 2,623 (38.0%) |
| Enterprise Management | 31 (42.5%) | 42 (57.5%) |
| Administrative & Support | 2,532 (69.2%) | 1,128 (30.8%) |
| Educational Services | 5,377 (39.4%) | 8,264 (60.6%) |
| Health Care & Social Assistance | 5,591 (28.6%) | 13,988 (71.4%) |
| Arts, Entertainment & Recreation | 685 (54.7%) | 567 (45.3%) |
| Accommodation & Food Services | 3,108 (46.1%) | 3,629 (53.9%) |
| Public Administration | 1,626 (59.7%) | 1,099 (40.3%) |
| Total | 52,663 (52.2%) | 48,166 (47.8%) |
Education in Worcester
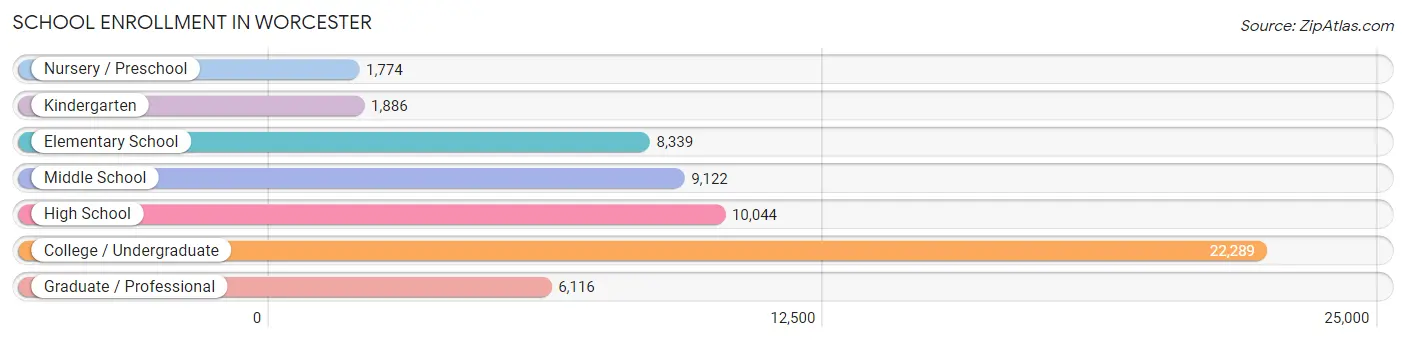
School Enrollment in Worcester
The most common levels of schooling among the 59,570 students in Worcester are college / undergraduate (22,289 | 37.4%), high school (10,044 | 16.9%), and middle school (9,122 | 15.3%).
| School Level | # Students | % Students |
| Nursery / Preschool | 1,774 | 3.0% |
| Kindergarten | 1,886 | 3.2% |
| Elementary School | 8,339 | 14.0% |
| Middle School | 9,122 | 15.3% |
| High School | 10,044 | 16.9% |
| College / Undergraduate | 22,289 | 37.4% |
| Graduate / Professional | 6,116 | 10.3% |
| Total | 59,570 | 100.0% |
School Enrollment by Age by Funding Source in Worcester
Out of a total of 59,570 students who are enrolled in schools in Worcester, 20,313 (34.1%) attend a private institution, while the remaining 39,257 (65.9%) are enrolled in public schools. The age group of 20 to 24 year olds has the highest likelihood of being enrolled in private schools, with 8,925 (64.1% in the age bracket) enrolled. Conversely, the age group of 5 to 9 year old has the lowest likelihood of being enrolled in a private school, with 8,804 (92.8% in the age bracket) attending a public institution.
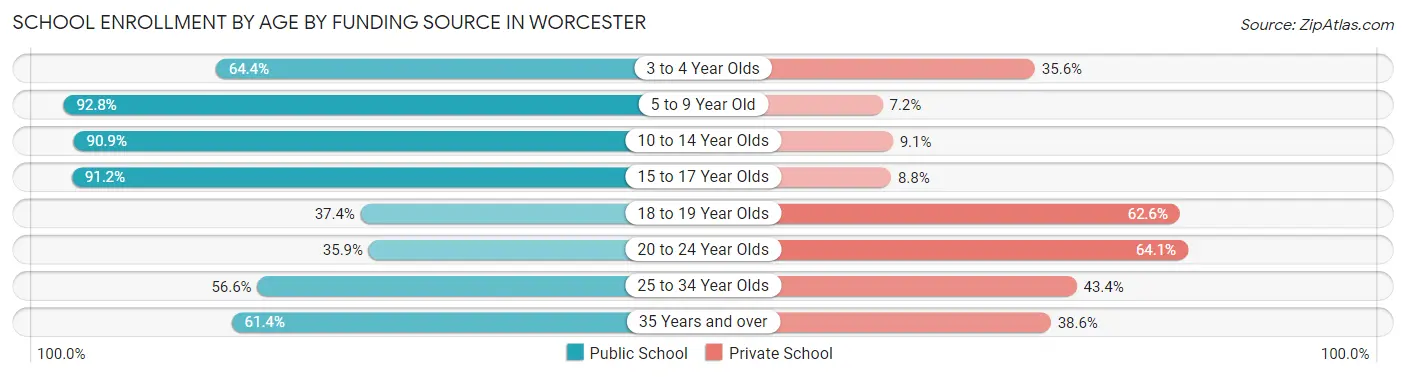
| Age Bracket | Public School | Private School |
| 3 to 4 Year Olds | 1,059 (64.4%) | 586 (35.6%) |
| 5 to 9 Year Old | 8,804 (92.8%) | 687 (7.2%) |
| 10 to 14 Year Olds | 10,197 (90.9%) | 1,025 (9.1%) |
| 15 to 17 Year Olds | 6,356 (91.2%) | 614 (8.8%) |
| 18 to 19 Year Olds | 2,944 (37.4%) | 4,927 (62.6%) |
| 20 to 24 Year Olds | 4,995 (35.9%) | 8,925 (64.1%) |
| 25 to 34 Year Olds | 3,288 (56.6%) | 2,518 (43.4%) |
| 35 Years and over | 1,625 (61.4%) | 1,020 (38.6%) |
| Total | 39,257 (65.9%) | 20,313 (34.1%) |
Educational Attainment by Field of Study in Worcester
Business (7,313 | 15.2%), science & technology (5,308 | 11.1%), bio, nature & agricultural (4,275 | 8.9%), social sciences (3,883 | 8.1%), and education (3,846 | 8.0%) are the most common fields of study among 48,041 individuals in Worcester who have obtained a bachelor's degree or higher.
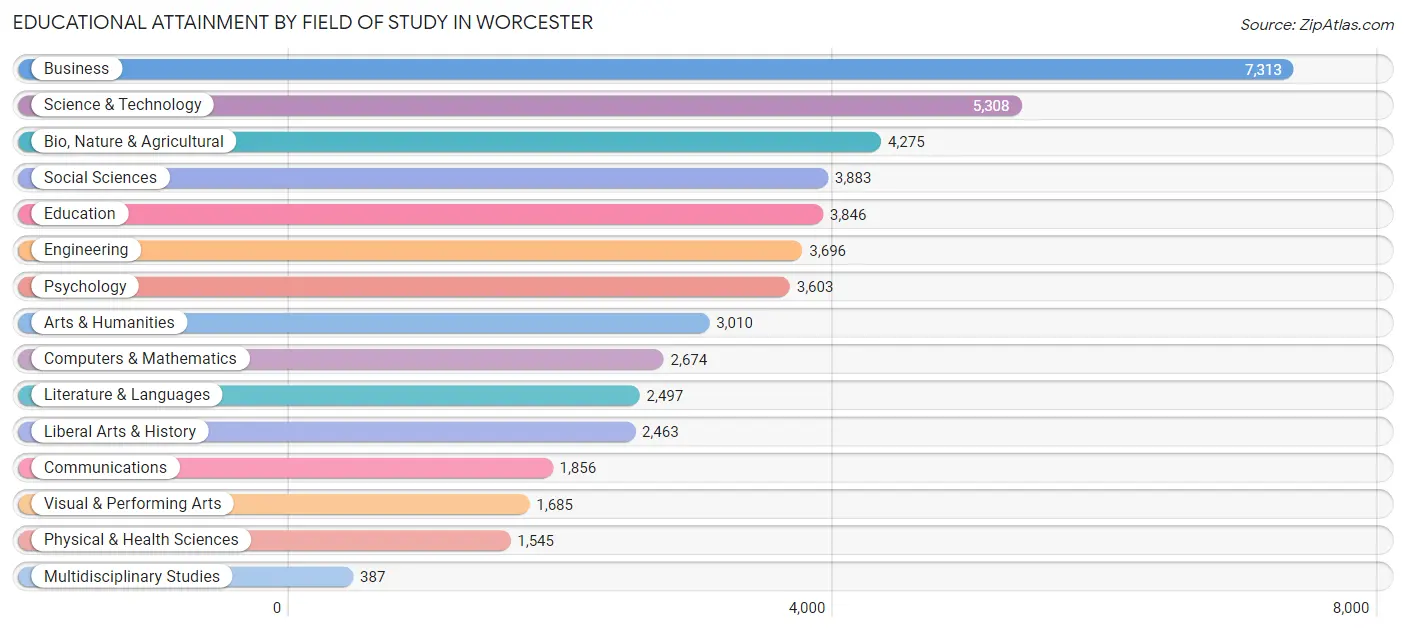
| Field of Study | # Graduates | % Graduates |
| Computers & Mathematics | 2,674 | 5.6% |
| Bio, Nature & Agricultural | 4,275 | 8.9% |
| Physical & Health Sciences | 1,545 | 3.2% |
| Psychology | 3,603 | 7.5% |
| Social Sciences | 3,883 | 8.1% |
| Engineering | 3,696 | 7.7% |
| Multidisciplinary Studies | 387 | 0.8% |
| Science & Technology | 5,308 | 11.1% |
| Business | 7,313 | 15.2% |
| Education | 3,846 | 8.0% |
| Literature & Languages | 2,497 | 5.2% |
| Liberal Arts & History | 2,463 | 5.1% |
| Visual & Performing Arts | 1,685 | 3.5% |
| Communications | 1,856 | 3.9% |
| Arts & Humanities | 3,010 | 6.3% |
| Total | 48,041 | 100.0% |
Transportation & Commute in Worcester
Vehicle Availability by Sex in Worcester
The most prevalent vehicle ownership categories in Worcester are males with 2 vehicles (19,968, accounting for 40.1%) and females with 2 vehicles (17,303, making up 44.9%).
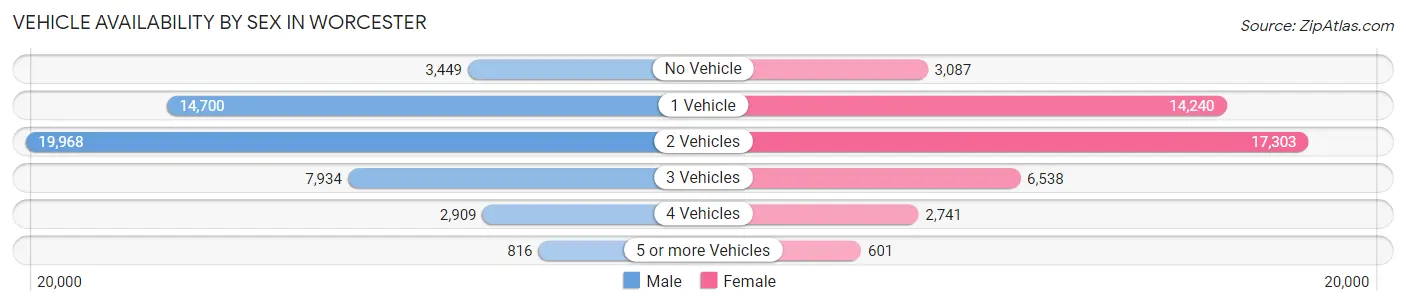
| Vehicles Available | Male | Female |
| No Vehicle | 3,449 (6.9%) | 3,087 (6.9%) |
| 1 Vehicle | 14,700 (29.5%) | 14,240 (32.0%) |
| 2 Vehicles | 19,968 (40.1%) | 17,303 (38.9%) |
| 3 Vehicles | 7,934 (15.9%) | 6,538 (14.7%) |
| 4 Vehicles | 2,909 (5.8%) | 2,741 (6.2%) |
| 5 or more Vehicles | 816 (1.6%) | 601 (1.3%) |
| Total | 49,776 (100.0%) | 44,510 (100.0%) |
Commute Time in Worcester
The most frequently occuring commute durations in Worcester are 10 to 14 minutes (15,324 commuters, 17.2%), 15 to 19 minutes (15,018 commuters, 16.9%), and 30 to 34 minutes (11,840 commuters, 13.3%).
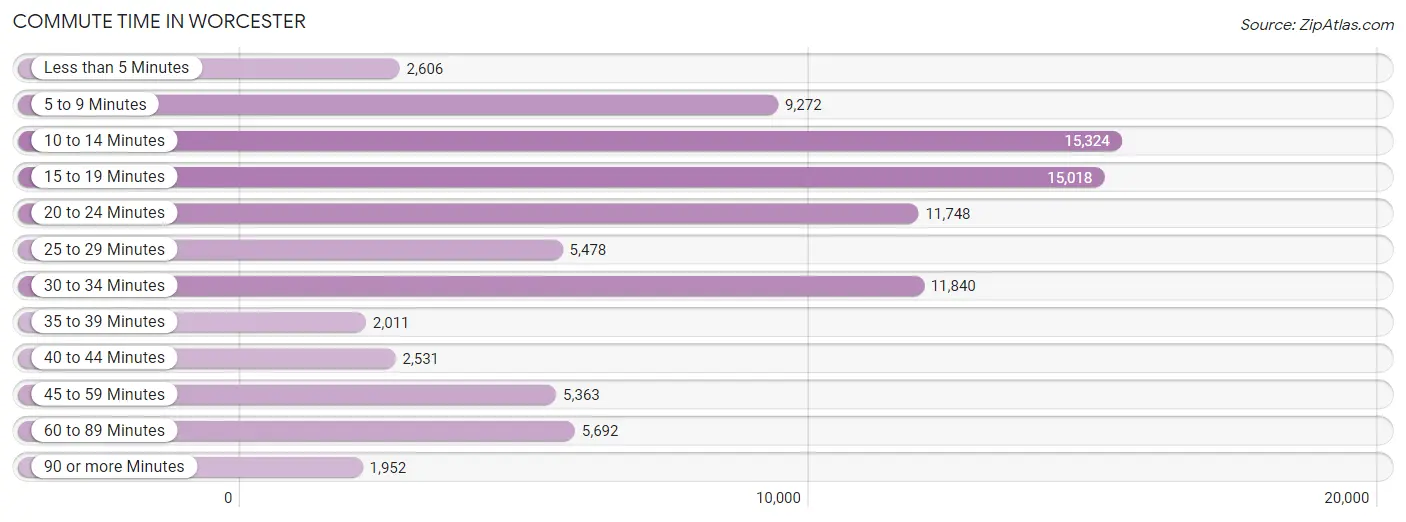
| Commute Time | # Commuters | % Commuters |
| Less than 5 Minutes | 2,606 | 2.9% |
| 5 to 9 Minutes | 9,272 | 10.4% |
| 10 to 14 Minutes | 15,324 | 17.2% |
| 15 to 19 Minutes | 15,018 | 16.9% |
| 20 to 24 Minutes | 11,748 | 13.2% |
| 25 to 29 Minutes | 5,478 | 6.2% |
| 30 to 34 Minutes | 11,840 | 13.3% |
| 35 to 39 Minutes | 2,011 | 2.3% |
| 40 to 44 Minutes | 2,531 | 2.9% |
| 45 to 59 Minutes | 5,363 | 6.0% |
| 60 to 89 Minutes | 5,692 | 6.4% |
| 90 or more Minutes | 1,952 | 2.2% |
Commute Time by Sex in Worcester
The most common commute times in Worcester are 10 to 14 minutes (7,433 commuters, 16.0%) for males and 15 to 19 minutes (8,100 commuters, 19.1%) for females.
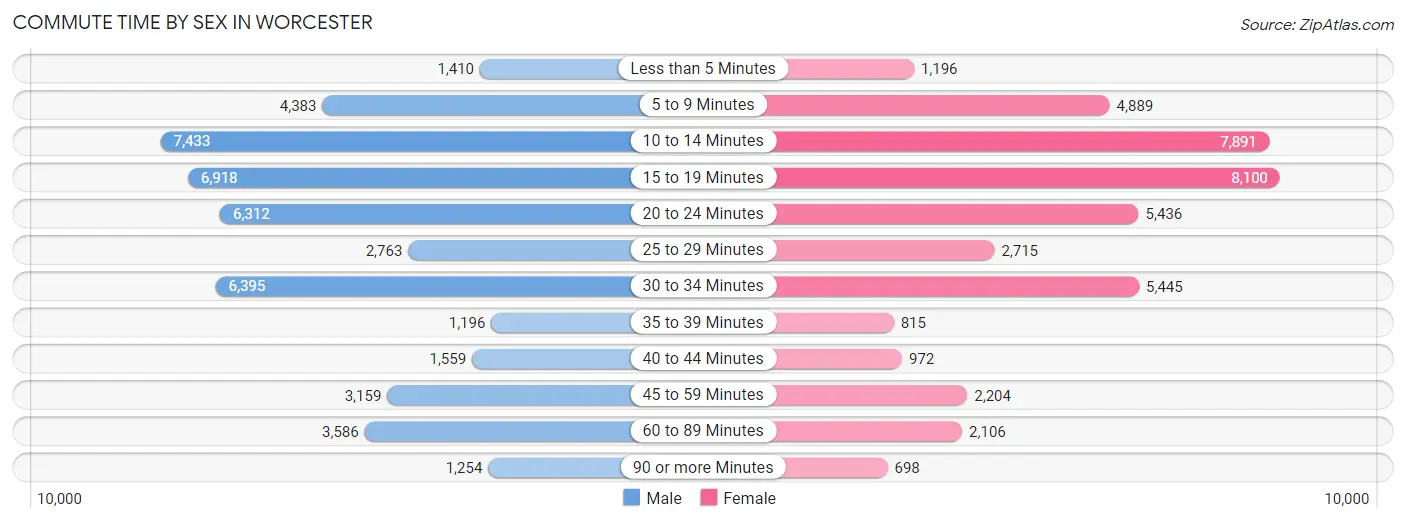
| Commute Time | Male | Female |
| Less than 5 Minutes | 1,410 (3.0%) | 1,196 (2.8%) |
| 5 to 9 Minutes | 4,383 (9.5%) | 4,889 (11.5%) |
| 10 to 14 Minutes | 7,433 (16.0%) | 7,891 (18.6%) |
| 15 to 19 Minutes | 6,918 (14.9%) | 8,100 (19.1%) |
| 20 to 24 Minutes | 6,312 (13.6%) | 5,436 (12.8%) |
| 25 to 29 Minutes | 2,763 (6.0%) | 2,715 (6.4%) |
| 30 to 34 Minutes | 6,395 (13.8%) | 5,445 (12.8%) |
| 35 to 39 Minutes | 1,196 (2.6%) | 815 (1.9%) |
| 40 to 44 Minutes | 1,559 (3.4%) | 972 (2.3%) |
| 45 to 59 Minutes | 3,159 (6.8%) | 2,204 (5.2%) |
| 60 to 89 Minutes | 3,586 (7.7%) | 2,106 (5.0%) |
| 90 or more Minutes | 1,254 (2.7%) | 698 (1.6%) |
Time of Departure to Work by Sex in Worcester
The most frequent times of departure to work in Worcester are 7:00 AM to 7:29 AM (6,310, 13.6%) for males and 7:00 AM to 7:29 AM (5,823, 13.7%) for females.
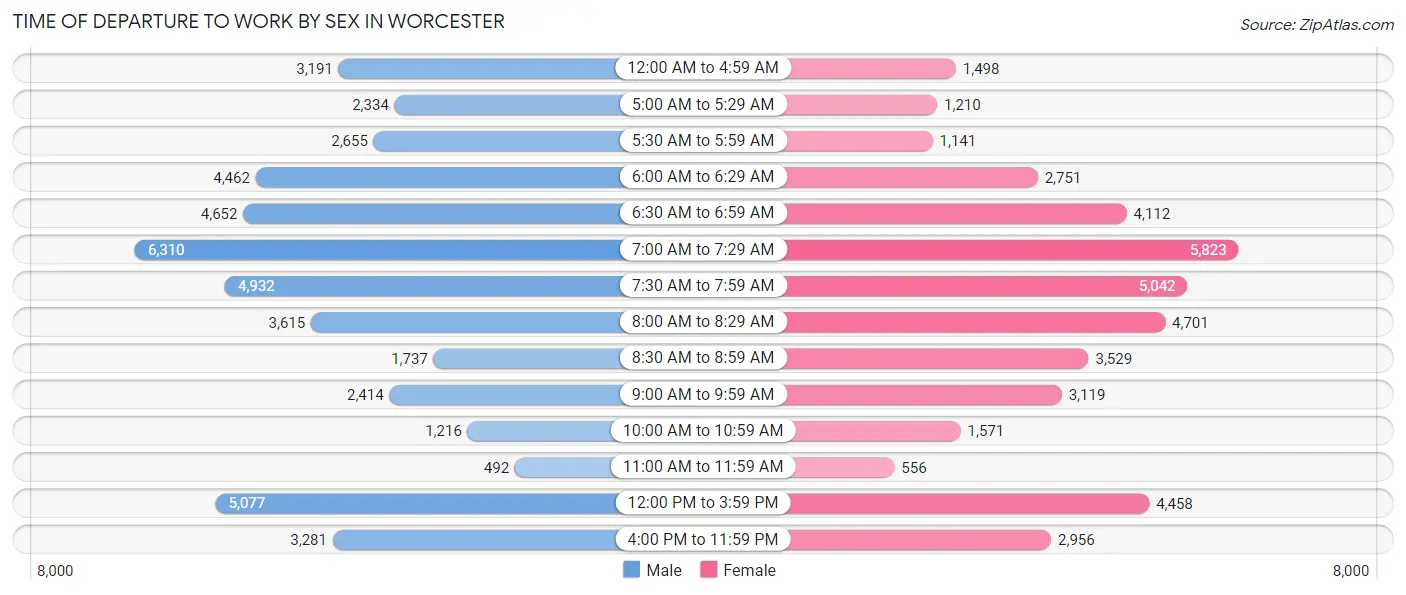
| Time of Departure | Male | Female |
| 12:00 AM to 4:59 AM | 3,191 (6.9%) | 1,498 (3.5%) |
| 5:00 AM to 5:29 AM | 2,334 (5.0%) | 1,210 (2.9%) |
| 5:30 AM to 5:59 AM | 2,655 (5.7%) | 1,141 (2.7%) |
| 6:00 AM to 6:29 AM | 4,462 (9.6%) | 2,751 (6.5%) |
| 6:30 AM to 6:59 AM | 4,652 (10.0%) | 4,112 (9.7%) |
| 7:00 AM to 7:29 AM | 6,310 (13.6%) | 5,823 (13.7%) |
| 7:30 AM to 7:59 AM | 4,932 (10.6%) | 5,042 (11.9%) |
| 8:00 AM to 8:29 AM | 3,615 (7.8%) | 4,701 (11.1%) |
| 8:30 AM to 8:59 AM | 1,737 (3.7%) | 3,529 (8.3%) |
| 9:00 AM to 9:59 AM | 2,414 (5.2%) | 3,119 (7.3%) |
| 10:00 AM to 10:59 AM | 1,216 (2.6%) | 1,571 (3.7%) |
| 11:00 AM to 11:59 AM | 492 (1.1%) | 556 (1.3%) |
| 12:00 PM to 3:59 PM | 5,077 (11.0%) | 4,458 (10.5%) |
| 4:00 PM to 11:59 PM | 3,281 (7.1%) | 2,956 (7.0%) |
| Total | 46,368 (100.0%) | 42,467 (100.0%) |
Housing Occupancy in Worcester
Occupancy by Ownership in Worcester
Of the total 78,977 dwellings in Worcester, owner-occupied units account for 33,253 (42.1%), while renter-occupied units make up 45,724 (57.9%).
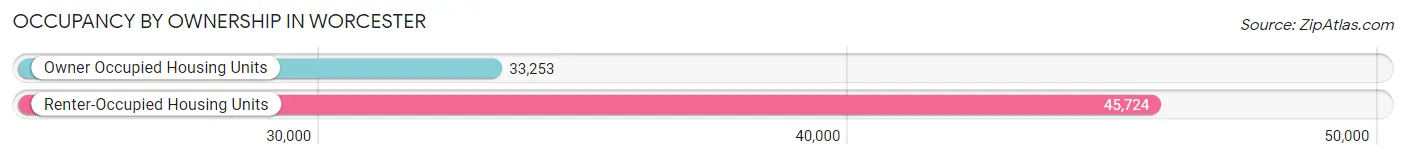
| Occupancy | # Housing Units | % Housing Units |
| Owner Occupied Housing Units | 33,253 | 42.1% |
| Renter-Occupied Housing Units | 45,724 | 57.9% |
| Total Occupied Housing Units | 78,977 | 100.0% |
Occupancy by Household Size in Worcester
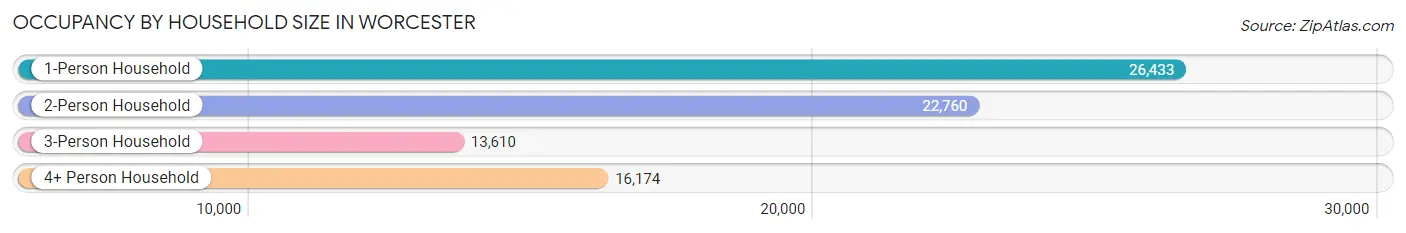
| Household Size | # Housing Units | % Housing Units |
| 1-Person Household | 26,433 | 33.5% |
| 2-Person Household | 22,760 | 28.8% |
| 3-Person Household | 13,610 | 17.2% |
| 4+ Person Household | 16,174 | 20.5% |
| Total Housing Units | 78,977 | 100.0% |
Occupancy by Ownership by Household Size in Worcester
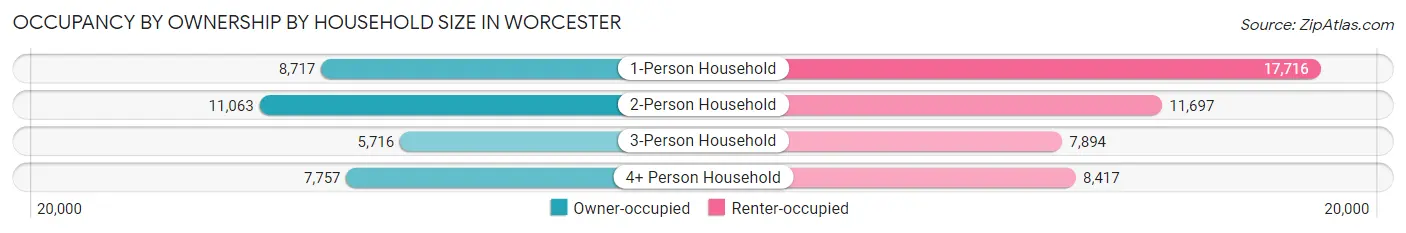
| Household Size | Owner-occupied | Renter-occupied |
| 1-Person Household | 8,717 (33.0%) | 17,716 (67.0%) |
| 2-Person Household | 11,063 (48.6%) | 11,697 (51.4%) |
| 3-Person Household | 5,716 (42.0%) | 7,894 (58.0%) |
| 4+ Person Household | 7,757 (48.0%) | 8,417 (52.0%) |
| Total Housing Units | 33,253 (42.1%) | 45,724 (57.9%) |
Occupancy by Educational Attainment in Worcester
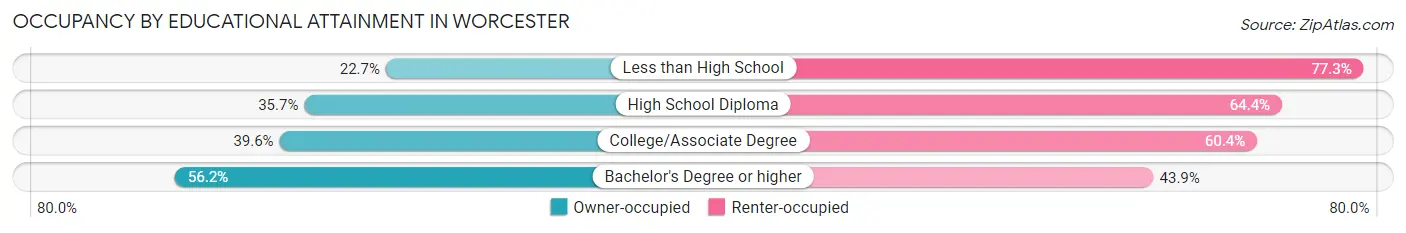
| Household Size | Owner-occupied | Renter-occupied |
| Less than High School | 2,219 (22.7%) | 7,551 (77.3%) |
| High School Diploma | 7,520 (35.6%) | 13,575 (64.3%) |
| College/Associate Degree | 8,360 (39.6%) | 12,763 (60.4%) |
| Bachelor's Degree or higher | 15,154 (56.1%) | 11,835 (43.9%) |
Occupancy by Age of Householder in Worcester
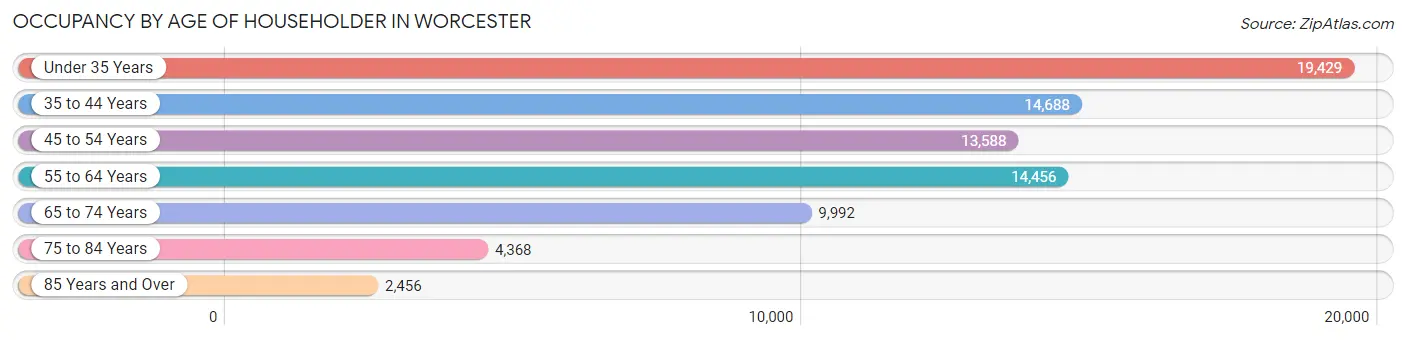
| Age Bracket | # Households | % Households |
| Under 35 Years | 19,429 | 24.6% |
| 35 to 44 Years | 14,688 | 18.6% |
| 45 to 54 Years | 13,588 | 17.2% |
| 55 to 64 Years | 14,456 | 18.3% |
| 65 to 74 Years | 9,992 | 12.7% |
| 75 to 84 Years | 4,368 | 5.5% |
| 85 Years and Over | 2,456 | 3.1% |
| Total | 78,977 | 100.0% |
Housing Finances in Worcester
Median Income by Occupancy in Worcester
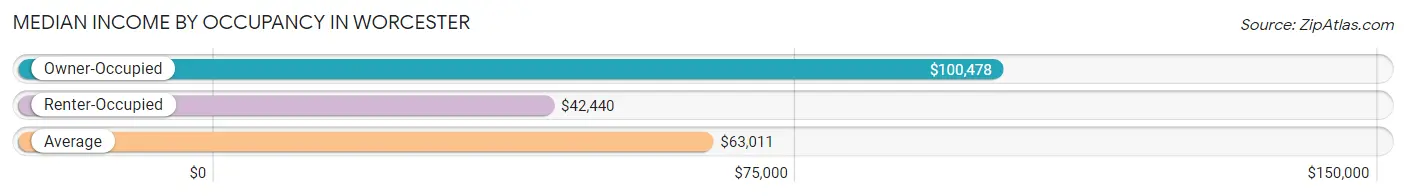
| Occupancy Type | # Households | Median Income |
| Owner-Occupied | 33,253 (42.1%) | $100,478 |
| Renter-Occupied | 45,724 (57.9%) | $42,440 |
| Average | 78,977 (100.0%) | $63,011 |
Occupancy by Householder Income Bracket in Worcester
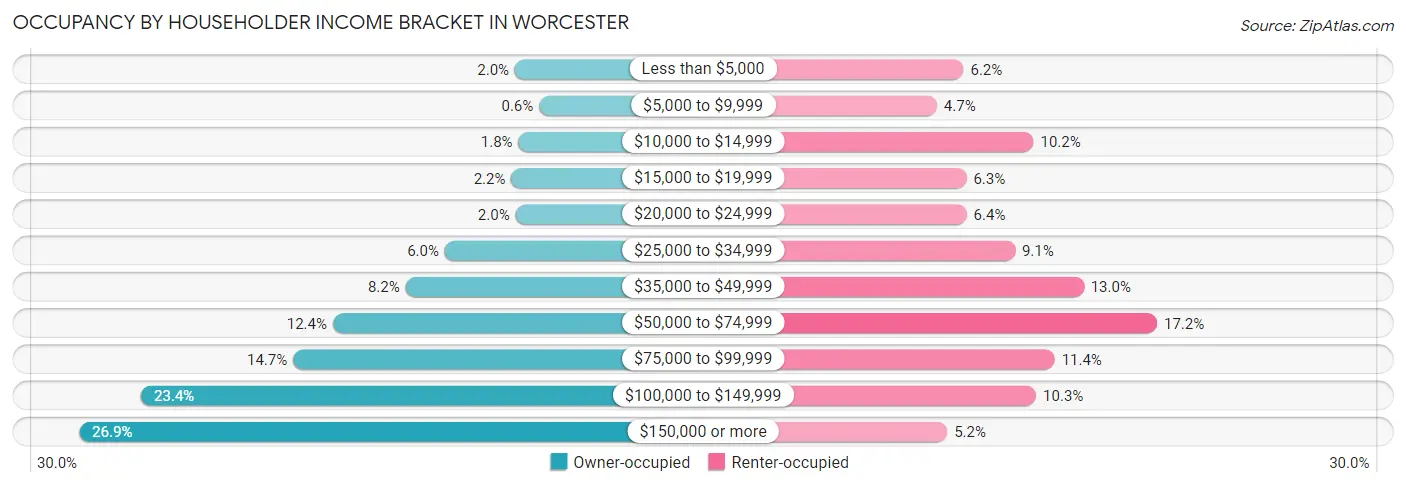
| Income Bracket | Owner-occupied | Renter-occupied |
| Less than $5,000 | 660 (2.0%) | 2,820 (6.2%) |
| $5,000 to $9,999 | 199 (0.6%) | 2,126 (4.6%) |
| $10,000 to $14,999 | 591 (1.8%) | 4,648 (10.2%) |
| $15,000 to $19,999 | 728 (2.2%) | 2,899 (6.3%) |
| $20,000 to $24,999 | 647 (1.9%) | 2,903 (6.4%) |
| $25,000 to $34,999 | 1,993 (6.0%) | 4,167 (9.1%) |
| $35,000 to $49,999 | 2,736 (8.2%) | 5,963 (13.0%) |
| $50,000 to $74,999 | 4,120 (12.4%) | 7,877 (17.2%) |
| $75,000 to $99,999 | 4,876 (14.7%) | 5,204 (11.4%) |
| $100,000 to $149,999 | 7,764 (23.4%) | 4,720 (10.3%) |
| $150,000 or more | 8,939 (26.9%) | 2,397 (5.2%) |
| Total | 33,253 (100.0%) | 45,724 (100.0%) |
Monthly Housing Cost Tiers in Worcester
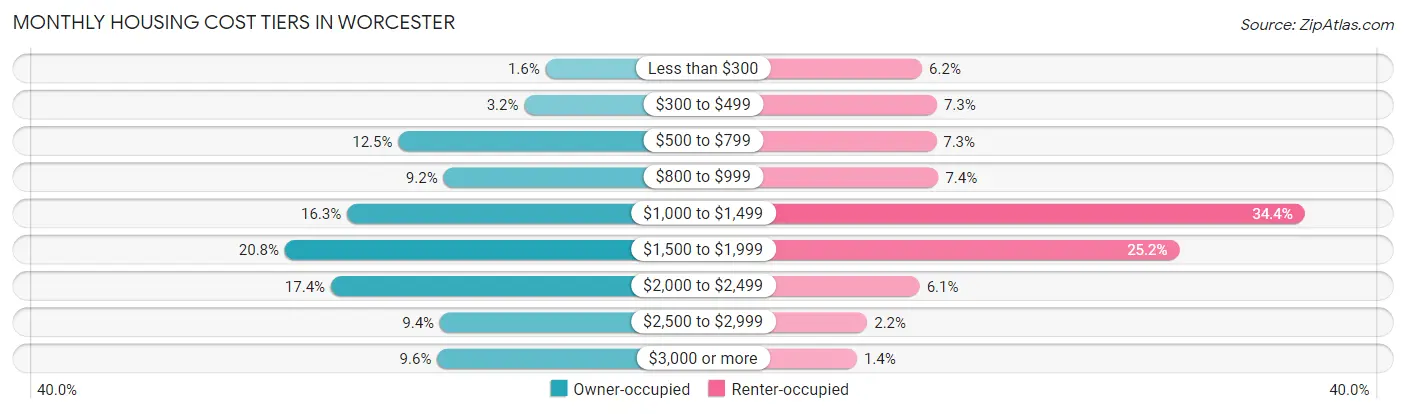
| Monthly Cost | Owner-occupied | Renter-occupied |
| Less than $300 | 543 (1.6%) | 2,854 (6.2%) |
| $300 to $499 | 1,064 (3.2%) | 3,350 (7.3%) |
| $500 to $799 | 4,149 (12.5%) | 3,330 (7.3%) |
| $800 to $999 | 3,042 (9.1%) | 3,402 (7.4%) |
| $1,000 to $1,499 | 5,405 (16.3%) | 15,728 (34.4%) |
| $1,500 to $1,999 | 6,928 (20.8%) | 11,509 (25.2%) |
| $2,000 to $2,499 | 5,800 (17.4%) | 2,769 (6.1%) |
| $2,500 to $2,999 | 3,128 (9.4%) | 1,007 (2.2%) |
| $3,000 or more | 3,194 (9.6%) | 659 (1.4%) |
| Total | 33,253 (100.0%) | 45,724 (100.0%) |
Physical Housing Characteristics in Worcester
Housing Structures in Worcester
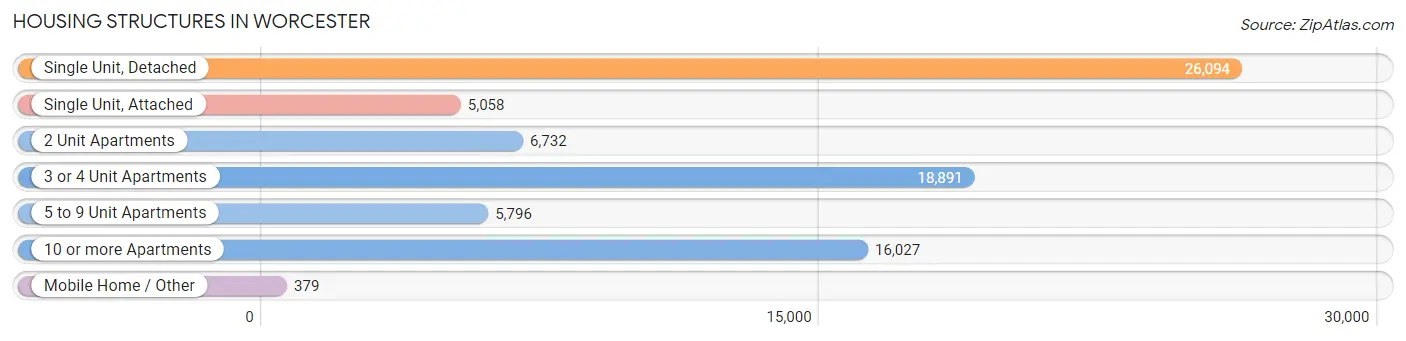
| Structure Type | # Housing Units | % Housing Units |
| Single Unit, Detached | 26,094 | 33.0% |
| Single Unit, Attached | 5,058 | 6.4% |
| 2 Unit Apartments | 6,732 | 8.5% |
| 3 or 4 Unit Apartments | 18,891 | 23.9% |
| 5 to 9 Unit Apartments | 5,796 | 7.3% |
| 10 or more Apartments | 16,027 | 20.3% |
| Mobile Home / Other | 379 | 0.5% |
| Total | 78,977 | 100.0% |
Housing Structures by Occupancy in Worcester
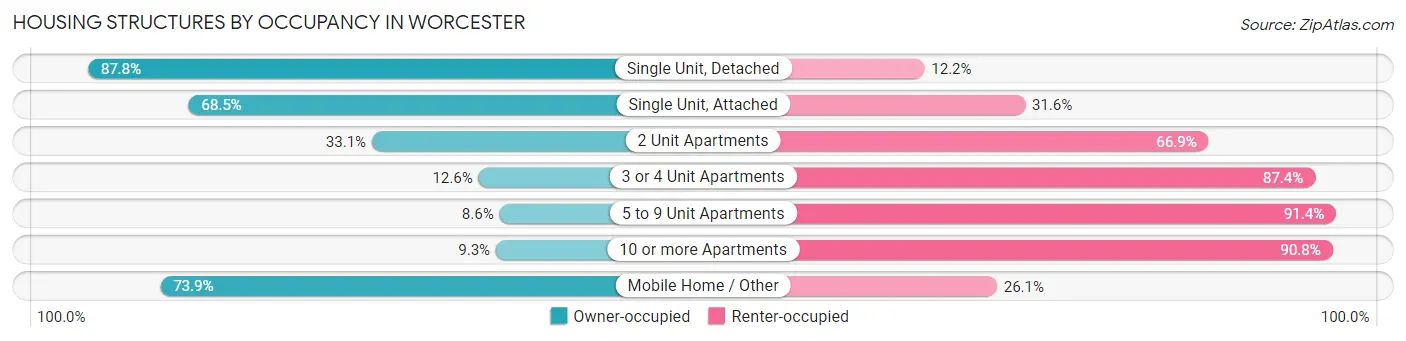
| Structure Type | Owner-occupied | Renter-occupied |
| Single Unit, Detached | 22,919 (87.8%) | 3,175 (12.2%) |
| Single Unit, Attached | 3,462 (68.4%) | 1,596 (31.6%) |
| 2 Unit Apartments | 2,230 (33.1%) | 4,502 (66.9%) |
| 3 or 4 Unit Apartments | 2,383 (12.6%) | 16,508 (87.4%) |
| 5 to 9 Unit Apartments | 497 (8.6%) | 5,299 (91.4%) |
| 10 or more Apartments | 1,482 (9.2%) | 14,545 (90.7%) |
| Mobile Home / Other | 280 (73.9%) | 99 (26.1%) |
| Total | 33,253 (42.1%) | 45,724 (57.9%) |
Housing Structures by Number of Rooms in Worcester
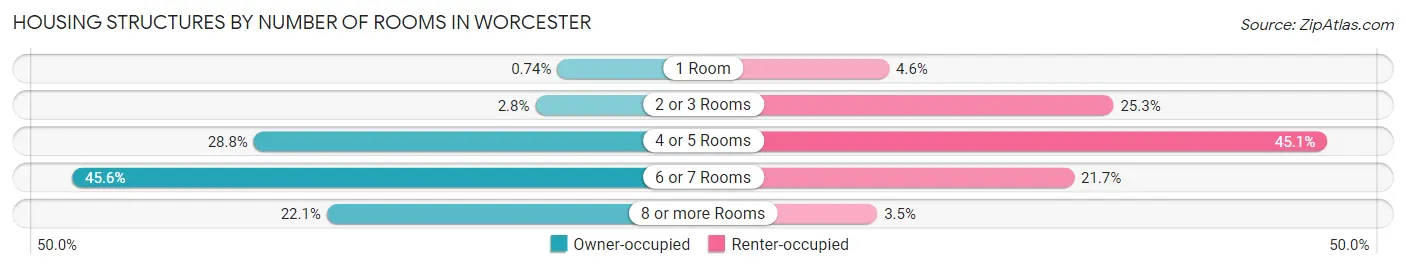
| Number of Rooms | Owner-occupied | Renter-occupied |
| 1 Room | 247 (0.7%) | 2,081 (4.5%) |
| 2 or 3 Rooms | 922 (2.8%) | 11,569 (25.3%) |
| 4 or 5 Rooms | 9,580 (28.8%) | 20,600 (45.1%) |
| 6 or 7 Rooms | 15,167 (45.6%) | 9,898 (21.6%) |
| 8 or more Rooms | 7,337 (22.1%) | 1,576 (3.5%) |
| Total | 33,253 (100.0%) | 45,724 (100.0%) |
Housing Structure by Heating Type in Worcester
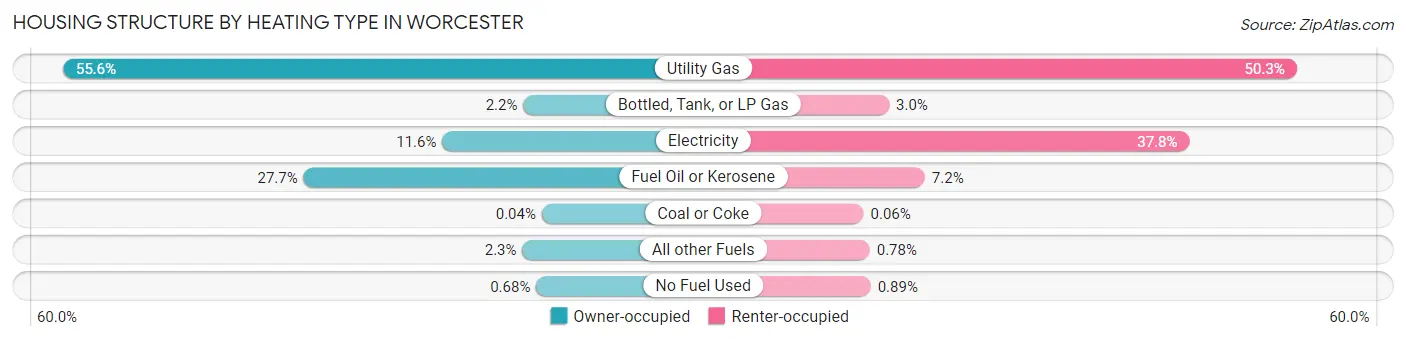
| Heating Type | Owner-occupied | Renter-occupied |
| Utility Gas | 18,480 (55.6%) | 22,985 (50.3%) |
| Bottled, Tank, or LP Gas | 725 (2.2%) | 1,379 (3.0%) |
| Electricity | 3,849 (11.6%) | 17,296 (37.8%) |
| Fuel Oil or Kerosene | 9,198 (27.7%) | 3,278 (7.2%) |
| Coal or Coke | 14 (0.0%) | 26 (0.1%) |
| All other Fuels | 762 (2.3%) | 355 (0.8%) |
| No Fuel Used | 225 (0.7%) | 405 (0.9%) |
| Total | 33,253 (100.0%) | 45,724 (100.0%) |
Household Vehicle Usage in Worcester
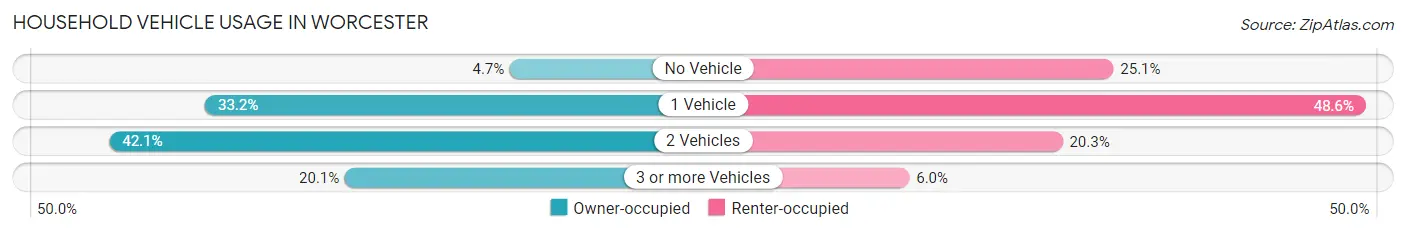
| Vehicles per Household | Owner-occupied | Renter-occupied |
| No Vehicle | 1,555 (4.7%) | 11,457 (25.1%) |
| 1 Vehicle | 11,024 (33.2%) | 22,233 (48.6%) |
| 2 Vehicles | 13,996 (42.1%) | 9,288 (20.3%) |
| 3 or more Vehicles | 6,678 (20.1%) | 2,746 (6.0%) |
| Total | 33,253 (100.0%) | 45,724 (100.0%) |
Real Estate & Mortgages in Worcester
Real Estate and Mortgage Overview in Worcester
| Characteristic | Without Mortgage | With Mortgage |
| Housing Units | 10,924 | 22,329 |
| Median Property Value | $289,800 | $314,300 |
| Median Household Income | $78,790 | $6,832 |
| Monthly Housing Costs | $803 | $3,145 |
| Real Estate Taxes | $4,267 | $300 |
Property Value by Mortgage Status in Worcester
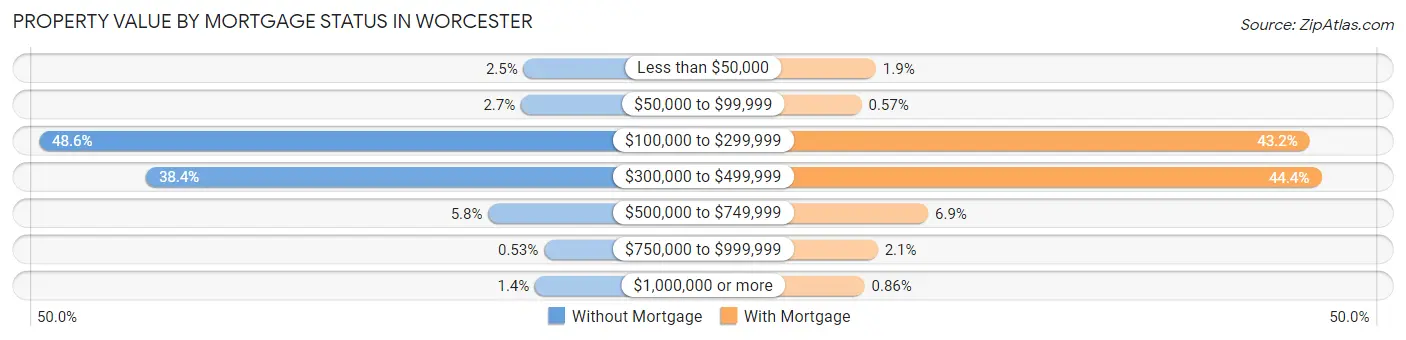
| Property Value | Without Mortgage | With Mortgage |
| Less than $50,000 | 271 (2.5%) | 434 (1.9%) |
| $50,000 to $99,999 | 297 (2.7%) | 128 (0.6%) |
| $100,000 to $299,999 | 5,310 (48.6%) | 9,656 (43.2%) |
| $300,000 to $499,999 | 4,199 (38.4%) | 9,903 (44.4%) |
| $500,000 to $749,999 | 638 (5.8%) | 1,543 (6.9%) |
| $750,000 to $999,999 | 58 (0.5%) | 472 (2.1%) |
| $1,000,000 or more | 151 (1.4%) | 193 (0.9%) |
| Total | 10,924 (100.0%) | 22,329 (100.0%) |
Household Income by Mortgage Status in Worcester
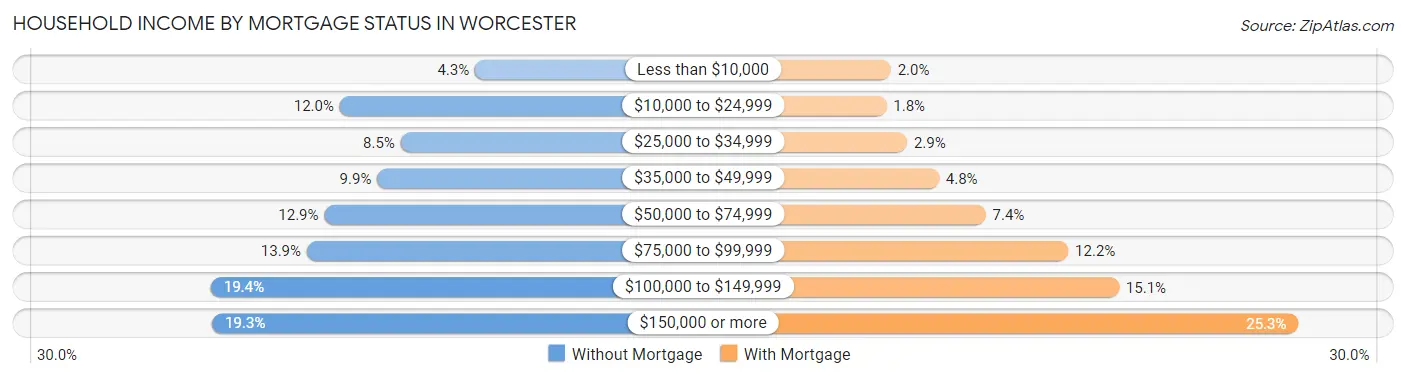
| Household Income | Without Mortgage | With Mortgage |
| Less than $10,000 | 465 (4.3%) | 448 (2.0%) |
| $10,000 to $24,999 | 1,310 (12.0%) | 394 (1.8%) |
| $25,000 to $34,999 | 930 (8.5%) | 656 (2.9%) |
| $35,000 to $49,999 | 1,076 (9.9%) | 1,063 (4.8%) |
| $50,000 to $74,999 | 1,406 (12.9%) | 1,660 (7.4%) |
| $75,000 to $99,999 | 1,515 (13.9%) | 2,714 (12.1%) |
| $100,000 to $149,999 | 2,115 (19.4%) | 3,361 (15.0%) |
| $150,000 or more | 2,107 (19.3%) | 5,649 (25.3%) |
| Total | 10,924 (100.0%) | 22,329 (100.0%) |
Property Value to Household Income Ratio in Worcester
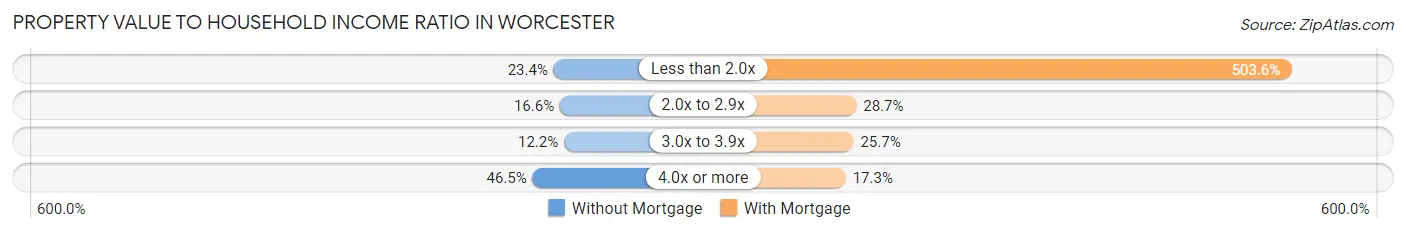
| Value-to-Income Ratio | Without Mortgage | With Mortgage |
| Less than 2.0x | 2,558 (23.4%) | 112,449 (503.6%) |
| 2.0x to 2.9x | 1,816 (16.6%) | 6,409 (28.7%) |
| 3.0x to 3.9x | 1,334 (12.2%) | 5,731 (25.7%) |
| 4.0x or more | 5,076 (46.5%) | 3,855 (17.3%) |
| Total | 10,924 (100.0%) | 22,329 (100.0%) |
Real Estate Taxes by Mortgage Status in Worcester
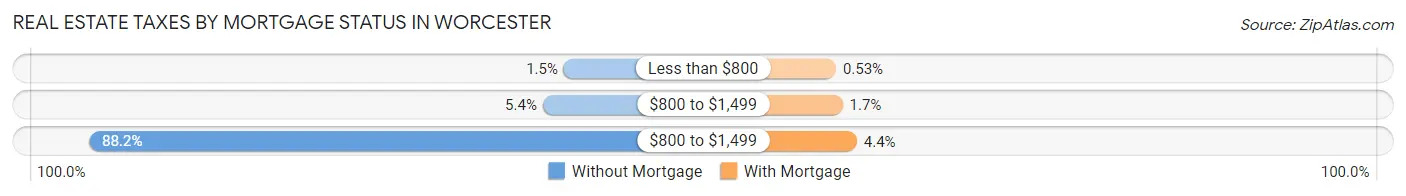
| Property Taxes | Without Mortgage | With Mortgage |
| Less than $800 | 166 (1.5%) | 119 (0.5%) |
| $800 to $1,499 | 586 (5.4%) | 388 (1.7%) |
| $800 to $1,499 | 9,638 (88.2%) | 972 (4.3%) |
| Total | 10,924 (100.0%) | 22,329 (100.0%) |
Health & Disability in Worcester
Health Insurance Coverage by Age in Worcester
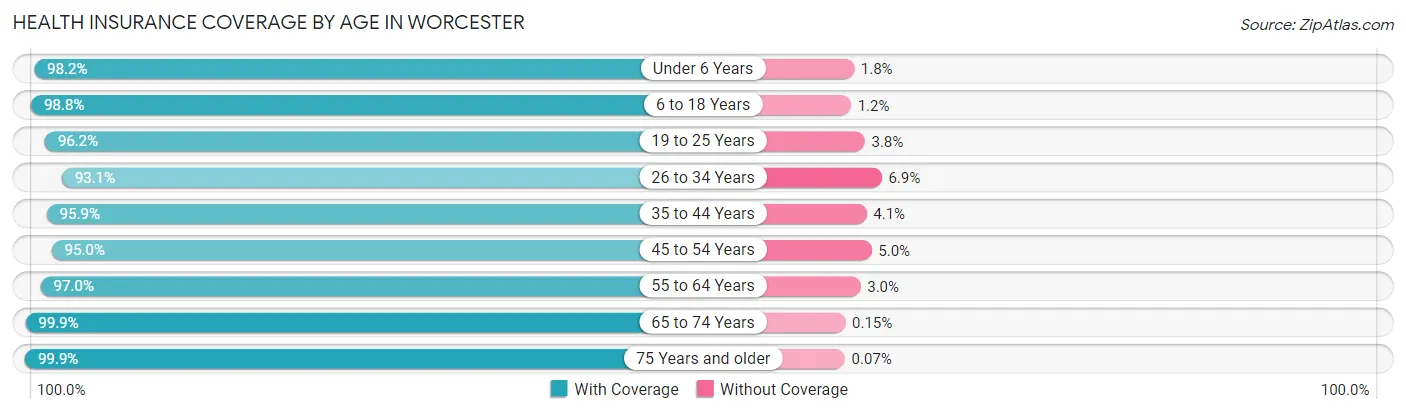
| Age Bracket | With Coverage | Without Coverage |
| Under 6 Years | 12,193 (98.2%) | 221 (1.8%) |
| 6 to 18 Years | 30,605 (98.8%) | 372 (1.2%) |
| 19 to 25 Years | 29,453 (96.2%) | 1,157 (3.8%) |
| 26 to 34 Years | 27,731 (93.1%) | 2,065 (6.9%) |
| 35 to 44 Years | 24,563 (95.9%) | 1,054 (4.1%) |
| 45 to 54 Years | 21,722 (95.0%) | 1,153 (5.0%) |
| 55 to 64 Years | 23,382 (97.0%) | 719 (3.0%) |
| 65 to 74 Years | 15,403 (99.9%) | 23 (0.2%) |
| 75 Years and older | 10,182 (99.9%) | 7 (0.1%) |
| Total | 195,234 (96.7%) | 6,771 (3.4%) |
Health Insurance Coverage by Citizenship Status in Worcester
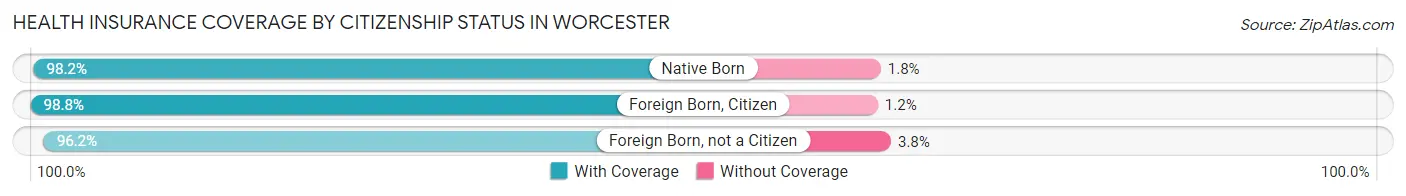
| Citizenship Status | With Coverage | Without Coverage |
| Native Born | 12,193 (98.2%) | 221 (1.8%) |
| Foreign Born, Citizen | 30,605 (98.8%) | 372 (1.2%) |
| Foreign Born, not a Citizen | 29,453 (96.2%) | 1,157 (3.8%) |
Health Insurance Coverage by Household Income in Worcester
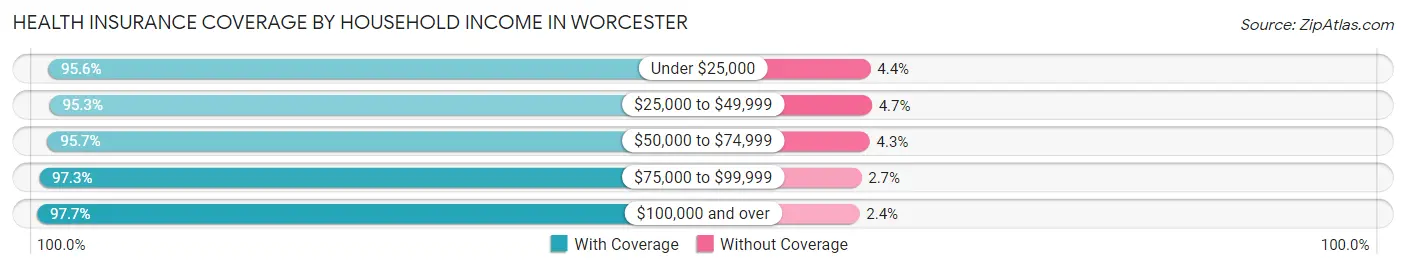
| Household Income | With Coverage | Without Coverage |
| Under $25,000 | 30,661 (95.6%) | 1,413 (4.4%) |
| $25,000 to $49,999 | 31,585 (95.3%) | 1,548 (4.7%) |
| $50,000 to $74,999 | 27,109 (95.7%) | 1,209 (4.3%) |
| $75,000 to $99,999 | 23,784 (97.3%) | 663 (2.7%) |
| $100,000 and over | 70,562 (97.7%) | 1,695 (2.4%) |
Public vs Private Health Insurance Coverage by Age in Worcester
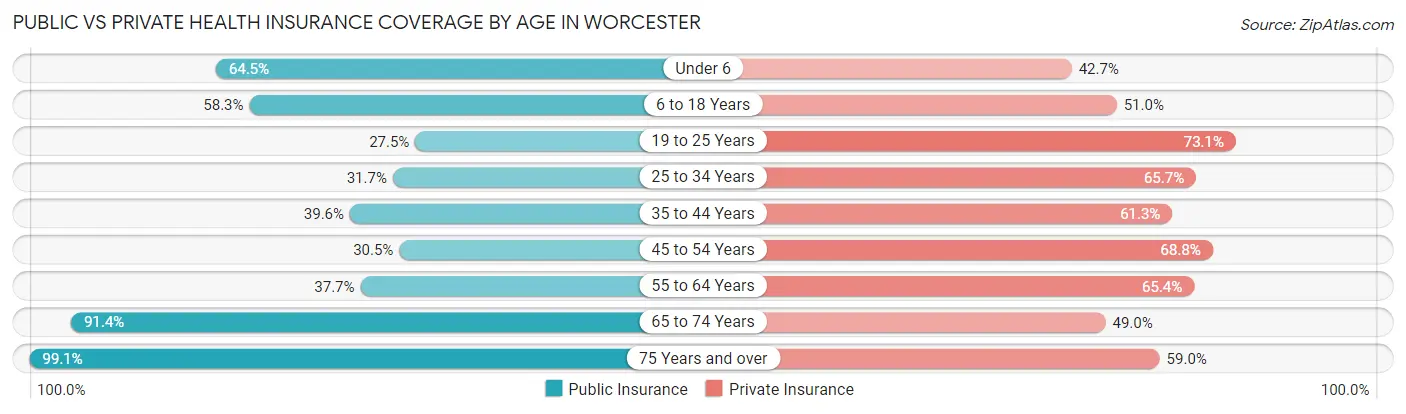
| Age Bracket | Public Insurance | Private Insurance |
| Under 6 | 8,006 (64.5%) | 5,297 (42.7%) |
| 6 to 18 Years | 18,053 (58.3%) | 15,807 (51.0%) |
| 19 to 25 Years | 8,418 (27.5%) | 22,381 (73.1%) |
| 25 to 34 Years | 9,435 (31.7%) | 19,587 (65.7%) |
| 35 to 44 Years | 10,153 (39.6%) | 15,708 (61.3%) |
| 45 to 54 Years | 6,970 (30.5%) | 15,746 (68.8%) |
| 55 to 64 Years | 9,082 (37.7%) | 15,759 (65.4%) |
| 65 to 74 Years | 14,098 (91.4%) | 7,552 (49.0%) |
| 75 Years and over | 10,098 (99.1%) | 6,012 (59.0%) |
| Total | 94,313 (46.7%) | 123,849 (61.3%) |
Disability Status by Sex by Age in Worcester
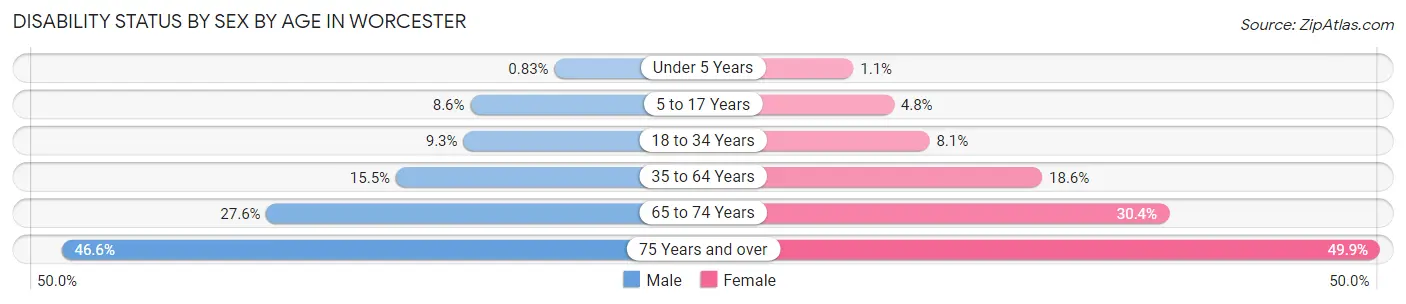
| Age Bracket | Male | Female |
| Under 5 Years | 49 (0.8%) | 54 (1.1%) |
| 5 to 17 Years | 1,309 (8.6%) | 660 (4.8%) |
| 18 to 34 Years | 3,025 (9.3%) | 2,557 (8.1%) |
| 35 to 64 Years | 5,669 (15.5%) | 6,713 (18.6%) |
| 65 to 74 Years | 1,847 (27.6%) | 2,648 (30.3%) |
| 75 Years and over | 1,804 (46.6%) | 3,154 (49.9%) |
Disability Class by Sex by Age in Worcester
Disability Class: Hearing Difficulty
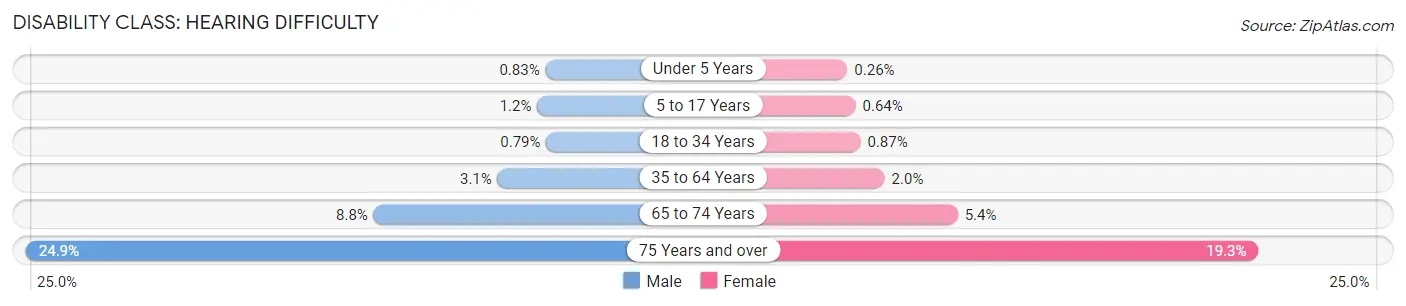
| Age Bracket | Male | Female |
| Under 5 Years | 49 (0.8%) | 13 (0.3%) |
| 5 to 17 Years | 183 (1.2%) | 88 (0.6%) |
| 18 to 34 Years | 256 (0.8%) | 272 (0.9%) |
| 35 to 64 Years | 1,111 (3.0%) | 718 (2.0%) |
| 65 to 74 Years | 590 (8.8%) | 469 (5.4%) |
| 75 Years and over | 966 (24.9%) | 1,221 (19.3%) |
Disability Class: Vision Difficulty
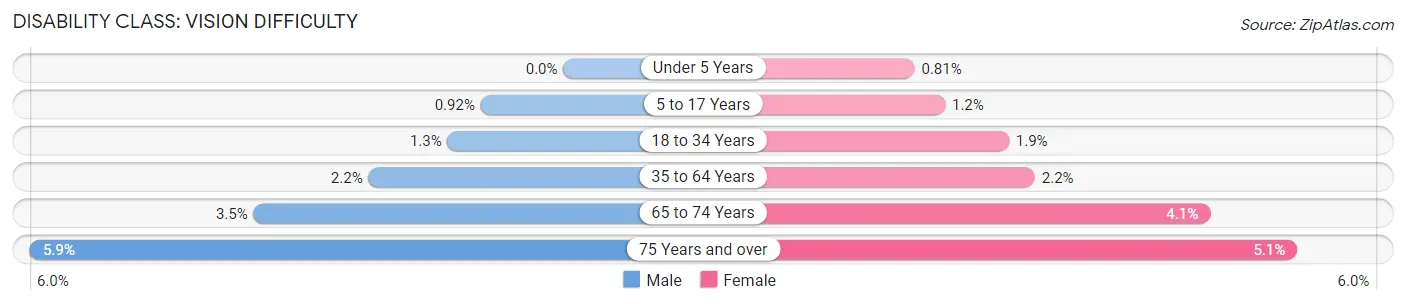
| Age Bracket | Male | Female |
| Under 5 Years | 0 (0.0%) | 41 (0.8%) |
| 5 to 17 Years | 139 (0.9%) | 157 (1.1%) |
| 18 to 34 Years | 420 (1.3%) | 585 (1.9%) |
| 35 to 64 Years | 792 (2.2%) | 778 (2.1%) |
| 65 to 74 Years | 231 (3.5%) | 358 (4.1%) |
| 75 Years and over | 230 (5.9%) | 320 (5.1%) |
Disability Class: Cognitive Difficulty
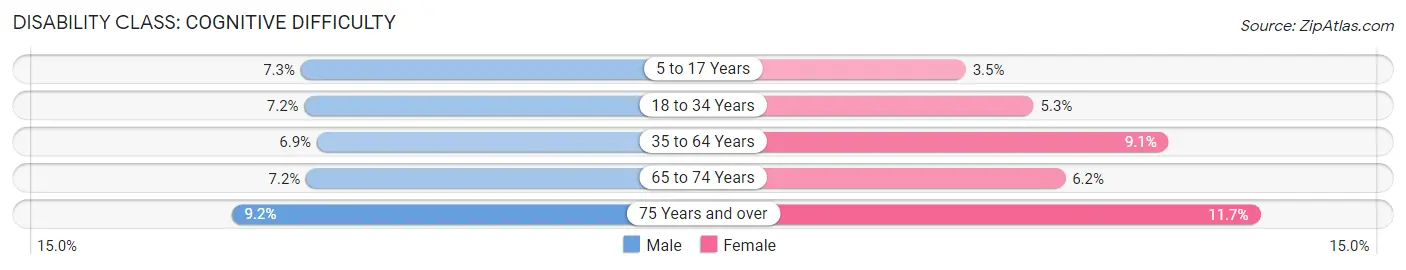
| Age Bracket | Male | Female |
| 5 to 17 Years | 1,108 (7.3%) | 472 (3.5%) |
| 18 to 34 Years | 2,350 (7.2%) | 1,677 (5.3%) |
| 35 to 64 Years | 2,502 (6.9%) | 3,286 (9.1%) |
| 65 to 74 Years | 480 (7.2%) | 543 (6.2%) |
| 75 Years and over | 358 (9.2%) | 736 (11.7%) |
Disability Class: Ambulatory Difficulty
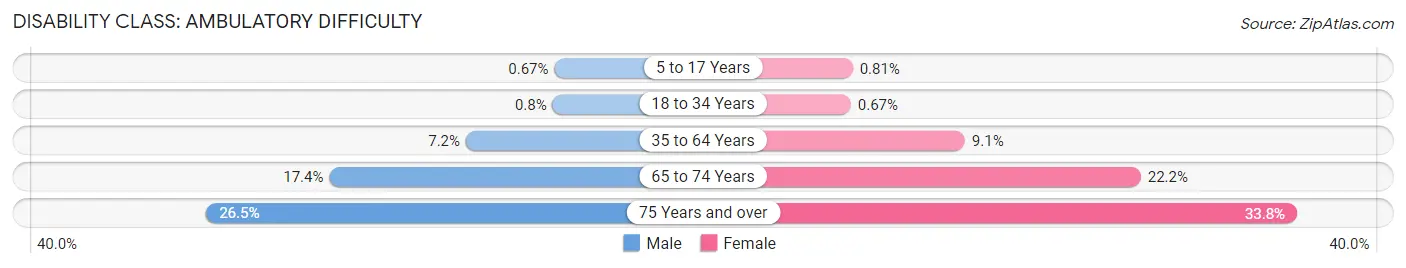
| Age Bracket | Male | Female |
| 5 to 17 Years | 102 (0.7%) | 111 (0.8%) |
| 18 to 34 Years | 260 (0.8%) | 212 (0.7%) |
| 35 to 64 Years | 2,641 (7.2%) | 3,302 (9.1%) |
| 65 to 74 Years | 1,165 (17.4%) | 1,937 (22.2%) |
| 75 Years and over | 1,027 (26.5%) | 2,134 (33.8%) |
Disability Class: Self-Care Difficulty
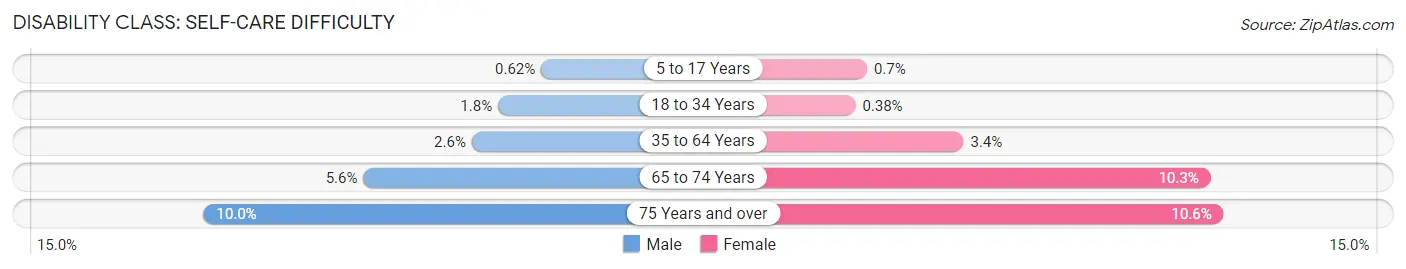
| Age Bracket | Male | Female |
| 5 to 17 Years | 94 (0.6%) | 96 (0.7%) |
| 18 to 34 Years | 594 (1.8%) | 118 (0.4%) |
| 35 to 64 Years | 931 (2.5%) | 1,225 (3.4%) |
| 65 to 74 Years | 373 (5.6%) | 896 (10.3%) |
| 75 Years and over | 388 (10.0%) | 671 (10.6%) |
Technology Access in Worcester
Computing Device Access in Worcester
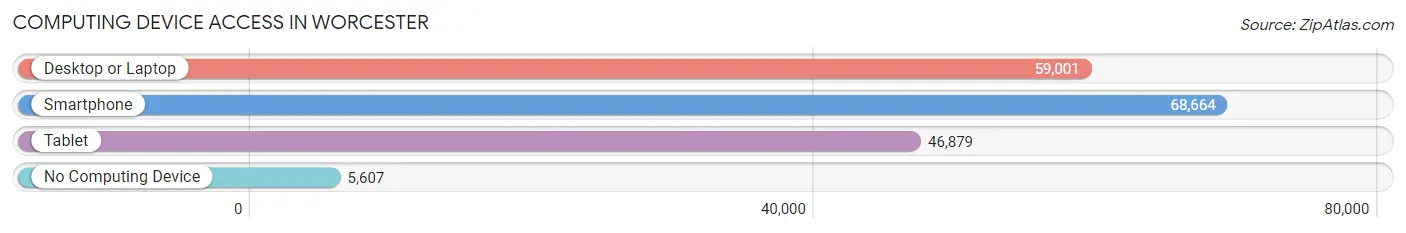
| Device Type | # Households | % Households |
| Desktop or Laptop | 59,001 | 74.7% |
| Smartphone | 68,664 | 86.9% |
| Tablet | 46,879 | 59.4% |
| No Computing Device | 5,607 | 7.1% |
| Total | 78,977 | 100.0% |
Internet Access in Worcester
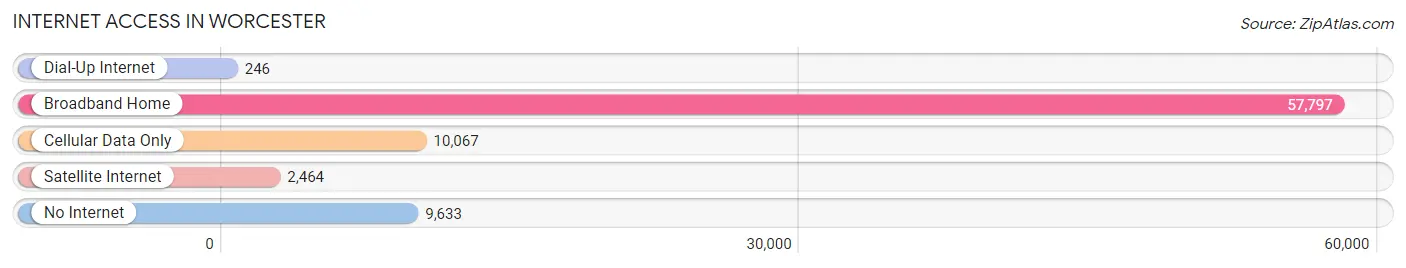
| Internet Type | # Households | % Households |
| Dial-Up Internet | 246 | 0.3% |
| Broadband Home | 57,797 | 73.2% |
| Cellular Data Only | 10,067 | 12.8% |
| Satellite Internet | 2,464 | 3.1% |
| No Internet | 9,633 | 12.2% |
| Total | 78,977 | 100.0% |
Worcester Summary
Worcester, Massachusetts is the second largest city in New England and the third largest city in the state. It is located in the heart of the Commonwealth, about 40 miles west of Boston. Worcester is a vibrant city with a rich history, diverse geography, and a strong economy.
History
Worcester was first settled in 1673 by a group of English settlers led by John Eliot. The city was officially incorporated in 1722 and was named after Worcester, England. During the Revolutionary War, Worcester was a major center of activity and was the site of the first battle of the war. In the 19th century, Worcester became an important industrial center, with the first commercial railroad in the United States running through the city. The city was also home to the first public library in the United States.
In the 20th century, Worcester experienced a period of decline as the city’s manufacturing base declined. However, in the late 20th century, the city began to experience a resurgence as it became a center for education, healthcare, and technology. Today, Worcester is a vibrant city with a diverse economy and a strong sense of community.
Geography
Worcester is located in central Massachusetts, about 40 miles west of Boston. The city is situated on the Blackstone River and is surrounded by several hills and mountains. Worcester is located in the Connecticut River Valley, which is known for its fertile soil and abundant natural resources. The city is also home to several lakes, including Lake Quinsigamond and Lake Quaboag.
The city has a total area of 38.6 square miles, of which 37.2 square miles is land and 1.4 square miles is water. Worcester is located in a humid continental climate zone, with hot, humid summers and cold, snowy winters.
Economy
Worcester has a diverse economy that is driven by education, healthcare, and technology. The city is home to several major employers, including the University of Massachusetts Medical School, UMass Memorial Health Care, and the Hanover Insurance Group. Worcester is also home to several major corporations, including the Worcester Polytechnic Institute, the Worcester Business Development Corporation, and the Worcester Regional Chamber of Commerce.
The city’s economy is also supported by a strong tourism industry. Worcester is home to several popular attractions, including the Worcester Art Museum, the EcoTarium, and the Worcester Historical Museum.
Demographics
As of the 2010 census, Worcester had a population of 181,045. The city is racially and ethnically diverse, with the largest racial group being White (63.2%), followed by Black or African American (17.2%), Hispanic or Latino (14.2%), and Asian (4.3%). The city is also home to a large immigrant population, with over 20% of the population being foreign-born.
Worcester is also home to a large number of college students, with over 20,000 students enrolled in the city’s colleges and universities. The city is also home to a large number of young professionals, with over 30% of the population between the ages of 25 and 44.
Conclusion
Worcester, Massachusetts is a vibrant city with a rich history, diverse geography, and a strong economy. The city is home to several major employers, including the University of Massachusetts Medical School, UMass Memorial Health Care, and the Hanover Insurance Group. The city is also home to a diverse population, with the largest racial group being White (63.2%), followed by Black or African American (17.2%), Hispanic or Latino (14.2%), and Asian (4.3%). Worcester is also home to a large number of college students and young professionals, making it a great place to live and work.
Common Questions
What is Per Capita Income in Worcester?
Per Capita income in Worcester is $33,592.
What is the Median Family Income in Worcester?
Median Family Income in Worcester is $76,920.
What is the Median Household income in Worcester?
Median Household Income in Worcester is $63,011.
What is Income or Wage Gap in Worcester?
Income or Wage Gap in Worcester is 24.1%.
Women in Worcester earn 75.9 cents for every dollar earned by a man.
What is Family Income Deficit in Worcester?
Family Income Deficit in Worcester is $10,935.
Families that are below poverty line in Worcester earn $10,935 less on average than the poverty threshold level.
What is Inequality or Gini Index in Worcester?
Inequality or Gini Index in Worcester is 0.48.
What is the Total Population of Worcester?
Total Population of Worcester is 204,191.
What is the Total Male Population of Worcester?
Total Male Population of Worcester is 101,667.
What is the Total Female Population of Worcester?
Total Female Population of Worcester is 102,524.
What is the Ratio of Males per 100 Females in Worcester?
There are 99.16 Males per 100 Females in Worcester.
What is the Ratio of Females per 100 Males in Worcester?
There are 100.84 Females per 100 Males in Worcester.
What is the Median Population Age in Worcester?
Median Population Age in Worcester is 34.3 Years.
What is the Average Family Size in Worcester
Average Family Size in Worcester is 3.1 People.
What is the Average Household Size in Worcester
Average Household Size in Worcester is 2.4 People.
How Large is the Labor Force in Worcester?
There are 107,979 People in the Labor Forcein in Worcester.
What is the Percentage of People in the Labor Force in Worcester?
63.9% of People are in the Labor Force in Worcester.
What is the Unemployment Rate in Worcester?
Unemployment Rate in Worcester is 6.6%.