Cordaville, MA Map & Demographics
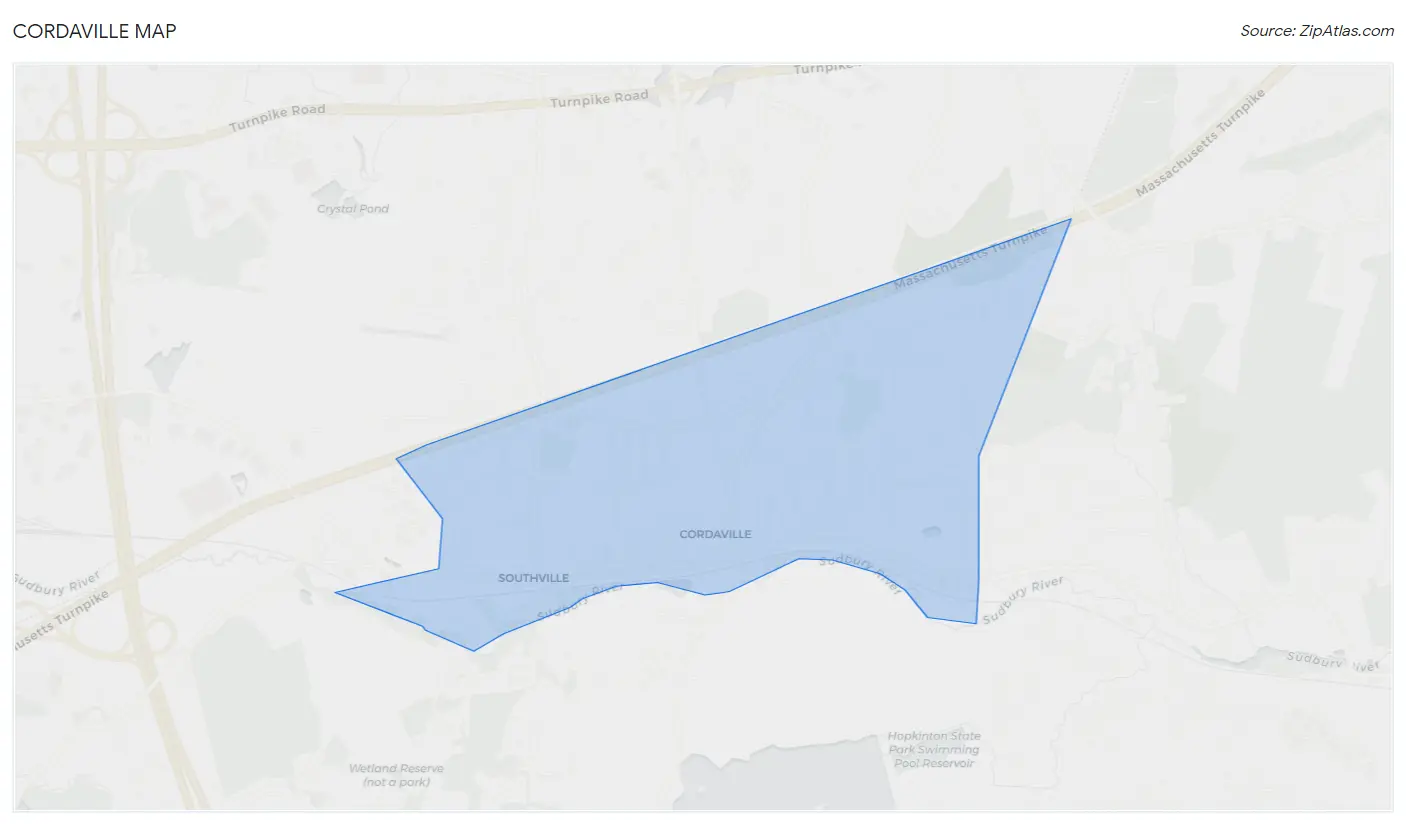
Cordaville Map
Cordaville Overview
$69,272
PER CAPITA INCOME
$218,362
AVG FAMILY INCOME
$190,170
AVG HOUSEHOLD INCOME
54.7%
WAGE / INCOME GAP [ % ]
45.3¢/ $1
WAGE / INCOME GAP [ $ ]
0.36
INEQUALITY / GINI INDEX
2,884
TOTAL POPULATION
1,326
MALE POPULATION
1,558
FEMALE POPULATION
85.11
MALES / 100 FEMALES
117.50
FEMALES / 100 MALES
39.0
MEDIAN AGE
3.4
AVG FAMILY SIZE
3.0
AVG HOUSEHOLD SIZE
1,674
LABOR FORCE [ PEOPLE ]
78.8%
PERCENT IN LABOR FORCE
2.7%
UNEMPLOYMENT RATE
Income in Cordaville
Income Overview in Cordaville
Per Capita Income in Cordaville is $69,272, while median incomes of families and households are $218,362 and $190,170 respectively.
| Characteristic | Number | Measure |
| Per Capita Income | 2,884 | $69,272 |
| Median Family Income | 782 | $218,362 |
| Mean Family Income | 782 | $231,867 |
| Median Household Income | 955 | $190,170 |
| Mean Household Income | 955 | $206,213 |
| Income Deficit | 782 | $0 |
| Wage / Income Gap (%) | 2,884 | 54.73% |
| Wage / Income Gap ($) | 2,884 | 45.27¢ per $1 |
| Gini / Inequality Index | 2,884 | 0.36 |
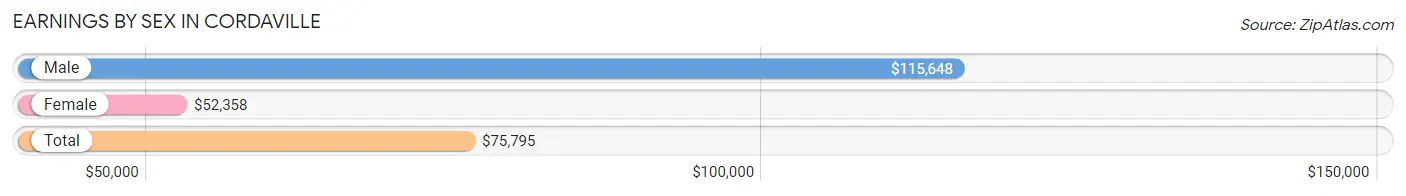
Earnings by Sex in Cordaville
Average Earnings in Cordaville are $75,795, $115,648 for men and $52,358 for women, a difference of 54.7%.
| Sex | Number | Average Earnings |
| Male | 924 (51.9%) | $115,648 |
| Female | 855 (48.1%) | $52,358 |
| Total | 1,779 (100.0%) | $75,795 |
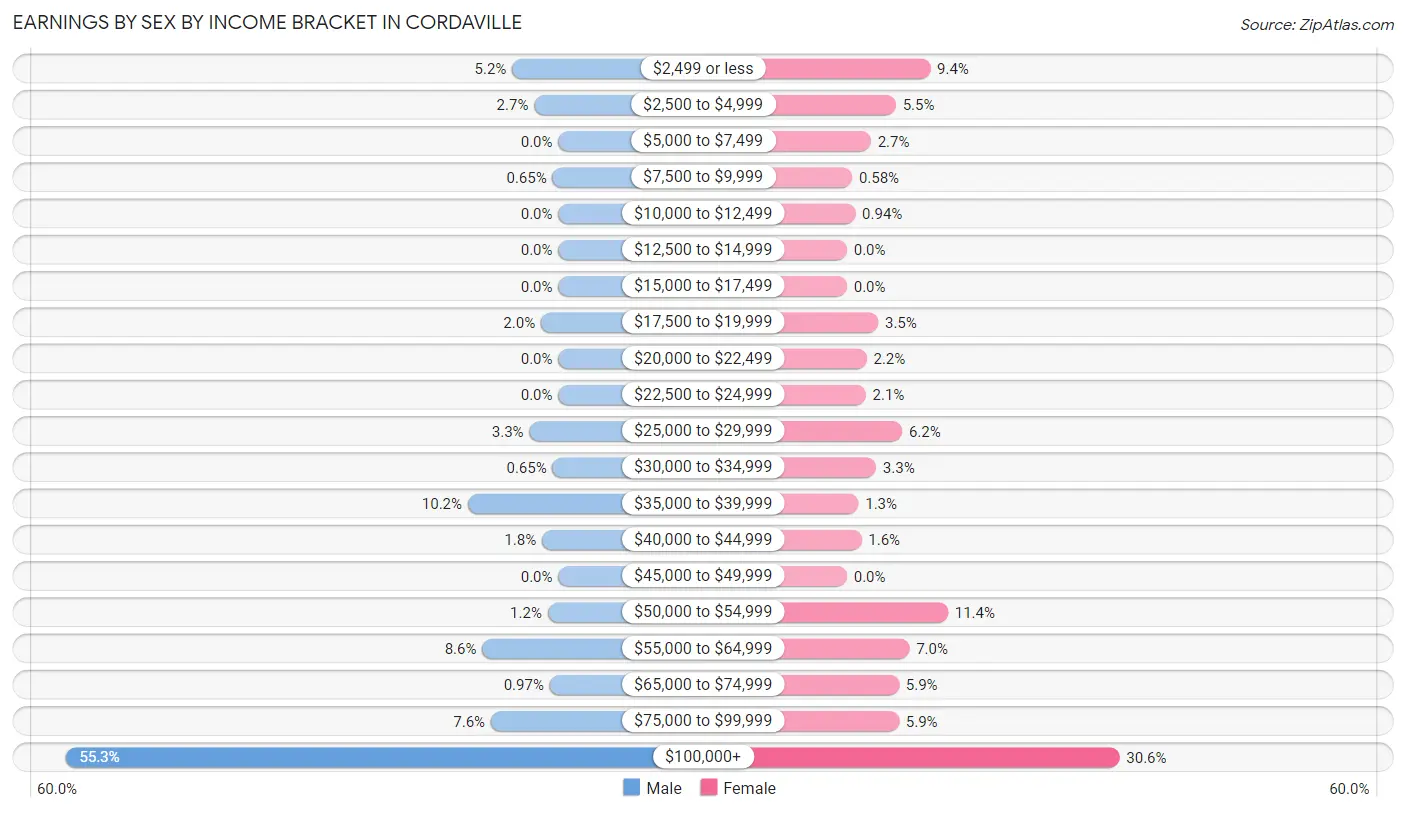
Earnings by Sex by Income Bracket in Cordaville
The most common earnings brackets in Cordaville are $100,000+ for men (511 | 55.3%) and $100,000+ for women (262 | 30.6%).
| Income | Male | Female |
| $2,499 or less | 48 (5.2%) | 80 (9.4%) |
| $2,500 to $4,999 | 25 (2.7%) | 47 (5.5%) |
| $5,000 to $7,499 | 0 (0.0%) | 23 (2.7%) |
| $7,500 to $9,999 | 6 (0.6%) | 5 (0.6%) |
| $10,000 to $12,499 | 0 (0.0%) | 8 (0.9%) |
| $12,500 to $14,999 | 0 (0.0%) | 0 (0.0%) |
| $15,000 to $17,499 | 0 (0.0%) | 0 (0.0%) |
| $17,500 to $19,999 | 18 (1.9%) | 30 (3.5%) |
| $20,000 to $22,499 | 0 (0.0%) | 19 (2.2%) |
| $22,500 to $24,999 | 0 (0.0%) | 18 (2.1%) |
| $25,000 to $29,999 | 30 (3.3%) | 53 (6.2%) |
| $30,000 to $34,999 | 6 (0.6%) | 28 (3.3%) |
| $35,000 to $39,999 | 94 (10.2%) | 11 (1.3%) |
| $40,000 to $44,999 | 17 (1.8%) | 14 (1.6%) |
| $45,000 to $49,999 | 0 (0.0%) | 0 (0.0%) |
| $50,000 to $54,999 | 11 (1.2%) | 97 (11.4%) |
| $55,000 to $64,999 | 79 (8.6%) | 60 (7.0%) |
| $65,000 to $74,999 | 9 (1.0%) | 50 (5.9%) |
| $75,000 to $99,999 | 70 (7.6%) | 50 (5.9%) |
| $100,000+ | 511 (55.3%) | 262 (30.6%) |
| Total | 924 (100.0%) | 855 (100.0%) |
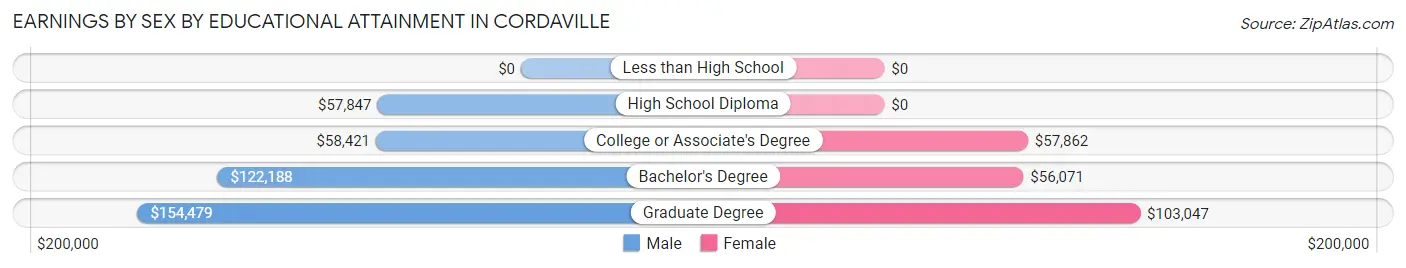
Earnings by Sex by Educational Attainment in Cordaville
Average earnings in Cordaville are $118,942 for men and $68,417 for women, a difference of 42.5%. Men with an educational attainment of graduate degree enjoy the highest average annual earnings of $154,479, while those with high school diploma education earn the least with $57,847. Women with an educational attainment of graduate degree earn the most with the average annual earnings of $103,047, while those with bachelor's degree education have the smallest earnings of $56,071.
| Educational Attainment | Male Income | Female Income |
| Less than High School | - | - |
| High School Diploma | $57,847 | $0 |
| College or Associate's Degree | $58,421 | $57,862 |
| Bachelor's Degree | $122,188 | $56,071 |
| Graduate Degree | $154,479 | $103,047 |
| Total | $118,942 | $68,417 |
Family Income in Cordaville
Family Income Brackets in Cordaville
According to the Cordaville family income data, there are 413 families falling into the $200,000+ income range, which is the most common income bracket and makes up 52.8% of all families.
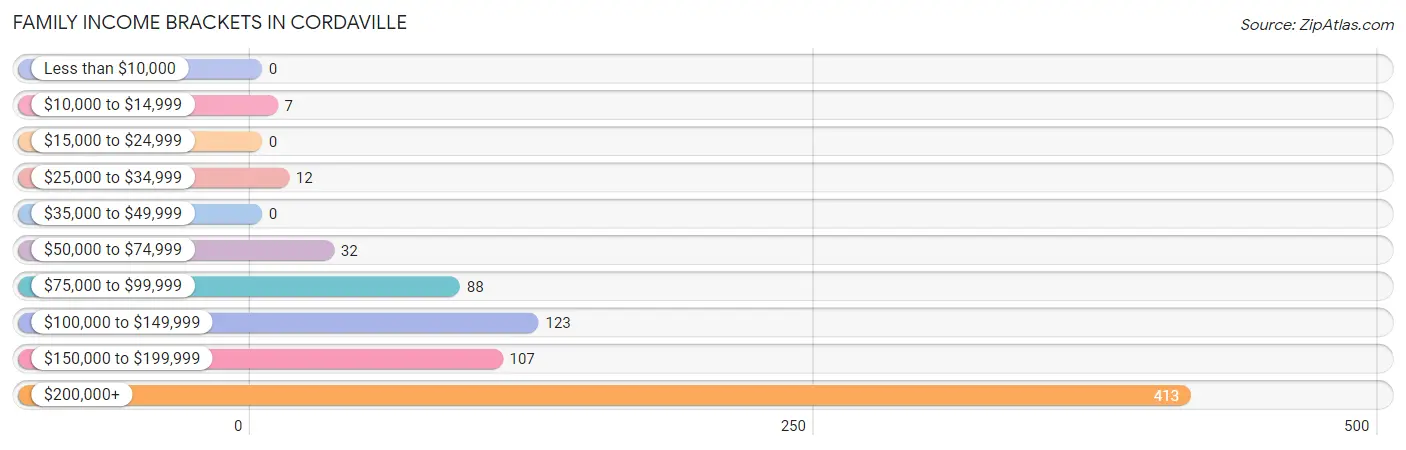
| Income Bracket | # Families | % Families |
| Less than $10,000 | 0 | 0.0% |
| $10,000 to $14,999 | 7 | 0.9% |
| $15,000 to $24,999 | 0 | 0.0% |
| $25,000 to $34,999 | 12 | 1.5% |
| $35,000 to $49,999 | 0 | 0.0% |
| $50,000 to $74,999 | 32 | 4.1% |
| $75,000 to $99,999 | 88 | 11.3% |
| $100,000 to $149,999 | 123 | 15.7% |
| $150,000 to $199,999 | 107 | 13.7% |
| $200,000+ | 413 | 52.8% |
Family Income by Famaliy Size in Cordaville
4-person families (311 | 39.8%) account for the highest median family income in Cordaville with $236,607 per family, while 2-person families (176 | 22.5%) have the highest median income of $92,639 per family member.
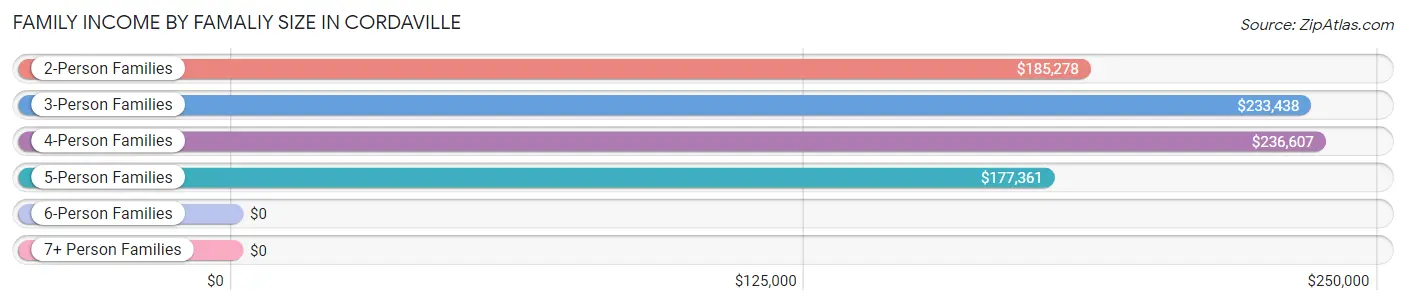
| Income Bracket | # Families | Median Income |
| 2-Person Families | 176 (22.5%) | $185,278 |
| 3-Person Families | 246 (31.5%) | $233,438 |
| 4-Person Families | 311 (39.8%) | $236,607 |
| 5-Person Families | 49 (6.3%) | $177,361 |
| 6-Person Families | 0 (0.0%) | $0 |
| 7+ Person Families | 0 (0.0%) | $0 |
| Total | 782 (100.0%) | $218,362 |
Family Income by Number of Earners in Cordaville
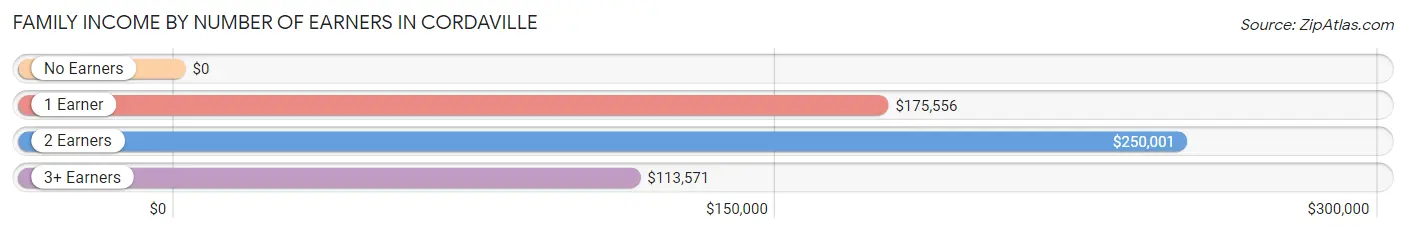
| Number of Earners | # Families | Median Income |
| No Earners | 14 (1.8%) | $0 |
| 1 Earner | 118 (15.1%) | $175,556 |
| 2 Earners | 462 (59.1%) | $250,001 |
| 3+ Earners | 188 (24.0%) | $113,571 |
| Total | 782 (100.0%) | $218,362 |
Household Income in Cordaville
Household Income Brackets in Cordaville
With 427 households falling in the category, the $200,000+ income range is the most frequent in Cordaville, accounting for 44.7% of all households.
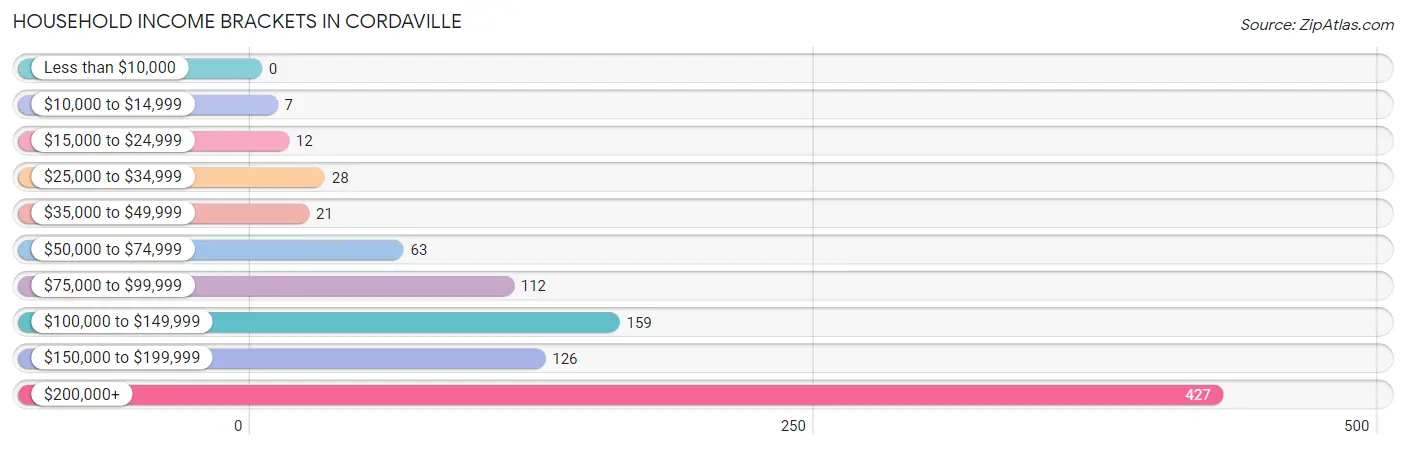
| Income Bracket | # Households | % Households |
| Less than $10,000 | 0 | 0.0% |
| $10,000 to $14,999 | 7 | 0.7% |
| $15,000 to $24,999 | 12 | 1.3% |
| $25,000 to $34,999 | 28 | 2.9% |
| $35,000 to $49,999 | 21 | 2.2% |
| $50,000 to $74,999 | 63 | 6.6% |
| $75,000 to $99,999 | 112 | 11.7% |
| $100,000 to $149,999 | 159 | 16.6% |
| $150,000 to $199,999 | 126 | 13.2% |
| $200,000+ | 427 | 44.7% |
Household Income by Householder Age in Cordaville
The median household income in Cordaville is $190,170, with the highest median household income of $220,804 found in the 45 to 64 years age bracket for the primary householder. A total of 457 households (47.8%) fall into this category.
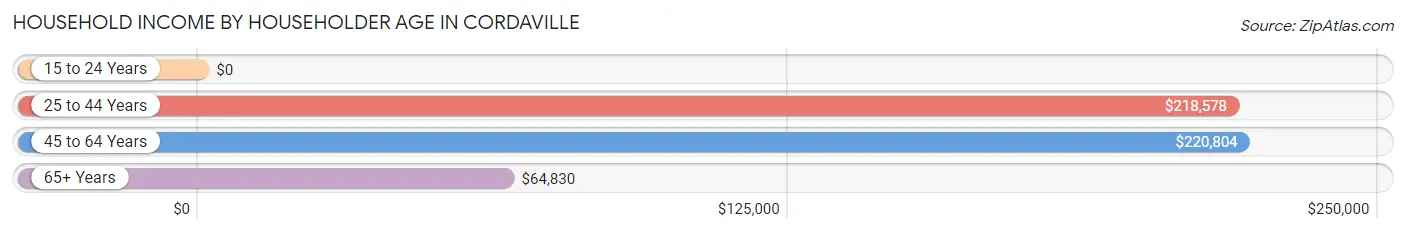
| Income Bracket | # Households | Median Income |
| 15 to 24 Years | 0 (0.0%) | $0 |
| 25 to 44 Years | 339 (35.5%) | $218,578 |
| 45 to 64 Years | 457 (47.8%) | $220,804 |
| 65+ Years | 159 (16.7%) | $64,830 |
| Total | 955 (100.0%) | $190,170 |
Poverty in Cordaville
Income Below Poverty by Sex and Age in Cordaville
With 1.2% poverty level for males and 0.7% for females among the residents of Cordaville, 75 year old and over males and 65 to 74 year old females are the most vulnerable to poverty, with 3 males (13.0%) and 11 females (23.4%) in their respective age groups living below the poverty level.
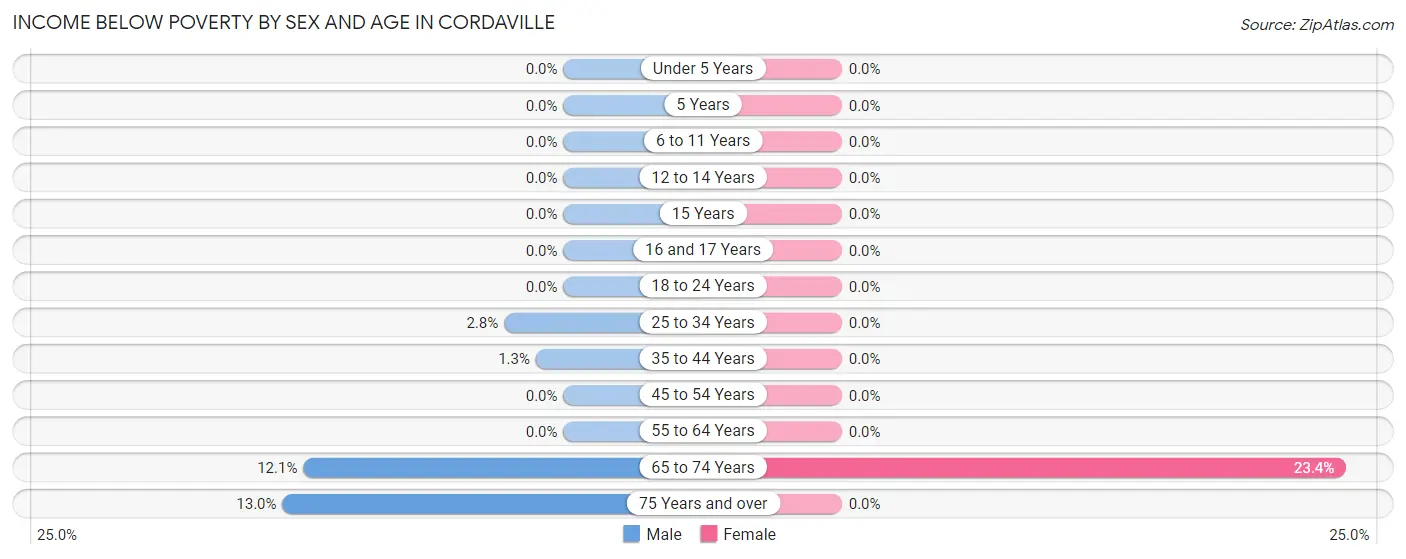
| Age Bracket | Male | Female |
| Under 5 Years | 0 (0.0%) | 0 (0.0%) |
| 5 Years | 0 (0.0%) | 0 (0.0%) |
| 6 to 11 Years | 0 (0.0%) | 0 (0.0%) |
| 12 to 14 Years | 0 (0.0%) | 0 (0.0%) |
| 15 Years | 0 (0.0%) | 0 (0.0%) |
| 16 and 17 Years | 0 (0.0%) | 0 (0.0%) |
| 18 to 24 Years | 0 (0.0%) | 0 (0.0%) |
| 25 to 34 Years | 3 (2.8%) | 0 (0.0%) |
| 35 to 44 Years | 3 (1.3%) | 0 (0.0%) |
| 45 to 54 Years | 0 (0.0%) | 0 (0.0%) |
| 55 to 64 Years | 0 (0.0%) | 0 (0.0%) |
| 65 to 74 Years | 7 (12.1%) | 11 (23.4%) |
| 75 Years and over | 3 (13.0%) | 0 (0.0%) |
| Total | 16 (1.2%) | 11 (0.7%) |
Income Above Poverty by Sex and Age in Cordaville
According to the poverty statistics in Cordaville, males aged under 5 years and females aged under 5 years are the age groups that are most secure financially, with 100.0% of males and 100.0% of females in these age groups living above the poverty line.
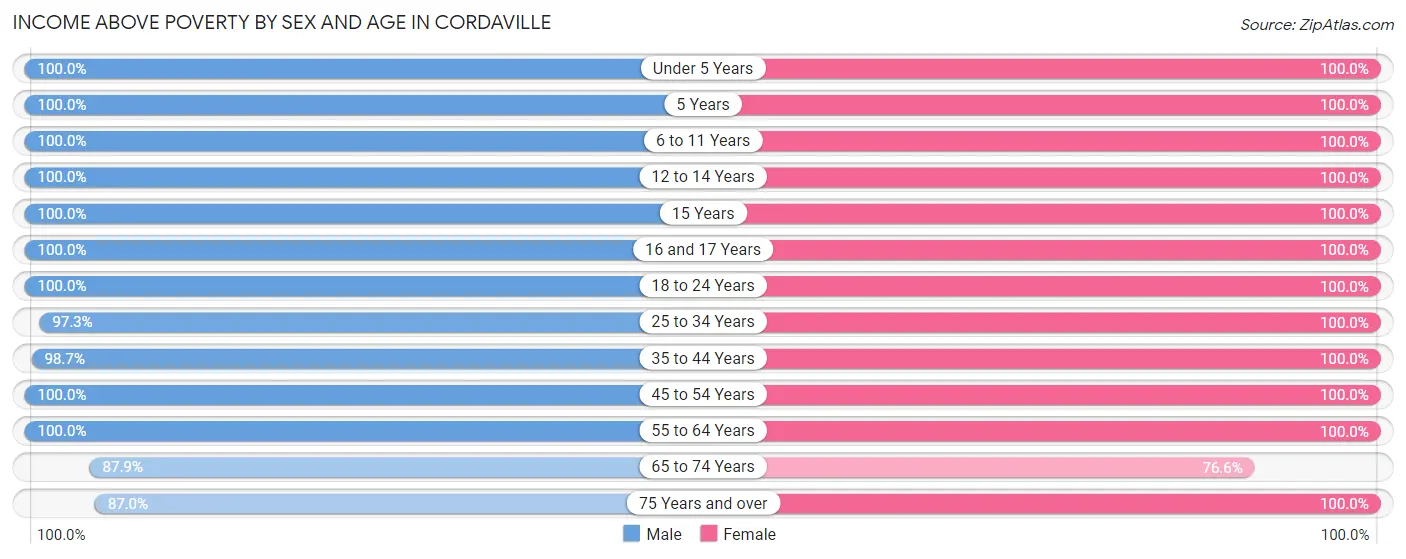
| Age Bracket | Male | Female |
| Under 5 Years | 74 (100.0%) | 137 (100.0%) |
| 5 Years | 6 (100.0%) | 13 (100.0%) |
| 6 to 11 Years | 151 (100.0%) | 211 (100.0%) |
| 12 to 14 Years | 55 (100.0%) | 28 (100.0%) |
| 15 Years | 9 (100.0%) | 76 (100.0%) |
| 16 and 17 Years | 58 (100.0%) | 94 (100.0%) |
| 18 to 24 Years | 85 (100.0%) | 83 (100.0%) |
| 25 to 34 Years | 106 (97.3%) | 143 (100.0%) |
| 35 to 44 Years | 231 (98.7%) | 226 (100.0%) |
| 45 to 54 Years | 278 (100.0%) | 240 (100.0%) |
| 55 to 64 Years | 186 (100.0%) | 169 (100.0%) |
| 65 to 74 Years | 51 (87.9%) | 36 (76.6%) |
| 75 Years and over | 20 (87.0%) | 91 (100.0%) |
| Total | 1,310 (98.8%) | 1,547 (99.3%) |
Income Below Poverty Among Married-Couple Families in Cordaville
The poverty statistics for married-couple families in Cordaville show that 1.1% or 7 of the total 658 families live below the poverty line. Families with no children have the highest poverty rate of 3.8%, comprising of 7 families. On the other hand, families with 1 or 2 children have the lowest poverty rate of 0.0%, which includes 0 families.
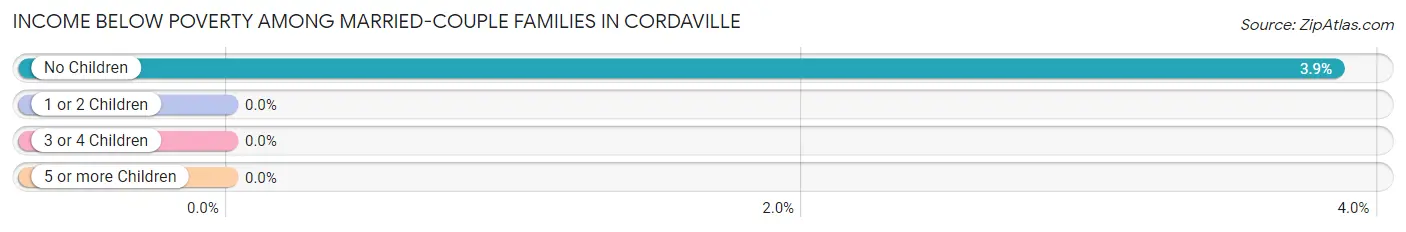
| Children | Above Poverty | Below Poverty |
| No Children | 175 (96.2%) | 7 (3.8%) |
| 1 or 2 Children | 427 (100.0%) | 0 (0.0%) |
| 3 or 4 Children | 49 (100.0%) | 0 (0.0%) |
| 5 or more Children | 0 (0.0%) | 0 (0.0%) |
| Total | 651 (98.9%) | 7 (1.1%) |
Income Below Poverty Among Single-Parent Households in Cordaville
| Children | Single Father | Single Mother |
| No Children | 0 (0.0%) | 0 (0.0%) |
| 1 or 2 Children | 0 (0.0%) | 0 (0.0%) |
| 3 or 4 Children | 0 (0.0%) | 0 (0.0%) |
| 5 or more Children | 0 (0.0%) | 0 (0.0%) |
| Total | 0 (0.0%) | 0 (0.0%) |
Income Below Poverty Among Married-Couple vs Single-Parent Households in Cordaville
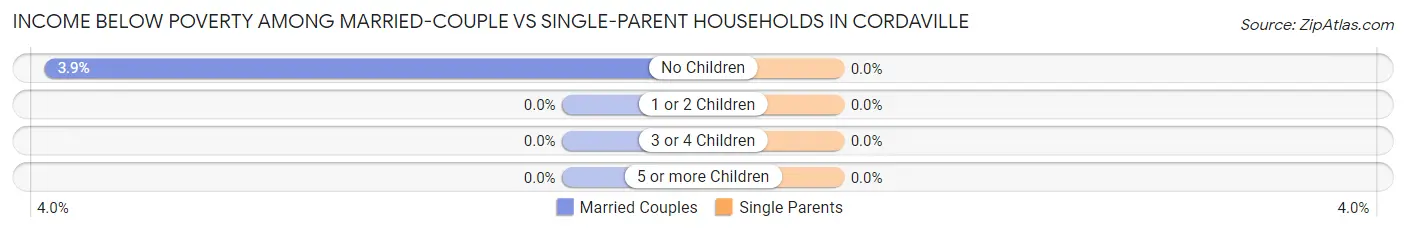
| Children | Married-Couple Families | Single-Parent Households |
| No Children | 7 (3.8%) | 0 (0.0%) |
| 1 or 2 Children | 0 (0.0%) | 0 (0.0%) |
| 3 or 4 Children | 0 (0.0%) | 0 (0.0%) |
| 5 or more Children | 0 (0.0%) | 0 (0.0%) |
| Total | 7 (1.1%) | 0 (0.0%) |
Race in Cordaville
The most populous races in Cordaville are White / Caucasian (2,131 | 73.9%), Asian (616 | 21.4%), and Hispanic or Latino (63 | 2.2%).
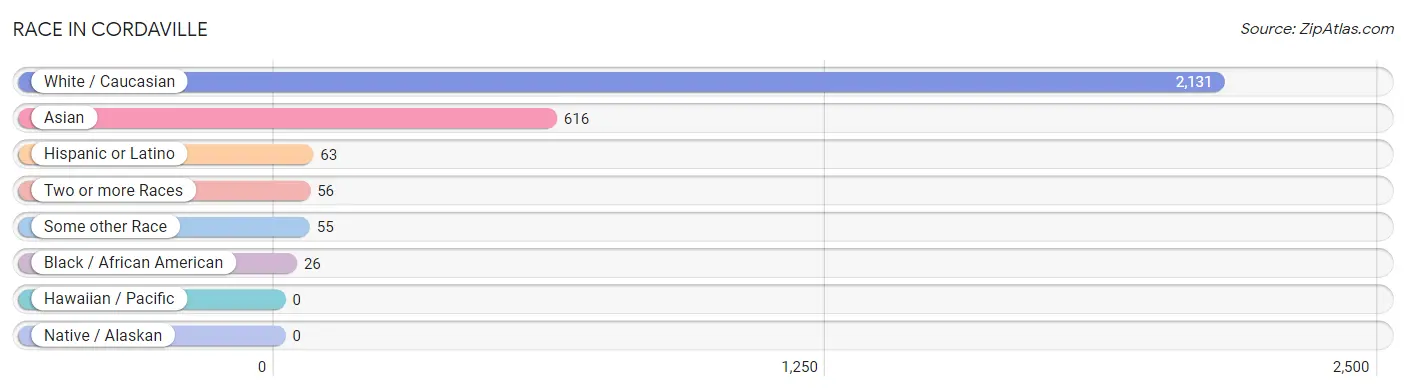
| Race | # Population | % Population |
| Asian | 616 | 21.4% |
| Black / African American | 26 | 0.9% |
| Hawaiian / Pacific | 0 | 0.0% |
| Hispanic or Latino | 63 | 2.2% |
| Native / Alaskan | 0 | 0.0% |
| White / Caucasian | 2,131 | 73.9% |
| Two or more Races | 56 | 1.9% |
| Some other Race | 55 | 1.9% |
| Total | 2,884 | 100.0% |
Ancestry in Cordaville
The most populous ancestries reported in Cordaville are Irish (538 | 18.6%), English (387 | 13.4%), German (383 | 13.3%), Thai (340 | 11.8%), and Italian (300 | 10.4%), together accounting for 67.5% of all Cordaville residents.
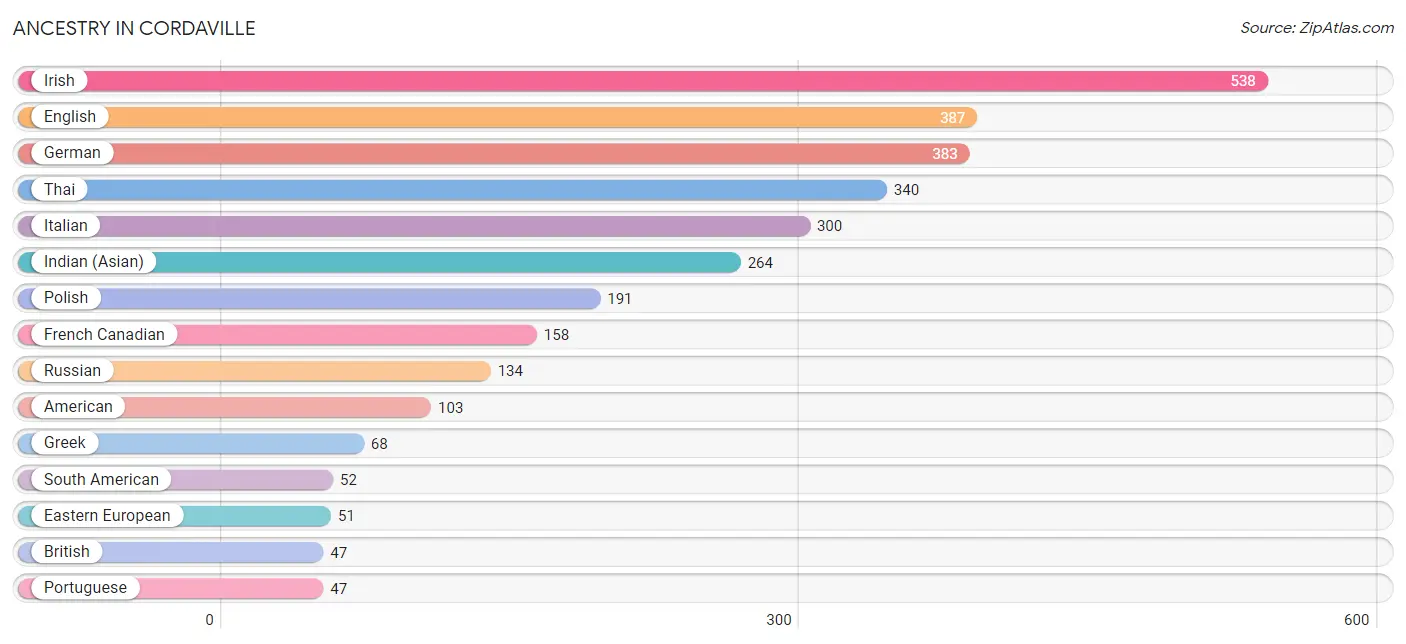
| Ancestry | # Population | % Population |
| American | 103 | 3.6% |
| Arab | 13 | 0.4% |
| Austrian | 20 | 0.7% |
| Bolivian | 10 | 0.4% |
| Brazilian | 22 | 0.8% |
| British | 47 | 1.6% |
| Canadian | 29 | 1.0% |
| Colombian | 42 | 1.5% |
| Dominican | 8 | 0.3% |
| Eastern European | 51 | 1.8% |
| Egyptian | 13 | 0.4% |
| English | 387 | 13.4% |
| European | 46 | 1.6% |
| Filipino | 35 | 1.2% |
| French | 36 | 1.3% |
| French Canadian | 158 | 5.5% |
| German | 383 | 13.3% |
| Greek | 68 | 2.4% |
| Haitian | 7 | 0.2% |
| Hungarian | 13 | 0.4% |
| Indian (Asian) | 264 | 9.1% |
| Irish | 538 | 18.6% |
| Italian | 300 | 10.4% |
| Jamaican | 23 | 0.8% |
| Lithuanian | 7 | 0.2% |
| Polish | 191 | 6.6% |
| Portuguese | 47 | 1.6% |
| Puerto Rican | 3 | 0.1% |
| Russian | 134 | 4.6% |
| Scottish | 45 | 1.6% |
| South American | 52 | 1.8% |
| Swedish | 19 | 0.7% |
| Thai | 340 | 11.8% |
| Ukrainian | 7 | 0.2% | View All 34 Rows |
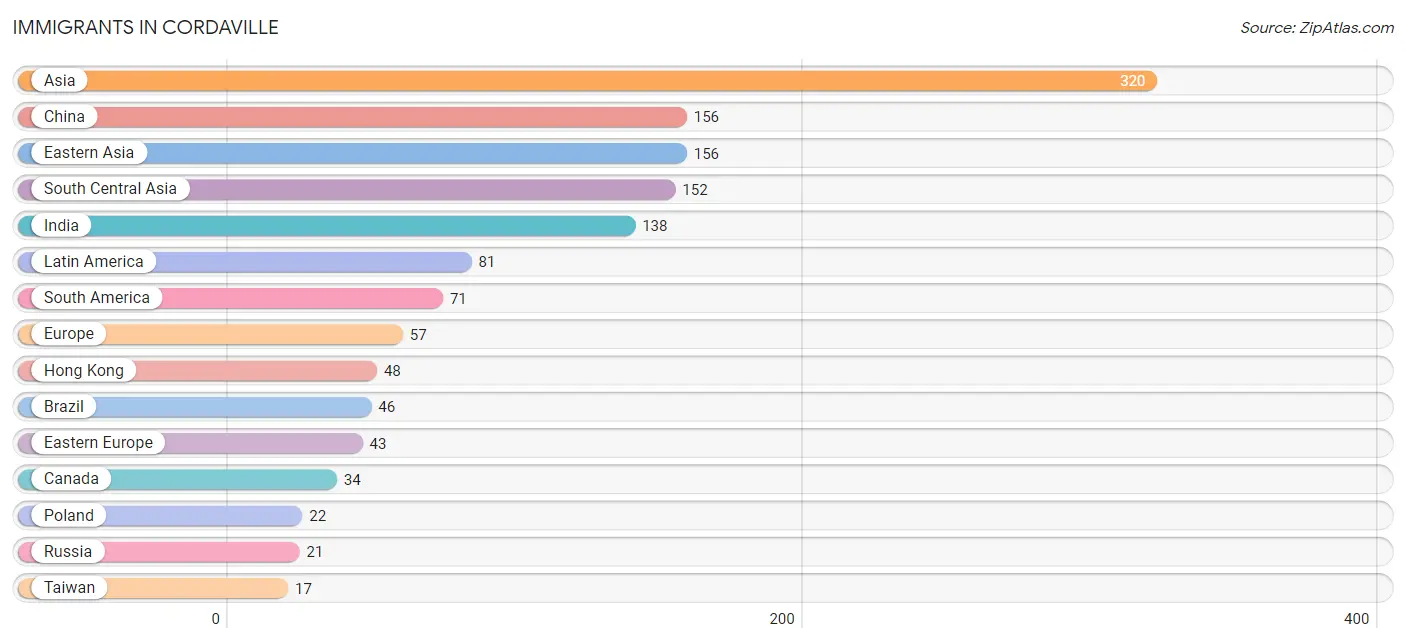
Immigrants in Cordaville
The most numerous immigrant groups reported in Cordaville came from Asia (320 | 11.1%), China (156 | 5.4%), Eastern Asia (156 | 5.4%), South Central Asia (152 | 5.3%), and India (138 | 4.8%), together accounting for 32.0% of all Cordaville residents.
| Immigration Origin | # Population | % Population |
| Africa | 13 | 0.4% |
| Asia | 320 | 11.1% |
| Bolivia | 10 | 0.4% |
| Brazil | 46 | 1.6% |
| Canada | 34 | 1.2% |
| Caribbean | 10 | 0.4% |
| China | 156 | 5.4% |
| Colombia | 15 | 0.5% |
| Eastern Asia | 156 | 5.4% |
| Eastern Europe | 43 | 1.5% |
| Egypt | 13 | 0.4% |
| Europe | 57 | 2.0% |
| Hong Kong | 48 | 1.7% |
| India | 138 | 4.8% |
| Jamaica | 10 | 0.4% |
| Latin America | 81 | 2.8% |
| Northern Africa | 13 | 0.4% |
| Northern Europe | 10 | 0.4% |
| Pakistan | 14 | 0.5% |
| Poland | 22 | 0.8% |
| Russia | 21 | 0.7% |
| Singapore | 12 | 0.4% |
| South America | 71 | 2.5% |
| South Central Asia | 152 | 5.3% |
| South Eastern Asia | 12 | 0.4% |
| Southern Europe | 4 | 0.1% |
| Taiwan | 17 | 0.6% | View All 27 Rows |
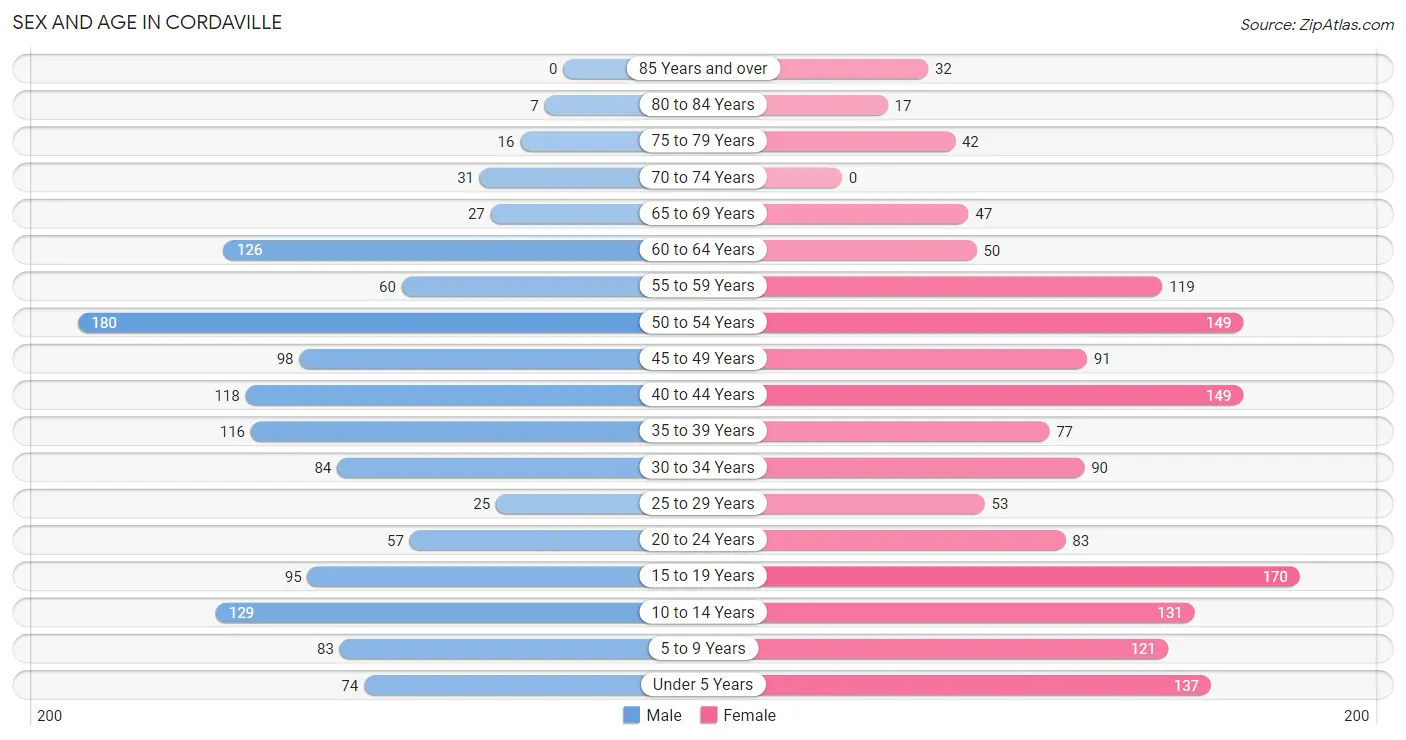
Sex and Age in Cordaville
Sex and Age in Cordaville
The most populous age groups in Cordaville are 50 to 54 Years (180 | 13.6%) for men and 15 to 19 Years (170 | 10.9%) for women.
| Age Bracket | Male | Female |
| Under 5 Years | 74 (5.6%) | 137 (8.8%) |
| 5 to 9 Years | 83 (6.3%) | 121 (7.8%) |
| 10 to 14 Years | 129 (9.7%) | 131 (8.4%) |
| 15 to 19 Years | 95 (7.2%) | 170 (10.9%) |
| 20 to 24 Years | 57 (4.3%) | 83 (5.3%) |
| 25 to 29 Years | 25 (1.9%) | 53 (3.4%) |
| 30 to 34 Years | 84 (6.3%) | 90 (5.8%) |
| 35 to 39 Years | 116 (8.7%) | 77 (4.9%) |
| 40 to 44 Years | 118 (8.9%) | 149 (9.6%) |
| 45 to 49 Years | 98 (7.4%) | 91 (5.8%) |
| 50 to 54 Years | 180 (13.6%) | 149 (9.6%) |
| 55 to 59 Years | 60 (4.5%) | 119 (7.6%) |
| 60 to 64 Years | 126 (9.5%) | 50 (3.2%) |
| 65 to 69 Years | 27 (2.0%) | 47 (3.0%) |
| 70 to 74 Years | 31 (2.3%) | 0 (0.0%) |
| 75 to 79 Years | 16 (1.2%) | 42 (2.7%) |
| 80 to 84 Years | 7 (0.5%) | 17 (1.1%) |
| 85 Years and over | 0 (0.0%) | 32 (2.1%) |
| Total | 1,326 (100.0%) | 1,558 (100.0%) |
Families and Households in Cordaville
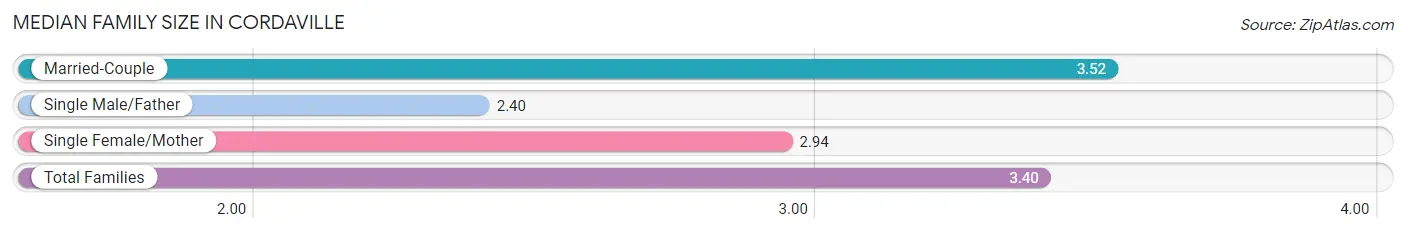
Median Family Size in Cordaville
The median family size in Cordaville is 3.40 persons per family, with married-couple families (658 | 84.1%) accounting for the largest median family size of 3.52 persons per family. On the other hand, single male/father families (52 | 6.7%) represent the smallest median family size with 2.40 persons per family.
| Family Type | # Families | Family Size |
| Married-Couple | 658 (84.1%) | 3.52 |
| Single Male/Father | 52 (6.7%) | 2.40 |
| Single Female/Mother | 72 (9.2%) | 2.94 |
| Total Families | 782 (100.0%) | 3.40 |
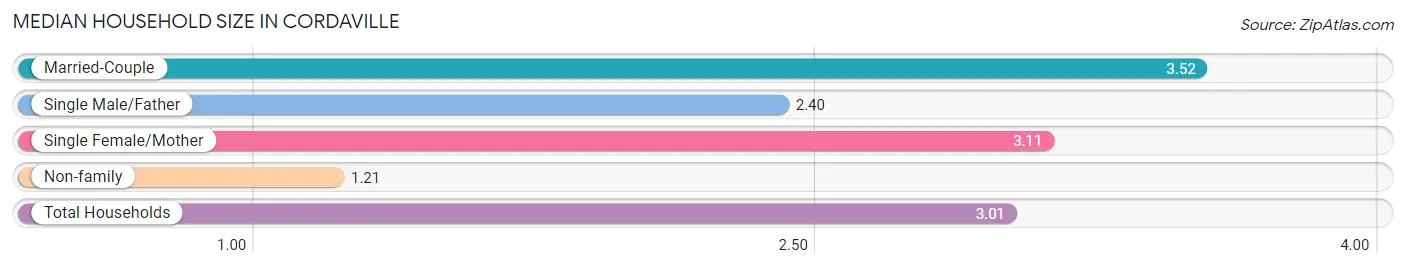
Median Household Size in Cordaville
The median household size in Cordaville is 3.01 persons per household, with married-couple households (658 | 68.9%) accounting for the largest median household size of 3.52 persons per household. non-family households (173 | 18.1%) represent the smallest median household size with 1.21 persons per household.
| Household Type | # Households | Household Size |
| Married-Couple | 658 (68.9%) | 3.52 |
| Single Male/Father | 52 (5.4%) | 2.40 |
| Single Female/Mother | 72 (7.5%) | 3.11 |
| Non-family | 173 (18.1%) | 1.21 |
| Total Households | 955 (100.0%) | 3.01 |
Household Size by Marriage Status in Cordaville
Out of a total of 955 households in Cordaville, 782 (81.9%) are family households, while 173 (18.1%) are nonfamily households. The most numerous type of family households are 4-person households, comprising 325, and the most common type of nonfamily households are 1-person households, comprising 139.
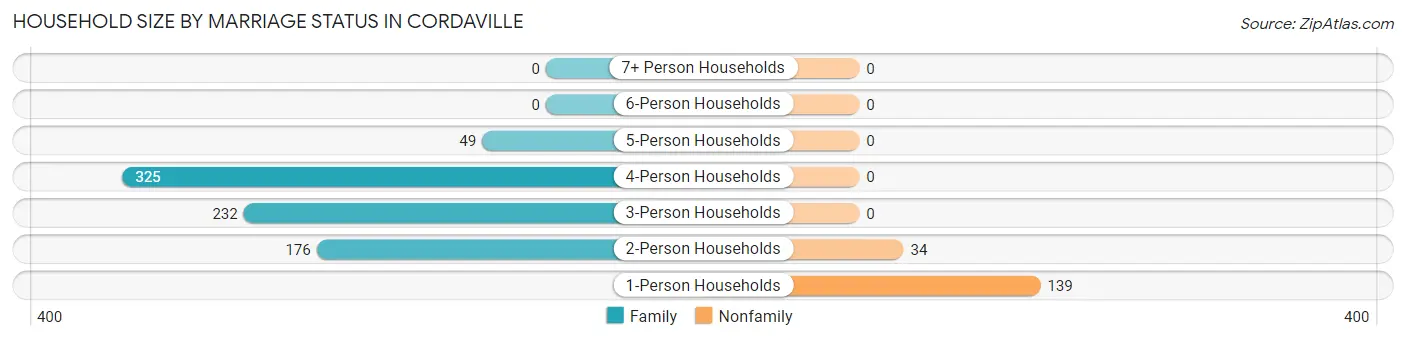
| Household Size | Family Households | Nonfamily Households |
| 1-Person Households | - | 139 (14.5%) |
| 2-Person Households | 176 (18.4%) | 34 (3.6%) |
| 3-Person Households | 232 (24.3%) | 0 (0.0%) |
| 4-Person Households | 325 (34.0%) | 0 (0.0%) |
| 5-Person Households | 49 (5.1%) | 0 (0.0%) |
| 6-Person Households | 0 (0.0%) | 0 (0.0%) |
| 7+ Person Households | 0 (0.0%) | 0 (0.0%) |
| Total | 782 (81.9%) | 173 (18.1%) |
Female Fertility in Cordaville
Fertility by Age in Cordaville
Average fertility rate in Cordaville is 39.0 births per 1,000 women. Women in the age bracket of 20 to 34 years have the highest fertility rate with 128.0 births per 1,000 women. Women in the age bracket of 20 to 34 years acount for 100.0% of all women with births.
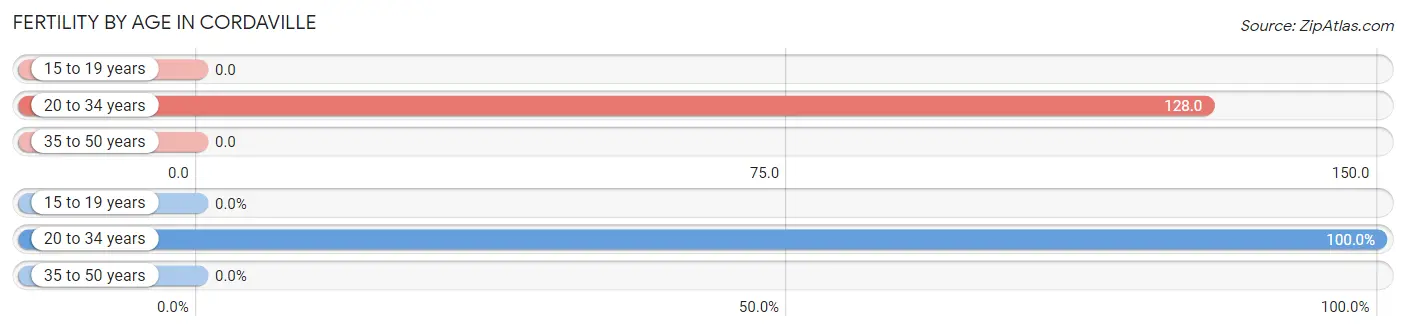
| Age Bracket | Women with Births | Births / 1,000 Women |
| 15 to 19 years | 0 (0.0%) | 0.0 |
| 20 to 34 years | 29 (100.0%) | 128.0 |
| 35 to 50 years | 0 (0.0%) | 0.0 |
| Total | 29 (100.0%) | 39.0 |
Fertility by Age by Marriage Status in Cordaville
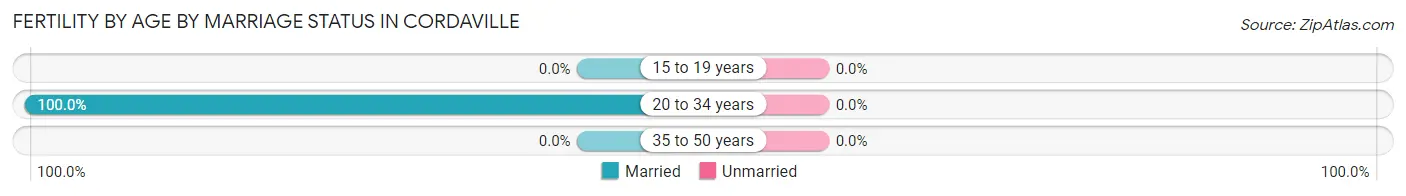
| Age Bracket | Married | Unmarried |
| 15 to 19 years | 0 (0.0%) | 0 (0.0%) |
| 20 to 34 years | 29 (100.0%) | 0 (0.0%) |
| 35 to 50 years | 0 (0.0%) | 0 (0.0%) |
| Total | 29 (100.0%) | 0 (0.0%) |
Fertility by Education in Cordaville
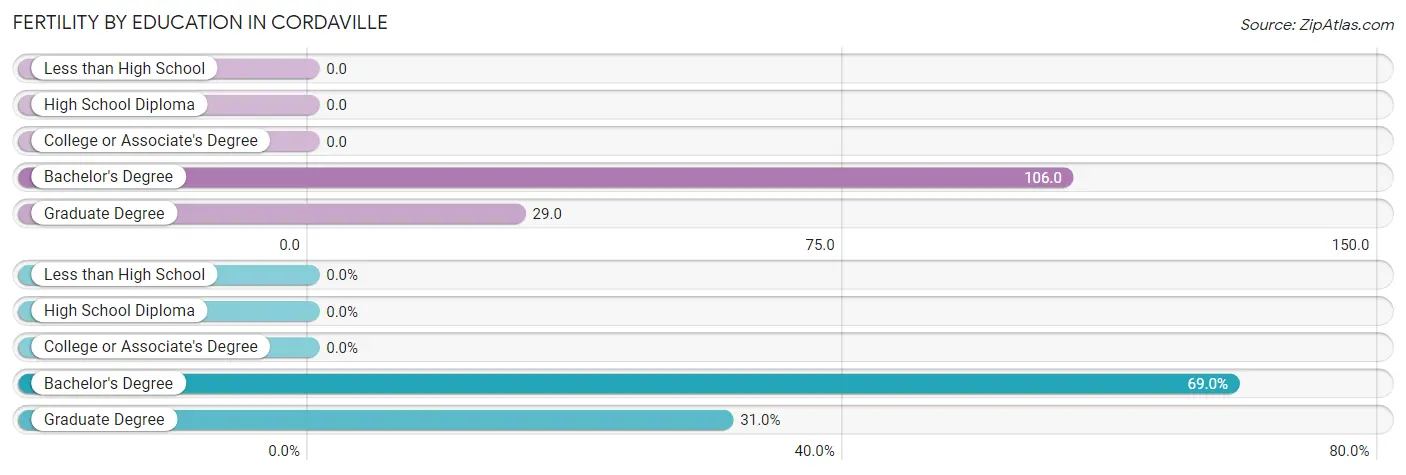
| Educational Attainment | Women with Births | Births / 1,000 Women |
| Less than High School | 0 (0.0%) | 0.0 |
| High School Diploma | 0 (0.0%) | 0.0 |
| College or Associate's Degree | 0 (0.0%) | 0.0 |
| Bachelor's Degree | 20 (69.0%) | 106.0 |
| Graduate Degree | 9 (31.0%) | 29.0 |
| Total | 29 (100.0%) | 39.0 |
Fertility by Education by Marriage Status in Cordaville
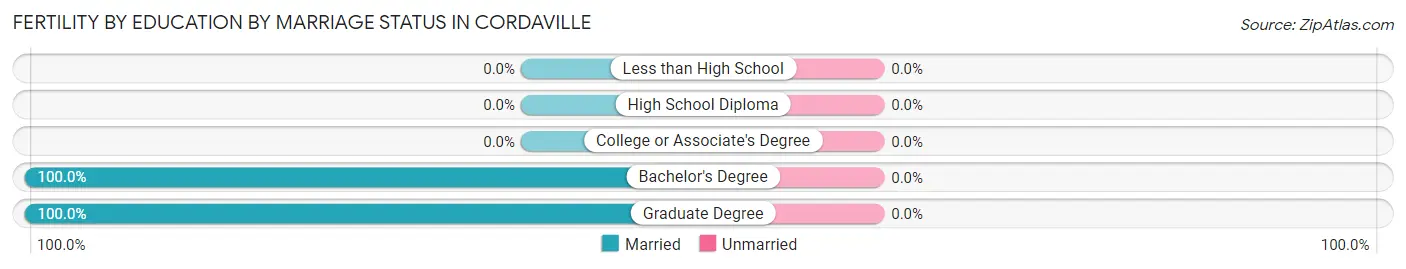
| Educational Attainment | Married | Unmarried |
| Less than High School | 0 (0.0%) | 0 (0.0%) |
| High School Diploma | 0 (0.0%) | 0 (0.0%) |
| College or Associate's Degree | 0 (0.0%) | 0 (0.0%) |
| Bachelor's Degree | 20 (100.0%) | 0 (0.0%) |
| Graduate Degree | 9 (100.0%) | 0 (0.0%) |
| Total | 29 (100.0%) | 0 (0.0%) |
Employment Characteristics in Cordaville
Employment by Class of Employer in Cordaville
Among the 1,614 employed individuals in Cordaville, private company employees (1,119 | 69.3%), not-for-profit organizations (192 | 11.9%), and local government employees (107 | 6.6%) make up the most common classes of employment.
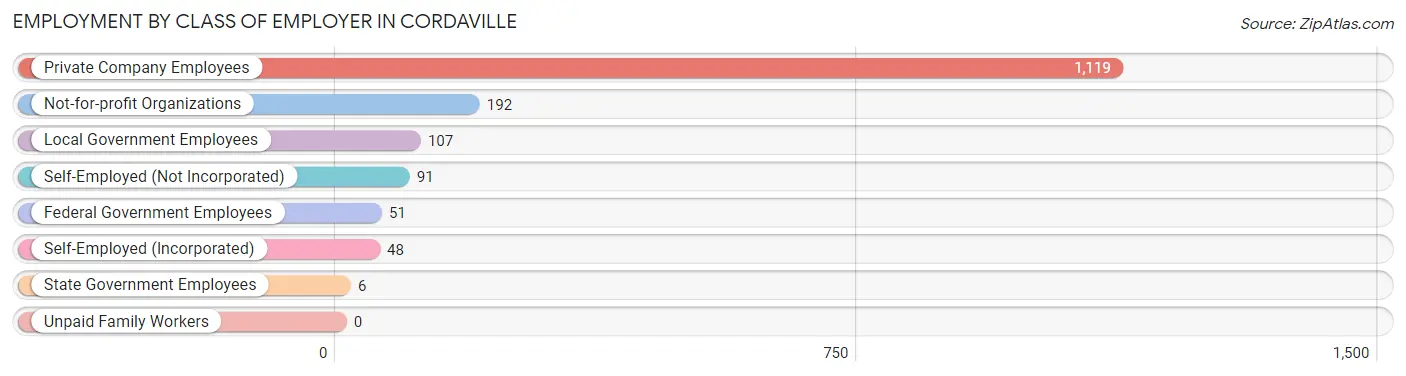
| Employer Class | # Employees | % Employees |
| Private Company Employees | 1,119 | 69.3% |
| Self-Employed (Incorporated) | 48 | 3.0% |
| Self-Employed (Not Incorporated) | 91 | 5.6% |
| Not-for-profit Organizations | 192 | 11.9% |
| Local Government Employees | 107 | 6.6% |
| State Government Employees | 6 | 0.4% |
| Federal Government Employees | 51 | 3.2% |
| Unpaid Family Workers | 0 | 0.0% |
| Total | 1,614 | 100.0% |
Employment Status by Age in Cordaville
According to the labor force statistics for Cordaville, out of the total population over 16 years of age (2,124), 78.8% or 1,674 individuals are in the labor force, with 2.7% or 45 of them unemployed. The age group with the highest labor force participation rate is 25 to 29 years, with 100.0% or 78 individuals in the labor force. Within the labor force, the 60 to 64 years age range has the highest percentage of unemployed individuals, with 8.4% or 11 of them being unemployed.
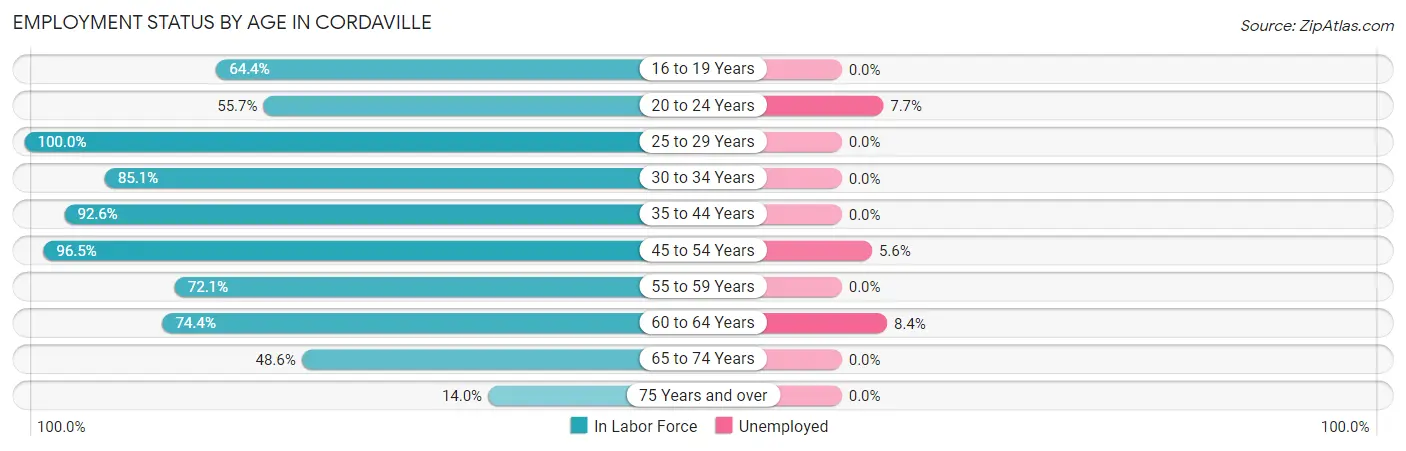
| Age Bracket | In Labor Force | Unemployed |
| 16 to 19 Years | 116 (64.4%) | 0 (0.0%) |
| 20 to 24 Years | 78 (55.7%) | 6 (7.7%) |
| 25 to 29 Years | 78 (100.0%) | 0 (0.0%) |
| 30 to 34 Years | 148 (85.1%) | 0 (0.0%) |
| 35 to 44 Years | 426 (92.6%) | 0 (0.0%) |
| 45 to 54 Years | 500 (96.5%) | 28 (5.6%) |
| 55 to 59 Years | 129 (72.1%) | 0 (0.0%) |
| 60 to 64 Years | 131 (74.4%) | 11 (8.4%) |
| 65 to 74 Years | 51 (48.6%) | 0 (0.0%) |
| 75 Years and over | 16 (14.0%) | 0 (0.0%) |
| Total | 1,674 (78.8%) | 45 (2.7%) |
Employment Status by Educational Attainment in Cordaville
According to labor force statistics for Cordaville, 89.1% of individuals (1,412) out of the total population between 25 and 64 years of age (1,585) are in the labor force, with 2.8% or 40 of them being unemployed. The group with the highest labor force participation rate are those with the educational attainment of high school diploma, with 94.1% or 143 individuals in the labor force. Within the labor force, individuals with bachelor's degree or higher education have the highest percentage of unemployment, with 3.5% or 40 of them being unemployed.
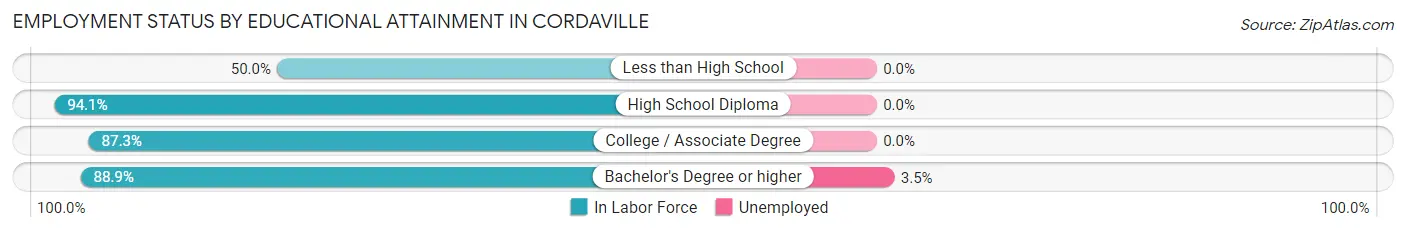
| Educational Attainment | In Labor Force | Unemployed |
| Less than High School | 3 (50.0%) | 0 (0.0%) |
| High School Diploma | 143 (94.1%) | 0 (0.0%) |
| College / Associate Degree | 137 (87.3%) | 0 (0.0%) |
| Bachelor's Degree or higher | 1,129 (88.9%) | 44 (3.5%) |
| Total | 1,412 (89.1%) | 44 (2.8%) |
Employment Occupations by Sex in Cordaville
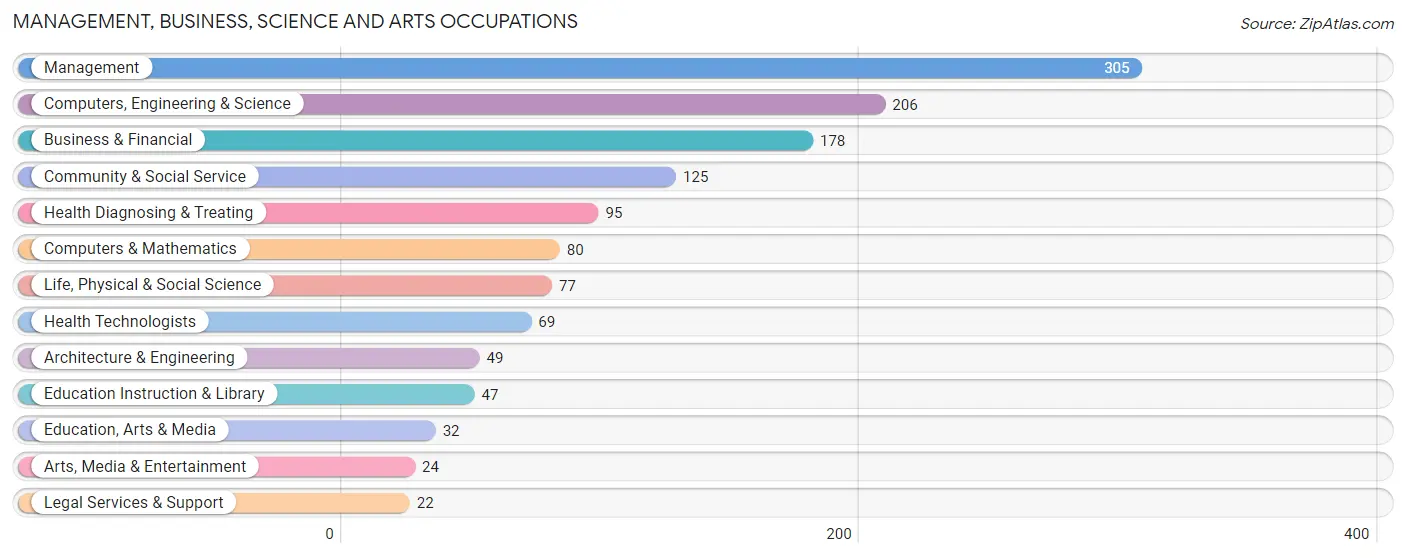
Management, Business, Science and Arts Occupations
The most common Management, Business, Science and Arts occupations in Cordaville are Management (305 | 18.7%), Computers, Engineering & Science (206 | 12.7%), Business & Financial (178 | 10.9%), Community & Social Service (125 | 7.7%), and Health Diagnosing & Treating (95 | 5.8%).
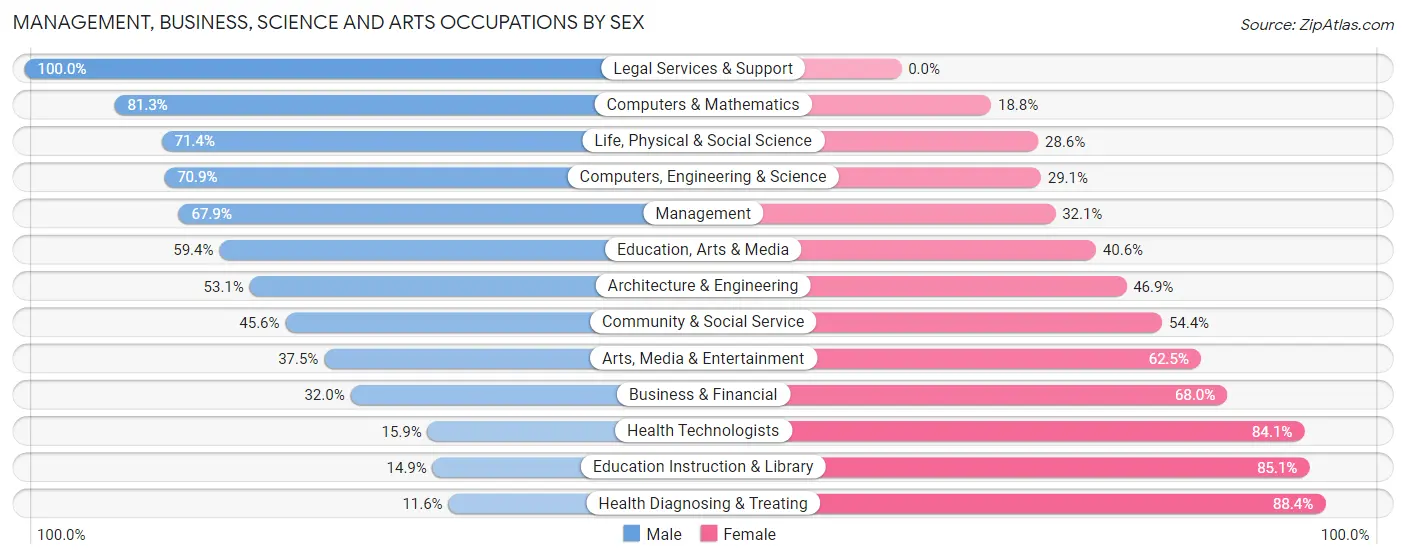
Management, Business, Science and Arts Occupations by Sex
Within the Management, Business, Science and Arts occupations in Cordaville, the most male-oriented occupations are Legal Services & Support (100.0%), Computers & Mathematics (81.2%), and Life, Physical & Social Science (71.4%), while the most female-oriented occupations are Health Diagnosing & Treating (88.4%), Education Instruction & Library (85.1%), and Health Technologists (84.1%).
| Occupation | Male | Female |
| Management | 207 (67.9%) | 98 (32.1%) |
| Business & Financial | 57 (32.0%) | 121 (68.0%) |
| Computers, Engineering & Science | 146 (70.9%) | 60 (29.1%) |
| Computers & Mathematics | 65 (81.2%) | 15 (18.8%) |
| Architecture & Engineering | 26 (53.1%) | 23 (46.9%) |
| Life, Physical & Social Science | 55 (71.4%) | 22 (28.6%) |
| Community & Social Service | 57 (45.6%) | 68 (54.4%) |
| Education, Arts & Media | 19 (59.4%) | 13 (40.6%) |
| Legal Services & Support | 22 (100.0%) | 0 (0.0%) |
| Education Instruction & Library | 7 (14.9%) | 40 (85.1%) |
| Arts, Media & Entertainment | 9 (37.5%) | 15 (62.5%) |
| Health Diagnosing & Treating | 11 (11.6%) | 84 (88.4%) |
| Health Technologists | 11 (15.9%) | 58 (84.1%) |
| Total (Category) | 478 (52.6%) | 431 (47.4%) |
| Total (Overall) | 826 (50.7%) | 802 (49.3%) |
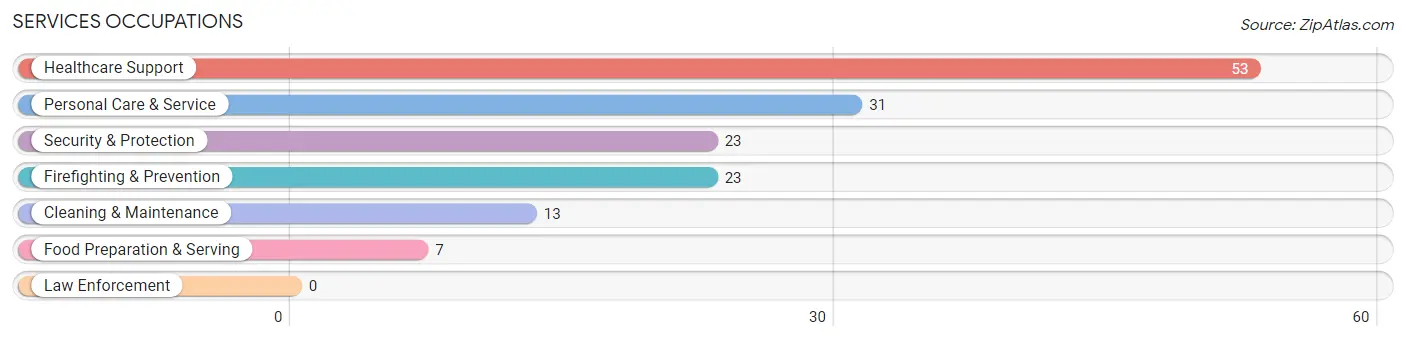
Services Occupations
The most common Services occupations in Cordaville are Healthcare Support (53 | 3.3%), Personal Care & Service (31 | 1.9%), Security & Protection (23 | 1.4%), Firefighting & Prevention (23 | 1.4%), and Cleaning & Maintenance (13 | 0.8%).
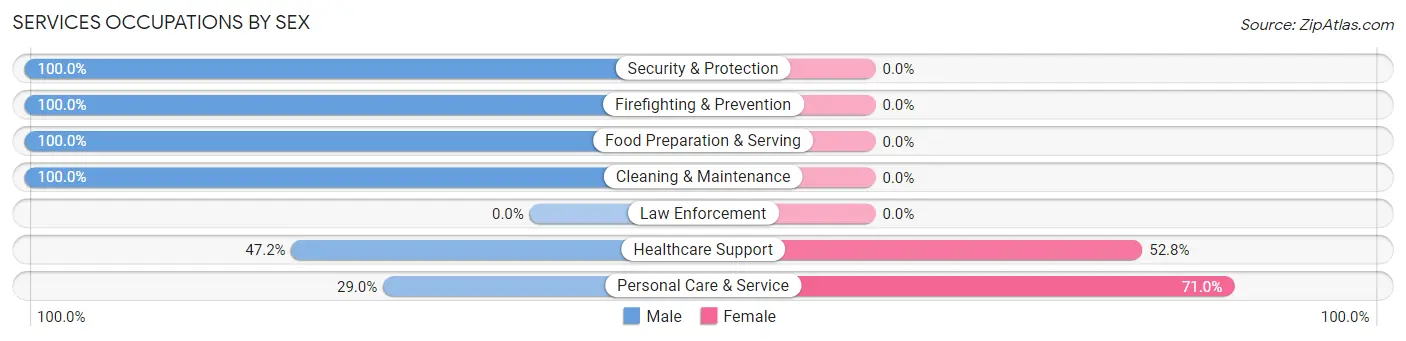
Services Occupations by Sex
Within the Services occupations in Cordaville, the most male-oriented occupations are Security & Protection (100.0%), Firefighting & Prevention (100.0%), and Food Preparation & Serving (100.0%), while the most female-oriented occupations are Personal Care & Service (71.0%), and Healthcare Support (52.8%).
| Occupation | Male | Female |
| Healthcare Support | 25 (47.2%) | 28 (52.8%) |
| Security & Protection | 23 (100.0%) | 0 (0.0%) |
| Firefighting & Prevention | 23 (100.0%) | 0 (0.0%) |
| Law Enforcement | 0 (0.0%) | 0 (0.0%) |
| Food Preparation & Serving | 7 (100.0%) | 0 (0.0%) |
| Cleaning & Maintenance | 13 (100.0%) | 0 (0.0%) |
| Personal Care & Service | 9 (29.0%) | 22 (71.0%) |
| Total (Category) | 77 (60.6%) | 50 (39.4%) |
| Total (Overall) | 826 (50.7%) | 802 (49.3%) |
Sales and Office Occupations
The most common Sales and Office occupations in Cordaville are Sales & Related (272 | 16.7%), and Office & Administration (197 | 12.1%).
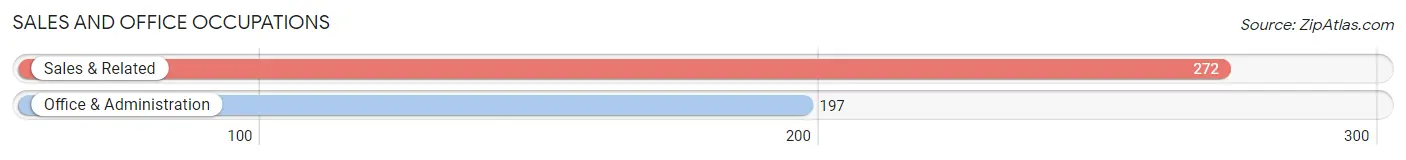
Sales and Office Occupations by Sex
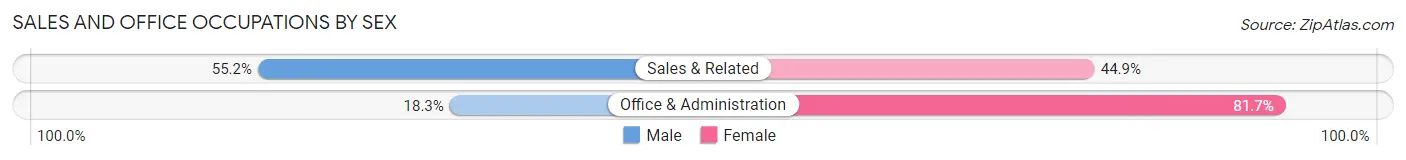
| Occupation | Male | Female |
| Sales & Related | 150 (55.1%) | 122 (44.9%) |
| Office & Administration | 36 (18.3%) | 161 (81.7%) |
| Total (Category) | 186 (39.7%) | 283 (60.3%) |
| Total (Overall) | 826 (50.7%) | 802 (49.3%) |
Natural Resources, Construction and Maintenance Occupations
The most common Natural Resources, Construction and Maintenance occupations in Cordaville are Farming, Fishing & Forestry (43 | 2.6%), and Construction & Extraction (29 | 1.8%).
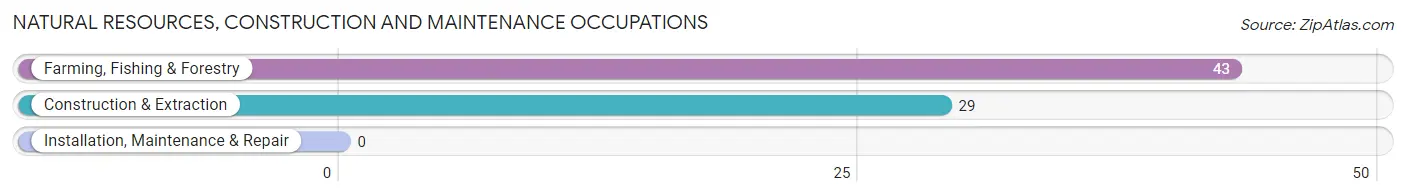
Natural Resources, Construction and Maintenance Occupations by Sex
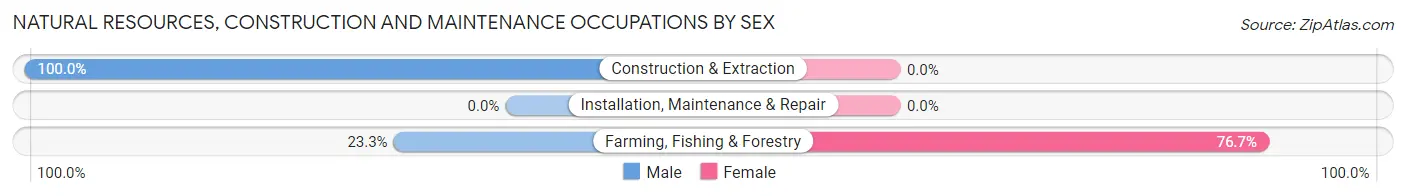
| Occupation | Male | Female |
| Farming, Fishing & Forestry | 10 (23.3%) | 33 (76.7%) |
| Construction & Extraction | 29 (100.0%) | 0 (0.0%) |
| Installation, Maintenance & Repair | 0 (0.0%) | 0 (0.0%) |
| Total (Category) | 39 (54.2%) | 33 (45.8%) |
| Total (Overall) | 826 (50.7%) | 802 (49.3%) |
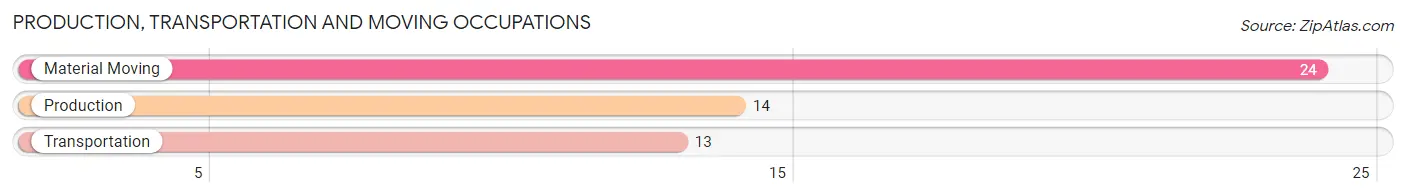
Production, Transportation and Moving Occupations
The most common Production, Transportation and Moving occupations in Cordaville are Material Moving (24 | 1.5%), Production (14 | 0.9%), and Transportation (13 | 0.8%).
Production, Transportation and Moving Occupations by Sex
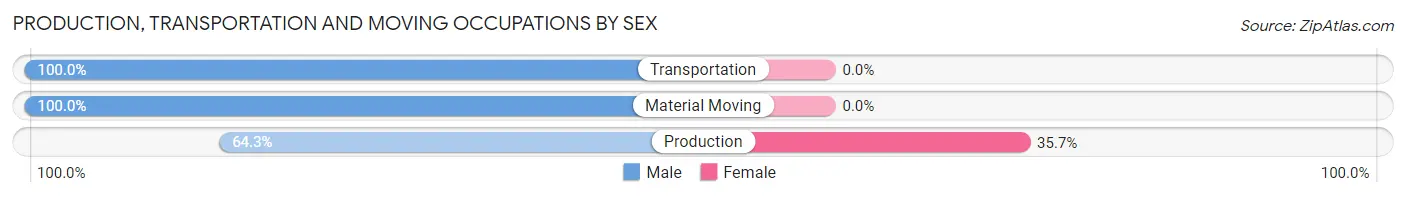
| Occupation | Male | Female |
| Production | 9 (64.3%) | 5 (35.7%) |
| Transportation | 13 (100.0%) | 0 (0.0%) |
| Material Moving | 24 (100.0%) | 0 (0.0%) |
| Total (Category) | 46 (90.2%) | 5 (9.8%) |
| Total (Overall) | 826 (50.7%) | 802 (49.3%) |
Employment Industries by Sex in Cordaville
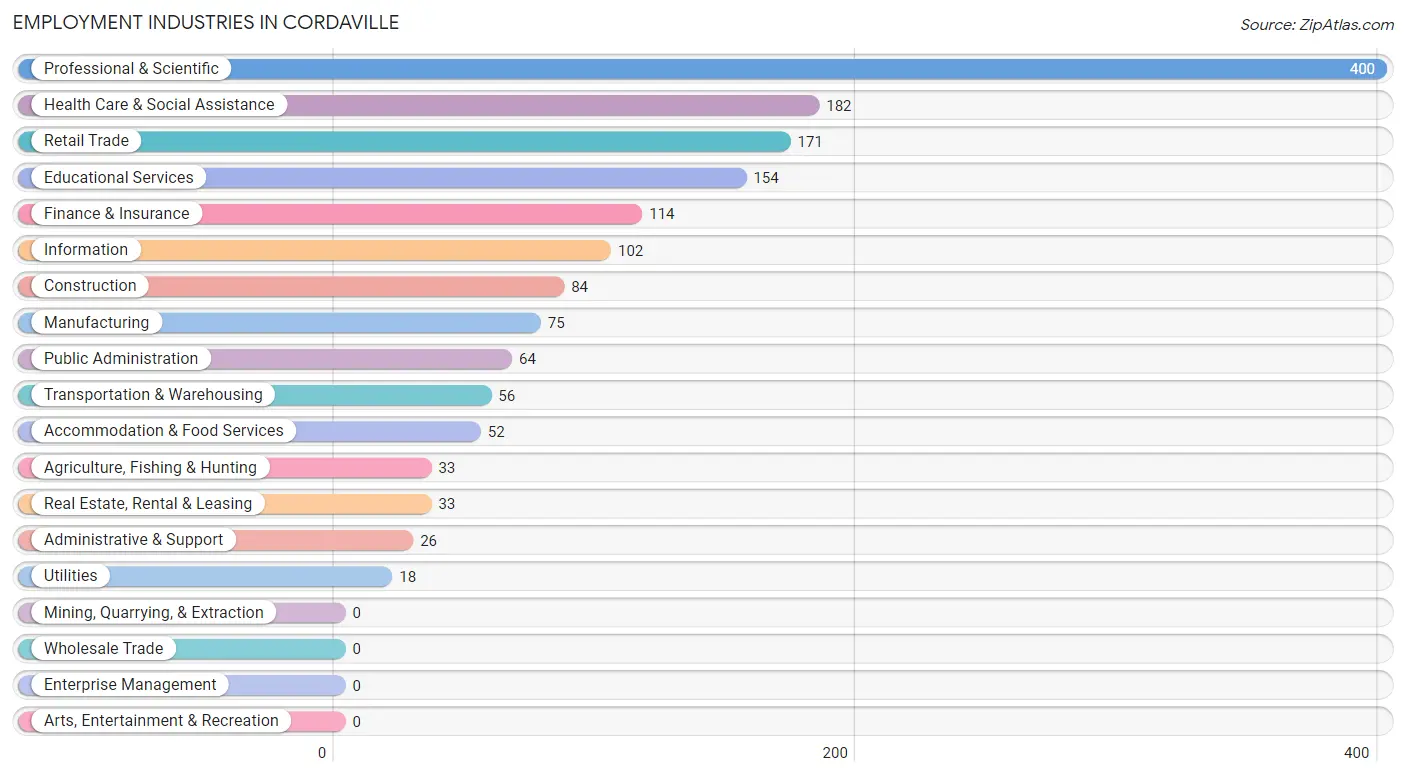
Employment Industries in Cordaville
The major employment industries in Cordaville include Professional & Scientific (400 | 24.6%), Health Care & Social Assistance (182 | 11.2%), Retail Trade (171 | 10.5%), Educational Services (154 | 9.5%), and Finance & Insurance (114 | 7.0%).
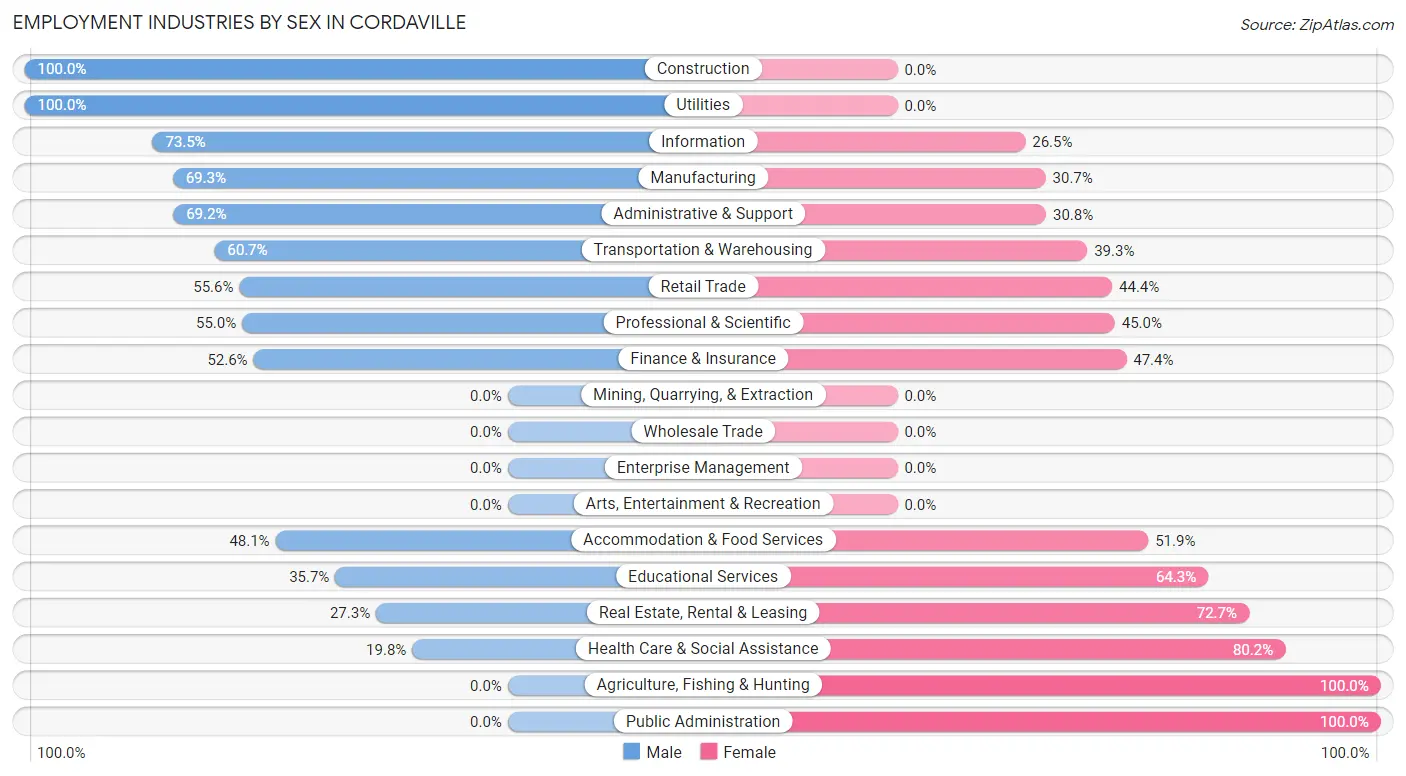
Employment Industries by Sex in Cordaville
The Cordaville industries that see more men than women are Construction (100.0%), Utilities (100.0%), and Information (73.5%), whereas the industries that tend to have a higher number of women are Agriculture, Fishing & Hunting (100.0%), Public Administration (100.0%), and Health Care & Social Assistance (80.2%).
| Industry | Male | Female |
| Agriculture, Fishing & Hunting | 0 (0.0%) | 33 (100.0%) |
| Mining, Quarrying, & Extraction | 0 (0.0%) | 0 (0.0%) |
| Construction | 84 (100.0%) | 0 (0.0%) |
| Manufacturing | 52 (69.3%) | 23 (30.7%) |
| Wholesale Trade | 0 (0.0%) | 0 (0.0%) |
| Retail Trade | 95 (55.6%) | 76 (44.4%) |
| Transportation & Warehousing | 34 (60.7%) | 22 (39.3%) |
| Utilities | 18 (100.0%) | 0 (0.0%) |
| Information | 75 (73.5%) | 27 (26.5%) |
| Finance & Insurance | 60 (52.6%) | 54 (47.4%) |
| Real Estate, Rental & Leasing | 9 (27.3%) | 24 (72.7%) |
| Professional & Scientific | 220 (55.0%) | 180 (45.0%) |
| Enterprise Management | 0 (0.0%) | 0 (0.0%) |
| Administrative & Support | 18 (69.2%) | 8 (30.8%) |
| Educational Services | 55 (35.7%) | 99 (64.3%) |
| Health Care & Social Assistance | 36 (19.8%) | 146 (80.2%) |
| Arts, Entertainment & Recreation | 0 (0.0%) | 0 (0.0%) |
| Accommodation & Food Services | 25 (48.1%) | 27 (51.9%) |
| Public Administration | 0 (0.0%) | 64 (100.0%) |
| Total | 826 (50.7%) | 802 (49.3%) |
Education in Cordaville
School Enrollment in Cordaville
The most common levels of schooling among the 868 students in Cordaville are high school (243 | 28.0%), elementary school (229 | 26.4%), and middle school (178 | 20.5%).
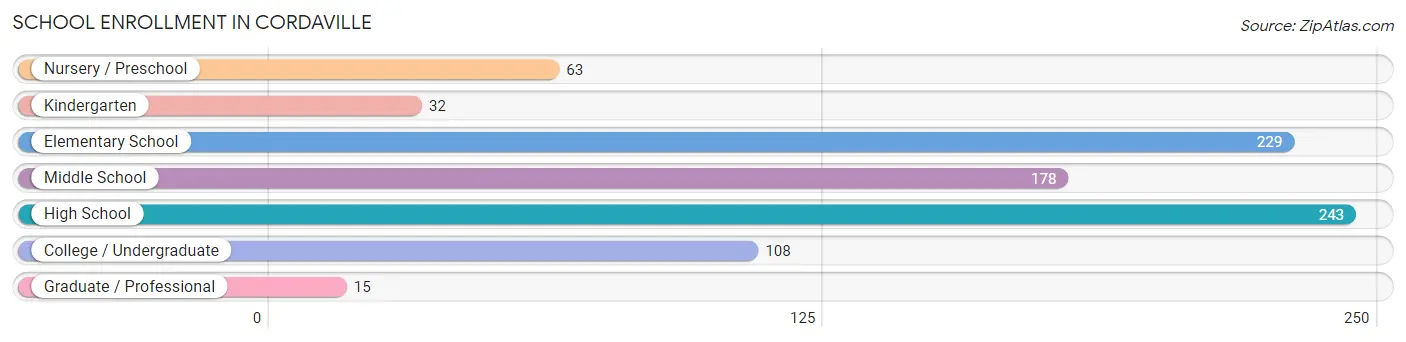
| School Level | # Students | % Students |
| Nursery / Preschool | 63 | 7.3% |
| Kindergarten | 32 | 3.7% |
| Elementary School | 229 | 26.4% |
| Middle School | 178 | 20.5% |
| High School | 243 | 28.0% |
| College / Undergraduate | 108 | 12.4% |
| Graduate / Professional | 15 | 1.7% |
| Total | 868 | 100.0% |
School Enrollment by Age by Funding Source in Cordaville
Out of a total of 868 students who are enrolled in schools in Cordaville, 146 (16.8%) attend a private institution, while the remaining 722 (83.2%) are enrolled in public schools. The age group of 25 to 34 year olds has the highest likelihood of being enrolled in private schools, with 17 (100.0% in the age bracket) enrolled. Conversely, the age group of 10 to 14 year olds has the lowest likelihood of being enrolled in a private school, with 260 (100.0% in the age bracket) attending a public institution.
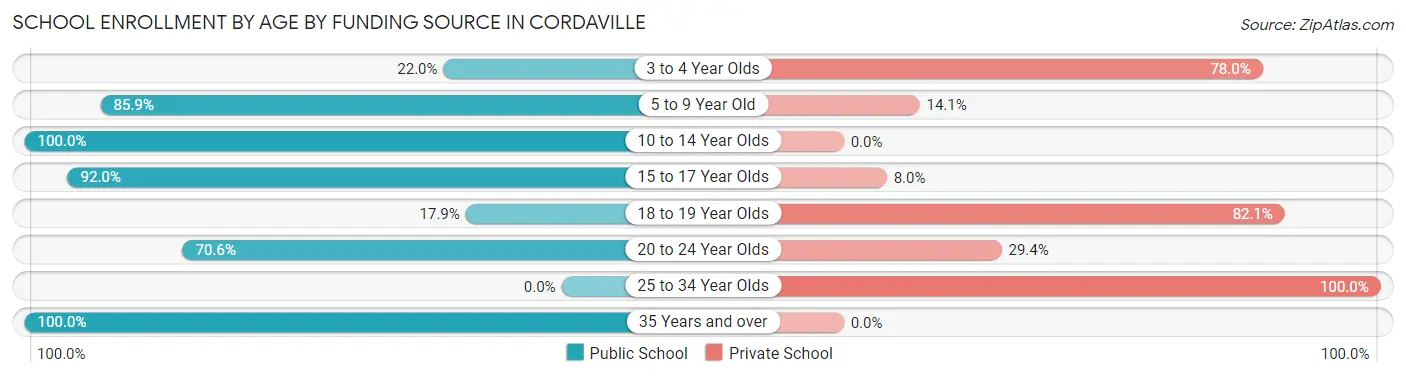
| Age Bracket | Public School | Private School |
| 3 to 4 Year Olds | 11 (22.0%) | 39 (78.0%) |
| 5 to 9 Year Old | 170 (85.9%) | 28 (14.1%) |
| 10 to 14 Year Olds | 260 (100.0%) | 0 (0.0%) |
| 15 to 17 Year Olds | 218 (92.0%) | 19 (8.0%) |
| 18 to 19 Year Olds | 5 (17.9%) | 23 (82.1%) |
| 20 to 24 Year Olds | 48 (70.6%) | 20 (29.4%) |
| 25 to 34 Year Olds | 0 (0.0%) | 17 (100.0%) |
| 35 Years and over | 10 (100.0%) | 0 (0.0%) |
| Total | 722 (83.2%) | 146 (16.8%) |
Educational Attainment by Field of Study in Cordaville
Business (315 | 21.6%), engineering (176 | 12.1%), computers & mathematics (136 | 9.3%), bio, nature & agricultural (135 | 9.2%), and social sciences (129 | 8.8%) are the most common fields of study among 1,459 individuals in Cordaville who have obtained a bachelor's degree or higher.
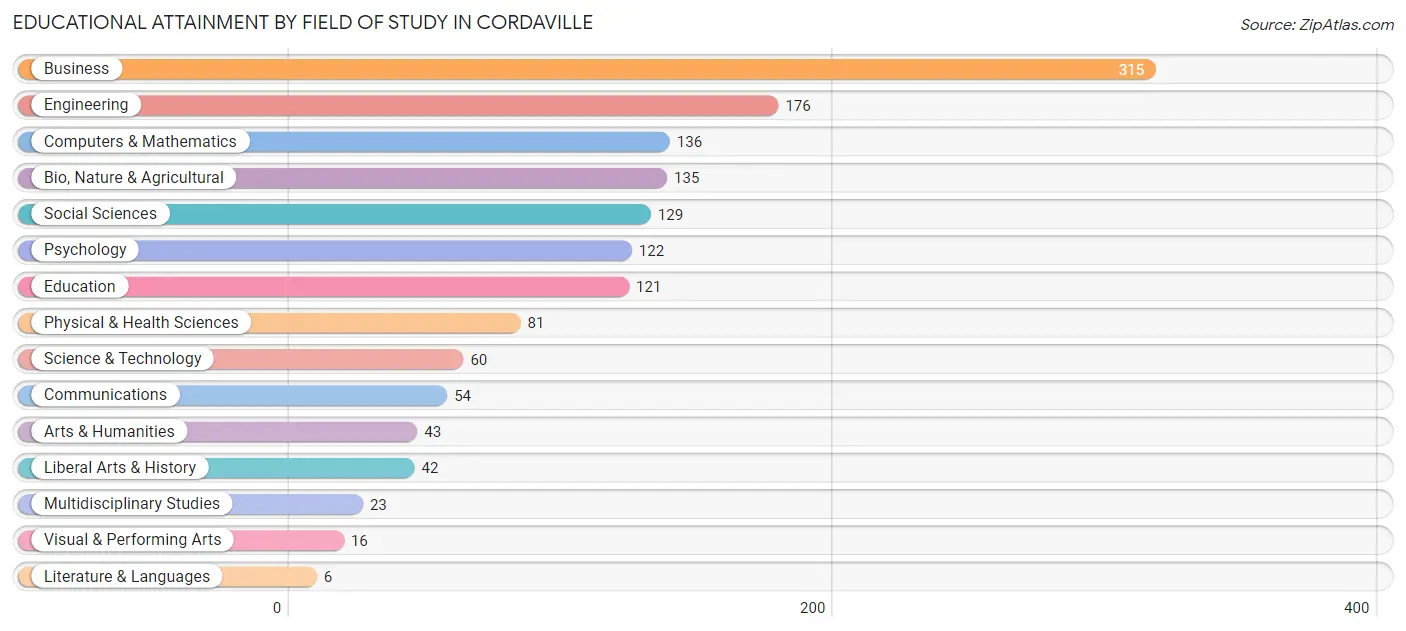
| Field of Study | # Graduates | % Graduates |
| Computers & Mathematics | 136 | 9.3% |
| Bio, Nature & Agricultural | 135 | 9.2% |
| Physical & Health Sciences | 81 | 5.6% |
| Psychology | 122 | 8.4% |
| Social Sciences | 129 | 8.8% |
| Engineering | 176 | 12.1% |
| Multidisciplinary Studies | 23 | 1.6% |
| Science & Technology | 60 | 4.1% |
| Business | 315 | 21.6% |
| Education | 121 | 8.3% |
| Literature & Languages | 6 | 0.4% |
| Liberal Arts & History | 42 | 2.9% |
| Visual & Performing Arts | 16 | 1.1% |
| Communications | 54 | 3.7% |
| Arts & Humanities | 43 | 2.9% |
| Total | 1,459 | 100.0% |
Transportation & Commute in Cordaville
Vehicle Availability by Sex in Cordaville
The most prevalent vehicle ownership categories in Cordaville are males with 2 vehicles (524, accounting for 63.7%) and females with 2 vehicles (460, making up 66.5%).
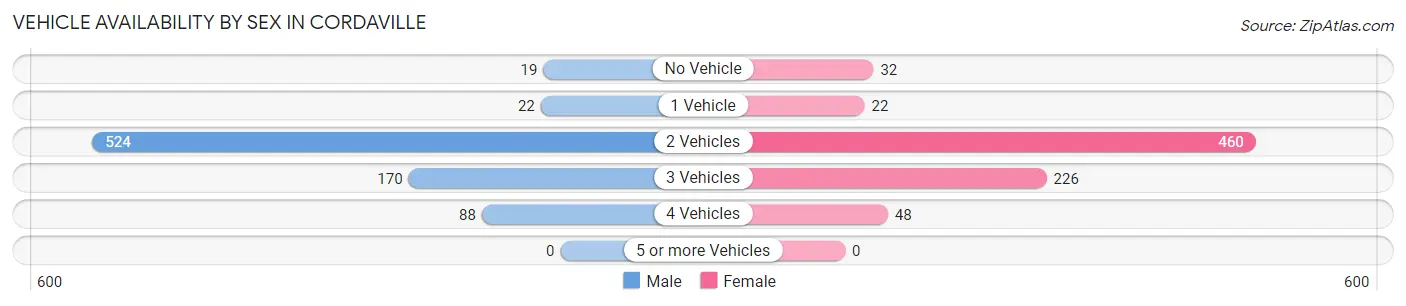
| Vehicles Available | Male | Female |
| No Vehicle | 19 (2.3%) | 32 (4.1%) |
| 1 Vehicle | 22 (2.7%) | 22 (2.8%) |
| 2 Vehicles | 524 (63.7%) | 460 (58.4%) |
| 3 Vehicles | 170 (20.7%) | 226 (28.7%) |
| 4 Vehicles | 88 (10.7%) | 48 (6.1%) |
| 5 or more Vehicles | 0 (0.0%) | 0 (0.0%) |
| Total | 823 (100.0%) | 788 (100.0%) |
Commute Time in Cordaville
The most frequently occuring commute durations in Cordaville are 15 to 19 minutes (226 commuters, 19.2%), 30 to 34 minutes (174 commuters, 14.8%), and 60 to 89 minutes (150 commuters, 12.8%).
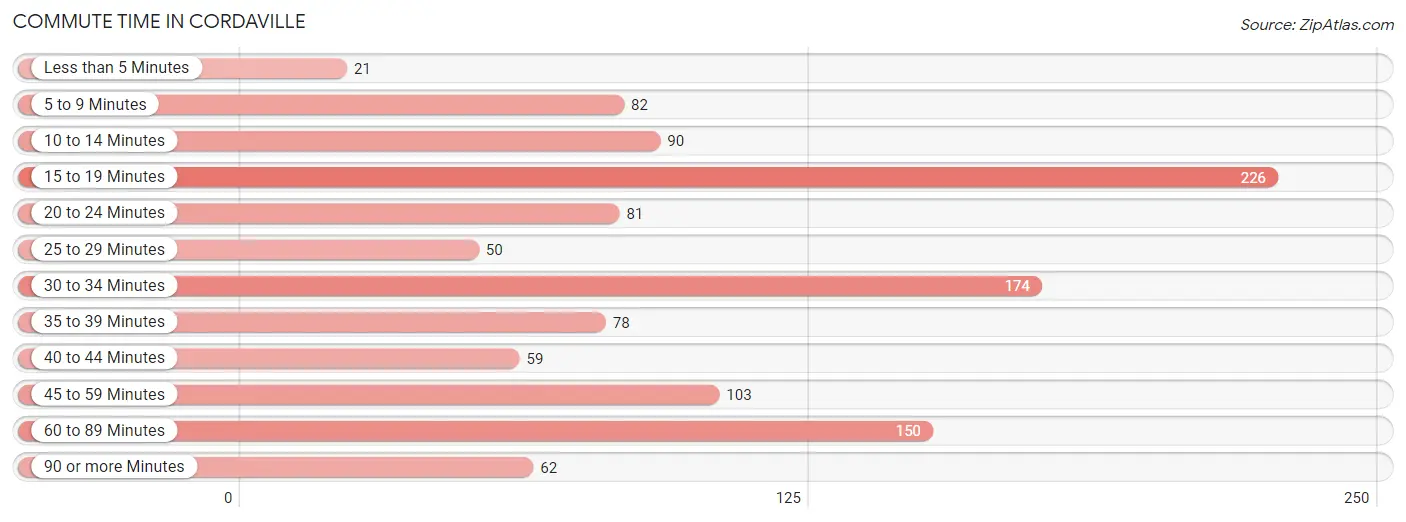
| Commute Time | # Commuters | % Commuters |
| Less than 5 Minutes | 21 | 1.8% |
| 5 to 9 Minutes | 82 | 7.0% |
| 10 to 14 Minutes | 90 | 7.6% |
| 15 to 19 Minutes | 226 | 19.2% |
| 20 to 24 Minutes | 81 | 6.9% |
| 25 to 29 Minutes | 50 | 4.3% |
| 30 to 34 Minutes | 174 | 14.8% |
| 35 to 39 Minutes | 78 | 6.6% |
| 40 to 44 Minutes | 59 | 5.0% |
| 45 to 59 Minutes | 103 | 8.8% |
| 60 to 89 Minutes | 150 | 12.8% |
| 90 or more Minutes | 62 | 5.3% |
Commute Time by Sex in Cordaville
The most common commute times in Cordaville are 60 to 89 minutes (108 commuters, 17.6%) for males and 15 to 19 minutes (138 commuters, 24.6%) for females.
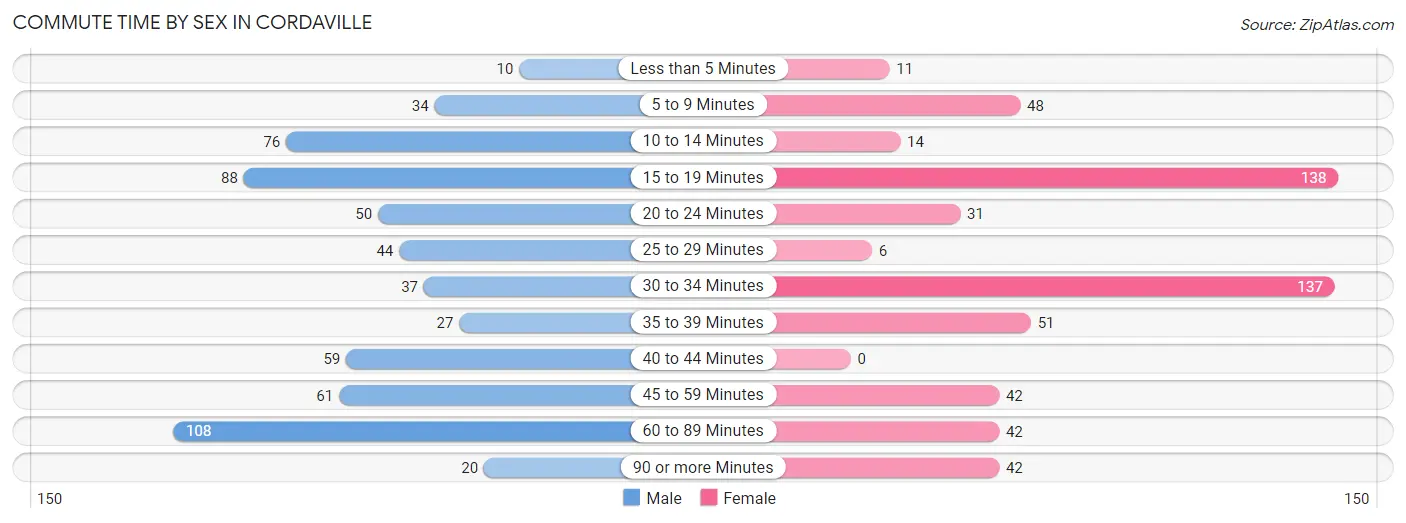
| Commute Time | Male | Female |
| Less than 5 Minutes | 10 (1.6%) | 11 (2.0%) |
| 5 to 9 Minutes | 34 (5.5%) | 48 (8.5%) |
| 10 to 14 Minutes | 76 (12.4%) | 14 (2.5%) |
| 15 to 19 Minutes | 88 (14.3%) | 138 (24.6%) |
| 20 to 24 Minutes | 50 (8.1%) | 31 (5.5%) |
| 25 to 29 Minutes | 44 (7.2%) | 6 (1.1%) |
| 30 to 34 Minutes | 37 (6.0%) | 137 (24.4%) |
| 35 to 39 Minutes | 27 (4.4%) | 51 (9.1%) |
| 40 to 44 Minutes | 59 (9.6%) | 0 (0.0%) |
| 45 to 59 Minutes | 61 (9.9%) | 42 (7.5%) |
| 60 to 89 Minutes | 108 (17.6%) | 42 (7.5%) |
| 90 or more Minutes | 20 (3.3%) | 42 (7.5%) |
Time of Departure to Work by Sex in Cordaville
The most frequent times of departure to work in Cordaville are 8:00 AM to 8:29 AM (139, 22.6%) for males and 7:00 AM to 7:29 AM (127, 22.6%) for females.
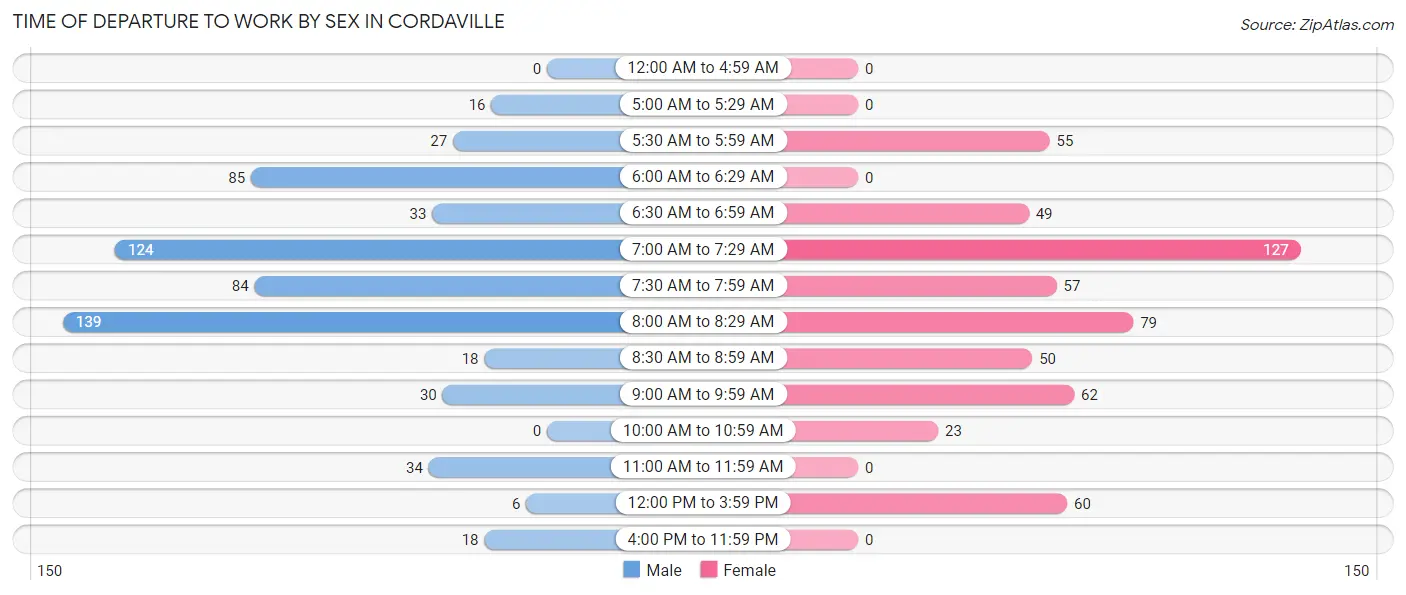
| Time of Departure | Male | Female |
| 12:00 AM to 4:59 AM | 0 (0.0%) | 0 (0.0%) |
| 5:00 AM to 5:29 AM | 16 (2.6%) | 0 (0.0%) |
| 5:30 AM to 5:59 AM | 27 (4.4%) | 55 (9.8%) |
| 6:00 AM to 6:29 AM | 85 (13.8%) | 0 (0.0%) |
| 6:30 AM to 6:59 AM | 33 (5.4%) | 49 (8.7%) |
| 7:00 AM to 7:29 AM | 124 (20.2%) | 127 (22.6%) |
| 7:30 AM to 7:59 AM | 84 (13.7%) | 57 (10.1%) |
| 8:00 AM to 8:29 AM | 139 (22.6%) | 79 (14.1%) |
| 8:30 AM to 8:59 AM | 18 (2.9%) | 50 (8.9%) |
| 9:00 AM to 9:59 AM | 30 (4.9%) | 62 (11.0%) |
| 10:00 AM to 10:59 AM | 0 (0.0%) | 23 (4.1%) |
| 11:00 AM to 11:59 AM | 34 (5.5%) | 0 (0.0%) |
| 12:00 PM to 3:59 PM | 6 (1.0%) | 60 (10.7%) |
| 4:00 PM to 11:59 PM | 18 (2.9%) | 0 (0.0%) |
| Total | 614 (100.0%) | 562 (100.0%) |
Housing Occupancy in Cordaville
Occupancy by Ownership in Cordaville
Of the total 955 dwellings in Cordaville, owner-occupied units account for 925 (96.9%), while renter-occupied units make up 30 (3.1%).
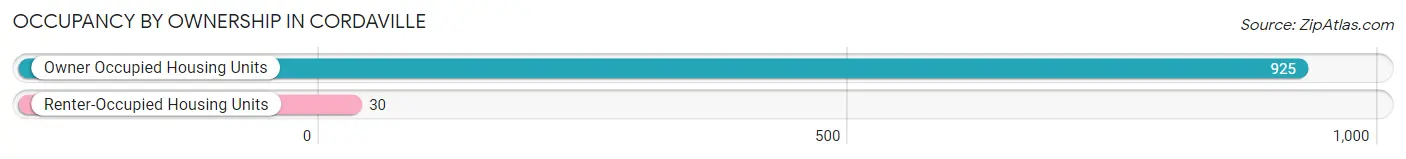
| Occupancy | # Housing Units | % Housing Units |
| Owner Occupied Housing Units | 925 | 96.9% |
| Renter-Occupied Housing Units | 30 | 3.1% |
| Total Occupied Housing Units | 955 | 100.0% |
Occupancy by Household Size in Cordaville
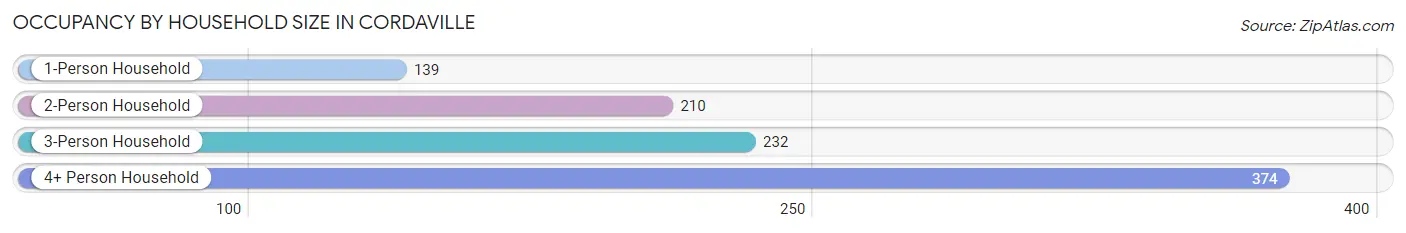
| Household Size | # Housing Units | % Housing Units |
| 1-Person Household | 139 | 14.5% |
| 2-Person Household | 210 | 22.0% |
| 3-Person Household | 232 | 24.3% |
| 4+ Person Household | 374 | 39.2% |
| Total Housing Units | 955 | 100.0% |
Occupancy by Ownership by Household Size in Cordaville
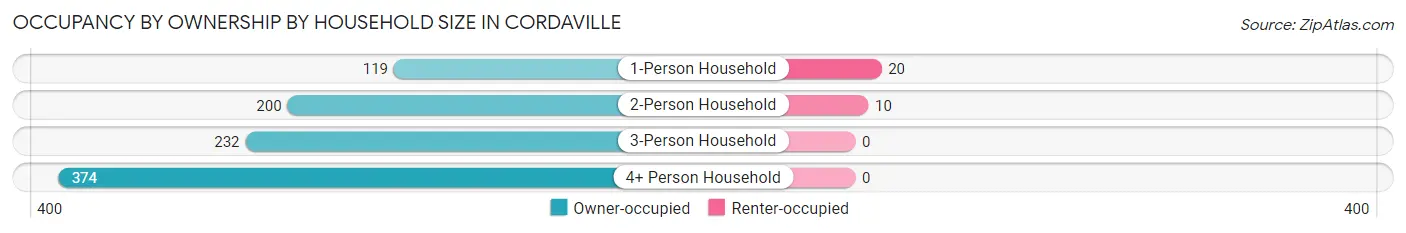
| Household Size | Owner-occupied | Renter-occupied |
| 1-Person Household | 119 (85.6%) | 20 (14.4%) |
| 2-Person Household | 200 (95.2%) | 10 (4.8%) |
| 3-Person Household | 232 (100.0%) | 0 (0.0%) |
| 4+ Person Household | 374 (100.0%) | 0 (0.0%) |
| Total Housing Units | 925 (96.9%) | 30 (3.1%) |
Occupancy by Educational Attainment in Cordaville
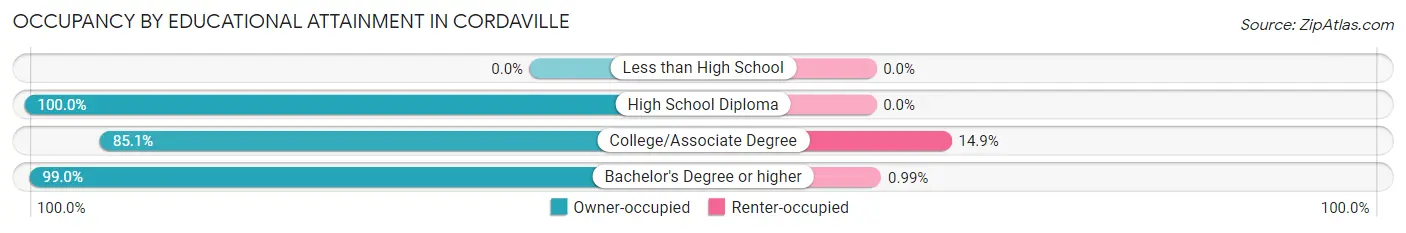
| Household Size | Owner-occupied | Renter-occupied |
| Less than High School | 0 (0.0%) | 0 (0.0%) |
| High School Diploma | 92 (100.0%) | 0 (0.0%) |
| College/Associate Degree | 131 (85.1%) | 23 (14.9%) |
| Bachelor's Degree or higher | 702 (99.0%) | 7 (1.0%) |
Occupancy by Age of Householder in Cordaville
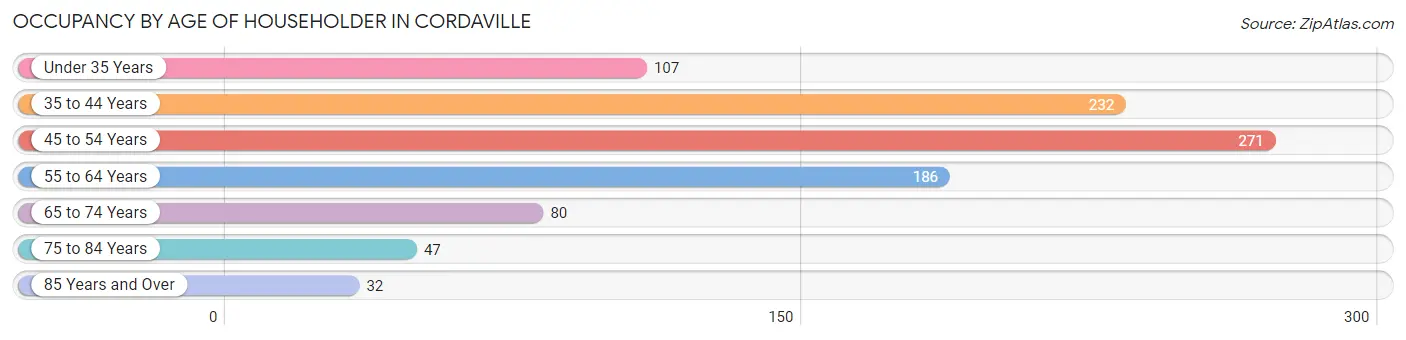
| Age Bracket | # Households | % Households |
| Under 35 Years | 107 | 11.2% |
| 35 to 44 Years | 232 | 24.3% |
| 45 to 54 Years | 271 | 28.4% |
| 55 to 64 Years | 186 | 19.5% |
| 65 to 74 Years | 80 | 8.4% |
| 75 to 84 Years | 47 | 4.9% |
| 85 Years and Over | 32 | 3.4% |
| Total | 955 | 100.0% |
Housing Finances in Cordaville
Median Income by Occupancy in Cordaville
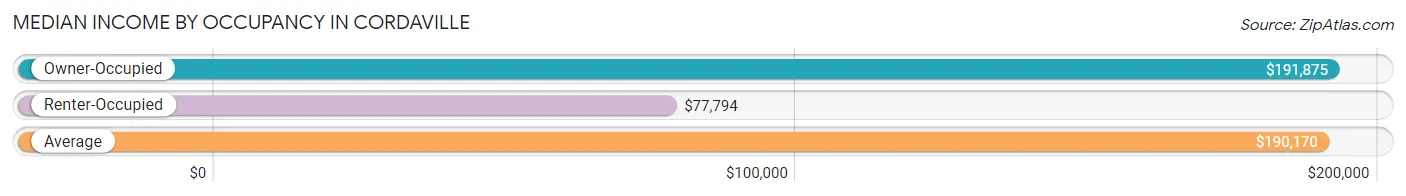
| Occupancy Type | # Households | Median Income |
| Owner-Occupied | 925 (96.9%) | $191,875 |
| Renter-Occupied | 30 (3.1%) | $77,794 |
| Average | 955 (100.0%) | $190,170 |
Occupancy by Householder Income Bracket in Cordaville
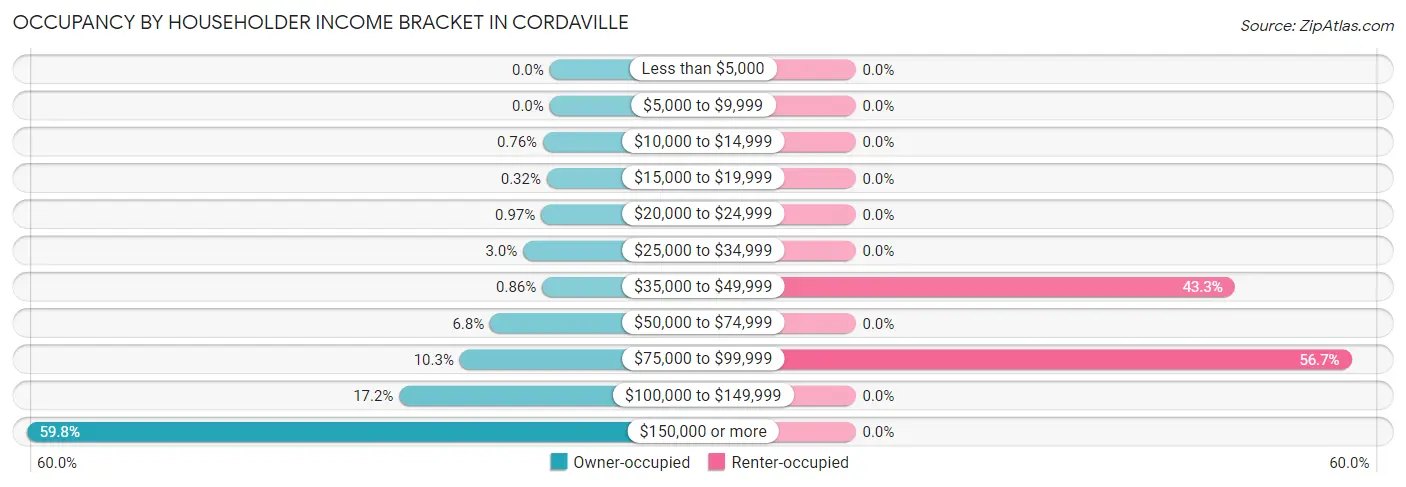
| Income Bracket | Owner-occupied | Renter-occupied |
| Less than $5,000 | 0 (0.0%) | 0 (0.0%) |
| $5,000 to $9,999 | 0 (0.0%) | 0 (0.0%) |
| $10,000 to $14,999 | 7 (0.8%) | 0 (0.0%) |
| $15,000 to $19,999 | 3 (0.3%) | 0 (0.0%) |
| $20,000 to $24,999 | 9 (1.0%) | 0 (0.0%) |
| $25,000 to $34,999 | 28 (3.0%) | 0 (0.0%) |
| $35,000 to $49,999 | 8 (0.9%) | 13 (43.3%) |
| $50,000 to $74,999 | 63 (6.8%) | 0 (0.0%) |
| $75,000 to $99,999 | 95 (10.3%) | 17 (56.7%) |
| $100,000 to $149,999 | 159 (17.2%) | 0 (0.0%) |
| $150,000 or more | 553 (59.8%) | 0 (0.0%) |
| Total | 925 (100.0%) | 30 (100.0%) |
Monthly Housing Cost Tiers in Cordaville
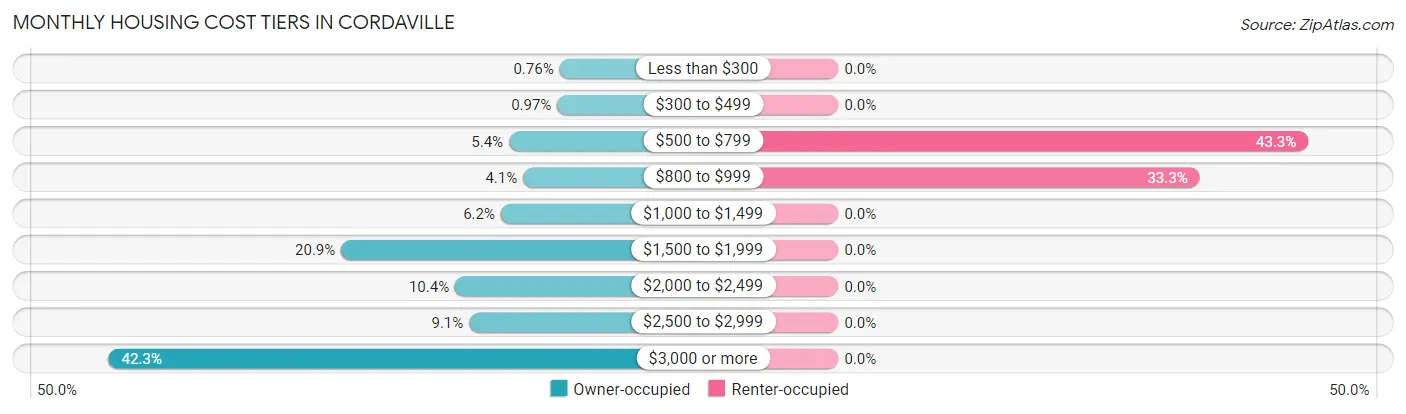
| Monthly Cost | Owner-occupied | Renter-occupied |
| Less than $300 | 7 (0.8%) | 0 (0.0%) |
| $300 to $499 | 9 (1.0%) | 0 (0.0%) |
| $500 to $799 | 50 (5.4%) | 13 (43.3%) |
| $800 to $999 | 38 (4.1%) | 10 (33.3%) |
| $1,000 to $1,499 | 57 (6.2%) | 0 (0.0%) |
| $1,500 to $1,999 | 193 (20.9%) | 0 (0.0%) |
| $2,000 to $2,499 | 96 (10.4%) | 0 (0.0%) |
| $2,500 to $2,999 | 84 (9.1%) | 0 (0.0%) |
| $3,000 or more | 391 (42.3%) | 0 (0.0%) |
| Total | 925 (100.0%) | 30 (100.0%) |
Physical Housing Characteristics in Cordaville
Housing Structures in Cordaville
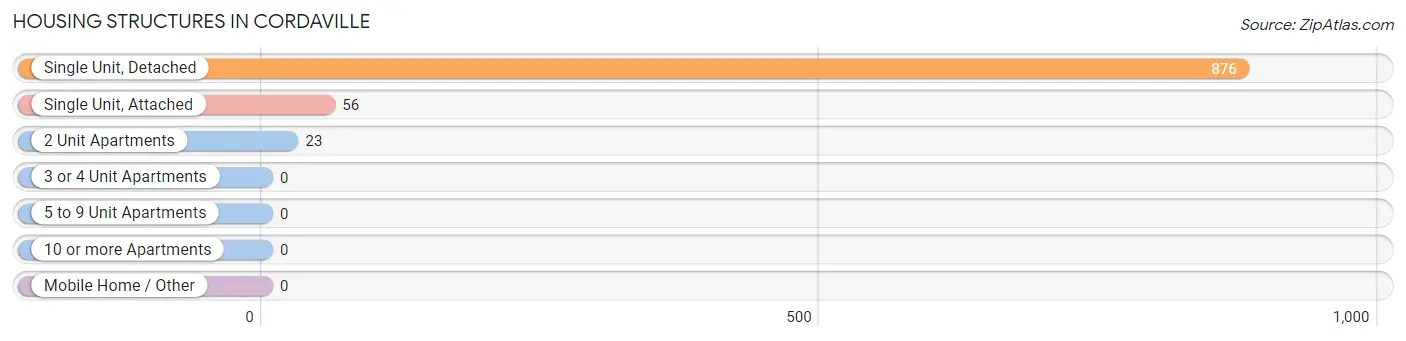
| Structure Type | # Housing Units | % Housing Units |
| Single Unit, Detached | 876 | 91.7% |
| Single Unit, Attached | 56 | 5.9% |
| 2 Unit Apartments | 23 | 2.4% |
| 3 or 4 Unit Apartments | 0 | 0.0% |
| 5 to 9 Unit Apartments | 0 | 0.0% |
| 10 or more Apartments | 0 | 0.0% |
| Mobile Home / Other | 0 | 0.0% |
| Total | 955 | 100.0% |
Housing Structures by Occupancy in Cordaville
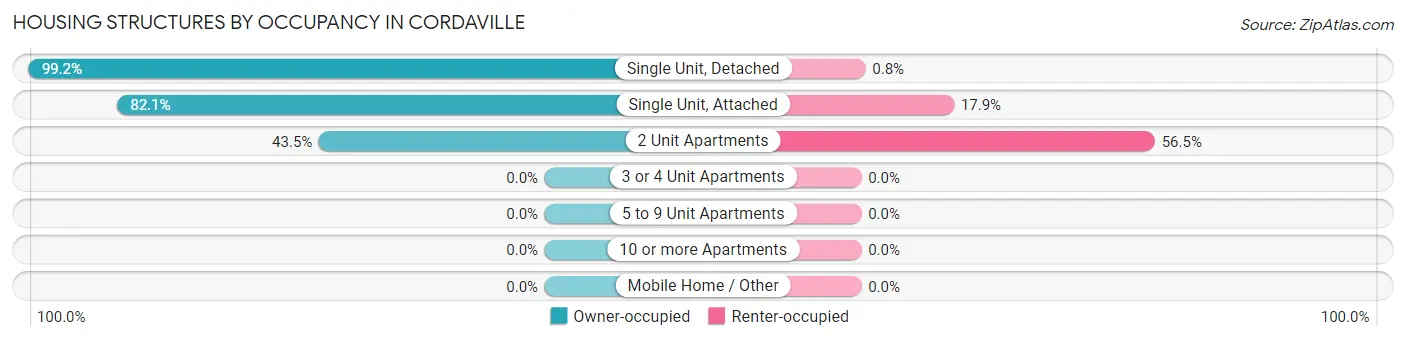
| Structure Type | Owner-occupied | Renter-occupied |
| Single Unit, Detached | 869 (99.2%) | 7 (0.8%) |
| Single Unit, Attached | 46 (82.1%) | 10 (17.9%) |
| 2 Unit Apartments | 10 (43.5%) | 13 (56.5%) |
| 3 or 4 Unit Apartments | 0 (0.0%) | 0 (0.0%) |
| 5 to 9 Unit Apartments | 0 (0.0%) | 0 (0.0%) |
| 10 or more Apartments | 0 (0.0%) | 0 (0.0%) |
| Mobile Home / Other | 0 (0.0%) | 0 (0.0%) |
| Total | 925 (96.9%) | 30 (3.1%) |
Housing Structures by Number of Rooms in Cordaville
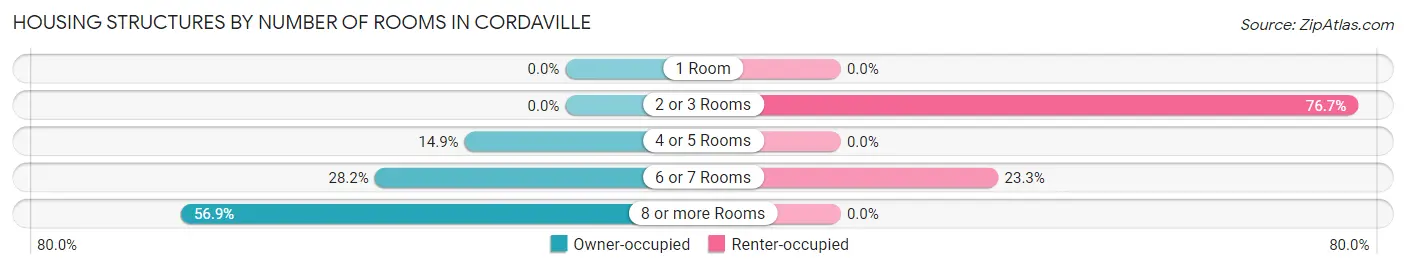
| Number of Rooms | Owner-occupied | Renter-occupied |
| 1 Room | 0 (0.0%) | 0 (0.0%) |
| 2 or 3 Rooms | 0 (0.0%) | 23 (76.7%) |
| 4 or 5 Rooms | 138 (14.9%) | 0 (0.0%) |
| 6 or 7 Rooms | 261 (28.2%) | 7 (23.3%) |
| 8 or more Rooms | 526 (56.9%) | 0 (0.0%) |
| Total | 925 (100.0%) | 30 (100.0%) |
Housing Structure by Heating Type in Cordaville
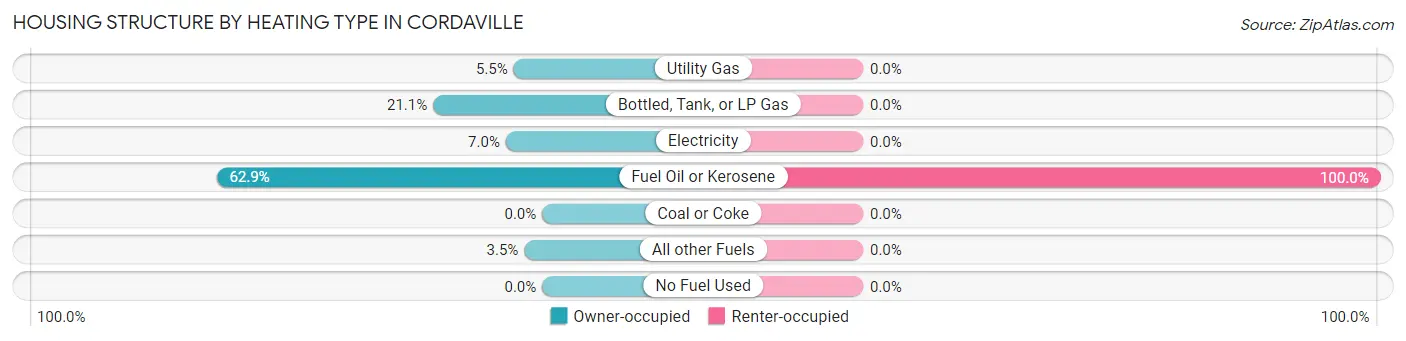
| Heating Type | Owner-occupied | Renter-occupied |
| Utility Gas | 51 (5.5%) | 0 (0.0%) |
| Bottled, Tank, or LP Gas | 195 (21.1%) | 0 (0.0%) |
| Electricity | 65 (7.0%) | 0 (0.0%) |
| Fuel Oil or Kerosene | 582 (62.9%) | 30 (100.0%) |
| Coal or Coke | 0 (0.0%) | 0 (0.0%) |
| All other Fuels | 32 (3.5%) | 0 (0.0%) |
| No Fuel Used | 0 (0.0%) | 0 (0.0%) |
| Total | 925 (100.0%) | 30 (100.0%) |
Household Vehicle Usage in Cordaville
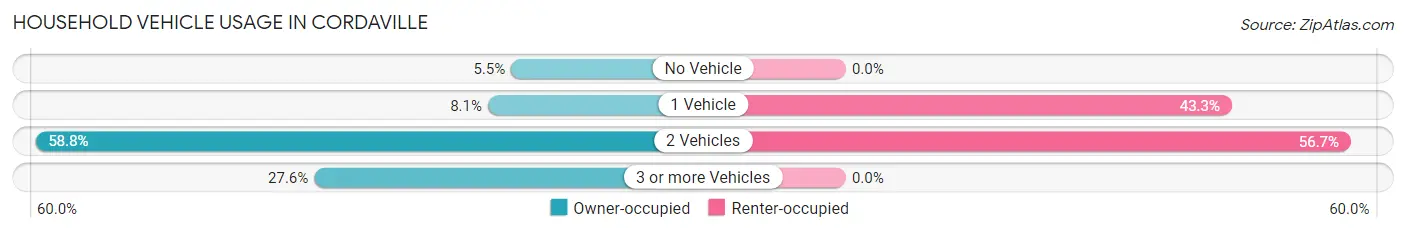
| Vehicles per Household | Owner-occupied | Renter-occupied |
| No Vehicle | 51 (5.5%) | 0 (0.0%) |
| 1 Vehicle | 75 (8.1%) | 13 (43.3%) |
| 2 Vehicles | 544 (58.8%) | 17 (56.7%) |
| 3 or more Vehicles | 255 (27.6%) | 0 (0.0%) |
| Total | 925 (100.0%) | 30 (100.0%) |
Real Estate & Mortgages in Cordaville
Real Estate and Mortgage Overview in Cordaville
| Characteristic | Without Mortgage | With Mortgage |
| Housing Units | 292 | 633 |
| Median Property Value | $633,200 | $754,500 |
| Median Household Income | $106,786 | $440 |
| Monthly Housing Costs | $1,383 | $391 |
| Real Estate Taxes | $10,001 | $0 |
Property Value by Mortgage Status in Cordaville
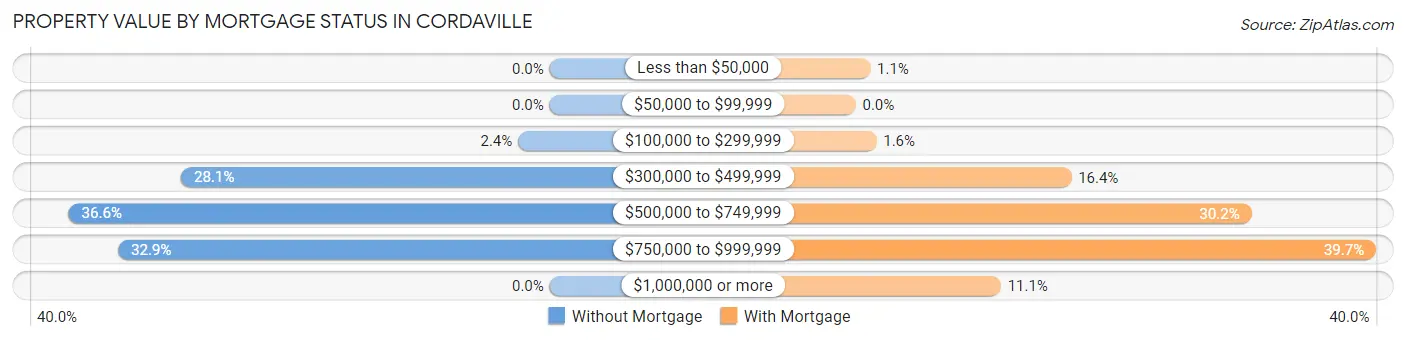
| Property Value | Without Mortgage | With Mortgage |
| Less than $50,000 | 0 (0.0%) | 7 (1.1%) |
| $50,000 to $99,999 | 0 (0.0%) | 0 (0.0%) |
| $100,000 to $299,999 | 7 (2.4%) | 10 (1.6%) |
| $300,000 to $499,999 | 82 (28.1%) | 104 (16.4%) |
| $500,000 to $749,999 | 107 (36.6%) | 191 (30.2%) |
| $750,000 to $999,999 | 96 (32.9%) | 251 (39.7%) |
| $1,000,000 or more | 0 (0.0%) | 70 (11.1%) |
| Total | 292 (100.0%) | 633 (100.0%) |
Household Income by Mortgage Status in Cordaville
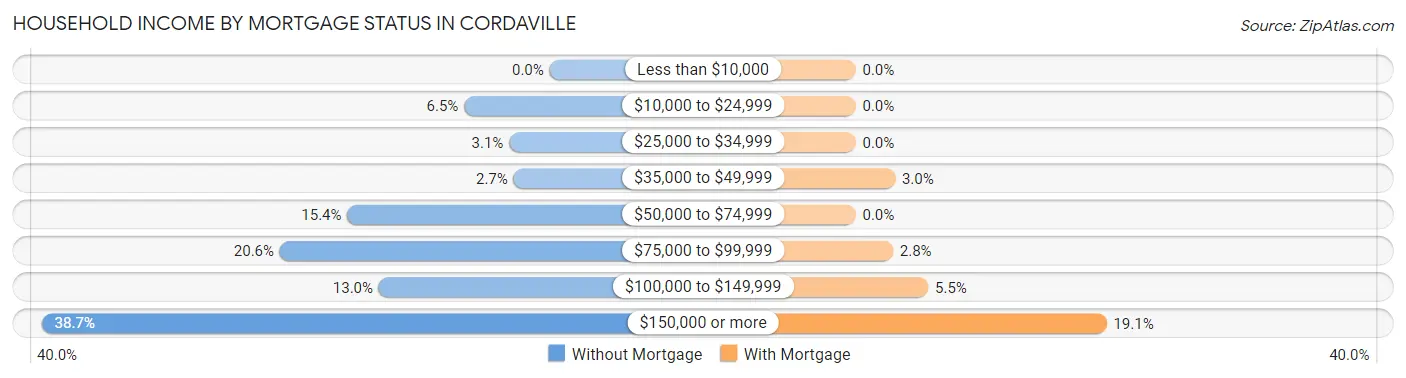
| Household Income | Without Mortgage | With Mortgage |
| Less than $10,000 | 0 (0.0%) | 0 (0.0%) |
| $10,000 to $24,999 | 19 (6.5%) | 0 (0.0%) |
| $25,000 to $34,999 | 9 (3.1%) | 0 (0.0%) |
| $35,000 to $49,999 | 8 (2.7%) | 19 (3.0%) |
| $50,000 to $74,999 | 45 (15.4%) | 0 (0.0%) |
| $75,000 to $99,999 | 60 (20.5%) | 18 (2.8%) |
| $100,000 to $149,999 | 38 (13.0%) | 35 (5.5%) |
| $150,000 or more | 113 (38.7%) | 121 (19.1%) |
| Total | 292 (100.0%) | 633 (100.0%) |
Property Value to Household Income Ratio in Cordaville
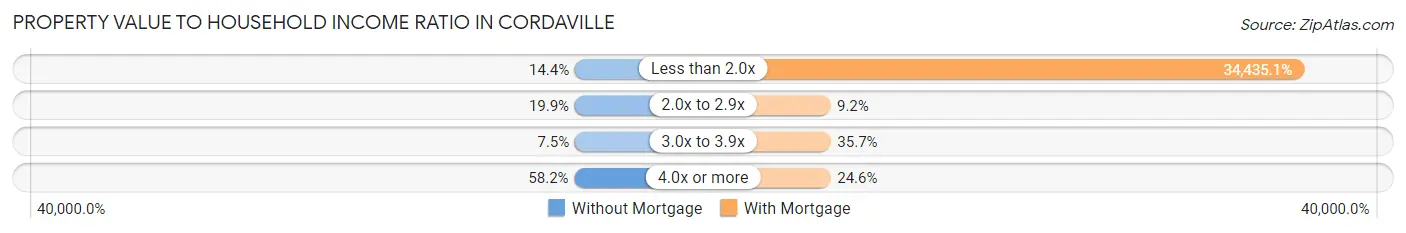
| Value-to-Income Ratio | Without Mortgage | With Mortgage |
| Less than 2.0x | 42 (14.4%) | 217,974 (34,435.1%) |
| 2.0x to 2.9x | 58 (19.9%) | 58 (9.2%) |
| 3.0x to 3.9x | 22 (7.5%) | 226 (35.7%) |
| 4.0x or more | 170 (58.2%) | 156 (24.6%) |
| Total | 292 (100.0%) | 633 (100.0%) |
Real Estate Taxes by Mortgage Status in Cordaville
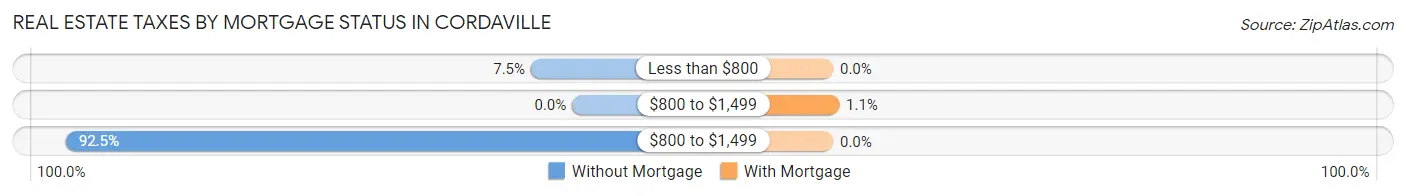
| Property Taxes | Without Mortgage | With Mortgage |
| Less than $800 | 22 (7.5%) | 0 (0.0%) |
| $800 to $1,499 | 0 (0.0%) | 7 (1.1%) |
| $800 to $1,499 | 270 (92.5%) | 0 (0.0%) |
| Total | 292 (100.0%) | 633 (100.0%) |
Health & Disability in Cordaville
Health Insurance Coverage by Age in Cordaville
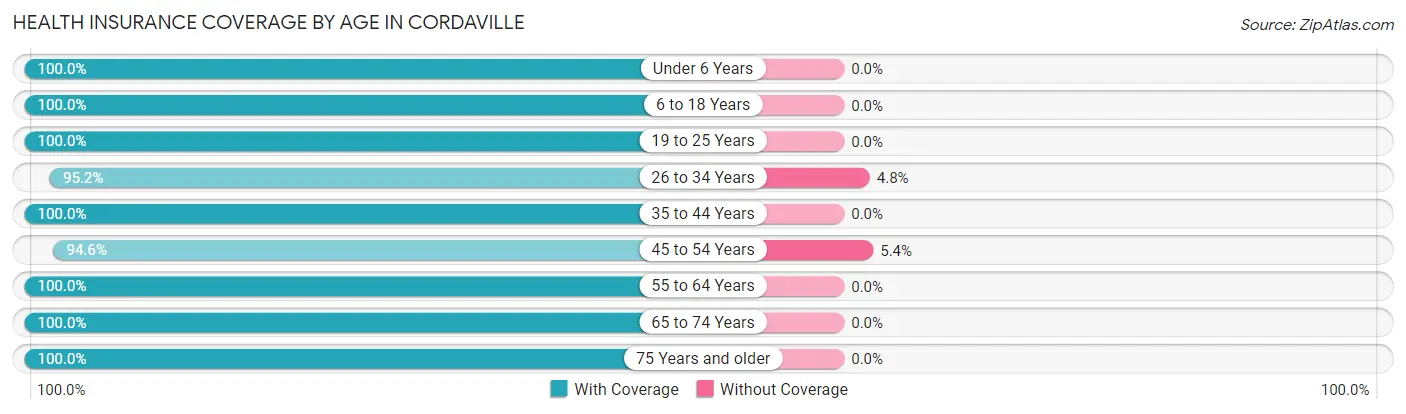
| Age Bracket | With Coverage | Without Coverage |
| Under 6 Years | 230 (100.0%) | 0 (0.0%) |
| 6 to 18 Years | 705 (100.0%) | 0 (0.0%) |
| 19 to 25 Years | 145 (100.0%) | 0 (0.0%) |
| 26 to 34 Years | 240 (95.2%) | 12 (4.8%) |
| 35 to 44 Years | 460 (100.0%) | 0 (0.0%) |
| 45 to 54 Years | 490 (94.6%) | 28 (5.4%) |
| 55 to 64 Years | 355 (100.0%) | 0 (0.0%) |
| 65 to 74 Years | 105 (100.0%) | 0 (0.0%) |
| 75 Years and older | 114 (100.0%) | 0 (0.0%) |
| Total | 2,844 (98.6%) | 40 (1.4%) |
Health Insurance Coverage by Citizenship Status in Cordaville
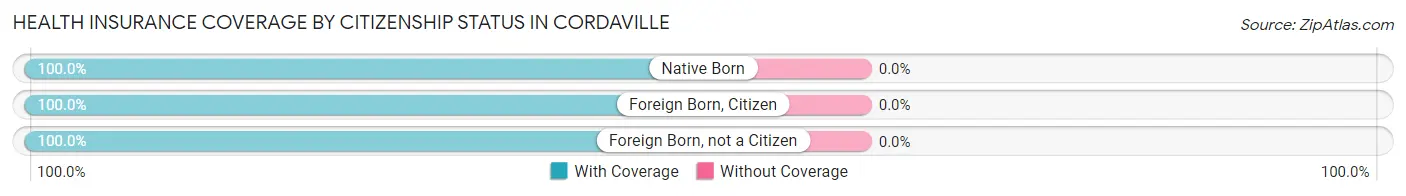
| Citizenship Status | With Coverage | Without Coverage |
| Native Born | 230 (100.0%) | 0 (0.0%) |
| Foreign Born, Citizen | 705 (100.0%) | 0 (0.0%) |
| Foreign Born, not a Citizen | 145 (100.0%) | 0 (0.0%) |
Health Insurance Coverage by Household Income in Cordaville
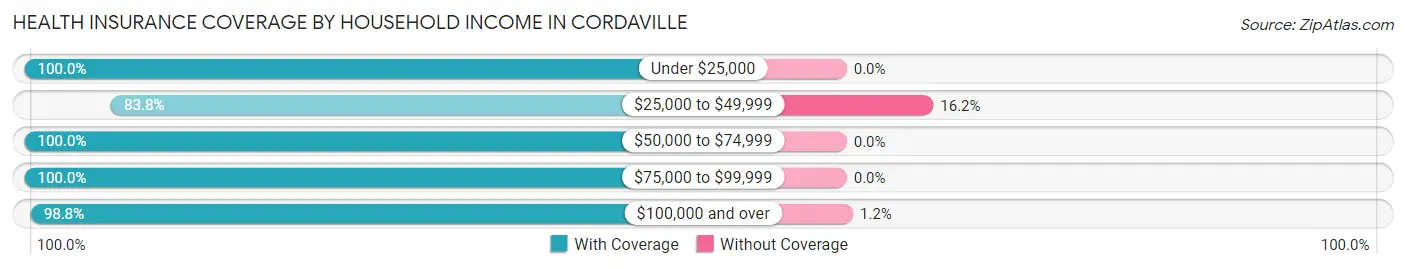
| Household Income | With Coverage | Without Coverage |
| Under $25,000 | 30 (100.0%) | 0 (0.0%) |
| $25,000 to $49,999 | 62 (83.8%) | 12 (16.2%) |
| $50,000 to $74,999 | 85 (100.0%) | 0 (0.0%) |
| $75,000 to $99,999 | 309 (100.0%) | 0 (0.0%) |
| $100,000 and over | 2,352 (98.8%) | 28 (1.2%) |
Public vs Private Health Insurance Coverage by Age in Cordaville
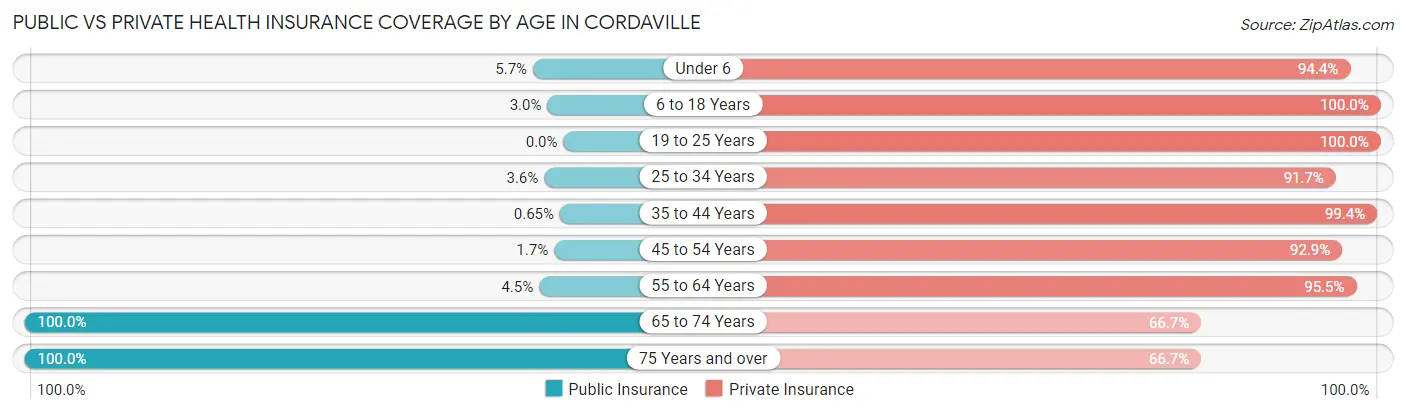
| Age Bracket | Public Insurance | Private Insurance |
| Under 6 | 13 (5.7%) | 217 (94.4%) |
| 6 to 18 Years | 21 (3.0%) | 705 (100.0%) |
| 19 to 25 Years | 0 (0.0%) | 145 (100.0%) |
| 25 to 34 Years | 9 (3.6%) | 231 (91.7%) |
| 35 to 44 Years | 3 (0.6%) | 457 (99.4%) |
| 45 to 54 Years | 9 (1.7%) | 481 (92.9%) |
| 55 to 64 Years | 16 (4.5%) | 339 (95.5%) |
| 65 to 74 Years | 105 (100.0%) | 70 (66.7%) |
| 75 Years and over | 114 (100.0%) | 76 (66.7%) |
| Total | 290 (10.1%) | 2,721 (94.4%) |
Disability Status by Sex by Age in Cordaville
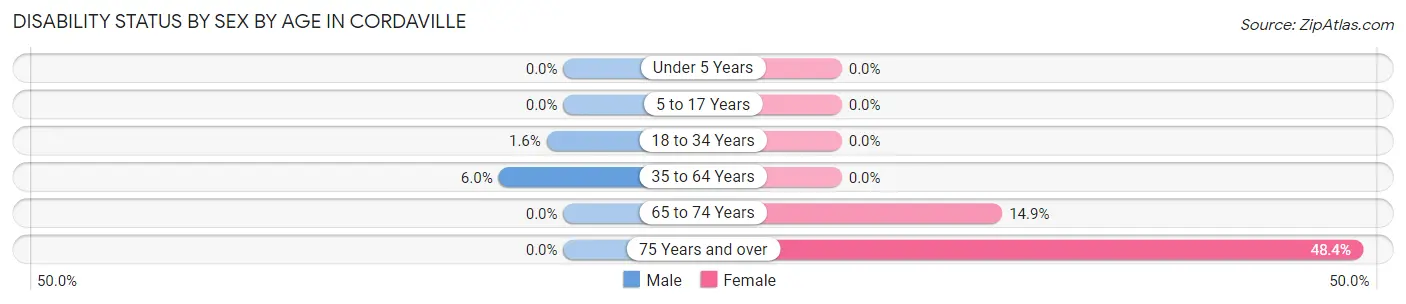
| Age Bracket | Male | Female |
| Under 5 Years | 0 (0.0%) | 0 (0.0%) |
| 5 to 17 Years | 0 (0.0%) | 0 (0.0%) |
| 18 to 34 Years | 3 (1.5%) | 0 (0.0%) |
| 35 to 64 Years | 42 (6.0%) | 0 (0.0%) |
| 65 to 74 Years | 0 (0.0%) | 7 (14.9%) |
| 75 Years and over | 0 (0.0%) | 44 (48.3%) |
Disability Class by Sex by Age in Cordaville
Disability Class: Hearing Difficulty
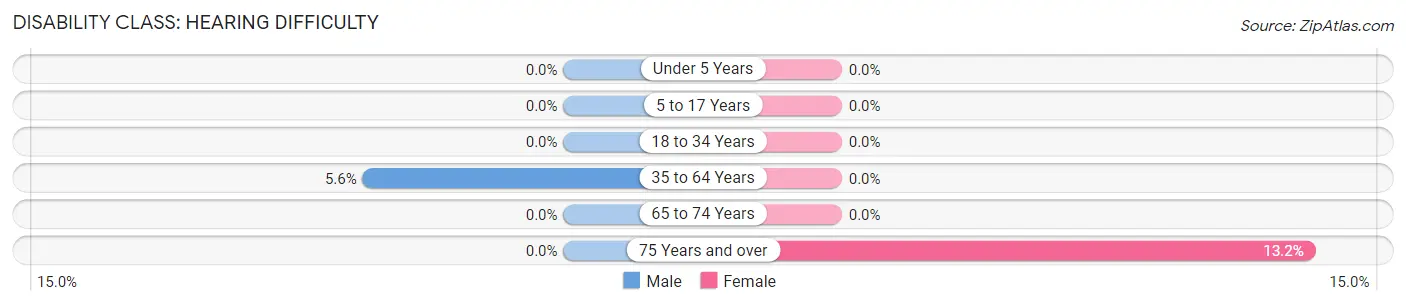
| Age Bracket | Male | Female |
| Under 5 Years | 0 (0.0%) | 0 (0.0%) |
| 5 to 17 Years | 0 (0.0%) | 0 (0.0%) |
| 18 to 34 Years | 0 (0.0%) | 0 (0.0%) |
| 35 to 64 Years | 39 (5.6%) | 0 (0.0%) |
| 65 to 74 Years | 0 (0.0%) | 0 (0.0%) |
| 75 Years and over | 0 (0.0%) | 12 (13.2%) |
Disability Class: Vision Difficulty
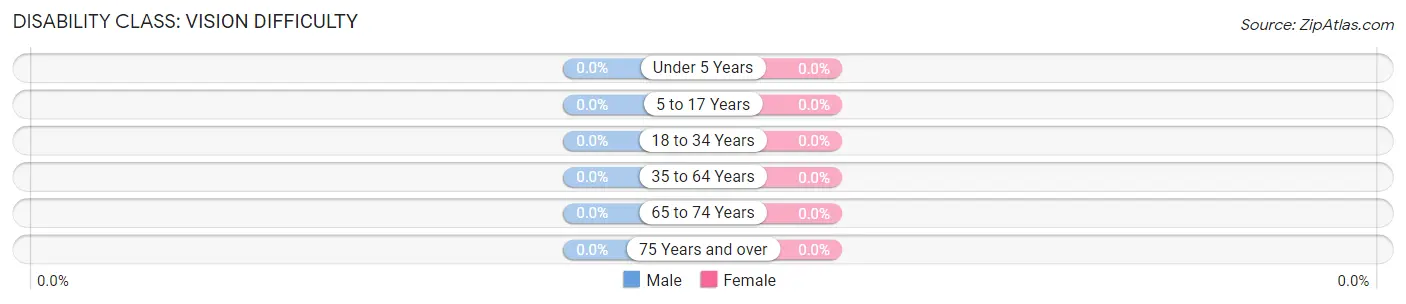
| Age Bracket | Male | Female |
| Under 5 Years | 0 (0.0%) | 0 (0.0%) |
| 5 to 17 Years | 0 (0.0%) | 0 (0.0%) |
| 18 to 34 Years | 0 (0.0%) | 0 (0.0%) |
| 35 to 64 Years | 0 (0.0%) | 0 (0.0%) |
| 65 to 74 Years | 0 (0.0%) | 0 (0.0%) |
| 75 Years and over | 0 (0.0%) | 0 (0.0%) |
Disability Class: Cognitive Difficulty
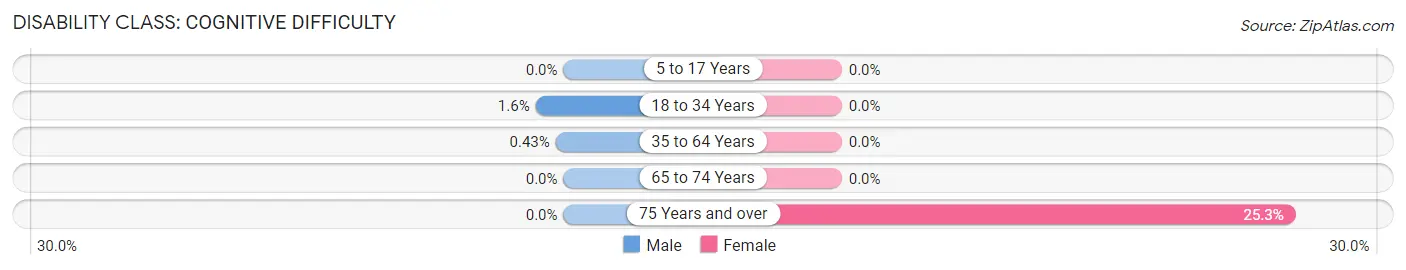
| Age Bracket | Male | Female |
| 5 to 17 Years | 0 (0.0%) | 0 (0.0%) |
| 18 to 34 Years | 3 (1.5%) | 0 (0.0%) |
| 35 to 64 Years | 3 (0.4%) | 0 (0.0%) |
| 65 to 74 Years | 0 (0.0%) | 0 (0.0%) |
| 75 Years and over | 0 (0.0%) | 23 (25.3%) |
Disability Class: Ambulatory Difficulty
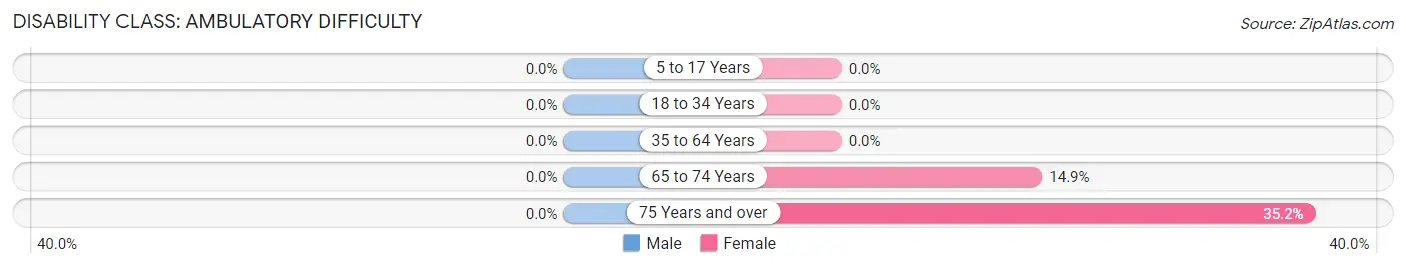
| Age Bracket | Male | Female |
| 5 to 17 Years | 0 (0.0%) | 0 (0.0%) |
| 18 to 34 Years | 0 (0.0%) | 0 (0.0%) |
| 35 to 64 Years | 0 (0.0%) | 0 (0.0%) |
| 65 to 74 Years | 0 (0.0%) | 7 (14.9%) |
| 75 Years and over | 0 (0.0%) | 32 (35.2%) |
Disability Class: Self-Care Difficulty
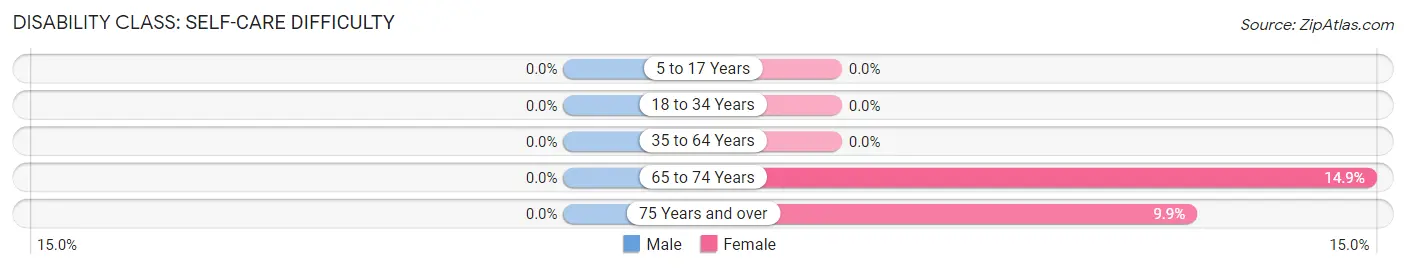
| Age Bracket | Male | Female |
| 5 to 17 Years | 0 (0.0%) | 0 (0.0%) |
| 18 to 34 Years | 0 (0.0%) | 0 (0.0%) |
| 35 to 64 Years | 0 (0.0%) | 0 (0.0%) |
| 65 to 74 Years | 0 (0.0%) | 7 (14.9%) |
| 75 Years and over | 0 (0.0%) | 9 (9.9%) |
Technology Access in Cordaville
Computing Device Access in Cordaville
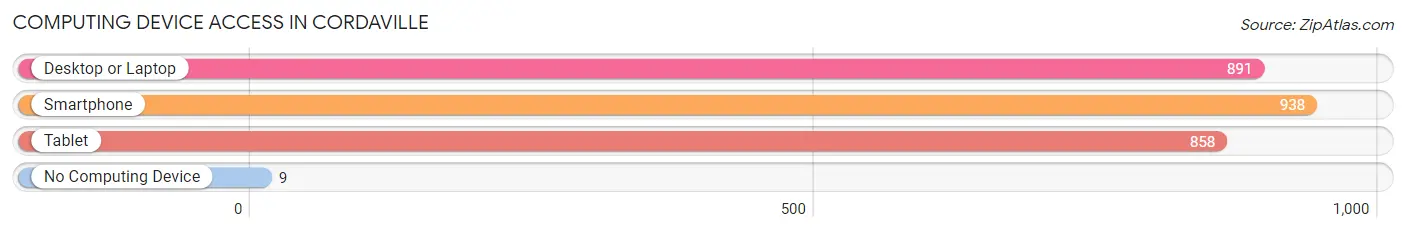
| Device Type | # Households | % Households |
| Desktop or Laptop | 891 | 93.3% |
| Smartphone | 938 | 98.2% |
| Tablet | 858 | 89.8% |
| No Computing Device | 9 | 0.9% |
| Total | 955 | 100.0% |
Internet Access in Cordaville
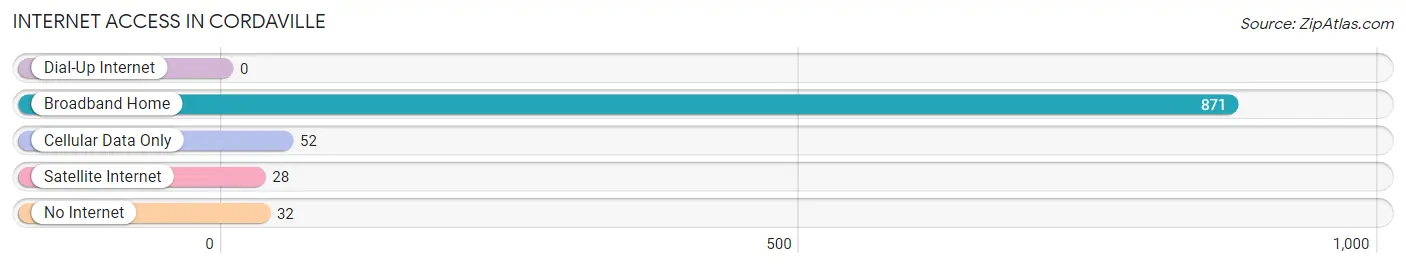
| Internet Type | # Households | % Households |
| Dial-Up Internet | 0 | 0.0% |
| Broadband Home | 871 | 91.2% |
| Cellular Data Only | 52 | 5.4% |
| Satellite Internet | 28 | 2.9% |
| No Internet | 32 | 3.4% |
| Total | 955 | 100.0% |
Cordaville Summary
Cordaville is a small town located in the state of Massachusetts, in the United States. It is situated in the north-central part of the state, in Worcester County, and is part of the MetroWest region. The town has a population of approximately 4,000 people, and is located about 25 miles west of Boston.
History
Cordaville was first settled in 1717 by a group of settlers from Marlborough, Massachusetts. The town was originally known as “Cordaville Plantation”, and was incorporated in 1775. The town was named after the Cordaville family, who were among the first settlers.
The town was primarily an agricultural community for much of its history, with the main crops being corn, potatoes, and hay. In the late 19th century, the town began to develop into a manufacturing center, with several factories being built in the area. These factories included a paper mill, a shoe factory, and a woolen mill.
Geography
Cordaville is located in the north-central part of Massachusetts, in Worcester County. It is situated on the banks of the Assabet River, and is part of the MetroWest region. The town is bordered by the towns of Marlborough, Southborough, and Westborough.
The town has a total area of 8.2 square miles, of which 8.1 square miles is land and 0.1 square miles is water. The town is located in a hilly region, with the highest point being the summit of Mount Wachusett, which is located in the nearby town of Princeton.
Economy
Cordaville’s economy is primarily based on manufacturing and services. The town is home to several factories, including a paper mill, a shoe factory, and a woolen mill. The town also has several retail stores, restaurants, and other businesses.
The town is also home to several technology companies, including a software development firm and a medical device manufacturer. The town is also home to a number of educational institutions, including a community college and a technical school.
Demographics
As of the 2010 census, the population of Cordaville was 4,039. The racial makeup of the town was 94.3% White, 1.3% African American, 0.3% Native American, 1.2% Asian, 0.1% Pacific Islander, 1.2% from other races, and 1.7% from two or more races. Hispanic or Latino of any race were 3.2% of the population.
The median income for a household in the town was $68,750, and the median income for a family was $77,917. The per capita income for the town was $30,945. About 4.3% of families and 5.7% of the population were below the poverty line, including 6.3% of those under age 18 and 4.2% of those age 65 or over.
Cordaville is a small town with a rich history and a diverse economy. The town is home to several factories, technology companies, and educational institutions, and has a population of approximately 4,000 people. The town has a median income of $68,750, and a per capita income of $30,945. The town is located in a hilly region, and is bordered by the towns of Marlborough, Southborough, and Westborough.
Common Questions
What is Per Capita Income in Cordaville?
Per Capita income in Cordaville is $69,272.
What is the Median Family Income in Cordaville?
Median Family Income in Cordaville is $218,362.
What is the Median Household income in Cordaville?
Median Household Income in Cordaville is $190,170.
What is Income or Wage Gap in Cordaville?
Income or Wage Gap in Cordaville is 54.7%.
Women in Cordaville earn 45.3 cents for every dollar earned by a man.
What is Inequality or Gini Index in Cordaville?
Inequality or Gini Index in Cordaville is 0.36.
What is the Total Population of Cordaville?
Total Population of Cordaville is 2,884.
What is the Total Male Population of Cordaville?
Total Male Population of Cordaville is 1,326.
What is the Total Female Population of Cordaville?
Total Female Population of Cordaville is 1,558.
What is the Ratio of Males per 100 Females in Cordaville?
There are 85.11 Males per 100 Females in Cordaville.
What is the Ratio of Females per 100 Males in Cordaville?
There are 117.50 Females per 100 Males in Cordaville.
What is the Median Population Age in Cordaville?
Median Population Age in Cordaville is 39.0 Years.
What is the Average Family Size in Cordaville
Average Family Size in Cordaville is 3.4 People.
What is the Average Household Size in Cordaville
Average Household Size in Cordaville is 3.0 People.
How Large is the Labor Force in Cordaville?
There are 1,674 People in the Labor Forcein in Cordaville.
What is the Percentage of People in the Labor Force in Cordaville?
78.8% of People are in the Labor Force in Cordaville.
What is the Unemployment Rate in Cordaville?
Unemployment Rate in Cordaville is 2.7%.